
 Submit a Paper
 Propose a Special lssue
 Open Access
ARTICLE

EuSHT Acts as a Hub Gene Involved in the Biosynthesis of 6-Hydroxyluteolin and Quercetin Induced by Salt Stress in Eucommia ulmoides
1 College of Food and Bioengineering, Henan University of Science and Technology, Luoyang, 471023, China
2 Henan Engineering Research Center of Food Microbiology, Luoyang, 471023, China
3 National Demonstration Center for Experimental Food Processing and Safety Education, Luoyang, 471000, China
* Corresponding Author: Xin Li. Email:
(This article belongs to the Special Issue: Abiotic Stress Impacts on Plant Physiology and Their Alleviation)
Phyton-International Journal of Experimental Botany 2024, 93(8), 2095-2113. https://doi.org/10.32604/phyton.2024.054231
Received 22 May 2024; Accepted 30 July 2024; Issue published 30 August 2024
 View Full Text
 Download PDF
Abstract
Salt stress inhibits plant growth and affects the biosynthesis of its secondary metabolites. Flavonoids are natural compounds that possess many important biological activities, playing a significant role in the medicinal activity of Eucommia ulmoides (E. ulmoides). To investigate the mechanism by which salt stress affects the biosynthesis of flavonoids in E. ulmoides, a comprehensive analysis of metabolomics and transcriptomics was conducted. The results indicated that salt stress led to the wilting and darkening of E. ulmoides leaves, accompanied by a decrease in chlorophyll levels, and significantly induced malondialdehyde (MDA) and relative electrical conductivity. During salt stress, most metabolites in the flavonoid biosynthesis pathway of E. ulmoides were upregulated, indicating that flavonoid biosynthesis is likely the main induced pathway under salt stress. Among them, secondary metabolites such as 6-Hydroxyluteolin and Quercetin are likely key metabolites induced by salt stress. The correlation analysis of transcriptomics and metabolomics revealed that EuSHT is a hub gene induced by salt stress, promoting the production of flavonoids such as 6-Hydroxyluteolin. The co-expression network showed a strong positive correlation between EuSHT and the biosynthesis of 6-Hydroxyluteolin and Quercetin, while it exhibited a negative correlation with Catechin biosynthesis. The branches leading to Luteolin and Dihydroquercetin are likely the main pathways for flavonoid compound biosynthesis in the plant stress response during salt stress. The results of this study provided a preliminary mechanism of secondary metabolites such as flavonoids in the medicinal plant E. ulmoides induced by salt stress and provided new theoretical support for discussing the mechanism of plant stress response. It also provided useful information for subsequent exploration of resistance genes in E. ulmoides.Keywords
During the growth and development of plants, they are easily influenced by abiotic stress, with salt stress being one of the most common in agriculture. It restricts normal plant growth, reducing crop yields [1]. Increasing soil salinity can decrease the ability of plants to absorb water. Once plants absorb a large amount of sodium and chloride ions through their roots, it can negatively impact their growth and development by damaging metabolic processes and reducing photosynthetic efficiency [2].
Current research indicates that flavonoids are a type of polyphenolic compound produced as secondary metabolites in plants, widely present in vegetables, fruits, and various plant species. Currently, the flavonoid biosynthetic pathway, as a crucial route for plant secondary metabolites, has received widespread research attention [3]. Genes encoding key enzymes in this pathway have been identified and studied in various species such as Arabidopsis, maize, petunia, snapdragon, apple, and grape [4]. They play crucial roles in plant resistance against various abiotic stresses and their antioxidant activity has been extensively studied [5]. The researchers observed that under salt stress, SS (salt stress) induced flavonoid accumulation in Sword lily [6]. Similar results have been observed in Brassica napus [7], pea [8], and peanut [9]. Spermidine hydroxycinnamoyl transferase (SHT) is a member of the acyl-CoA-dependent BAHD superfamily, which plays a role in the biosynthesis or alteration of a variety of metabolites, including phenols, terpenes, and more [10]. An Arabidopsis thaliana SHT (AtSHT) was shown to catalyze the formation of monoacylated, diacylated, and triacylated Spd [11]. Researchers found that in Cichorium intybus, CiSHT2 alone expression promoted partial substitution of putrescine accumulation, while co-expression of CiSHT2 and CiSHT1 promoted complete substitution of putrescine synthesis and accumulation [12].
Eucommia ulmoides (E. ulmiodes) belongs to the family Eucommiaceae [13]. It is distributed in provinces such as Shanxi, Gansu, and Henan, and is now widely planted across various regions in China. E. ulmiodes is a traditional Chinese medicinal herb containing a variety of bioactive chemical compounds, including flavonoids, lignans, sesquiterpenes, phenols, and terpenes [14]. Among them, flavonoids have increasingly received attention with research reports. They possess various pharmacological properties such as antioxidant, anti-inflammatory, anti-allergic, antimicrobial, anticancer, anti-aging, cardioprotective, and neuroprotective effects [15]. However, current research on the molecular regulation of flavonoid biosynthesis during E. ulmiodes growth under salt stress is limited. Genes involved in flavonoid biosynthesis have not yet been identified, and the regulatory mechanisms of flavonoid biosynthesis under salt stress still need to be elucidated.
In this study, we investigated the effects of salt stress on the morphological and physicochemical characteristics of E. ulmoides leaves. We conducted Gene Ontology (GO) enrichment analysis, Kyoto Encyclopedia of Genes and Genomes (KEGG) enrichment analysis, and Gene Set Enrichment Analysis (GSEA) analysis, identifying the flavonoid biosynthesis pathway. By constructing a network diagram of flavonoid-related genes and metabolites, cytoscape further demonstrated the hub genes associated with stress-regulated flavonoid mechanisms. Lastly, we employed various algorithms for VIP value analysis, displaying the expression patterns of metabolites across samples in each differential group, along with the VIP values from multivariate statistical analysis and the corresponding p-values from univariate statistics. We conducted pathway analysis to identify crucial metabolic pathways and their significant differential metabolites, analyzing their functions. Integrating transcriptomic analysis to identify hub regulatory genes, we extensively elucidated the types and composition of flavonoids induced under salt stress conditions through targeted metabolomics analysis.
2.1 Treatment Methods of Salt Stress in E. ulmoides
The three-month-old E. ulmoides seedlings were collected from a plantation in Ruyang County, Luoyang City, China. The seedlings were planted in pots with soil mixture (leaf-rotted soil:soil:vermiculite = 2:2:1), and temperature of 25°C (16 h light/8 h dark), with light density of 150 μmol photons m−2·s−1 (T5 LED) and 70% humidity. Plants were dipped in tap water and 150 mM NaCl once every three days. The experiment was divided into two groups: the control group (CK) and the salt stress group (ST), with 10 plants in each group. All samples were immediately frozen in liquid nitrogen and stored at −80°C for further use.
Transcriptome analysis included screening and analysis of differentially expressed genes (DEGs), GO and KEGG enrichment analysis, all performed as reported [16].
2.3 Widely Targeted Metabolomics Analysis
The methods of sample collection, sequencing, omics analysis, compound identification, and selection of differential compounds were all conducted according to our previous descriptions [17]. Based on VIP > 1 and p < 0.05, the top 20 metabolites can be identified.
2.4 Quantitative Real-Time PCR Analysis
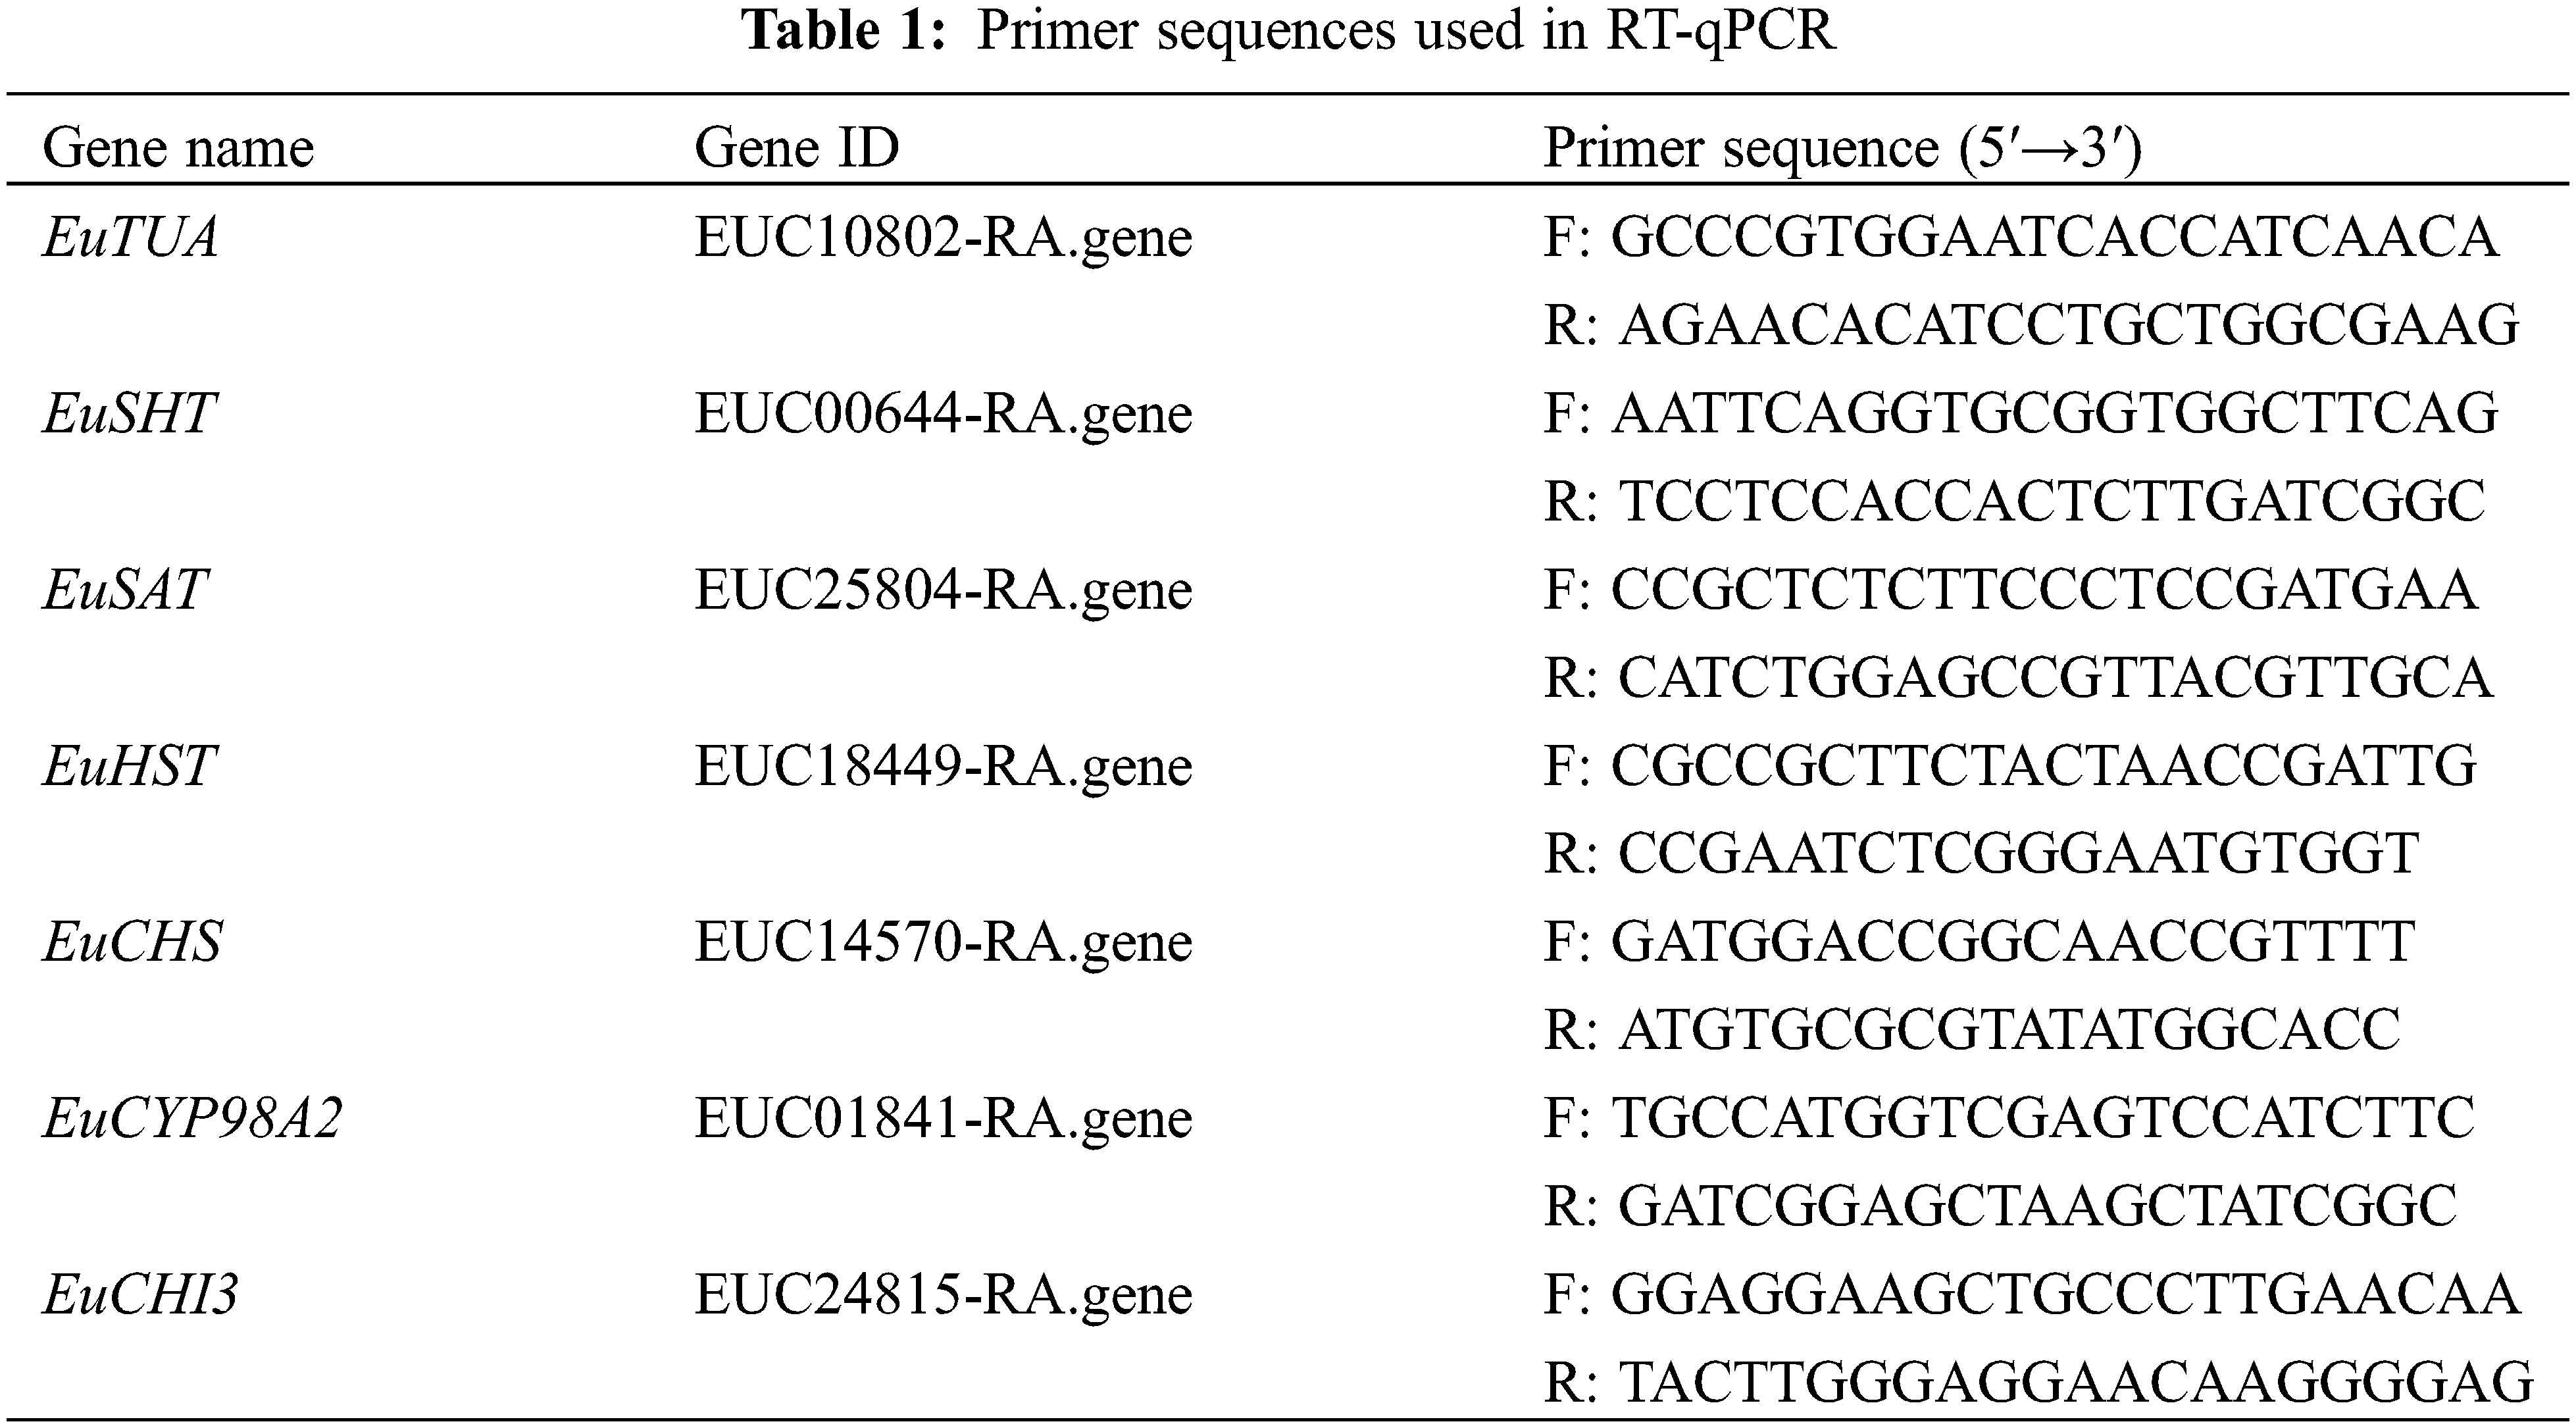
Reverse transcription-quantitative polymerase chain reaction (RT-qPCR) was employed to validate the findings of the RNA-sequencing (RNA-seq) analysis, following the protocol outlined by Yang et al. [18]. The gene EuTUA, encoding microtubule protein, was used as an internal reference to standardize gene expression in E. ulmoides [19] (primer sequences provided in Table 1). Calculate the relative copy number of genes using the 2−ΔΔCT method [18].
2.5 Physical and Chemical Indexes Determination
Malondialdehyde (MDA) and relative conductivity metrics were performed as per our report [20]. The determination of chlorophyll was carried out as previously reported [21]. The generation of superoxide anions is determined by our research method [20]. The determination of soluble protein was carried out as reported [22].
The experiment randomly chose the upper and middle section of the leaves to analyze physiological and biochemical indicators of leaf veins. This procedure was carried out in five separate biological replicates.
2.6 Virus–Induced Gene Silencing (VIGS)
The 173 bp fragment of EuSHT was inserted into the pTRV2 vector; A. tumefaciens strain GV3101 was transformed with pTRV1, pTRV2, and pTRV2-EuSHT. The primers used for VIGS were 5′CTCTAGAACGAAACGAAATTTTAGTGGTTC-3′ (sense) and 5′CCCCCGGGTTACAATCTACTATTGCAATACATATC′(antisense), which were synthesized by Genscript Biotech Corporation. The infection protocol was carried out according to Zuo et al. [17].
Statistical analysis was conducted using the SPSS statistical software package (version 26.0). The Wilcoxon test was employed as a non-parametric test to detect differences between groups of samples. Additionally, paired sample t-test was utilized to determine the significance of differences between samples at specific time points. p < 0.05 indicates significant difference, while p < 0.01 indicates highly significant difference.
3.1 Effect of Salt Stress on E. ulmoides
Salt stress significantly affects the phenotypic status of E. ulmoides leaves. After 144 h of salt stress, the leaves of E. ulmoides turned black, and curling was observed (Fig. 1A). The results of MDA (malondialdehyde) assay (Fig. 1B) showed that with the prolongation of salt stress time, the degree of lipid peroxidation in E. ulmoides leaves intensified, indicating increased cell damage. The MDA content in salt-stressed leaves was significantly higher than that in the control group. Salt stress treatment showed a significant increase in MDA content early on, indicating substantial damage to the cell membrane at this stage. From 96 to 120 h, the MDA content in E. ulmoides leaves significantly increased, suggesting significant stress-induced damage to the cells. From 120 to 144 h, the MDA content in E. ulmoides leaves tended to stabilize, it is speculated that this stabilization may be indicative of the inherent stress resistance of the cells themselves. The chlorophyll content showed a significant decrease in the early stages of salt stress (Fig. 1C). However, as the duration of salt stress increased, the rate of decline gradually slowed down. At 144 h, the chlorophyll content was the lowest, indicating a significant reduction in the photosynthetic capacity of E. ulmoides, suggesting that salt stress caused substantial damage to it. The measurement results of relative conductivity indicate that a significant increase starting at 72 h, indicating an increase in cell membrane damage, which suggests significant salt stress damage to E. ulmoides (Fig. 1D). The experimental findings suggest that the production efficiency of superoxide anions in E. ulmoides leaves escalates with the duration of exposure to salt treatment (Fig. 1E), showing analogous patterns to the electrolyte leakage and MDA levels in the cell membrane. Elevated levels of ROS, such as superoxide anions, can lead to lipid peroxidation, the primary factor in membrane injury. The findings regarding superoxide anions align with those of MDA, indicating cellular damage caused by stress. The soluble protein results indicate that during the initial stages of salt stress treatment, insoluble proteins in the plant transform into soluble proteins to enhance osmotic regulation capabilities. However, in the later stages of the stress treatment, salt stress exceeding the threshold tolerable by the plant inhibits synthetic metabolism inside the plant, leading to protein degradation (Fig. 1F). To elucidate the response of E. ulmoides cells to stress, we conducted integrated analysis of transcriptomics and metabolomics.
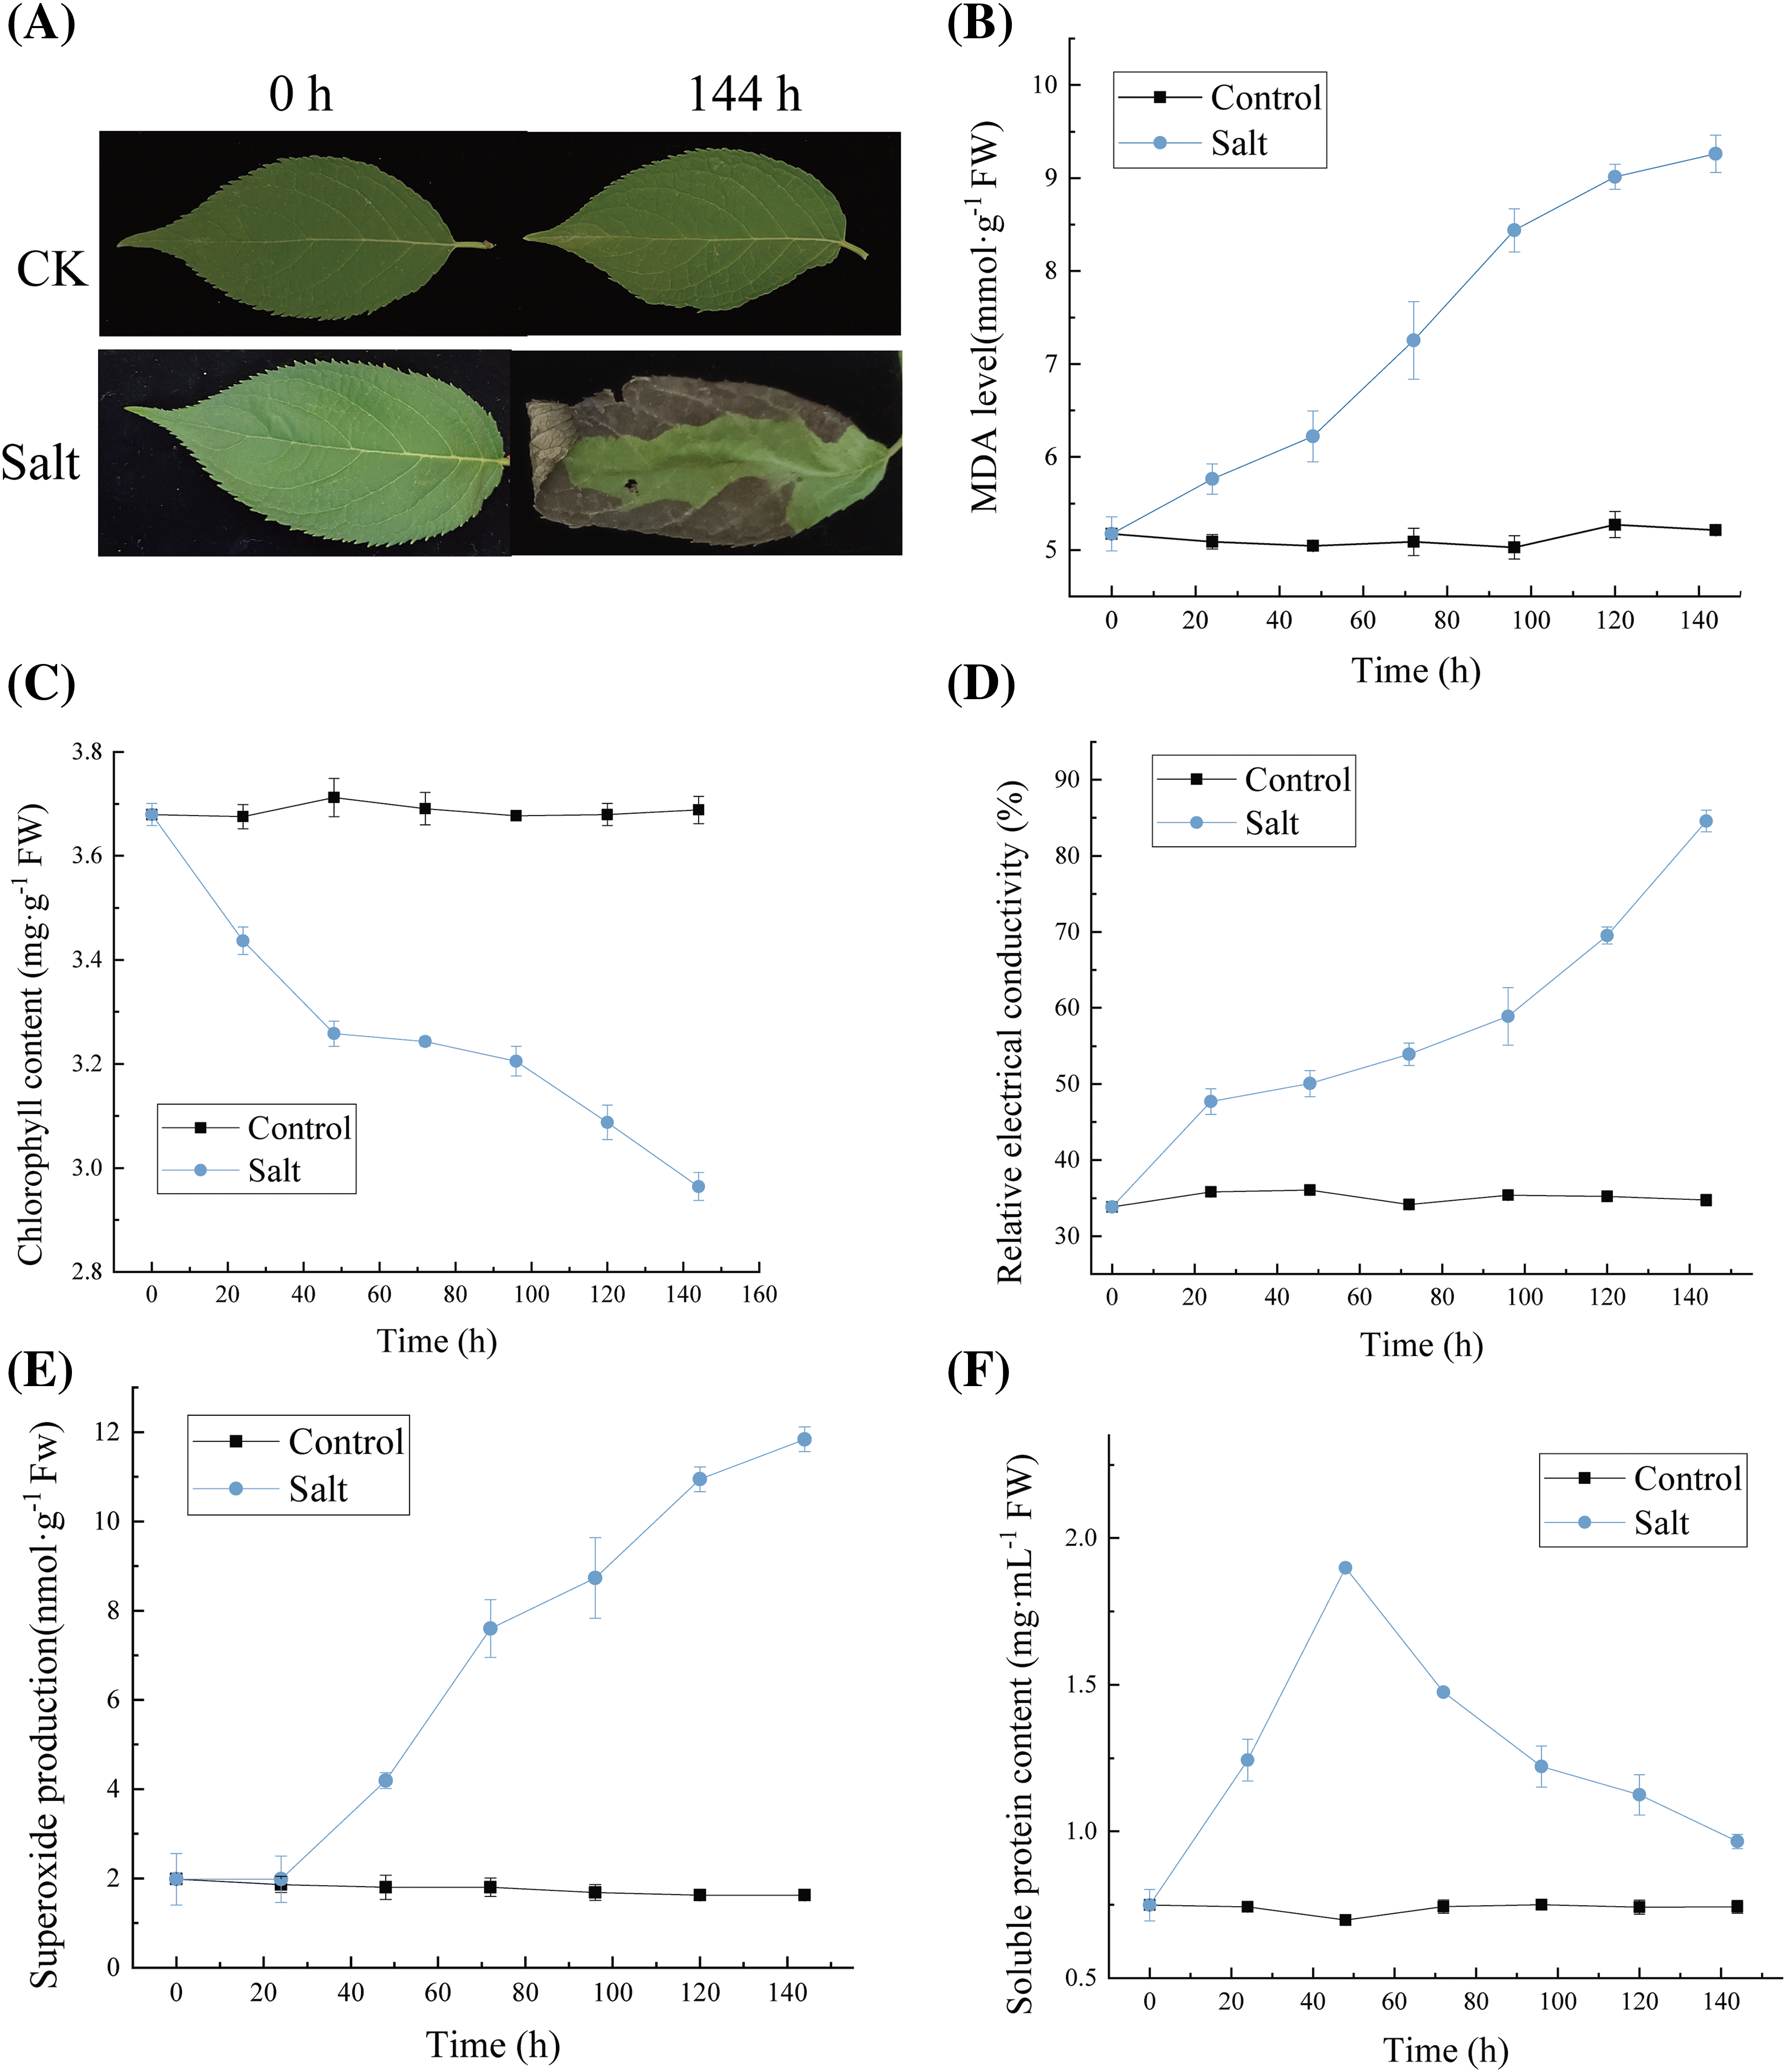
Figure 1: Effects of salt stress on physical and chemical indexes of E. ulmoides leaves. (A) Comparison of leaf phenotypes with or without salt stress; (B) MDA content; (C) Chlorophyll content; (D) The relative electrical conductivity; (E) Superoxide anion production; (F) Soluble protein content
3.2 Overview of Transcriptomics
A total of 26,722 genes were aligned to six public databases after comparison with the E. ulmoides genome (PRJCA000677) (Fig. 2A). A violin plot was employed to illustrate the measures of central tendency and variability in the distribution of gene expression within the salt stress-treated group (Fig. 2B). A heatmap of sample correlations (Fig. 2C) was used to cluster the ST samples at the 144-h time point. The heatmap indicated a low correlation between the control group and the ST group (Fig. 2C). The Principal Component Analysis (PCA) plot (Fig. 2D) clearly showed significant differences in the transcriptomes of E. ulmoides between the control group and the ST group.
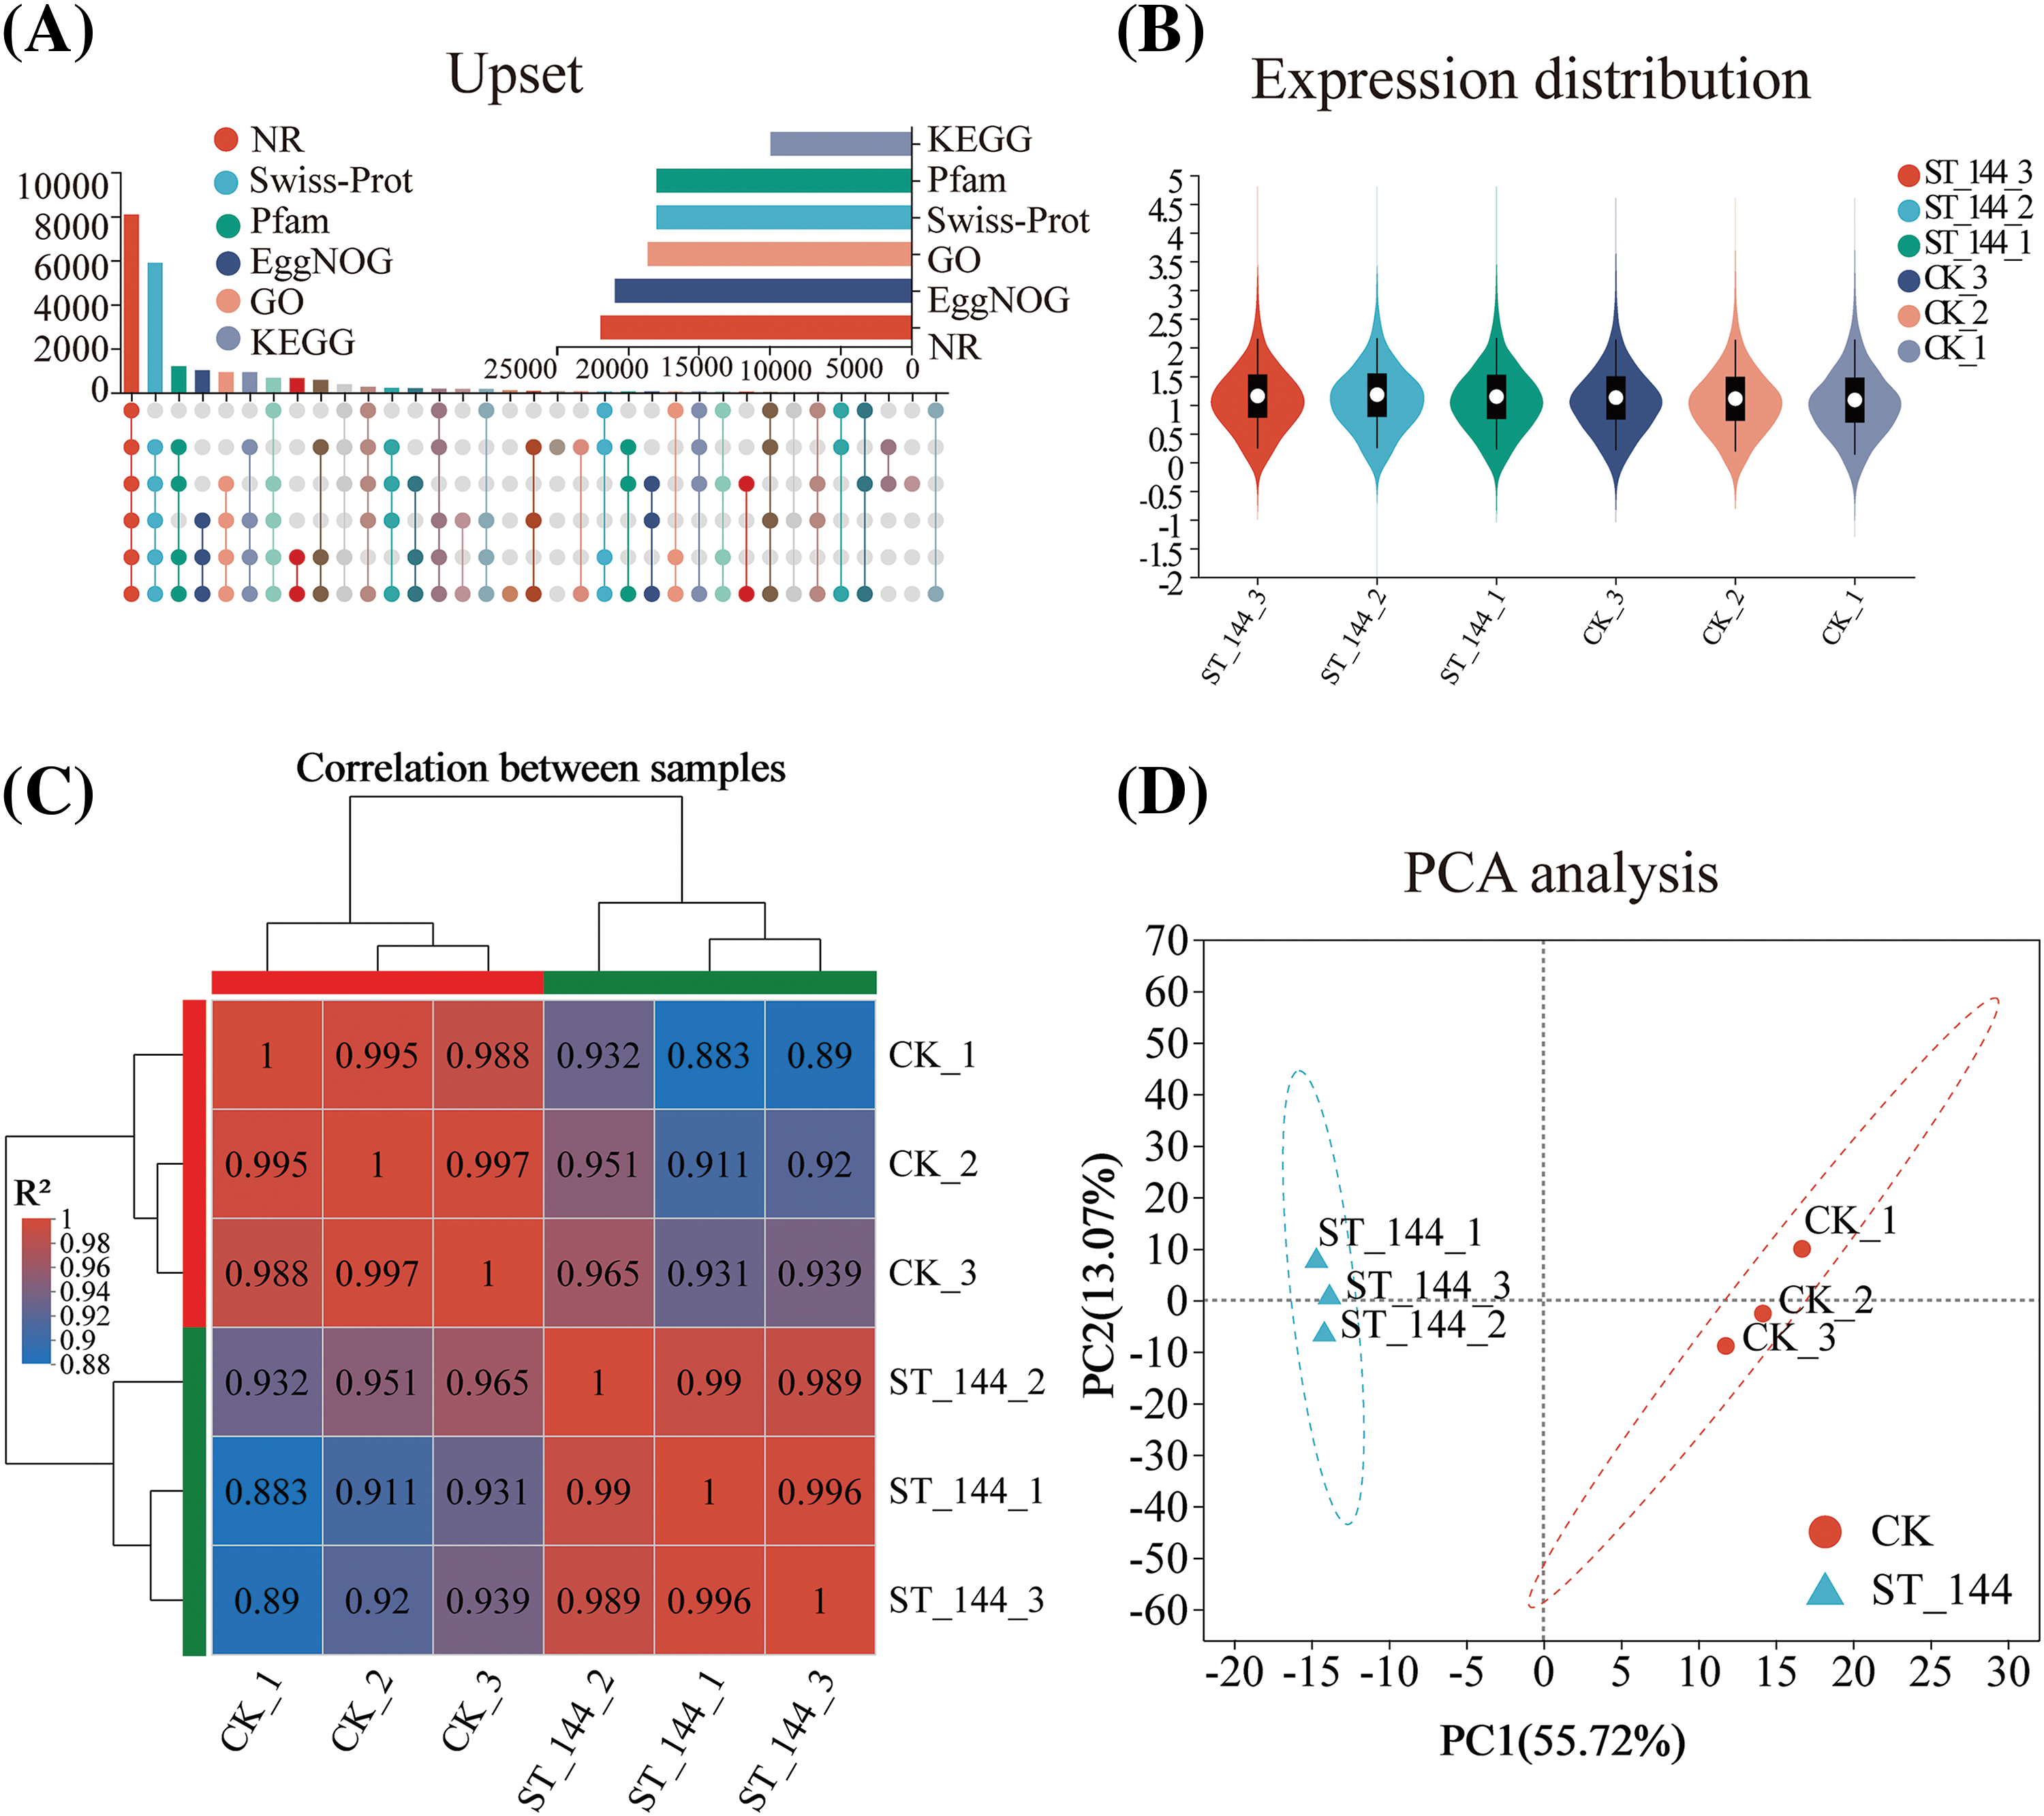
Figure 2: A review of transcriptome analysis in E. ulmoides under salt stress. (A) A comparison diagram illustrating the annotation of genes across six public databases; (B) Violin plot showing the distribution of gene expression in each sample; (C) Correlation between samples, with rows and columns representing samples (red represents high correlation; blue represents low correlation); (D) PCA was performed on the E. ulmoides genes for both the CK group and the ST group
In order to further elucidate the function of differentially expressed flavonoid genes under salt stress regulation, we conducted GO enrichment analysis and KEGG enrichment analysis on 411 flavonoid biosynthesis-related genes in the two groups of samples. The GO enrichment bubble plot showed that the 411 flavonoid biosynthesis-related genes were distributed across 218 pathways, with 12 genes enriched in the flavonoid biosynthesis pathway (Fig. 3A). The results of KEGG enrichment analysis indicated that the 411 flavonoid biosynthesis-related genes were mainly enriched in the phenylpropanoid biosynthesis and flavonoid biosynthesis pathways (Fig. 3B). The GO enrichment analysis visually displayed the enriched GO terms and their hierarchical relationships in the form of a directed acyclic graph (Fig. 3C). The GO terms of flavonoid-related genes were summarized in a directed acyclic graph, illustrating the schematic relationships between GO terms (Fig. 3C). GO classifications include biological processes (BP) and molecular functions (MF). Each box represents a GO term, with the red boxes indicating significantly enriched GO terms within the gene set. The lines between GO terms represent the relationships between two GO terms, with different colored arrows indicating the main relationships, such as “is a” and “part of”. For example, the biological process GO term “L-phenylalanine catabolic process (GO:0006559)” is a child term of “erythrose 4-phosphate/phosphoenolpyruvate family amino acid catabolic process (GO:1902222)”, which is a child term of “erythrose 4-phosphate/phosphoenolpyruvate family amino acid metabolic process (GO:1902221)”. These terms have parent terms and can be traced back to the ultimate ancestor, which is the root of BP (GO:0008150). The molecular function GO term “4-coumarate-CoA ligase activity (GO:0016207)” is a child term of “acid-thiol ligase activity (GO:0016878)”, which is a child term of “MF (GO:0003674)”. These terms also have parent terms and can be traced back to the ultimate ancestor, which is the root of MF (GO:0003674). Through GSEA analysis of the 411 flavonoid biosynthesis-related genes, they were found to be distributed across 5 metabolic pathways, with 16 leading-edge subsets in the flavonoid biosynthesis pathway (Fig. 3D). VENN analysis was conducted on the upregulated genes among the 411 flavonoid biosynthesis-related genes, the 68 genes enriched in flavonoid biosynthesis, and the 16 leading-edge subsets. It was found that a total of 16 genes overlapped among these three gene sets (Fig. 3E).
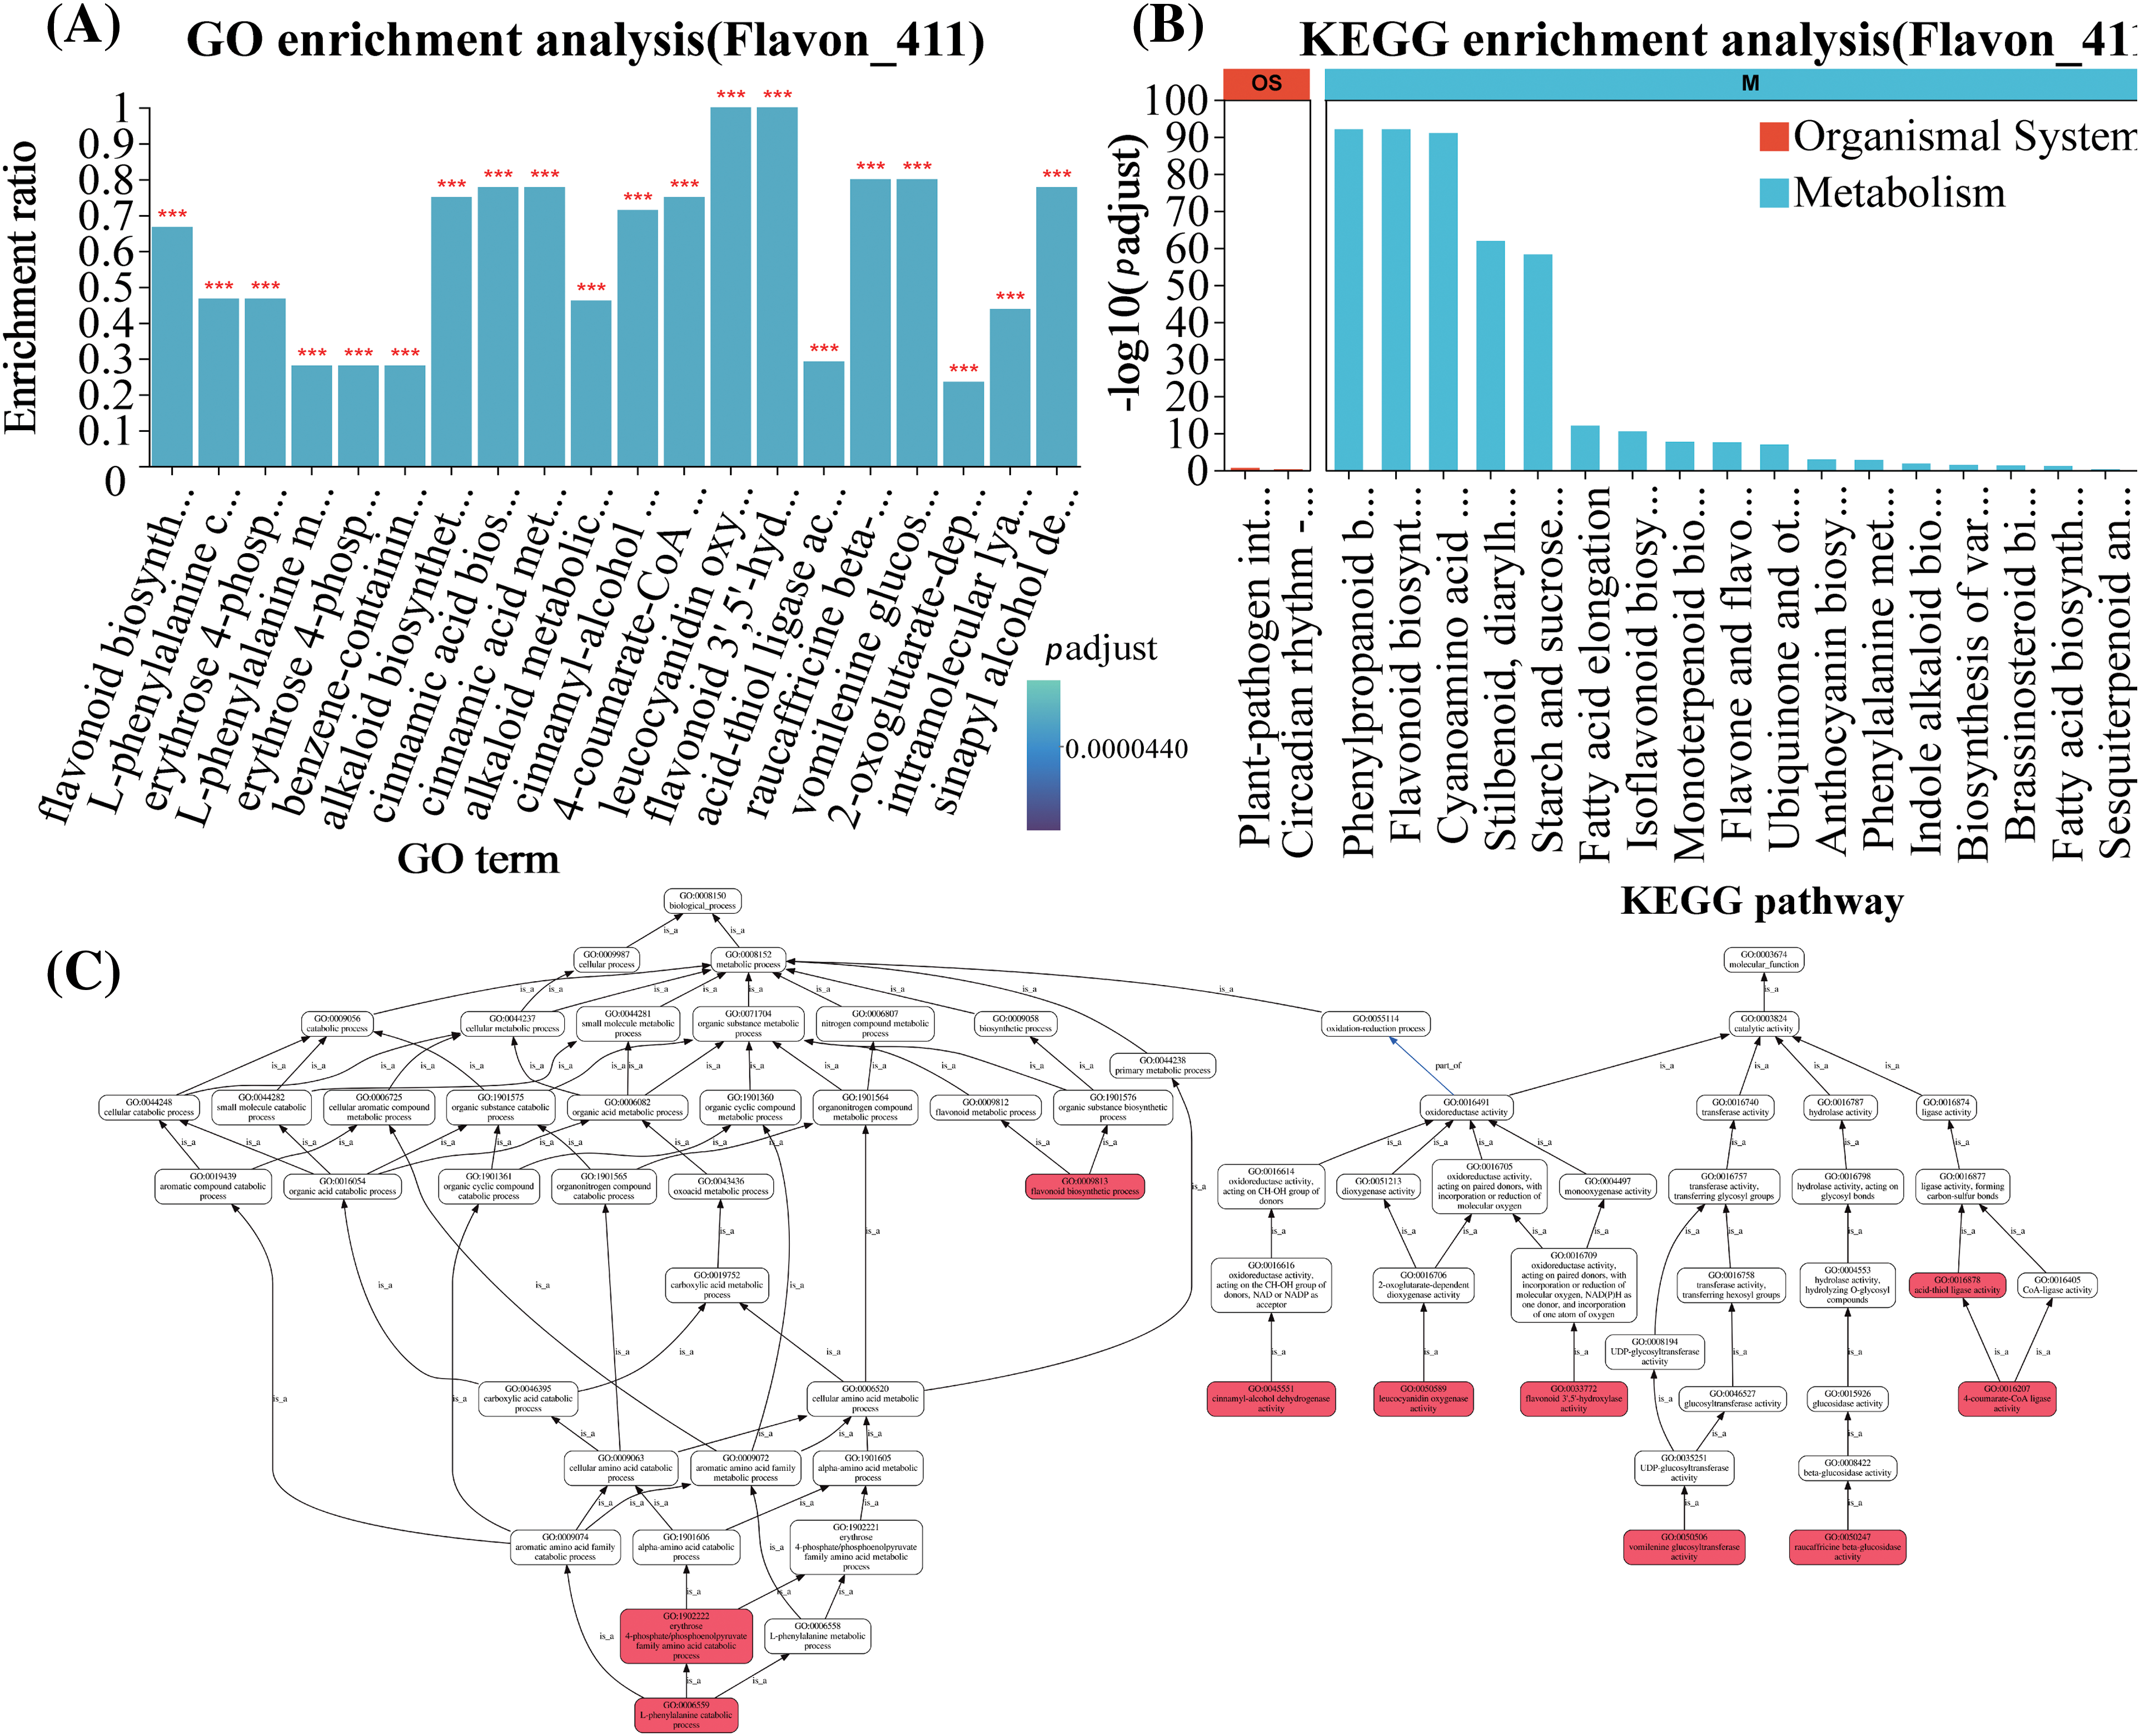
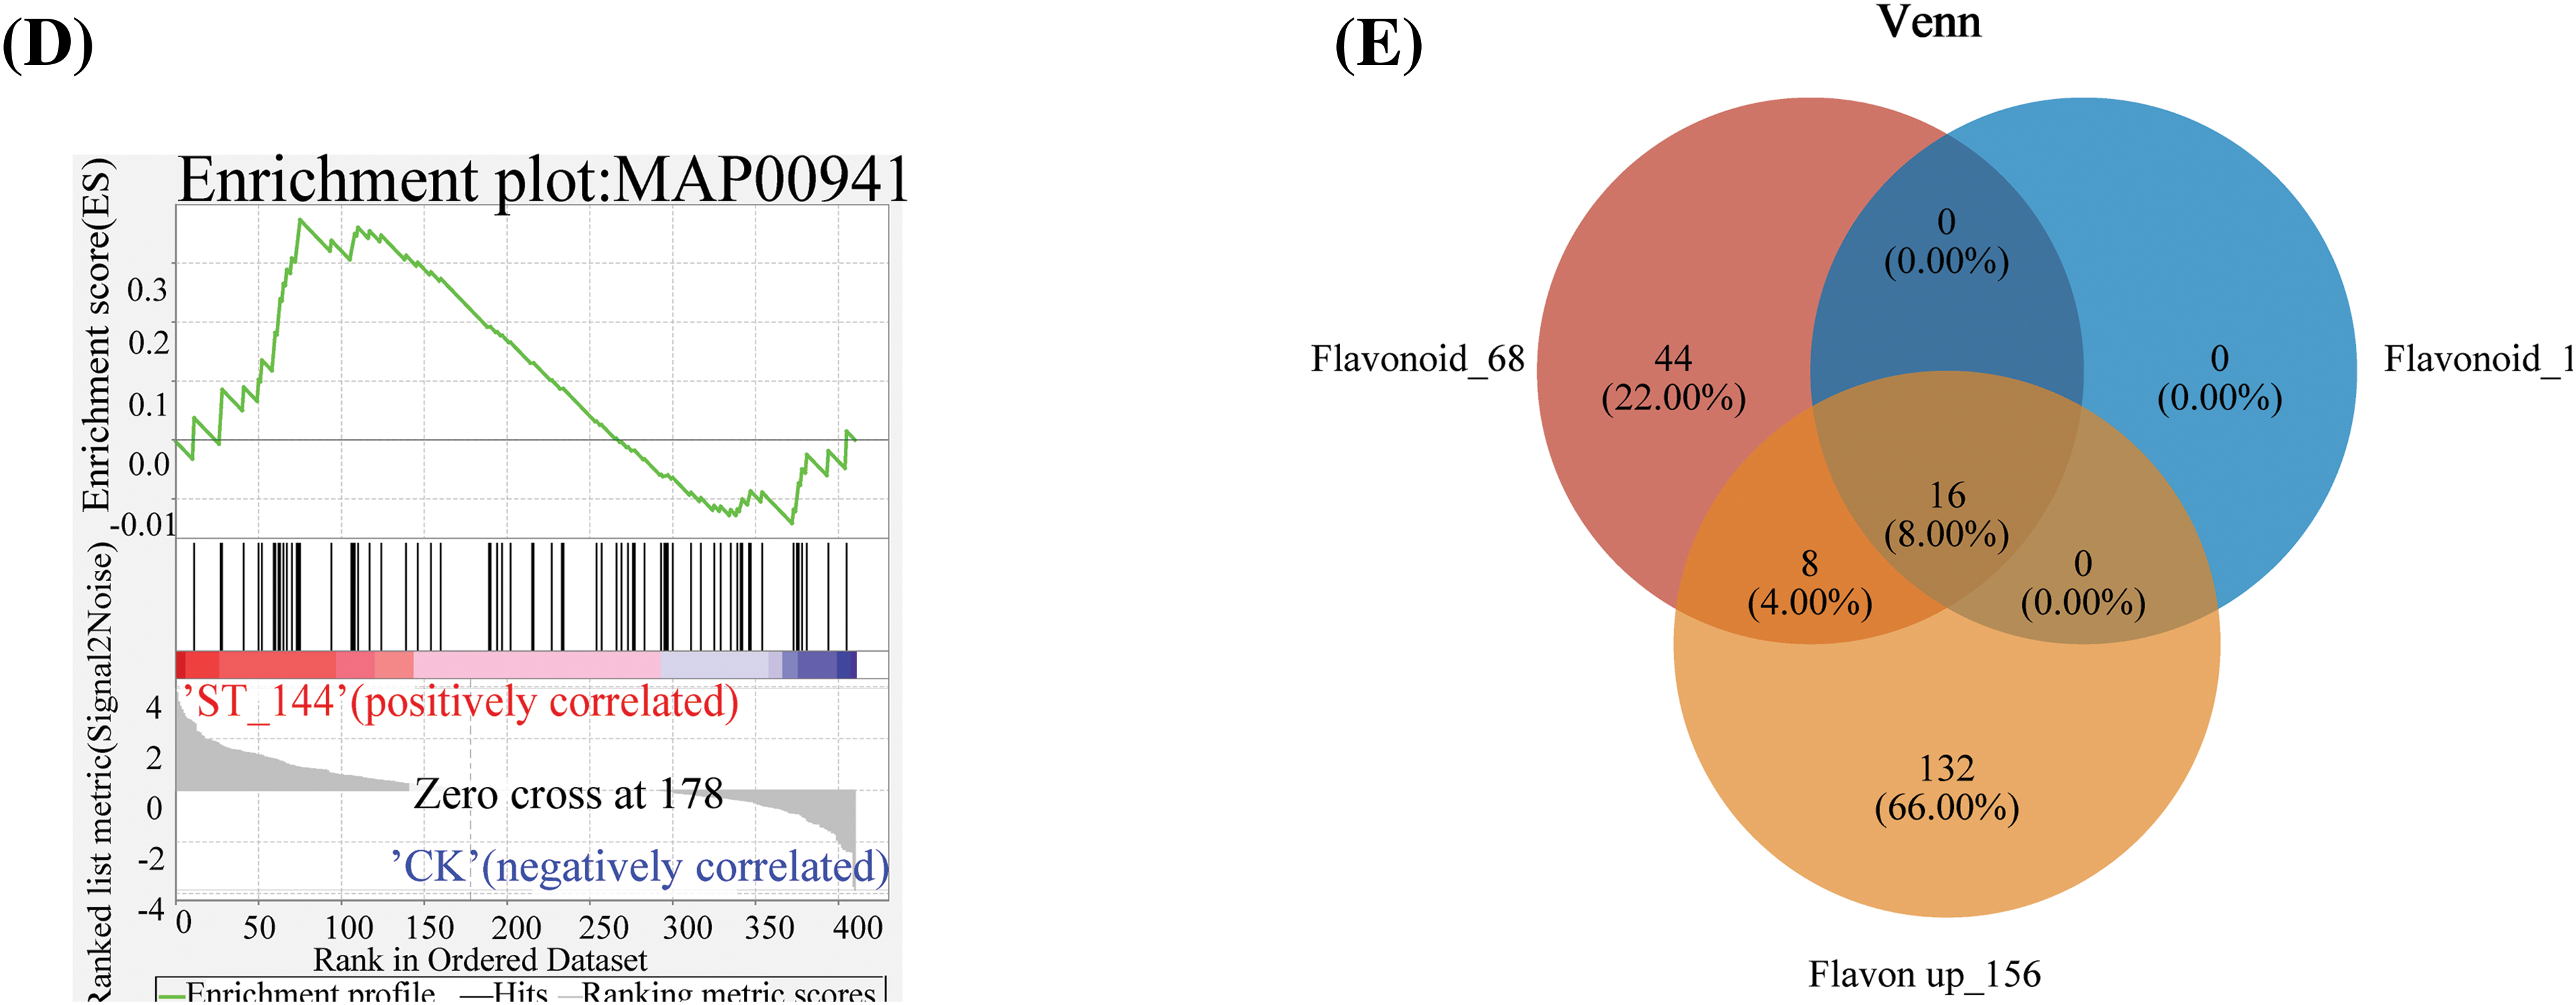
Figure 3: Molecular summary of flavonoid-related genes. (A) GO-enriched bubble plots: abscissa for Rich factor and ordinate for GO term. The column color gradient indicated the significance of the enrichment, where p adjust < 0.001 was labeled ***. (B) Histogram of KEGG enrichment: abscissa indicates KEGG pathway and ordinate indicates significance level of enrichment. (C) GO directed acyclic graphs. Red to white represents a decreasing level of significance (red is the most significant, white is the least significant). (D) GSEA analysis of genes associated with flavonoid biosynthesis pathways (The upper curve shows the change trend of the cumulative ES value, and the highest point is the ES value of the gene set; The central vertical bar indicates the position of the priori gene set in the sorted gene list, and the black line marks the position where each gene in the priori gene set appears in the sorted gene list. Lower heatmap and gray area plots indicate the distribution of genes in the ordered gene list). (E) inter-sample VENN plots
3.3 Widely Targeted Metabolomics Analysis
835 metabolites were identified in the metabolomic analysis. From the volcano plot (Fig. 4A), blue represents upregulation, indicating 118 upregulated metabolites; grey represents downregulation, indicating 64 downregulated metabolites, and yellow represents metabolites with no significant difference. To analyze the differences between groups, multidimensional data collected were subjected to multidimensional reduction and classification. PCA analysis results showed differences between the two groups of samples (Fig. 4B), where PC1 contributed 51.0% (ST group) and PC2 contributed 21.3% (control group). It can be observed that there is a significant separation in the expression levels of metabolites between the two groups, indicating a significant classification effect. Among the upregulated flavonoid metabolites, according to VIP > 1, the top 5 metabolites can be identified (Fig. 4C). Three of these five metabolites-Naringenin chalcone 2′,4,4′,6′-Tetrahydroxychalcon, Naringenin (5,7,4′-Trihydroxyflavanone) and 3,9-Dihydroxypterocarpan were differentially expressed metabolites (p < 0.05). 182 different metabolites (p < 0.05, VIP > 1) were screened in the ST and CK groups (blue circles, Fig. 4D). Out of 835 differentially expressed metabolites, a total of 39 flavonoids were obtained (yellow circles), and 21 were upregulated (gray circles). Nine of the 39 flavonoids were significantly different in expression (all up-regulated) (Fig. 4D). When the current abundance of 20 flavonoids is employed for hierarchical clustering (Fig. 4E), two subclusters could be identified. Subcluster I (red) contains the following listed metabolites: 3,9-Dihydroxypterocarpan, Naringenin chalcone 2′, 4,4′,6′-Tetrahydroxychalcone, Naringenin (5,7,4′-Trihydroxyflavanone), Isorhamnetin 3′-Methoxy-3,4′,5,7-Tetrahydroxyflavone and Quercetin, among others. The ST group exhibited a higher abundance of these metabolites compared to the control group. Conversely, metabolites in subcluster II (blue) were more prevalent in the control group. They include Acacetin, 3-O-MethylQuercetin, 6,7,8-Tetrahydroxy-5-methodyflavone, 5-O-Caffeoylshikimic acid, 5,4′-Dihydroxy-3,7-dimethodyflavone (Kumatakenin) and Ayanin (3′,5-Dihydroxy-3,4′,7-Trimethodyflavone) (Fig. 4E).
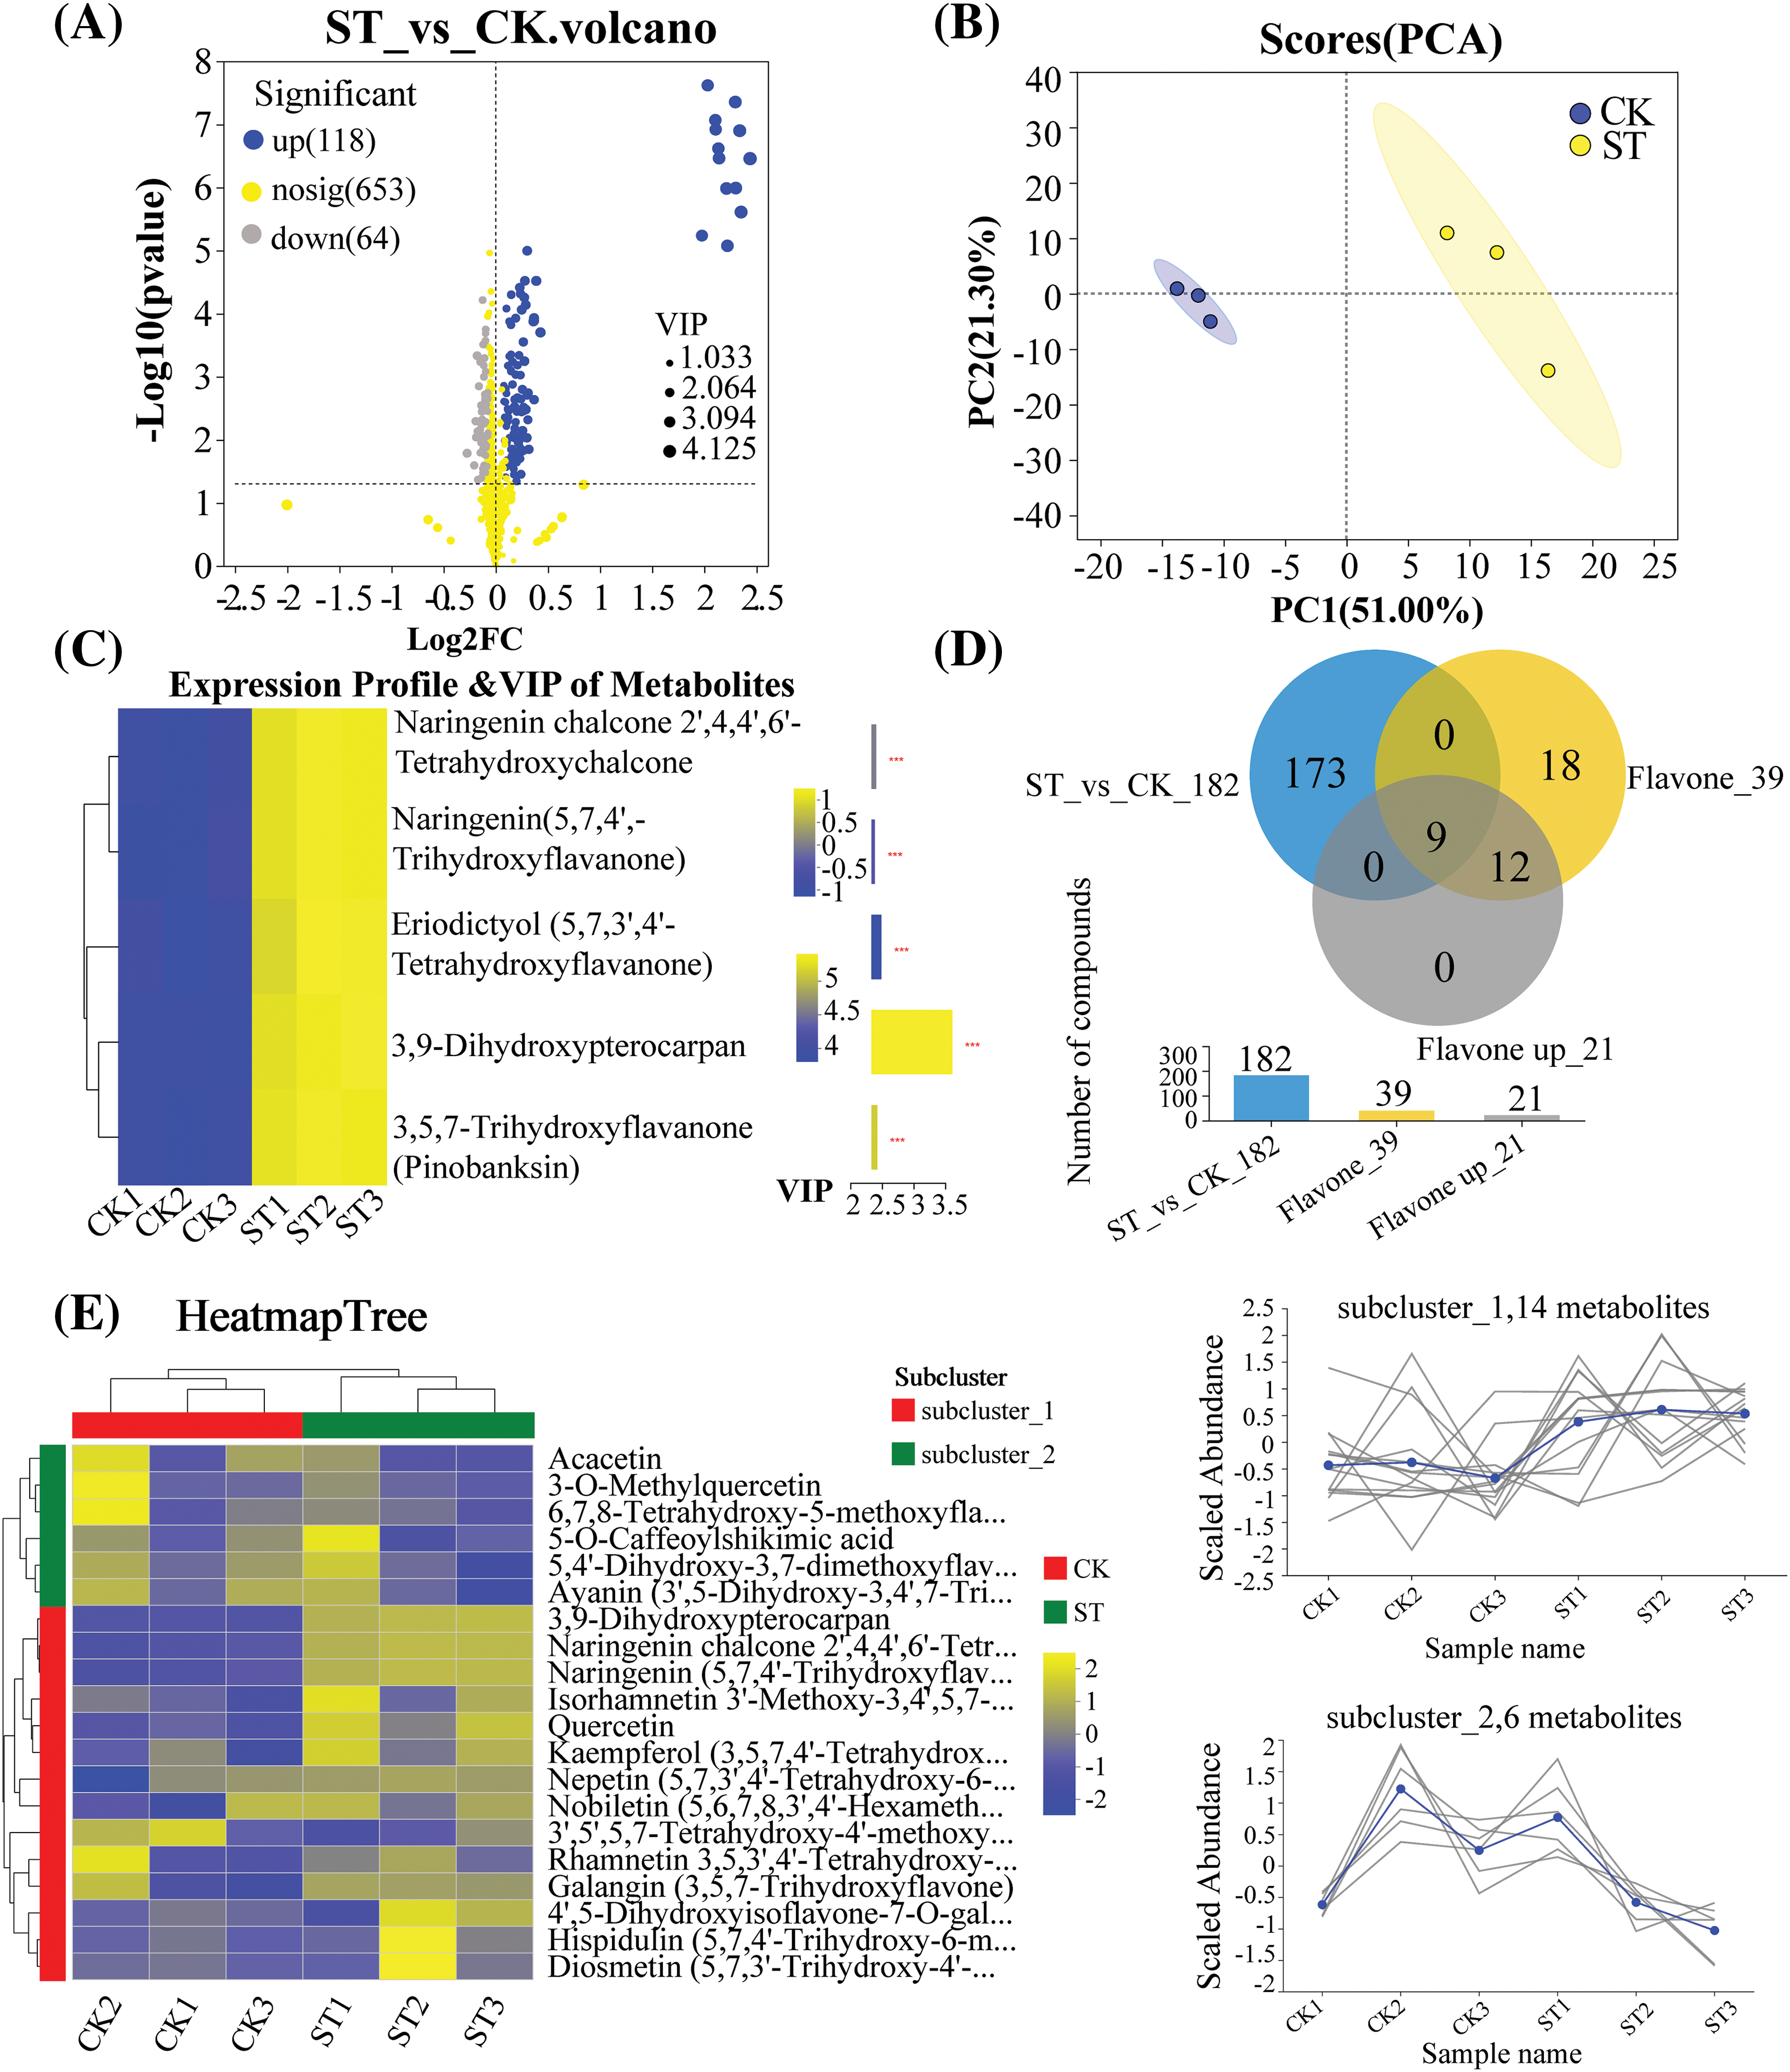
Figure 4: 39 Metabonomic analysis of flavonoids. (A) Volcano map of differential metabolites in dragon fruit before/after salt stress treatment; (B) PCA analysis map between the two groups of samples before/after salt stress treatment; (C) VIP values and expression of the top 5 flavonoids (VIP ≥ 1) (The *** represented p < 0.001); (D) A Venn diagram illustrating all flavonoids and upregulated flavonoids among representative differentially expressed metabolites; (E) Relevant heat map of the top 20 flavonoids. In the heatmap, blue indicates negative correlation and yellow indicates positive correlation. Hierarchical clustering is presented in the form of a dendrogram
3.4 Co-Expression Network Analysis of Key Differential Genes and Metabolites
After metabolomic analysis, 39 significantly different flavonoid metabolites were selected to establish a metabolic set. Subsequently, expression correlation analysis was conducted between the 16 genes selected from transcriptomic data and the metabolites, and a co-expression network analysis graph (Fig. 5A) and a top10 analysis (Fig. 5B) were constructed. The co-expression network graph constructed using cytoscape consisted of 55 nodes and 327 edges. From the top10 ranking results, it can be observed that the most significantly related substances to EuSHT are 6-Hydroxyluteolin, Quercetin, and Catechin.
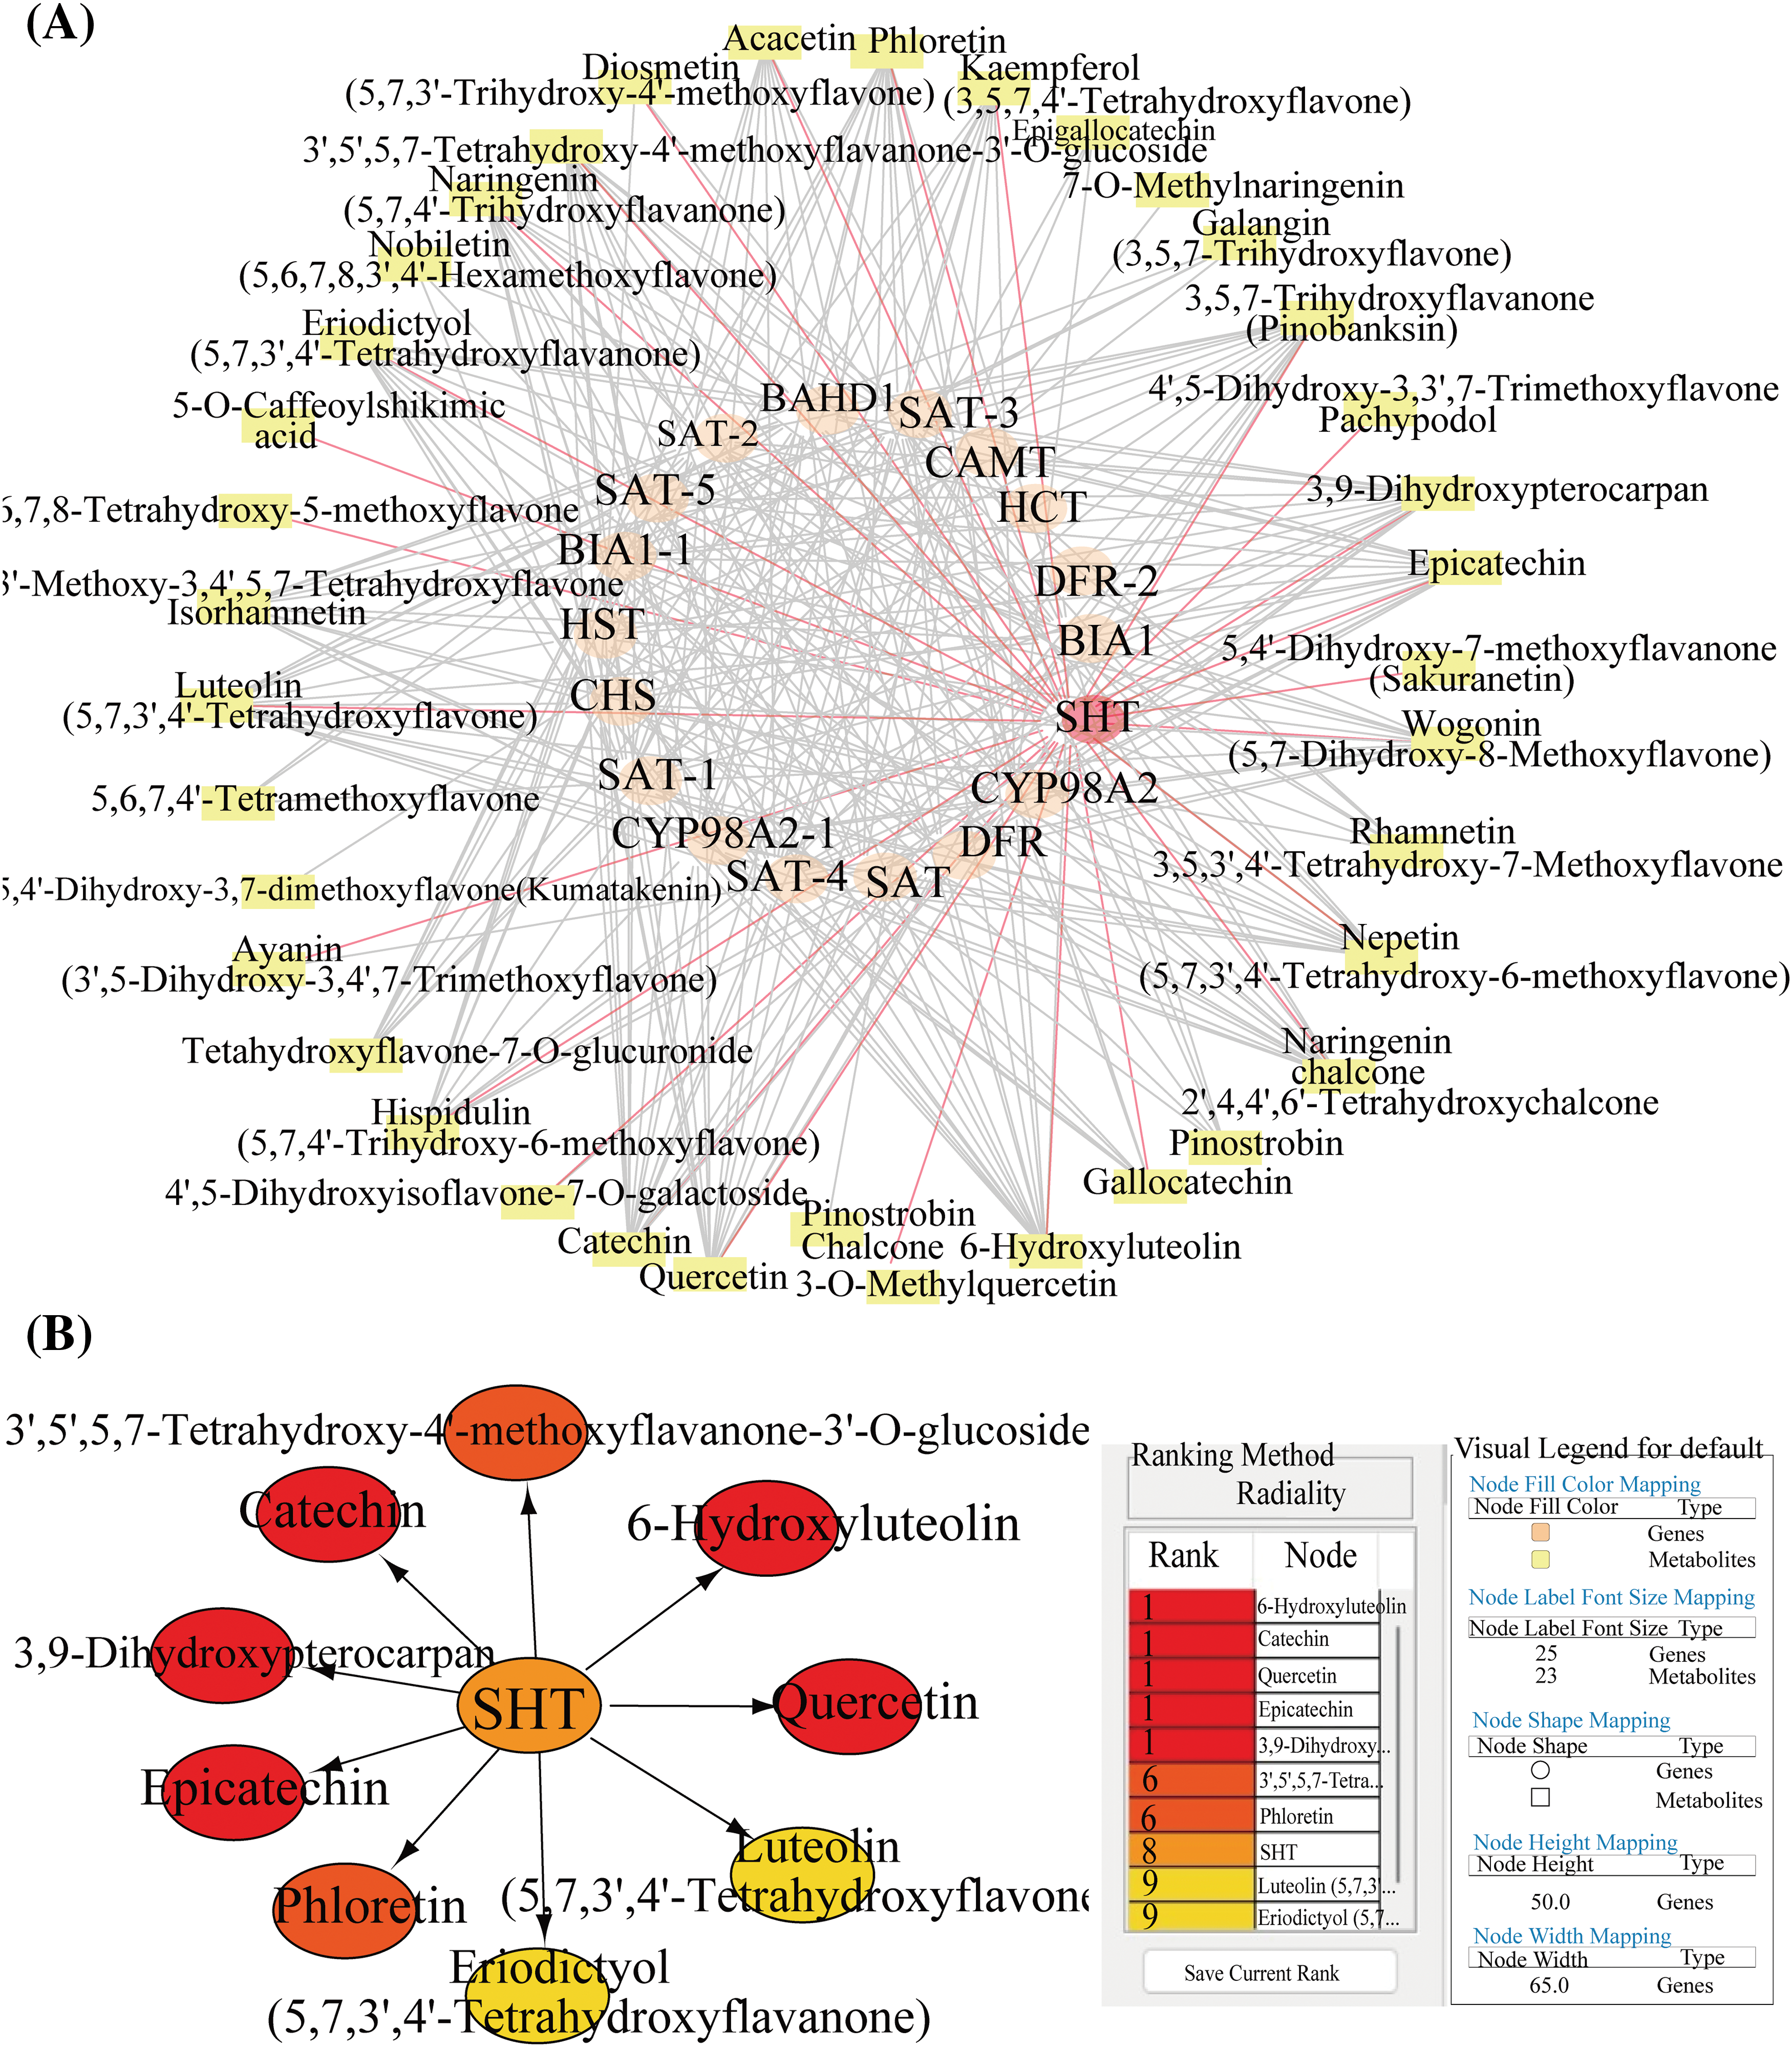
Figure 5: Expression correlation network analysis. (A) The total co-expression network map, where orange represents genes, yellow represents metabolites, the target gene EuSHT is highlighted in red, and the red lines are EuSHT-related metabolites; (B) Top10 protein network interaction mapping
3.5 Accuracy of the RNA-Seq Data Verification by RT-qPCR
The accuracy of transcriptomic data for 6 genes that were either up or downregulated was validated using RT-qPCR (Fig. 6A). A strong correlation (R2 = 0.9834) was observed between transcriptomic and RT-qPCR profiles (Fig. 6B). Detailed information on the RT-qPCR experiments, including primers, Log2FC (E/C), and more, for the 6 genes can be found in Table 1 and Fig. 6.
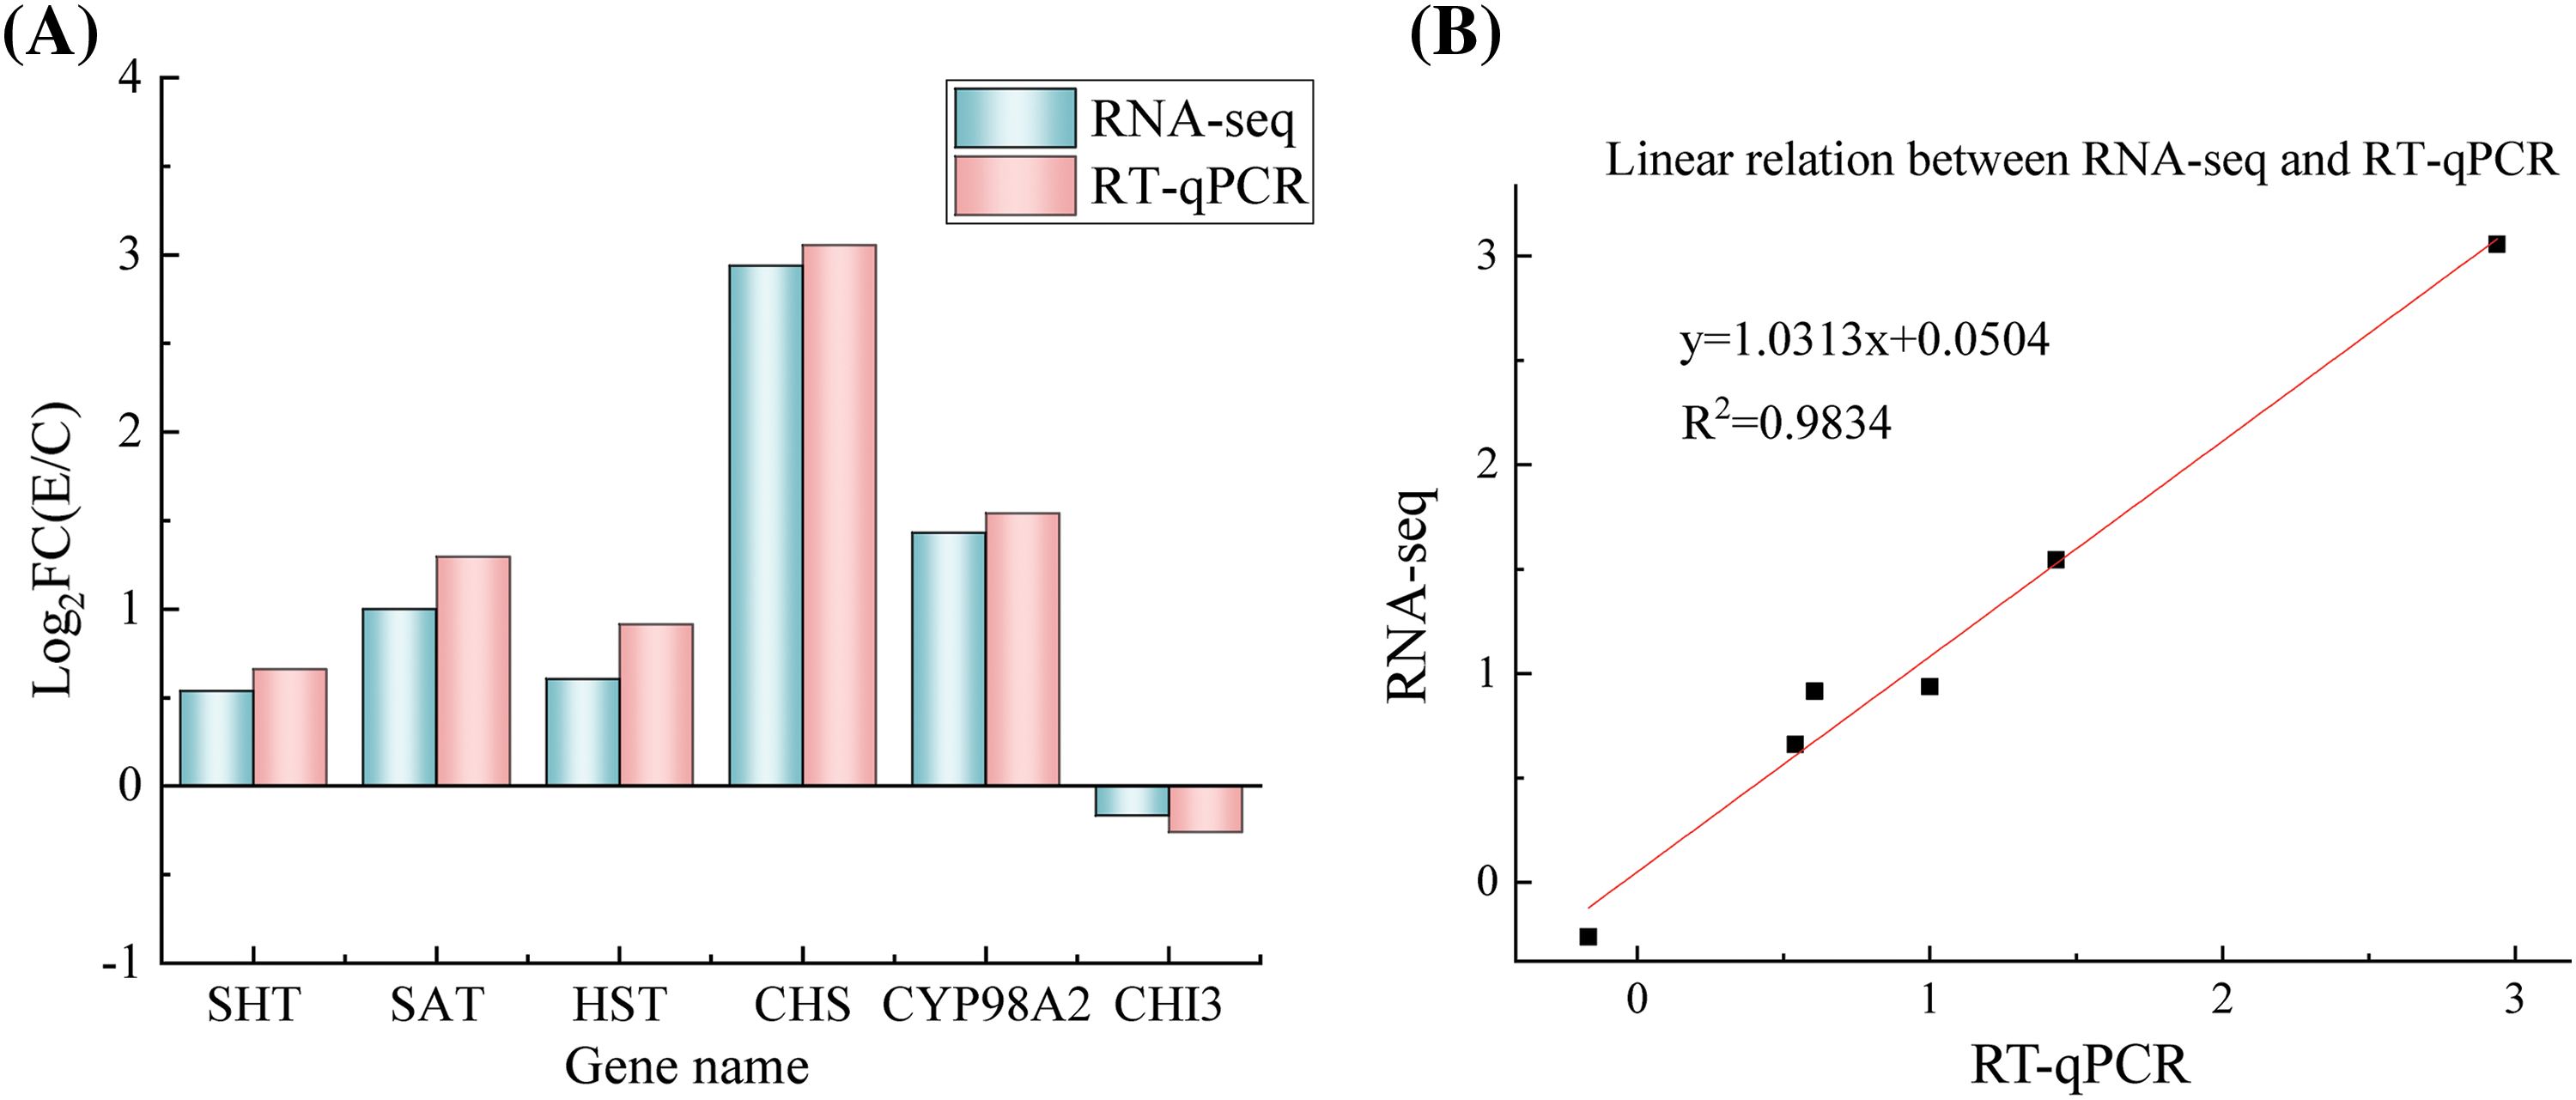
Figure 6: Expression of six gens treated with salt stress in RT-qPCR and transcriptome data. (A) Expression profiles of the 6 chosen genes, as identified through RT-qPCR and transcriptomic analysis; (B) The correlation between the expression levels of the selected genes measured using transcriptomic analysis and RT-qPCR
3.6 Analysis of Virus-Induced EuSHT Silencing
To validate the function of EuSHT, we constructed a EuSHT-silenced strain using virus-induced gene silencing (Fig. 7A). Agrobacterium samples inoculated with PTRV2-EuSHT were subjected to PCR cross-verification using primers EuSHT-F and pTRV2-R, resulting in the amplification of a 173 bp target band (Fig. 7B). These results indicate that PTRV2-EuSHT has been successfully inserted and expressed in the GV3101 Agrobacterium genome. The areas of damage on leaves treated with EuSHT were more responsive to salt treatment compared to the CK groups. Additionally, the injection section in the leaves interfered with by EuSHT were more susceptible to damage compared to the CK group. (Fig. 7C). Under salt stress conditions, gene silencing results in similar trends for MDA (malondialdehyde) (Fig. 7D), relative electrical conductivity (Fig. 7F), and superoxide anion levels (Fig. 7G), showing a gradual increase trend. Chlorophyll levels exhibit a decreasing trend (Fig. 7E), while soluble protein content initially increases and then decreases (Fig. 7H). The RT-qPCR results confirmed a significant decrease in the relative expression of the EuSHT gene in the RNA silenced plants exposed to salt stress (Fig. 7I).
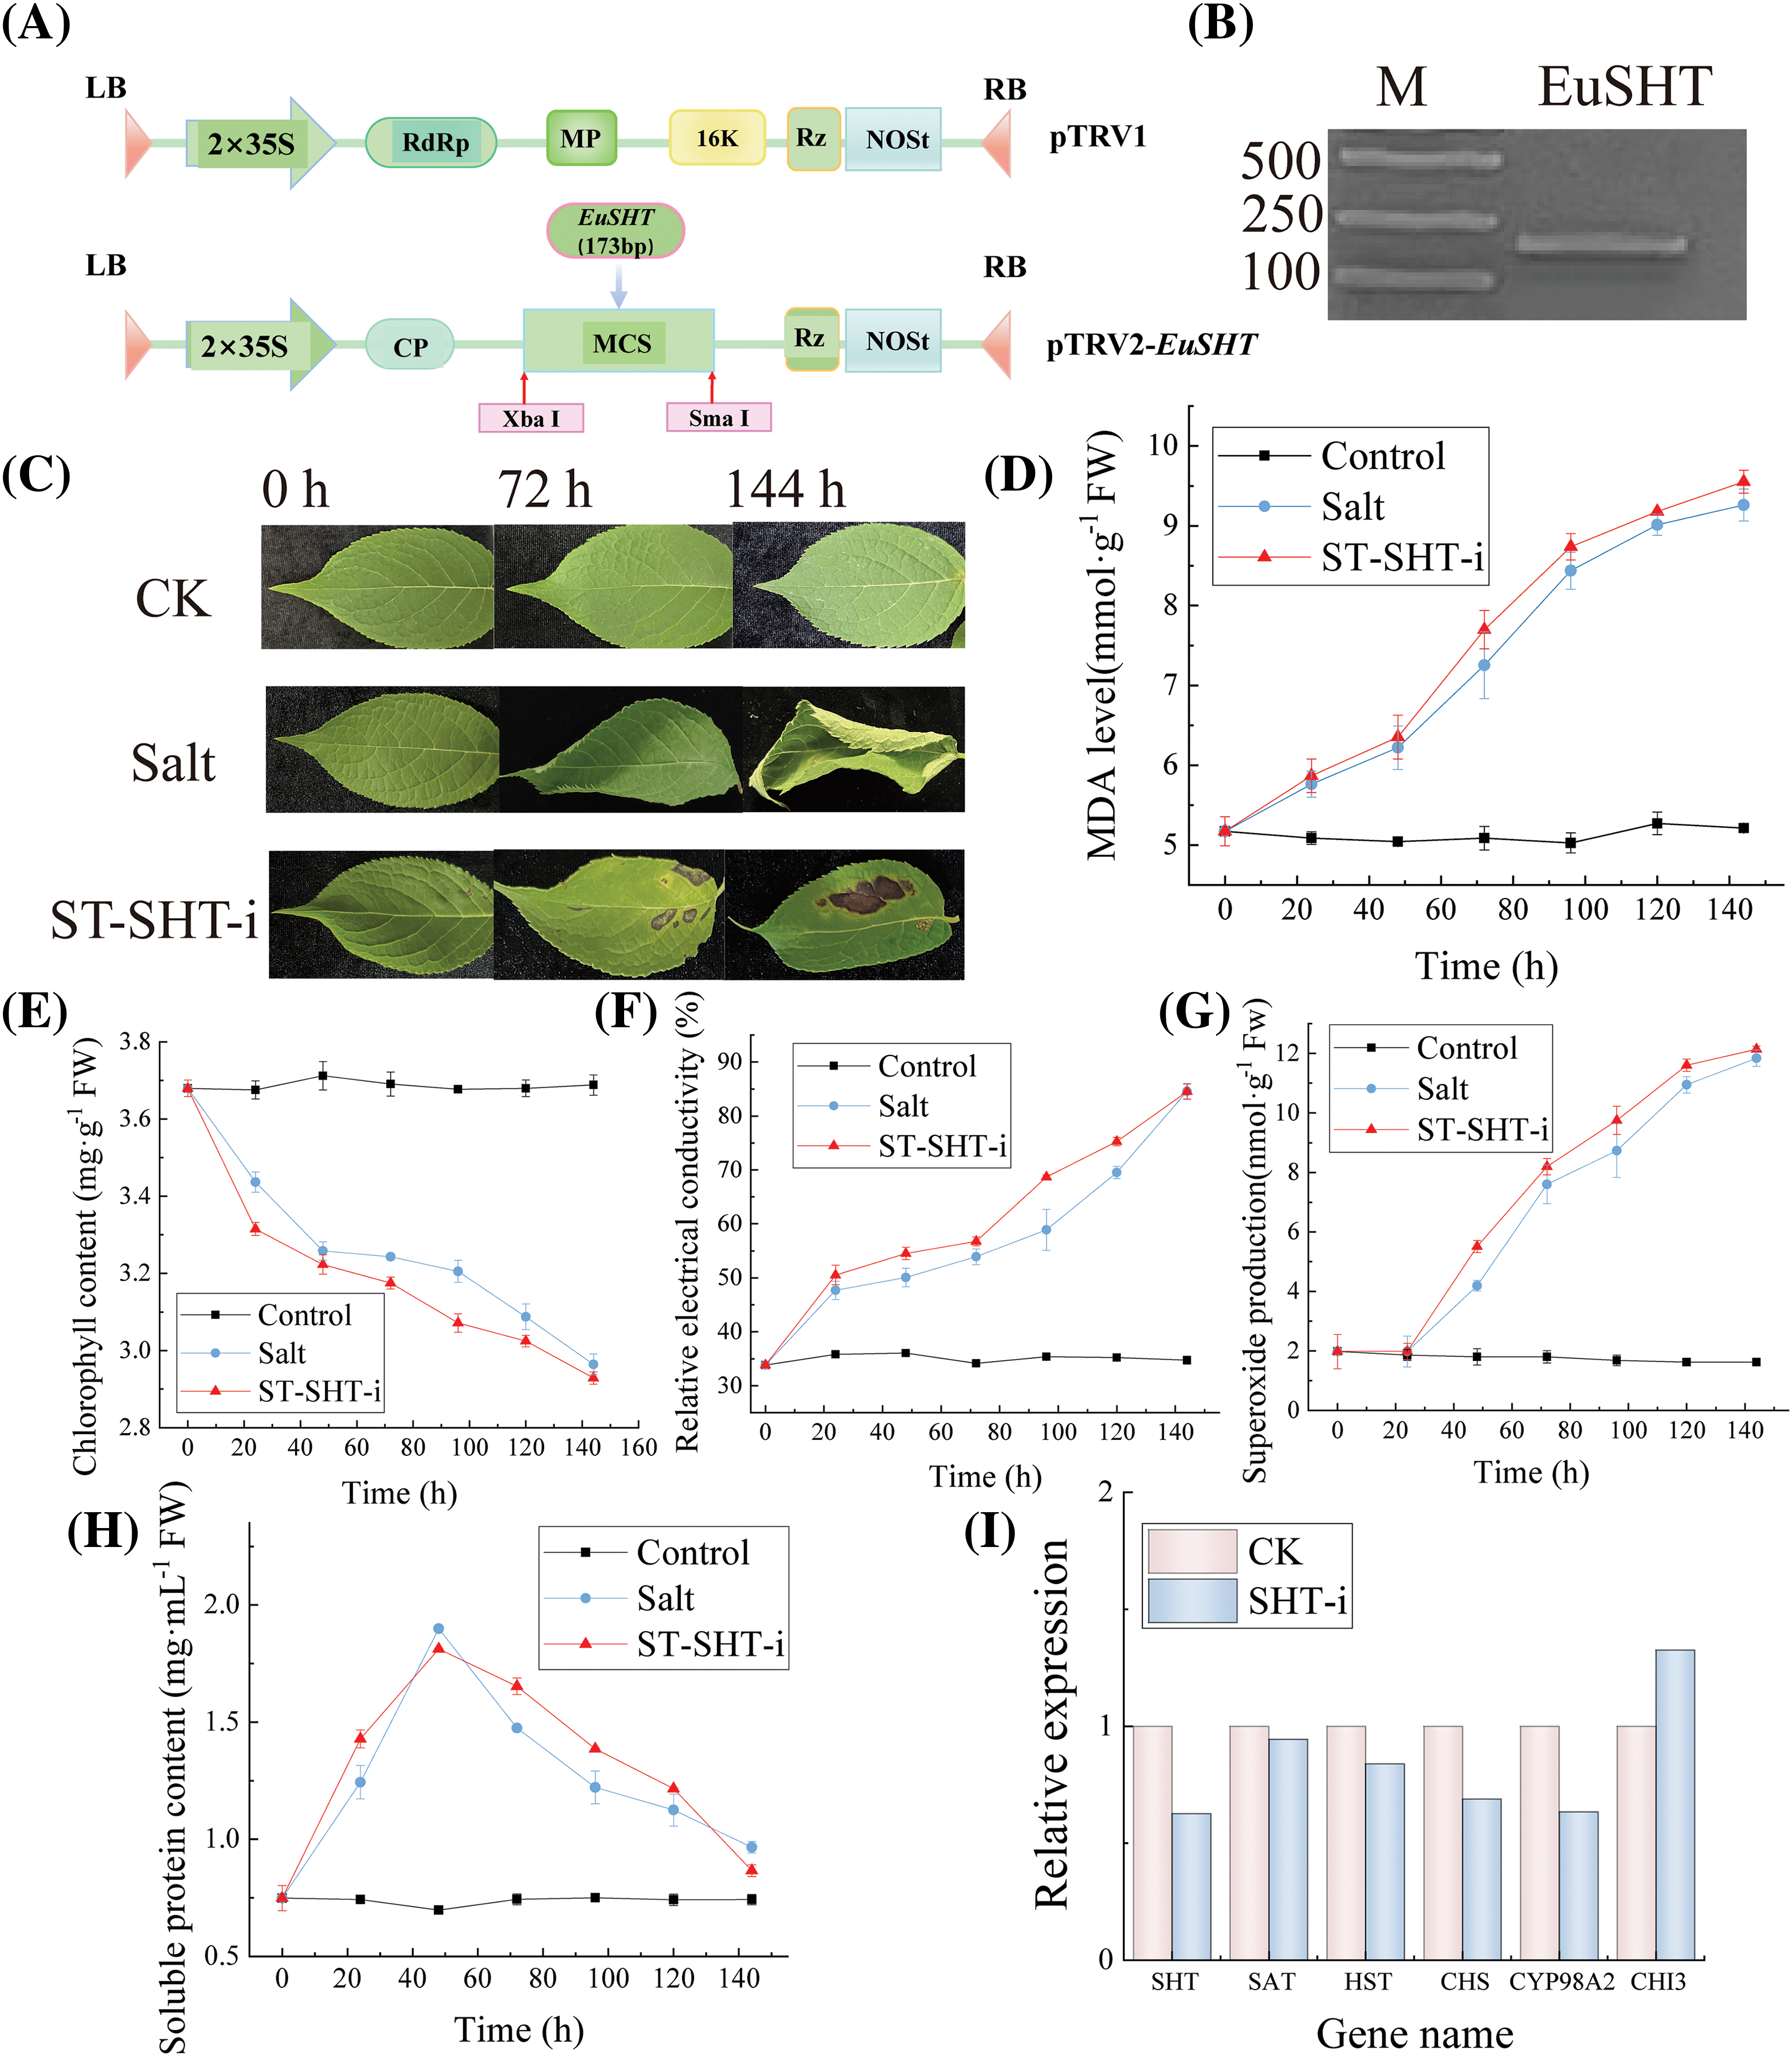
Figure 7: Virus-induced silencing of EuSHT. (A) Construction of recombinant vector pTRV2- EuSHT; (B) Results of cross-PCR of target gene fragment in bacterial liquid; (C) Phenotypic characteristics of E. ulmoides leaves under salt stress; (D) MDA content; (E) Chlorophyll content; (F) The relative electrical conductivity; (G) Superoxide anion production; (H) Soluble protein content; (I) Relative expression of EuSHT in CK and EuSHT-interfered line under salt stress
3.7 Flavonoid Biosynthesis Pathway Regulated by Salt Stress
Our study indicates that salt stress promotes the production of metabolites associated with flavonoid metabolism in E. ulmoides. Fig. 8 illustrates the biosynthesis and metabolism of flavonoids, demonstrating that salt stress enhances both the biosynthesis and metabolism of flavonoids. Metabolites significantly increased in association with flavonoid metabolism include 6-Hydroxyluteolin and Quercetin, with 6-Hydroxyluteolin showing the most pronounced upregulation. Among the biosynthesis process of flavonoids, the upregulation of 6-Hydroxyluteolin exhibits the most significant change (FC = 1.123).
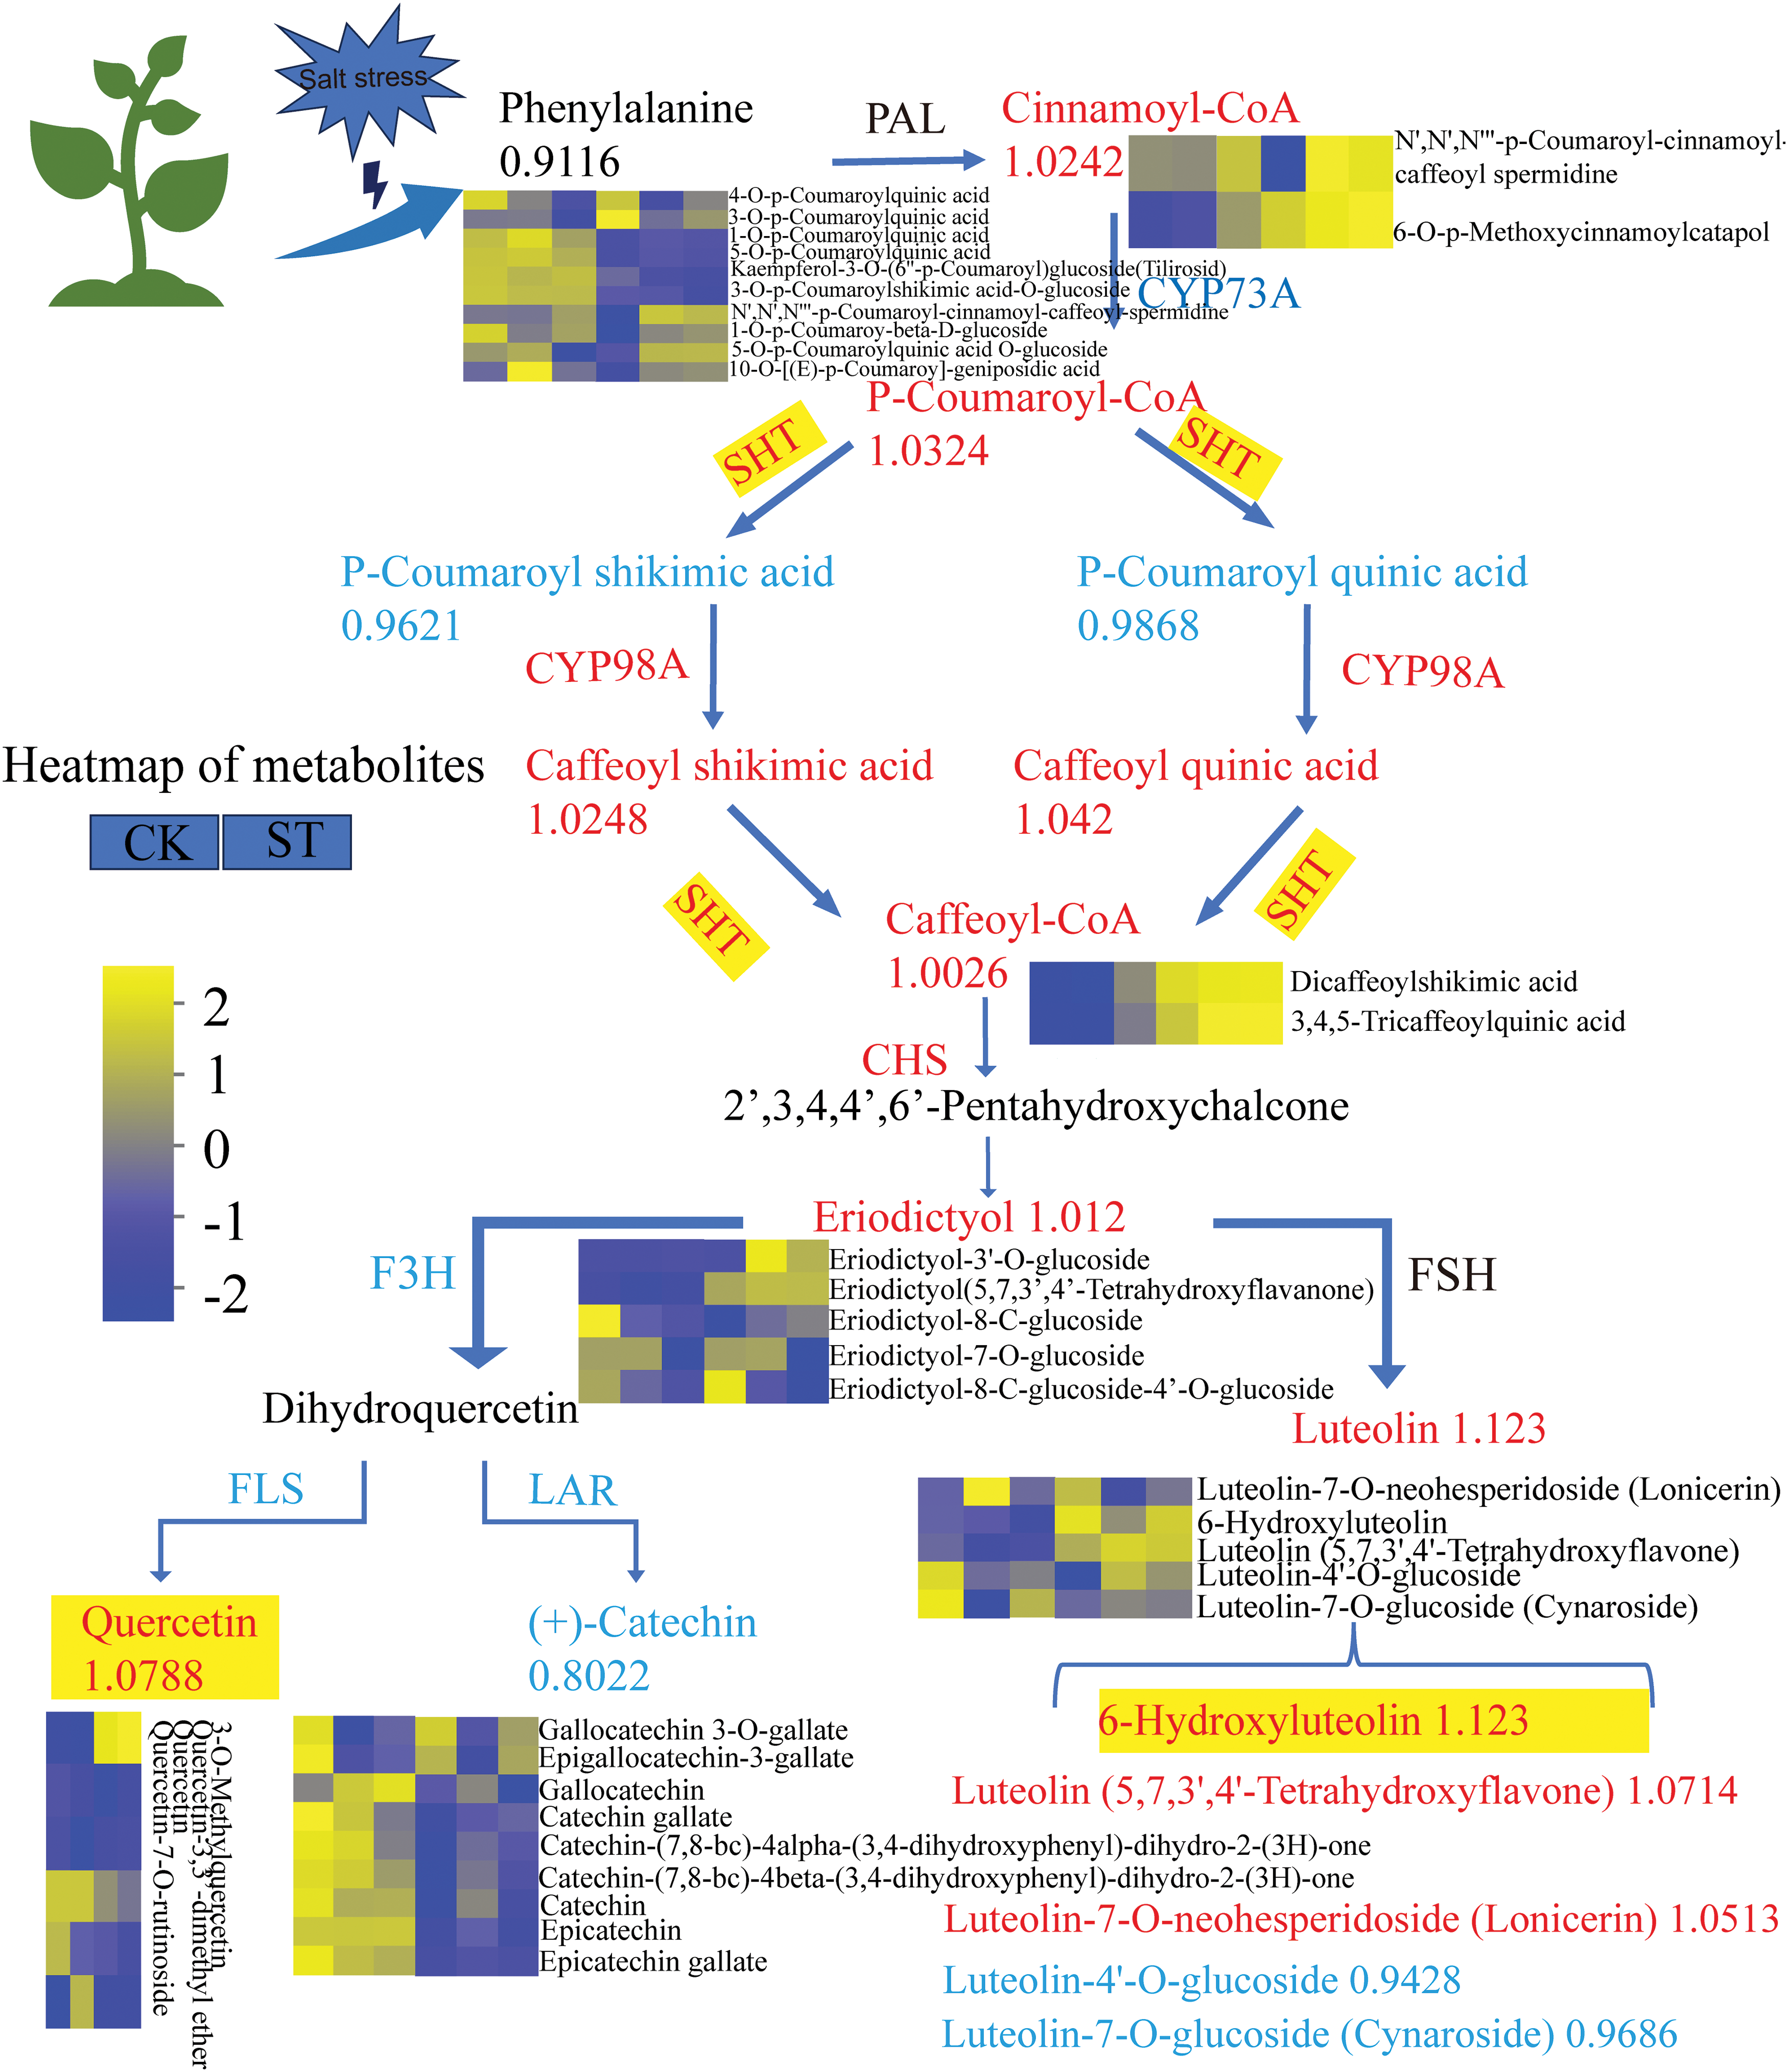
Figure 8: Schematic diagram of flavonoid biosynthesis pathways affected by salt stress in E. ulmoides. The heat map next to the metabolite shows the regulation of the expression of this metabolite by salt stress. Yellow represents an upward adjustment and blue represents a downward adjustment. Each column of the color legend in the figure represents a sample, and from left to right are the control and salt-stress-treated groups, respectively
4.1 The Effect of Salt Stress on E. ulmoides
During plant growth, various abiotic stresses can affect their development, with salt stress being one of the most common factors [1]. Soil salinization is becoming an increasingly serious issue in agriculture worldwide [23]. There are studies indicating that salt stress can induce the synthesis of flavonoid compounds [5]. Researchers have investigated the antioxidant properties of flavonoid compounds in Citrus [24], Artemisia argyi [25], Hordeum [26], and Helianthus tuberosus L. [27]. Salt stress can elevate the Luteolin content in cajabal by up-regulating the expression levels of CcPCL1 and CcF3H-5, leading to significantly improved salt tolerance in the plant [28]. Treatment with NaCl markedly enhances the levels of flavonoid glycosides in soybeans by elevating GMFNS-1 and GMFNS-2, suggesting a beneficial impact of flavonoid glycosides in mitigating salt stress [29]. Researchers have also found that flavonoids play a positive role in enhancing the resistance of Lycium barbarum to salt stress [30]. In our study, by measuring some physicochemical indicators during the growth process, we observed differences between the CK group and the ST group. The phenotypic status of E. ulmoides leaves was significantly affected after 144 h of salt stress. The leaves in the salt stress group exhibited obvious curling and wilting after 144 h. MDA levels and relative conductivity, as well as superoxide anion trends, increased gradually, indicating a rise in cellular damage. Chlorophyll content decreased progressively, while soluble protein content initially increased and then decreased. These indicators represent the extent of cellular damage. Furthermore, there was no significant difference between the gene silencing group and the salt stress group, suggesting that cells severely damaged by salt stress lose their regulatory capacity.
In our current study, we utilized GO enrichment analysis, KEGG pathway analysis, and GSEA analysis to report significantly associated metabolic pathways and genes related to flavonoid compounds under salt stress. The results indicated that the analysis identified the 16 most central genes associated with flavonoids, providing insights into how gene functions under salt stress may affect flavonoid metabolism.
4.3 Combination Analyses of Transcriptomic and Metabolomic Profiles
Integrating the results of metabolomics and transcriptomics, it was observed that the upregulation of metabolites highlighted in Fig. 8, namely Luteolin and Quercetin, the fold changes for the upregulation were relatively low, with increases of 1.123-fold for Luteolin and 1.0788-fold for Quercetin. Unlike previous findings from our research group, in C. sativus, key metabolites induced by preservatives, such as Rosmarinic acid-3′-O-glucoside and Dihydrochalcone-4′-O-glucoside, exhibited higher fold changes, reaching 2040-fold and 32.9805-fold, respectively [31]. Due to the abundant presence of phenylpropanoid compounds like flavonoids in C. sativus, along with the high constitutive expression of multiple enzymes responsible for their synthesis, the organism is readily responsive to preservative regulation. In this study, although flavonoid compounds were induced upregulation under salt stress, damage to Eucommia cells persisted. It is speculated that salt stress induced an upregulation of flavonoid metabolites, but the extent of this induction might not have been sufficient to adequately protect the cells. Consequently, it was difficult to suppress the damage to Eucommia cells under salt stress conditions.
According to the findings from the combined analysis of transcriptomics and metabolomics, SHT plays a pivotal regulatory function in the process of flavonoid production in E. ulmoides when exposed to salt stress. Previous research has indicated that SHT serves as the final divergence point of the HCAA branch pathway within the overall phenylpropanoid pathway. SHT, along with phenylalanine ammonia-lyase related enzymes HCBT, HHT1, and phenylalanine-related enzyme hydroxycinnamoyl-CoA, all belong to the Vb subfamily of the BAHD acyltransferase superfamily [32]. According to reports, SHT is involved in plant stress responses and can be used to remodel hydroxycinnamoyl amide (HCAA) metabolism in plants, thereby enhancing resistance to biotic or abiotic stress and improving the nutritional quality of agricultural products [33]. SHTs are key enzymes in HCAA biosynthesis and play an indispensable role in sunflower pollen [34]. In this study, it was found that the SHT gene can participate in the biosynthesis of flavonoids in E. ulmoides under salt stress and plays a very significant role.
Additionally, metabolomic analysis revealed that EuSHT also influences the biosynthesis of metabolites such as 6-Hydroxyluteolin, Catechin, and Quercetin. Luteolin belongs to the flavonoid subclass and is a common flavonoid compound found in various plants [35]. It is rich in various biological activities such as antioxidant, anti-inflammatory, antimicrobial, and cytotoxic effects [36]. Luteolin has been reported in Crepis incana [37]. Researchers have detected Luteolin and its derivatives (Luteolin 7-Oglucoside, 3′-methyl-Luteolin) in Cuminum cyminum [34], Petroselinum crispum [38] and Petroselinum sativum [39]. The results of integrated transcriptomics and metabolomics show that the metabolite that is upregulated in Fig. 5 is 6-Hydroxyluteolin. Some researchers have pointed out that salt stress can significantly induce genes involved in flavonoid biosynthesis and metabolites such as apigenin and luteolin. According to reports, abiotic stress stimulated the production of protective flavonoid compounds, while moderate cold increased the levels of luteolin glycosides in two pepper varieties [40]. Researchers have found that increasing salinity in nutrient solutions reduces the accumulation of macronutrients and micronutrients in leaves. However, it enhances antioxidant activity, total polyphenols, and luteolin content [41]. Studies have shown that using moderate salinity alone or in combination with elevated carbon dioxide concentrations can induce the production of phenolic compounds [42]. Specifically, when both salinity and elevated CO2 concentrations are present, higher levels of phenolic compounds, especially luteolin, have been observed [43]. This discovery suggested that 6-Hydroxyluteolin may be a key metabolite of E. ulmoides to salt stress, implying its beneficial role in enhancing salt stress tolerance in E. ulmoides. The results of this study highlight the crucial role of EuSHT in regulating flavonoid metabolism in E. ulmoides.
Catechin is a natural polyphenolic compound belonging to the flavan-3-ol class and is a member of the flavonoid family [44]. They possess antioxidant activity and can act as scavengers of free radicals. It has been reported that three Catechins, namely (+)-Catechin, epicatechin, and epigallocatechin gallate, play crucial roles in tea tree defense against grey blight [45]. The researchers found that drought stress induced the expression of phenylpropane and flavonoid biosynthesis pathways, thereby promoting Catechin biosynthesis, which plays a significant antioxidant role in tea trees under drought stress [46]. The research results of Kittipornkul indicate that Catechins can mitigate rice ozone stress by maintaining chlorophyll content, magnesium content, and stomatal conductance, and Catechins present in tea can be used as ozone protectants [47]. In this study, Catechins were found to be inhibited in E. ulmoides under salt stress, where it is a branch of Dihydroquercetin, while another branch, Quercetin, was positively regulated and showed an upward trend.
Quercetin is a specific subclass of flavonoid compounds known to promote various physiological processes in plants, such as seed germination, antioxidative mechanisms, and photobiosynthesis. It acts as a potent antioxidant, thereby effectively providing plants with tolerance to various biotic and abiotic stresses [48]. Study on wheat seedlings reported that an increase in Quercetin concentration leads to an increase in chlorophyll content [49]. In the current work, the upregulation of EuSHT expression in salt-stressed seedlings is consistent with the increase in Quercetin content. This may be attributed to EuSHT being a hub gene involved in the flavonoid biosynthesis pathway.
4.4 Analysis of Virus-Induced EuSHT Silencing
Through the utilization of VIGS, a potential key gene in E. ulmoides was confirmed. Eventually, 6-Hydroxyluteolin could serve as a major metabolite in response to salt stress. In this research, we extensively investigated the triggering of 6-hydroxyluteolin in E. ulmoides leaves and established that its buildup is connected to the upregulation of EuSHT in reaction to salt treatment. However, the mechanisms involving activation, regulation, and interaction with other proteins of EuSHT require further investigation.
The overall findings suggested that EuSHT functioned as central proteins in the biosynthesis of flavonoids in E. ulmoides under salt treatment. The alterations in the expression levels of these six genes observed in the RT-qPCR results were in line with the transcriptomic data, indicating the reliability of the transcriptomic data.
Salt stress-induced curling and wilting of E. ulmoides leaves, accompanied by a decrease in chlorophyll and soluble protein content, and significant induction of MDA levels, relative conductivity, and accumulation of superoxide anions. Additionally, salt stress treatment significantly induced the accumulation of flavonoid compounds. KEGG results reveal the enrichment of 68 genes in the flavonoid biosynthesis pathway, indicating that flavonoid biosynthesis is induced under salt stress. Among the significantly upregulated genes in the ST144 group, EuSHT participates in the key pathway “flavonoid biosynthesis (map00941)”. The results of the combined transcriptomic and metabolomic analysis indicate that EuSHT is a pivotal gene regulating flavonoid metabolism under salt stress in Eucommia, and substances such as 6-Hydroxyluteolin, Catechin, and Quercetin are key metabolites regulated by EuSHT. The results of gene silencing further confirm the central role of the EuSHT gene in the E. ulmoides salt stress process, revealing that EuSHT can promote the production of flavonoids. Based on transcriptomics, physiological indicators, functional gene confirmation through VIGS, and extensive targeted metabolomics data, proposed and discussed the potential molecular mechanisms by which salt stress induces flavonoid biosynthesis to enhance E. ulmoides resistance. The function of EuSHT was confirmed in the EuSHT silencing line of E. ulmoides.
The results of this study provide preliminary insights into the mechanisms by which salt stress induces flavonoid secondary metabolites in the medicinal plant E. ulmoides, and provide new theoretical support for discussing the mechanism of plant stress response. It also provided useful information for subsequent exploration of resistance genes in E. ulmoides.
Acknowledgement: None.
Funding Statement: This work was supported by the National Key Research and Development Program of China (2017YFC1600802). Henan Provincial Science and Technology Research Project, China (No. 232102110134).
Author Contributions: The authors confirm contribution to the paper as follows: study conception and design: Fuxin Li, Xin Li; data collection: Enyan Chen, Xinxin Chen; analysis and interpretation of results: Jingyu Jia, Hemin Wang, Jianrui Sun, Jie Zhang; draft manuscript preparation: Fuxin Li, Xin Li. All authors reviewed the results and approved the final version of the manuscript.
Availability of Data and Materials: All data and materials used in this research were publicly available. Raw sequence data from this study have been submitted to the NCBI sequence read archive under the BioProject Accession (PRJNA 741324).
Ethics Approval: Not applicable.
Conflicts of Interest: The authors declare that they have no conflicts of interest to report regarding the present study.
References
1. Xu Z, Zhou J, Ren T, Du H, Liu H, Li Y, et al. Salt stress decreases seedling growth and development but increases quercetin and kaempferol content in Apocynum venetum. Plant Biol. 2020;22(5):813–21. doi:10.1111/plb.v22.5. [Google Scholar] [CrossRef]
2. van Zelm E, Zhang Y, Testerink C. Salt tolerance mechanisms of plants. Annu Rev Plant Biol. 2020;71:403–33. doi:10.1146/annurev-arplant-050718-100005. [Google Scholar] [PubMed] [CrossRef]
3. Grotewold E. The genetics and biochemistry of floral pigments. Annu Rev Plant Biol. 2006;57:761–80. doi:10.1146/arplant.2006.57.issue-1. [Google Scholar] [CrossRef]
4. Honda C, Kotoda N, Wada M, Kondo S, Kobayashi S. Anthocyanin biosynthetic genes are coordinately expressed during red coloration in apple skin. Plant Physiol Biochem. 2002;40(11):955–62. [Google Scholar]
5. Shen N, Wang T, Gan Q, Liu S, Wang L, Jin B. Plant flavonoids: classification, distribution, biosynthesis, and antioxidant activity. Food Chem. 2022;383:132531. [Google Scholar] [PubMed]
6. Zulfiqar F, Nafees M, Moosa A, Ferrante A, Darras A. Melatonin induces proline, secondary metabolites, sugars and antioxidants activity to regulate oxidative stress and ROS scavenging in salt stressed sword lily. Heliyon. 2024;10(11):e32569. doi:10.1016/j.heliyon.2024.e32569. [Google Scholar] [PubMed] [CrossRef]
7. Kim J, Lee WJ, Vu TT, Jeong CY, Hong SW, Lee H. High accumulation of anthocyanins via the ectopic expression of AtDFR confers significant salt stress tolerance in Brassica napus L. Plant Cell Rep. 2017;36(8):1215–24. doi:10.1007/s00299-017-2147-7. [Google Scholar] [PubMed] [CrossRef]
8. Farooq M, Shahzad R, Sajjad M, Hassan Y, Shah A, Naz MM, et al. Differential variations in total flavonoid content and antioxidant enzymes activities in pea under different salt and drought stresses. Sci Hortic. 2021;287(1):110258. [Google Scholar]
9. Li G, Guo X, Sun Y, Gangurde SS, Zhang K, Weng F, et al. Physiological and biochemical mechanisms underlying the role of anthocyanin in acquired tolerance to salt stress in peanut (Arachis hypogaea L.). Front Plant Sci. 2024;15:1368260. doi:10.3389/fpls.2024.1368260. [Google Scholar] [PubMed] [CrossRef]
10. Grienenberger E, Besseau S, Geoffroy P, Debayle D, Heintz D, Lapierre C, et al. A BAHD acyltransferase is expressed in the tapetum of Arabidopsis anthers and is involved in the synthesis of hydroxycinnamoyl spermidines. Plant J. 2009;58(2):246–59. doi:10.1111/tpj.2009.58.issue-2. [Google Scholar] [CrossRef]
11. Luo J, Fuell C, Parr A, Hill L, Bailey P, Elliott K, et al. A novel polyamine acyltransferase responsible for the accumulation of spermidine conjugates in Arabidopsis seed. Plant Cell. 2009;21(1):318–33. doi:10.1105/tpc.108.063511. [Google Scholar] [PubMed] [CrossRef]
12. Bernard G, Buges J, Delporte M, Molinié R, Besseau S, Bouchereau A, et al. Consecutive action of two BAHD acyltransferases promotes tetracoumaroyl spermine accumulation in chicory. Plant Physiol. 2022;189(4):2029–43. doi:10.1093/plphys/kiac234. [Google Scholar] [PubMed] [CrossRef]
13. Wu M, Zhuang Q, Lin J, Peng Y, Luo F, Liu Z, et al. Enrichment of the flavonoid fraction from Eucommia ulmoides leaves by a liquid antisolvent precipitation method and evaluation of antioxidant activities in vitro and in vivo. RSC Adv. 2023;13(25):17406–19. doi:10.1039/D3RA00800B. [Google Scholar] [PubMed] [CrossRef]
14. Zhu MQ, Sun RC. Eucommia ulmoides Oliver: a potential feedstock for bioactive products. J Agric Food Chem. 2018;66(22):5433–8. doi:10.1021/acs.jafc.8b01312. [Google Scholar] [PubMed] [CrossRef]
15. Hussain T, Tan B, Liu G, Oladele OA, Rahu N, Tossou MC, et al. Health-promoting properties of Eucommia ulmoides: a review. Evid Based Complement Alternat Med. 2016;2016:5202908. [Google Scholar] [PubMed]
16. Li X, Liu X, Yin Y, Yu H, Zhang M, Jing H, et al. Transcriptomic analysis reveals key genes related to antioxidant mechanisms of Hylocereus undatus quality improvement by trypsin during storage. Food Funct. 2019;10(12):8116–28. doi:10.1039/C9FO00809H. [Google Scholar] [PubMed] [CrossRef]
17. Zuo Y, Li B, Guan S, Jia J, Xu X, Zhang Z, et al. EuRBG10 involved in indole alkaloids biosynthesis in Eucommia ulmoides induced by drought and salt stresses. J Plant Physiol. 2022;278:153813. doi:10.1016/j.jplph.2022.153813. [Google Scholar] [PubMed] [CrossRef]
18. Yang A, Yu L, Chen Z, Zhang S, Shi J, Zhao X, et al. Label-free quantitative proteomic analysis of chitosan oligosaccharide-treated rice infected with southern rice black-streaked dwarf virus. Viruses. 2017;9(5):115. [Google Scholar] [PubMed]
19. Yang J, Yang X, Kuang Z, Li B, Lu X, Cao X, et al. Selection of suitable reference genes for qRT-PCR expression analysis of Codonopsis pilosula under different experimental conditions. Mol Biol Rep. 2020;47(6):4169–81. doi:10.1007/s11033-020-05501-8. [Google Scholar] [PubMed] [CrossRef]
20. Abro BA, Memon M, Hassan ZU, Arain MY, Razaq A, Abro DA, et al. Assessing nitrogen nutrition of banana Basrai (Dwarf Cavendish) through leaf analysis and chlorophyll determination. Pak J Bot. 2021;53(5):1859–64. [Google Scholar]
21. Pang X, Zhao S, Zhang M, Cai L, Zhang Y, Li X. Catechin gallate acts as a key metabolite induced by trypsin in Hylocereus undatus during storage indicated by omics. Plant Physiol Biochem. 2021;158:497–507. doi:10.1016/j.plaphy.2020.11.036. [Google Scholar] [PubMed] [CrossRef]
22. Liang D, Shen Y, Ni Z, Wang Q, Lei Z, Xu N, et al. Exogenous melatonin application delays senescence of kiwifruit leaves by regulating the antioxidant capacity and biosynthesis of flavonoids. Front Plant Sci. 2018;9:426. doi:10.3389/fpls.2018.00426. [Google Scholar] [PubMed] [CrossRef]
23. Deinlein U, Stephan AB, Horie T, Luo W, Xu G, Schroeder JI. Plant salt-tolerance mechanisms. Trends Plant Sci. 2014;19(6):371–9. doi:10.1016/j.tplants.2014.02.001. [Google Scholar] [PubMed] [CrossRef]
24. Wang Y, Liu XJ, Chen JB, Cao JP, Li X, Sun CD. Citrus flavonoids and their antioxidant evaluation. Crit Rev Food Sci Nutr. 2022;62(14):3833–54. doi:10.1080/10408398.2020.1870035. [Google Scholar] [PubMed] [CrossRef]
25. Hu Q, Liu Z, Guo Y, Lu S, Du H, Cao Y. Antioxidant capacity of flavonoids from Folium Artemisiae Argyi and the molecular mechanism in Caenorhabditis elegans. J Ethnopharmacol. 2021;279:114398. doi:10.1016/j.jep.2021.114398. [Google Scholar] [PubMed] [CrossRef]
26. Kamiyama M, Shibamoto T. Flavonoids with potent antioxidant activity found in young green barley leaves. J Agric Food Chem. 2012;60(25):6260–7. doi:10.1021/jf301700j. [Google Scholar] [PubMed] [CrossRef]
27. Wang M, Ma Z, He C, Yuan X. The antioxidant activities of flavonoids in Jerusalem artichoke (Helianthus tuberosus L.) leaves and their quantitative analysis. Nat Prod Res. 2022;36(4):1009–13. doi:10.1080/14786419.2020.1839464. [Google Scholar] [PubMed] [CrossRef]
28. Song Z, Yang Q, Dong B, Li N, Wang M, Du T, et al. Melatonin enhances stress tolerance in pigeon pea by promoting flavonoid enrichment, particularly luteolin in response to salt stress. J Experi Bot. 2022;73(17):5992–6008. doi:10.1093/jxb/erac276. [Google Scholar] [PubMed] [CrossRef]
29. Yan J, Wang B, Jiang Y, Cheng L, Wu T. GmFNSII-controlled soybean flavone metabolism responds to abiotic stresses and regulates plant salt tolerance. Plant Cell Physiol. 2014;55(1):74–86. doi:10.1093/pcp/pct159. [Google Scholar] [PubMed] [CrossRef]
30. Qin X, Yin Y, Zhao J, An W, Fan Y, Liang X, et al. Metabolomic and transcriptomic analysis of Lycium chinese and L. ruthenicum under salinity stress. BMC Plant Biol. 2022;22(1):8. doi:10.1186/s12870-021-03375-x. [Google Scholar] [PubMed] [CrossRef]
31. Wang J, Tian P, Sun J, Li B, Jia J, Yuan J, et al. CsMYC2 is involved in the regulation of phenylpropanoid biosynthesis induced by trypsin in cucumber (Cucumis sativus) during storage. Plant Physiol Biochem. 2023;196:65–74. doi:10.1016/j.plaphy.2023.01.041. [Google Scholar] [PubMed] [CrossRef]
32. Elejalde-Palmett C, de Bernonville TD, Glevarec G, Pichon O, Papon N, Courdavault V, et al. Characterization of a spermidine hydroxycinnamoyltransferase in Malus domestica highlights the evolutionary conservation of trihydroxycinnamoyl spermidines in pollen coat of core Eudicotyledons. J Expe Bot. 2015;66(22):7271–85. doi:10.1093/jxb/erv423. [Google Scholar] [PubMed] [CrossRef]
33. Peng H, Yang T, Whitaker BD, Trouth F, Shangguan L, Dong W, et al. Characterization of spermidine hydroxycinnamoyl transferases from eggplant (Solanum melongena L.) and its wild relative Solanum richardii Dunal. Hortic Res. 2016;3:16062. doi:10.1038/hortres.2016.62. [Google Scholar] [PubMed] [CrossRef]
34. Li S, Yaermaimaiti S, Tian XM, Wang ZW, Xu WJ, Luo J, et al. Dynamic metabolic and transcriptomic profiling reveals the biosynthetic characteristics of hydroxycinnamic acid amides (HCAAs) in sunflower pollen. Food Res Intern. 2021;149:110678. doi:10.1016/j.foodres.2021.110678. [Google Scholar] [PubMed] [CrossRef]
35. Arampatzis AS, Pampori A, Droutsa E, Laskari M, Karakostas P, Tsalikis L, et al. Occurrence of luteolin in the Greek Flora, isolation of luteolin and its action for the treatment of periodontal diseases. Molecules. 2023;28(23):7720. [Google Scholar] [PubMed]
36. Proestos C, Chorianopoulos N, Nychas GJ, Komaitis M. RP-HPLC analysis of the phenolic compounds of plant extracts. investigation of their antioxidant capacity and antimicrobial activity. J Agric Chem. 2005;53(4):1190–5. doi:10.1021/jf040083t. [Google Scholar] [PubMed] [CrossRef]
37. Christina B, Ana C, Marina S, Michael T, Helen S. Phytochemical investigation of Crepis incana Sm. (Asteraceae) endemic to southern Greece. Biochem Sys Ecol. 2018;80:59–62. doi:10.1016/j.bse.2018.06.009. [Google Scholar] [CrossRef]
38. Anastasia B, Catherine C, Ifigeneia M, Avramidou E, Ganopoulos I. Evaluation of parsley (Petroselinum crispum) germplasm diversity from the Greek Gene Bank using morphological, molecular and metabolic markers. Ind Crops Prod. 2021;170:113767. [Google Scholar]
39. Slighoua M, Mahdi I, Amrati FZ, Cristo FD, Amaghnouje A, Grafov F, et al. Assessment of in vivo estrogenic and anti-inflammatory activities of the hydro-ethanolic extract and polyphenolic fraction of parsley (Petroselinum sativum Hoffm). J Ethnopharmacol. 2021;30(265):113290. [Google Scholar]
40. Skodra C, Michailidis M, Dasenaki M, Ganopoulos I, Thomaidis NS, Tanou G, et al. Unraveling salt-responsive tissue-specific metabolic pathways in olive tree. Physiol Plantarum. 2021;173:13565. [Google Scholar]
41. Genzel F, Dicke MD, Junker-Frohn LV, Neuwohner A, Thiele B, Putz A, et al. Impact of moderate cold and salt stress on the accumulation of antioxidant flavonoids in the leaves of two capsicum cultivars. J Agric Food Chem. 2021;69(23):6431–43. doi:10.1021/acs.jafc.1c00908. [Google Scholar] [PubMed] [CrossRef]
42. Colla G, Rouphael Y, Cardarelli M, Svecova E, Rea E, Lucini L. Effects of saline stress on mineral composition, phenolic acids and flavonoids in leaves of artichoke and cardoon genotypes grown in floating system. J Sci Food Agric. 2013;93(5):1119–27. doi:10.1002/jsfa.2013.93.issue-5. [Google Scholar] [CrossRef]
43. Sgherri C, Pérez-López U, Micaelli F, Miranda-Apodaca J, Mena-Petite A, Muñoz-Rueda A, et al. Elevated CO2 and salinity are responsible for phenolics-enrichment in two differently pigmented lettuces. Plant Physiol Biochem: PPB. 2017;115:269–78. doi:10.1016/j.plaphy.2017.04.006. [Google Scholar] [PubMed] [CrossRef]
44. Bernatoniene J, Kopustinskiene DM. The role of catechins in cellular responses to oxidative stress. Molecules. 2018;23(4):965. [Google Scholar] [PubMed]
45. Li X, Zhang J, Lin S, Xing Y, Zhang X, Ye M, et al. (+)-Catechin, epicatechin and epigallocatechin gallate are important inducible defensive compounds against Ectropis grisescens in tea plants. Plant, Cell Environ. 2022;45(2):496–511. doi:10.1111/pce.v45.2. [Google Scholar] [CrossRef]
46. Lv Z, Zhang C, Shao C, Liu B, Liu E, Yuan D, et al. Research progress on the response of tea catechins to drought stress. J Sci Food Agric. 2021;101(13):5305–13. doi:10.1002/jsfa.v101.13. [Google Scholar] [CrossRef]
47. Kittipornkul P, Treesubsuntorn C, Thiravetyan P. Effect of exogenous catechin and salicylic acid on rice productivity under ozone stress: the role of chlorophyll contents, lipid peroxidation, and antioxidant enzymes. Environ Sci Pollut Res Int. 2020;27(20):25774–84. doi:10.1007/s11356-020-08962-3. [Google Scholar] [PubMed] [CrossRef]
48. Singh P, Arif Y, Bajguz A, Hayat S. The role of quercetin in plants. Plant Physiol Biochem. 2021;166:10–9. doi:10.1016/j.plaphy.2021.05.023. [Google Scholar] [PubMed] [CrossRef]
49. Jańczak-Pieniążek M, Migut D, Piechowiak T, Buczek J, Balawejder M. The effect of exogenous application of quercetin derivative solutions on the course of physiological and biochemical processes in wheat seedlings. Int J Mol Sci. 2021;22(13):6882. doi:10.3390/ijms22136882. [Google Scholar] [PubMed] [CrossRef]
Cite This Article
 Copyright © 2024 The Author(s). Published by Tech Science Press.
This work is licensed under a Creative Commons Attribution 4.0 International License , which permits unrestricted use, distribution, and reproduction in any medium, provided the original work is properly cited.
 Downloads
 Citation Tools