
 Submit a Paper
 Propose a Special lssue
 Open Access
ARTICLE

The Impact of Sulfur Fertilizer Concentration on the Nutrient Concentration of Parts of the Soybean Plant
College of Agriculture, Agricultural College of Northeast Agricultural University, Harbin, 150030, China
* Corresponding Author: Shoukun Dong. Email:
Phyton-International Journal of Experimental Botany 2024, 93(8), 1851-1873. https://doi.org/10.32604/phyton.2024.051671
Received 12 March 2024; Accepted 26 June 2024; Issue published 30 August 2024
 View Full Text
 Download PDF
Abstract
Soybean is a crucial crop utilized for both food and oil production, with balanced crop nutrition being a key determinant of soybean yield throughout its growth cycle. Sulfur, an essential nutrient for crop growth, substantially impacts soybean yield. In this study, two soybean cultivars, Laidou 2 and Hefeng 55, were used to study the changes in nitrogen, phosphorus, potassium, and sulfur contents in soybean plants at different growth stages. Additionally, the effects of dry matter accumulation under five different sulfur levels were examined. The results showed that the sulfur levels had varying effects on the nitrogen, phosphorus, potassium, and sulfur contents and accumulation in different parts of the soybean plants. There were marked differences in the accumulation and distribution of dry matter in different parts of the soybean plant. Soybean dry matter weight shows the best overall performance under the S80 treatment. With increasing sulfur nutrition, the nitrogen, phosphorus, potassium, and sulfur contents in various plant parts exhibited an unimodal trend, reaching maximum values when the sulfur content was 80 mg/L. This study elucidates the dynamic changes in nutrient elements in soybeans under different sulfur levels and is important in guiding the rational application of sulfur fertilizers in agricultural production.Keywords
Soybean is a primary food crop and is abundant in a diverse range of health-promoting constituents, such as minerals, proteins, unsaturated fatty acids, and dietary fiber [1,2]. In addition to its crucial role in human nutrition, soybean also serves as a preferred raw material for animal feed and vegetable oil production. Recent technological advancements have led to an increased utilization of soybeans in processing [3] and the food industry [4], consequently driving up the global demand for this versatile crop.
Sulfur is involved in numerous physiological and biochemical reactions in plants [5]. It substantially influences plant growth, development, and grain yield and serves as an essential nutrient for the overall growth and development of all plant species [6]. Sulfur plays a pivotal role in regulating the levels of reactive oxygen species (ROS), preserving cell membrane integrity [7], and detoxifying organic toxins [8]. Compared to other crops, soybean cultivation requires greater protein, amino acid, and antioxidant synthesis. Sulfur is the primary synthetic element required in these processes. Therefore, augmenting sulfur supply can enhance soybean yield and quality while improving plant growth and stress resistance.
In the field, crops obtain sulfur mainly through the absorption of soil sulfate by their roots, a very small part of which comes from leaf absorption [9]. Sulfur in soil not only originates from atmospheric precipitation, decomposition of organic matter, and sulfur in fertilizer but may also be affected by human activities (such as industrial emissions). Maintenance of appropriate sulfur concentration in the soil is crucial for crop growth, as both sulfur deficiency and excess can substantially affect the absorption of other essential elements by crops. In daily production, the role of sulfur fertilizers in improving crop yield and quality is often overlooked, resulting in severe sulfur deficiency in the soil. Soil sulfur deficiency during crop growth has become an increasingly serious global problem in many regions [10]. A previous study noted the influence of sulfur on the main nutrients and differences in dry matter accumulation at different growth stages of soybean plants [11]. However, the specific influence of sulfur concentration on the dynamics of nutrient accumulation at different growth stages is unknown. In this study, two soybean varieties were investigated to determine the dry matter and nutrient concentrations of different plant parts under five concentrations of sulfur supply at two developmental stages: seedling and flowering. This not only fills the data gap in this field of study but also provides an important data reference for clarifying the appropriate sulfur application in field production.
For this experiment, the high-yield, high-quality, and disease-resistant soybean varieties, Laidou 2 and Hefeng 55, were chosen. The experiment was conducted in a glass rain shelter at the experimental station of Northeast Agricultural University, Harbin, China. The pot-planting method was adopted, using uniformly-sized plastic barrels (28 cm in diameter and 30 cm in height) that were with holes at the bottom. A gauze was placed at the bottom of the barrel and vermiculite was added. Soybean seeds with full and uniform grains were selected for sowing and eight seeds were planted in each pot.
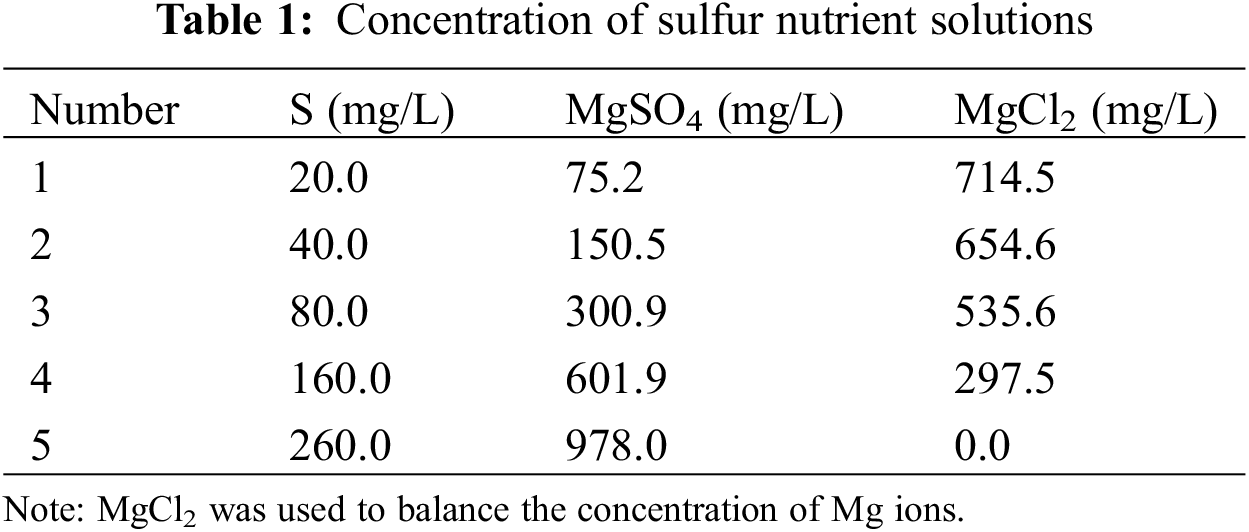
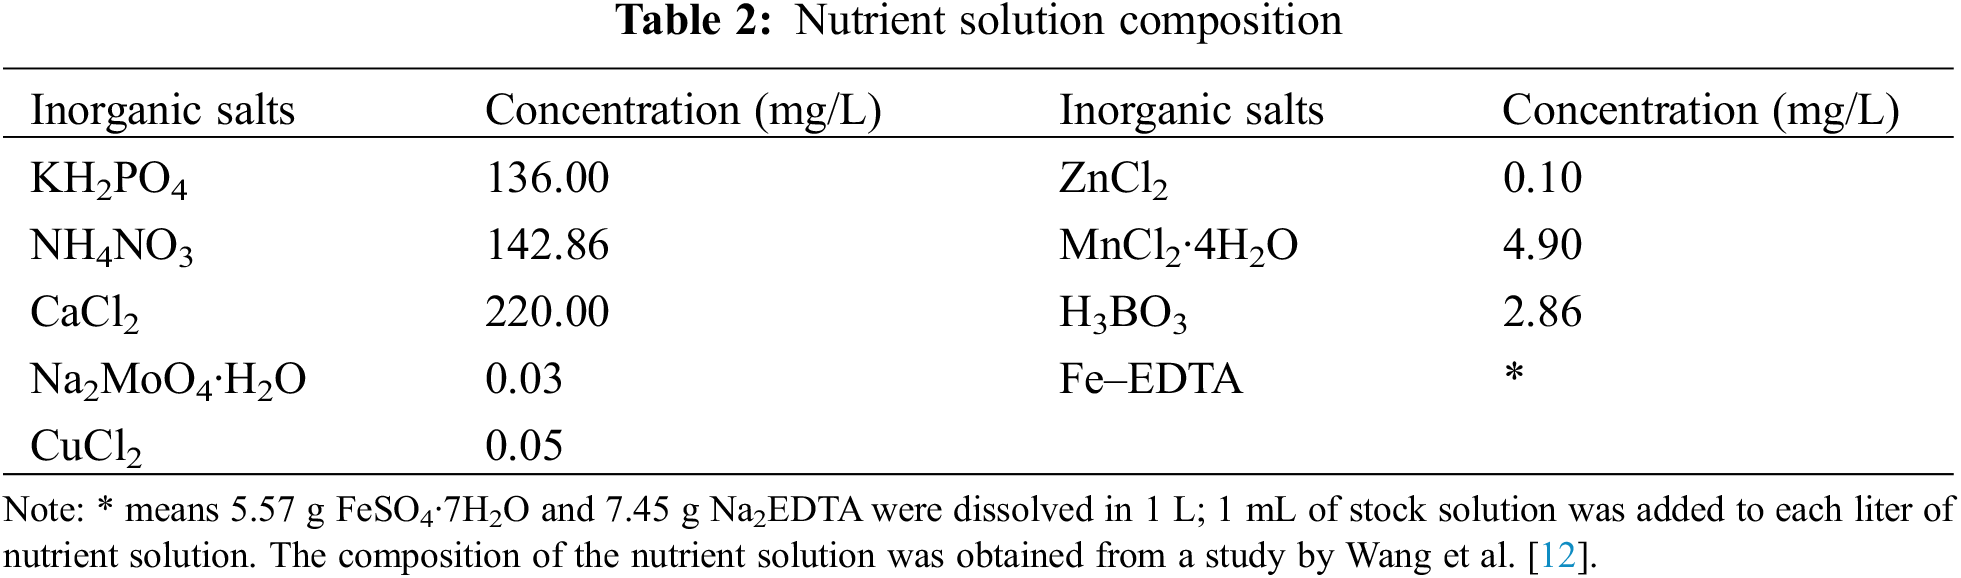
The trial started on 24 July. An amount of 500 mL of distilled water was used to water the seedlings once a day until the opposite true leaves were apparent. After spreading of opposite true leaves, the seedlings were thinned and four soybean plants with uniform growth were retained in each pot. On 2 August, the two compound leaf stages (V2 stage) were treated with sulfur, and the nutrient solution, composed of distilled water, was applied once every morning and night until the end of the experiment. Five different sulfur concentrations were used in the test, corresponding to the concentrations of sulfur in the nutrient solutions of 20.0, 40.0, 80.0, 160.0, and 260.0 mg/L (Table 1). And the detailed composition and concentration of the nutrient solution are shown in Table 2. Distilled water was used every three days to prevent salt accumulation. Samples were collected on days 27 (seedling stage) and 40 (flowering stage) after the start of the experiment. The samples were collected from 08:30–09:30 at all periods; the leaves were collected, wrapped in tin foil, and put into liquid nitrogen for instant freezing, and then stored in an ultra-low temperature refrigerator at –80°C until testing. The treatment was repeated three times per pot. The aboveground parts of the plants were cut from the cotyledon marks, and the underground parts were washed with water, brought back to the laboratory for a sampling of the roots, stems, and leaf stalks, and placed in envelopes. The samples were heated at 105°C for 30 min, followed by drying at 80°C until a constant weight was achieved. After weighing, the samples were crushed and analyzed.
2.2 Determination of Physiological Indicators
2.2.1 Measurement of Plant Dry Weight
Three pots were randomly selected for each treatment and three plants were selected from each pot. After sampling, the plants are divided into different parts, such as roots, stems, and leaves. These samples were then placed in kraft bags and blanched at 105°C for 30 min. After that, they were dried at 80°C until a constant weight was achieved. A balance was then used to weigh the samples.
2.2.2 Determination of Total Nitrogen Concentration in Each Part of the Plant
After measuring the dry weight of the plants, the samples were ground into powder for nutrient element determination. The total nitrogen concentration of various plant parts was determined using the Kjeldahl method [2]. After accurately weighing 0.2 g of the finely ground samples, the samples were transferred into a digestion tube and mixed with 10 mL of a 10% sodium hydroxide (NaOH) solution. Approximately 2 g of sodium oxide (Na2O2) was added as an oxidant to expedite the oxidation of organic nitrogen in the samples. Subsequently, the reagent-treated sample was placed in a digestion furnace and heated to ~350°C for approximately one hour until complete dissolution occurred. Throughout the digestion process, ammonia gas was released from the sample and subsequently condensed and collected in a receiving bottle as ammonia water. To absorb and dilute the ammonia gas, water containing 2% boric acid was introduced into the receiving bottle. Subsequently, 50 ml of the saturated boric acid solution was titrated against the collected ammonia water using hydrochloric acid (HCl) as the acidic titrant. The titration process was stopped when the pH reached approximately 4.5. Finally, data analysis and standard curve calculations were used to produce the relevant results.
2.2.3 Determination of Total Phosphorus Concentration in Each Part of the Plant
The total phosphorus concentration in various parts was determined using the molybdenum antimony anti-colorimetric method [13]. The 0.2 g sample was diluted with water to 30, and 5 mL of the molybdenum antimony coloring agent was added. The volume was adjusted to obtain a series of solutions with phosphorus concentrations of 0.0, 0.1, 0.2, 0.3, 0.4, 0.5, and 0.6 ug/mL. After standing at a temperature above 20°C for 30 min, the instrument was calibrated to zero using a solution with zero phosphorus concentrations, and colorimetric measurement was performed at a wavelength of 700 nm. Finally, the phosphorus concentration of each plant part was determined.
2.2.4 Method for Determining the Total Potassium Concentration in Each Part of the Plant
The total potassium concentration of various parts was determined using flame photometry [14]. Powdered samples (0.2 g) were dissolved in hydrochloric acid, heated for extraction, and filtered to remove the remaining solid particles. The pH of the extract was adjusted to the appropriate range, and flame photometry was performed. Simultaneously, a series of standard solutions with different potassium concentrations were prepared using standard solutions of known concentrations. The potassium concentration in each sample was determined using a standard curve based on the spectral line intensity of the sample extract.
2.2.5 Method for Determining the Total Sulfur Concentration in Various Plant Parts
The total sulfur concentration of various plant parts was determined using the barium sulfate turbidity method [15]. The powdered samples were extracted by heating after adding 30% hydrogen peroxide (H2O2). Excess barium sulfate (BaSO4) solution was added to the extraction solution to form a white barium sulfate precipitate, which was filtered. The barium sulfate precipitate was washed with an appropriate amount of distilled water, impurities were removed, and the precipitate was then dried in an oven to a constant weight. After drying, the precipitated barium sulfate was weighed, and the sulfur concentration in the sample was calculated.
All data were analyzed for correlations between sulfur concentration and nutrient elements or dry weight using IBM SPSS (Version 21.0; IBM Corporation, Armonk, NY, USA) using Duncan’s one-way analysis of variance. Bar chart analysis was performed using Microsoft Office Excel 2021 and analysis tables were generated using Microsoft Office Word 2021.
3.1 Effect of Sulfur Concentration on Dry Matter Accumulation in Soybean Plants
3.1.1 Dry Matter Accumulation in Soybean Plant
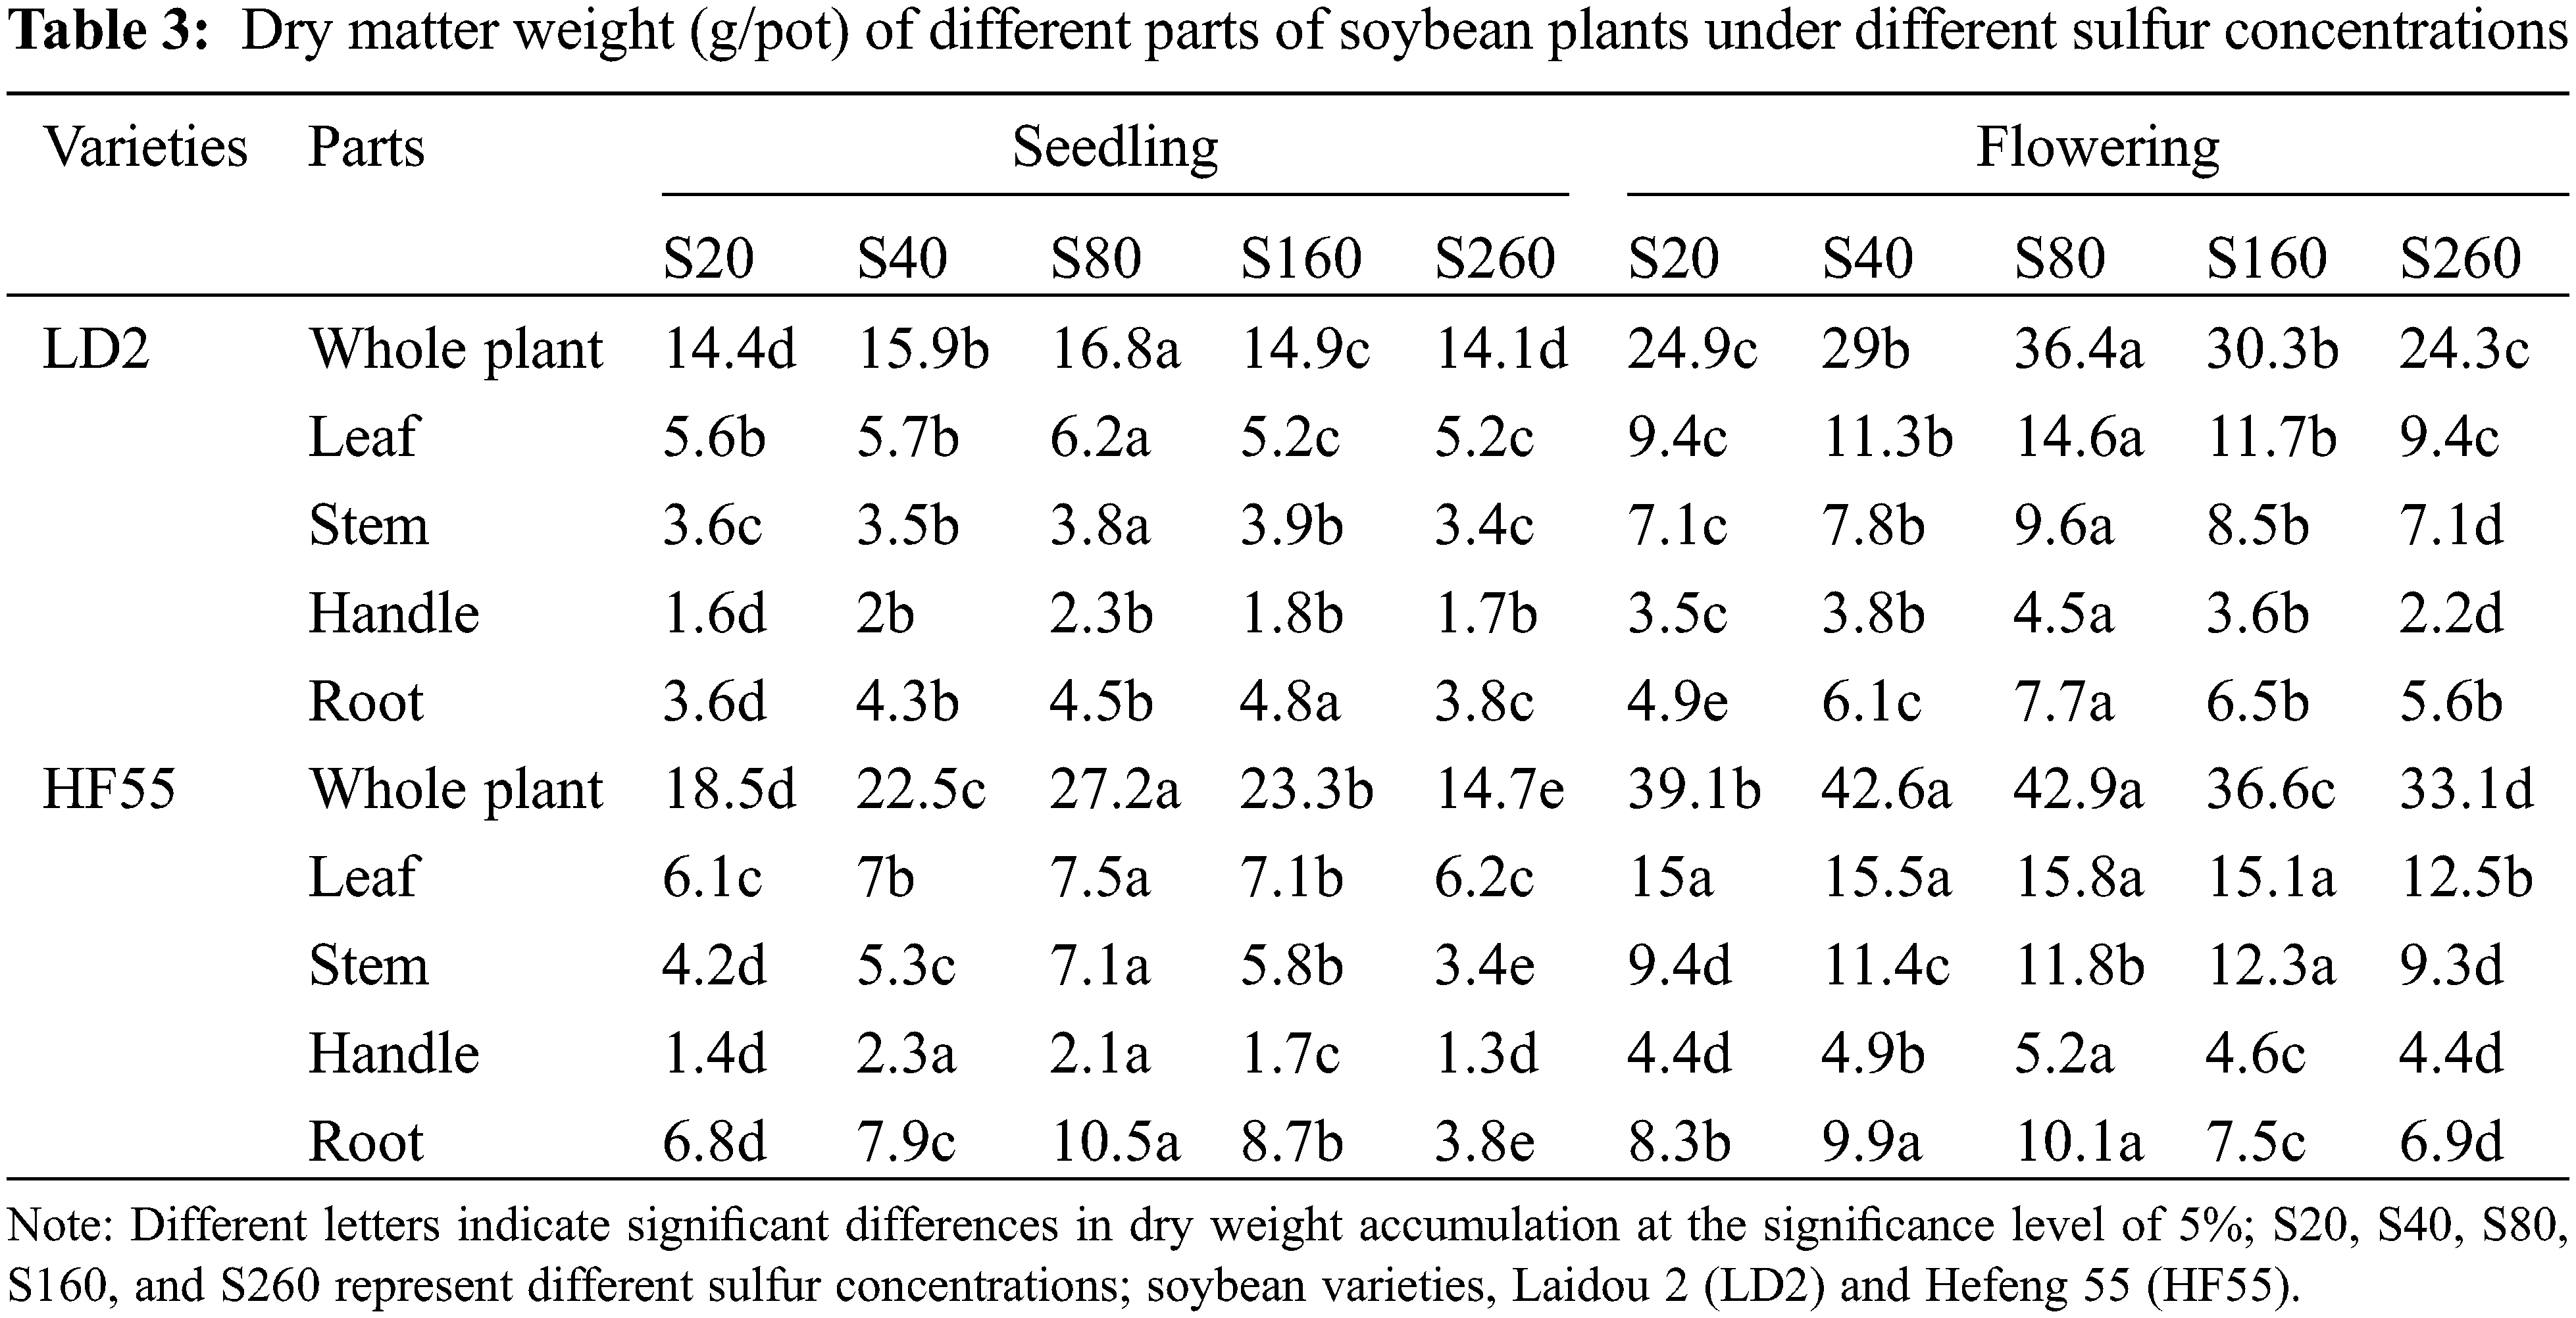
Sulfur nutrition had a marked effect on dry matter accumulation in whole soybean plants (Table 3). Dry matter accumulation of whole plants at the flowering stage was substantially higher than that at the seedling stage, and there were differences in dry matter accumulation among the different varieties. With increasing sulfur concentration, the dry matter accumulation of soybean plants first increased and then decreased. When the concentration of sulfur in the nutrient solution was 80 mg/L, dry matter accumulation reached its maximum value, which was substantially higher than that of the other treatments. The dry matter accumulation in the two varieties at the seedling and flowering stages was similar.
At the seedling stage, dry matter accumulation in Hefeng 55 was substantially greater than that in Laidou 2. There were statistical differences between the two treatments at 20 mg/L and 260 mg/L for Laidou 2, and Hefeng 55.
At the flowering stage, dry matter accumulation in Hefeng 55 was substantially higher than that in Laidou 2. Dry matter accumulation in Laidou 2 at 40 and 80 mg/L was similar, and there was a marked difference from the other treatments. There was no statistical difference between the two treatments of Hefeng 55 at 40 and 160 mg/L or 20 and 260 mg/L, but these were different from the other treatments.
3.1.2 Dry Matter Accumulation in Different Parts of the Plant
Sulfur nutrition had a substantial effect on dry matter accumulation in soybean leaves, stems, petioles, and roots (Table 3). Dry matter accumulation at the flowering stage was substantially higher than at the seedling stage, and there were differences in dry matter accumulation among the varieties. The accumulation of dry matter in all parts of the soybean first increased and then decreased with an increase in sulfur concentration.
For dry matter accumulation in the soybean leaves, the maximum value was reached when the sulfur concentration in the nutrient solution was 80 mg/L, which was substantially higher than in the other treatments. The dry matter accumulation of the two varieties showed the same pattern during the seedling and flowering stages. The stem dry matter accumulation of soybeans reached its maximum value in the S160 treatment at the seedling stage, Hefeng 55 in the S80 treatment, Laidou 2 in the S80 treatment at the flowering stage, and Hefeng 55 in the S160 treatment. Leaf petiole dry matter accumulation reached its maximum value in the S80 treatment at the seedling stage, Hefeng 55 in the S40 treatment, and Laidou 2 and Hefeng 55 in the S80 treatment at the flowering stage. Root dry matter accumulation reached a maximum value under the S160 treatment for Laidou 2 and the S80 treatment for Hefeng 55 at the seedling stage. At the flowering stage, Laidou 2 Hefeng 55 reached its maximum value under the S80 treatment.
At the soybean seedling stage, dry matter accumulation in the leaves of Hefeng 55 was substantially greater than that in Laidou 2. There was no statistical difference between 20 and 40 mg/L for Laidou 2 between 160 and 260 mg/L, between other treatments, 40 and 160 mg/L for Hefeng 55, or 20 and 260 mg/L for Laidou 2. The differences between the other treatments were substantial, and the stem dry matter accumulation of Hefeng 55 was substantially greater than that of Laidou 2. There was no statistical difference between 40 and 160 mg/L of Laidou 2, 20 and 260 mg/L of Laidou 2, other treatments, or in Hefeng 55. There was no marked difference in petiole dry matter accumulation between Hefeng 55 and Laidou 2; Laidou 2 treatments at 40, 160, and 260 mg/L; between other treatments; between Hefeng 55 treatments at 20 and 260 mg/L; and between the other treatments. The accumulation of dry matter in the roots of Hefeng 55 was substantially greater than that of Laidou 2. There were statistical differences in the Laidou 2 treatments, and no marked differences between the Hefeng 55 treatments at 40 and 80 mg/L, or among the other treatments.
At the flowering stage of soybeans, dry matter accumulation in the leaves of Hefeng 55 was substantially greater than that in Laidou 2. There was no marked difference between the two treatments at 40 and 160 mg/L for Laidou 2, between the two treatments at 20 and 260 mg/L, or between the other treatments. There was no marked difference between the four treatments of 20, 40, 80, and 160 mg/L for Hefeng No. 55; however, there was a substantial difference between the other treatments. Accumulation of dry matter in the stems of Hefeng 55 plants was substantially higher than that in Laidou 2 plants at the flowering stage. There was no marked difference between 40 and 160 mg/L for the Laidou 2 treatment, between other treatments, or in the Hefeng 55 treatment. The accumulation of dry matter in the petioles of Hefeng 55 was substantially higher than that in Laidou 2 at the flowering stage. There was no marked difference between the two treatments of 20 and 260 mg/L for Laidou 2, but there was a difference between the other treatments. There was no marked difference between the two treatments at 40 and 160 mg/L for Hefeng 55; however, there was a marked difference between the other treatments. At the flowering stage, the accumulation of dry matter in the roots of Hefeng 55 was substantially higher than that of Laidou 2. There were marked differences among the Laidou 2 treatments, no marked differences between the Hefeng 55 treatments at 40 and 80 mg/L, and substantial differences among the other treatments.
3.1.3 Dry Matter Distribution Ratio of Soybean Plant Parts
Fig. 1 shows the effects of different sulfur concentrations on dry matter distribution in each part of Laidou 2. The proportion of dry matter in each part of Laidou 2 was the same during the seedling and flowering stages. In the seedling stage, the proportion of each part was: leaf > root > stalk > petiole, and the distribution ratio of leaves was 34.9%–38.9% and reached a maximum under the S20 treatment. The stem distribution was 20.8%–24.9% and reached a maximum in the S20 treatment. The distribution ratio in petioles was 11.1%–13.7% and reached a maximum in S80 treatment. The distribution ratio in the root system was 25.1%–32.2% and reached a maximum under the S160 treatment.
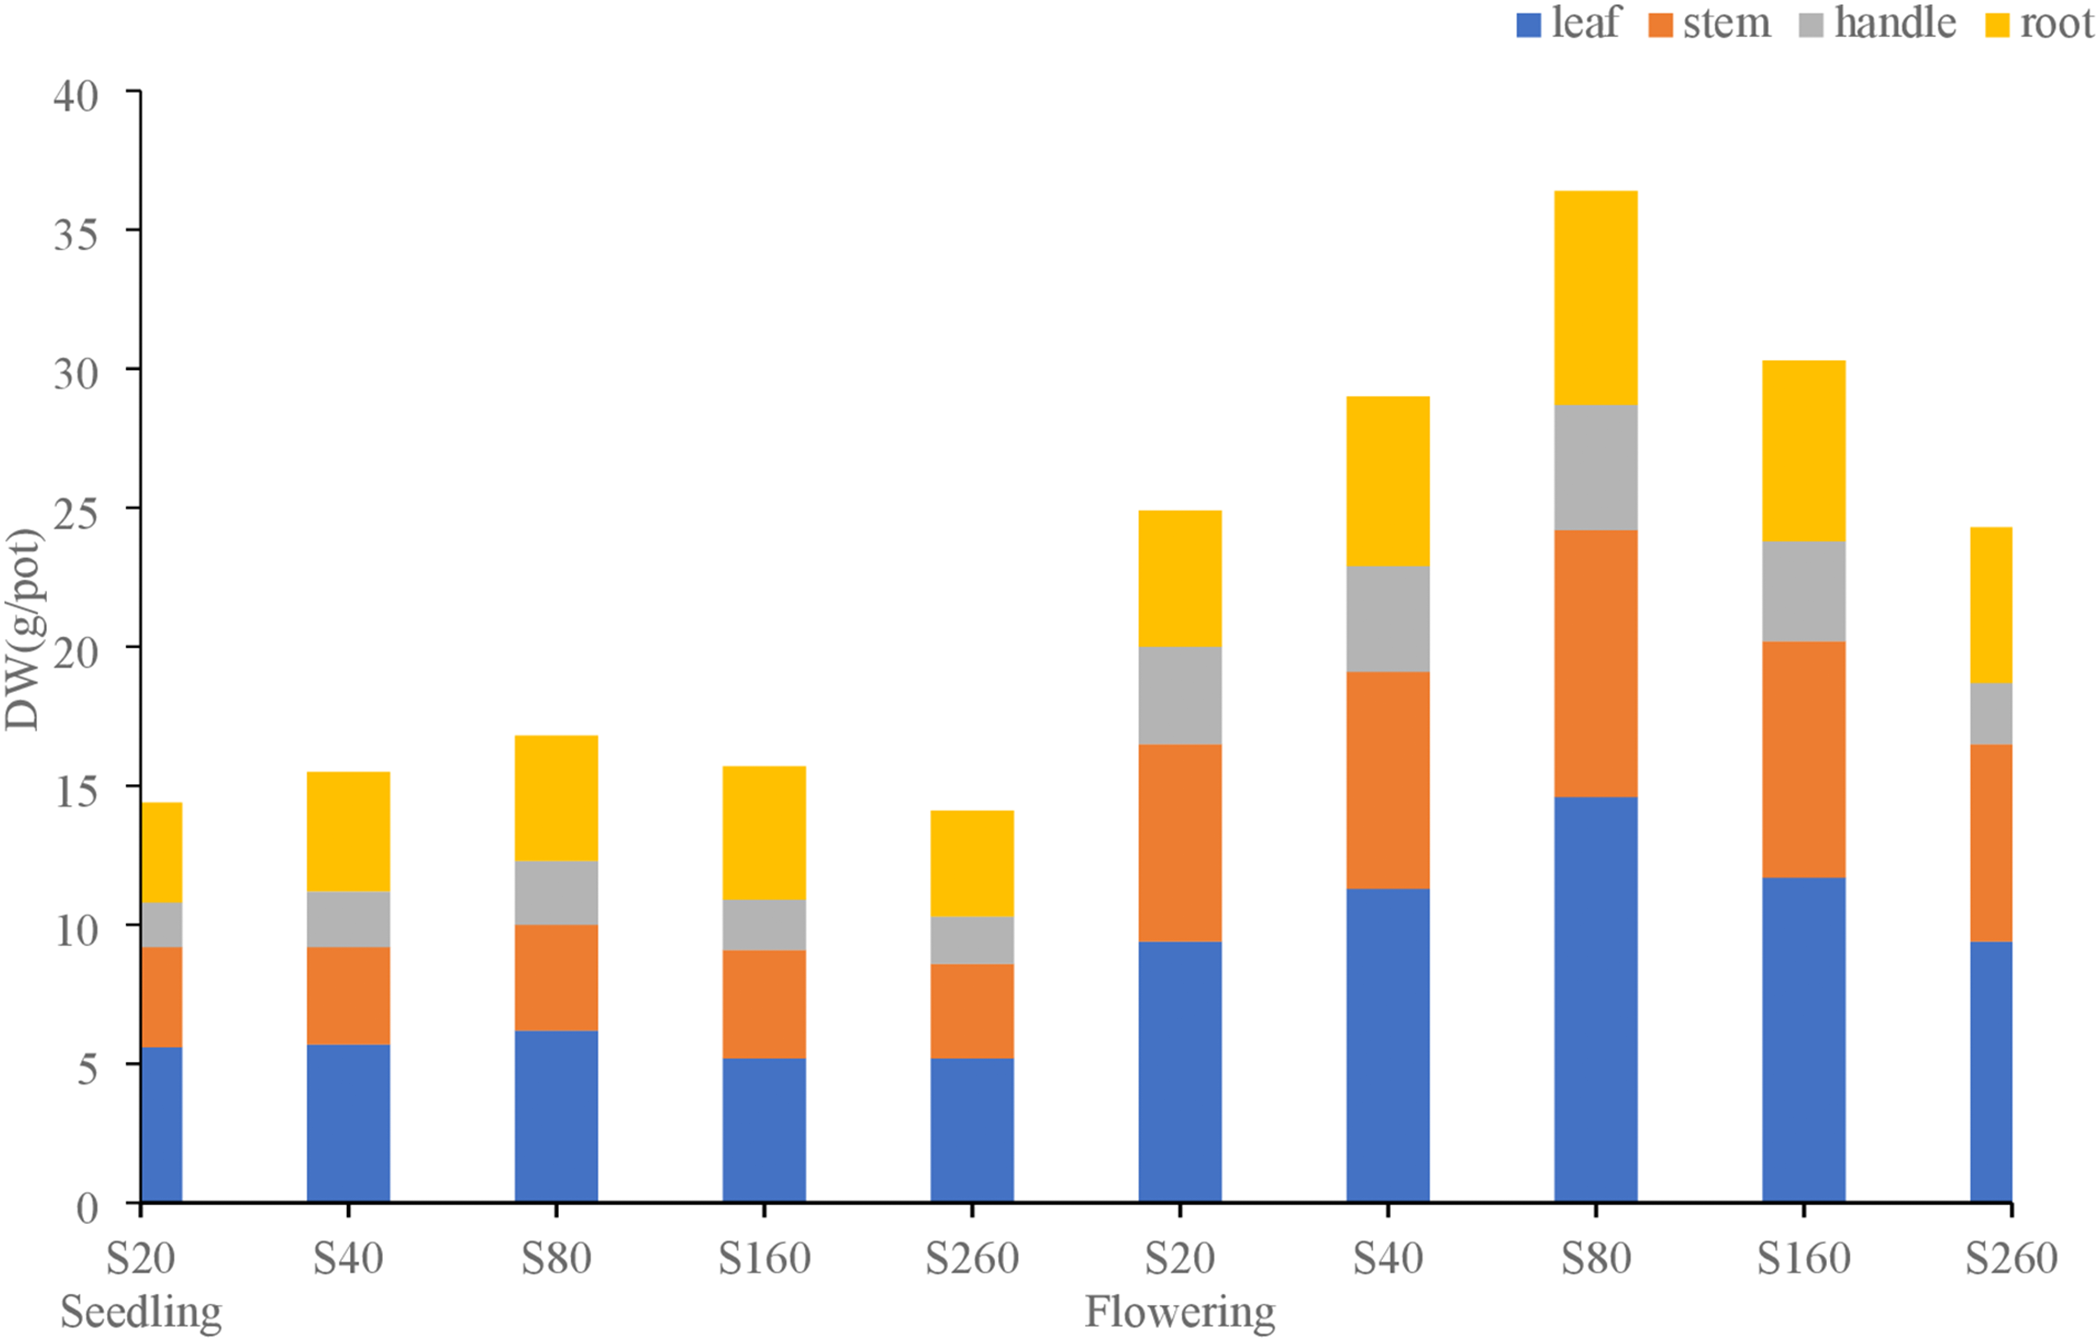
Figure 1: Dry matter distribution in different parts of soybean cultivars, Laidou 2, under different sulfur concentration treatments during seeding and flowering
The distribution ratio in each part during the flowering stage was: leaf > stem > root > petiole. The distribution ratio of leaves was 37.8%–40.1% and reached a maximum under the S80 treatment. The stem distribution was 26.4%–29.2% and reached a maximum under the S260 treatment. The distribution ratio of petioles was 9.1%–14.1% and reached a maximum under the S20 treatment. The distribution ratio of the root system was 19.7%–23.0% and reached a maximum under the S260 treatment.
Fig. 2 shows the effects of different sulfur concentrations on dry matter distribution in various parts of Hefeng 55. The proportion of dry matter distribution in each part of Hefeng 55 was the same at the seedling and flowering stages. In the seedling stage, the proportion of leaf and root distribution was substantially larger than that of stalk and petiole; the proportion of leaf distribution was 30.5%–42.2%, reaching a maximum under the S260 treatment. The proportion of stem distribution was 22.7%–26.1% and reached a maximum under the S80 treatment. The distribution ratio of petioles was 7.7%–10.2% and reached a maximum under the S40 treatment. The distribution ratio of the root system was 25.9%–38.6% and reached a maximum under the S80 treatment.
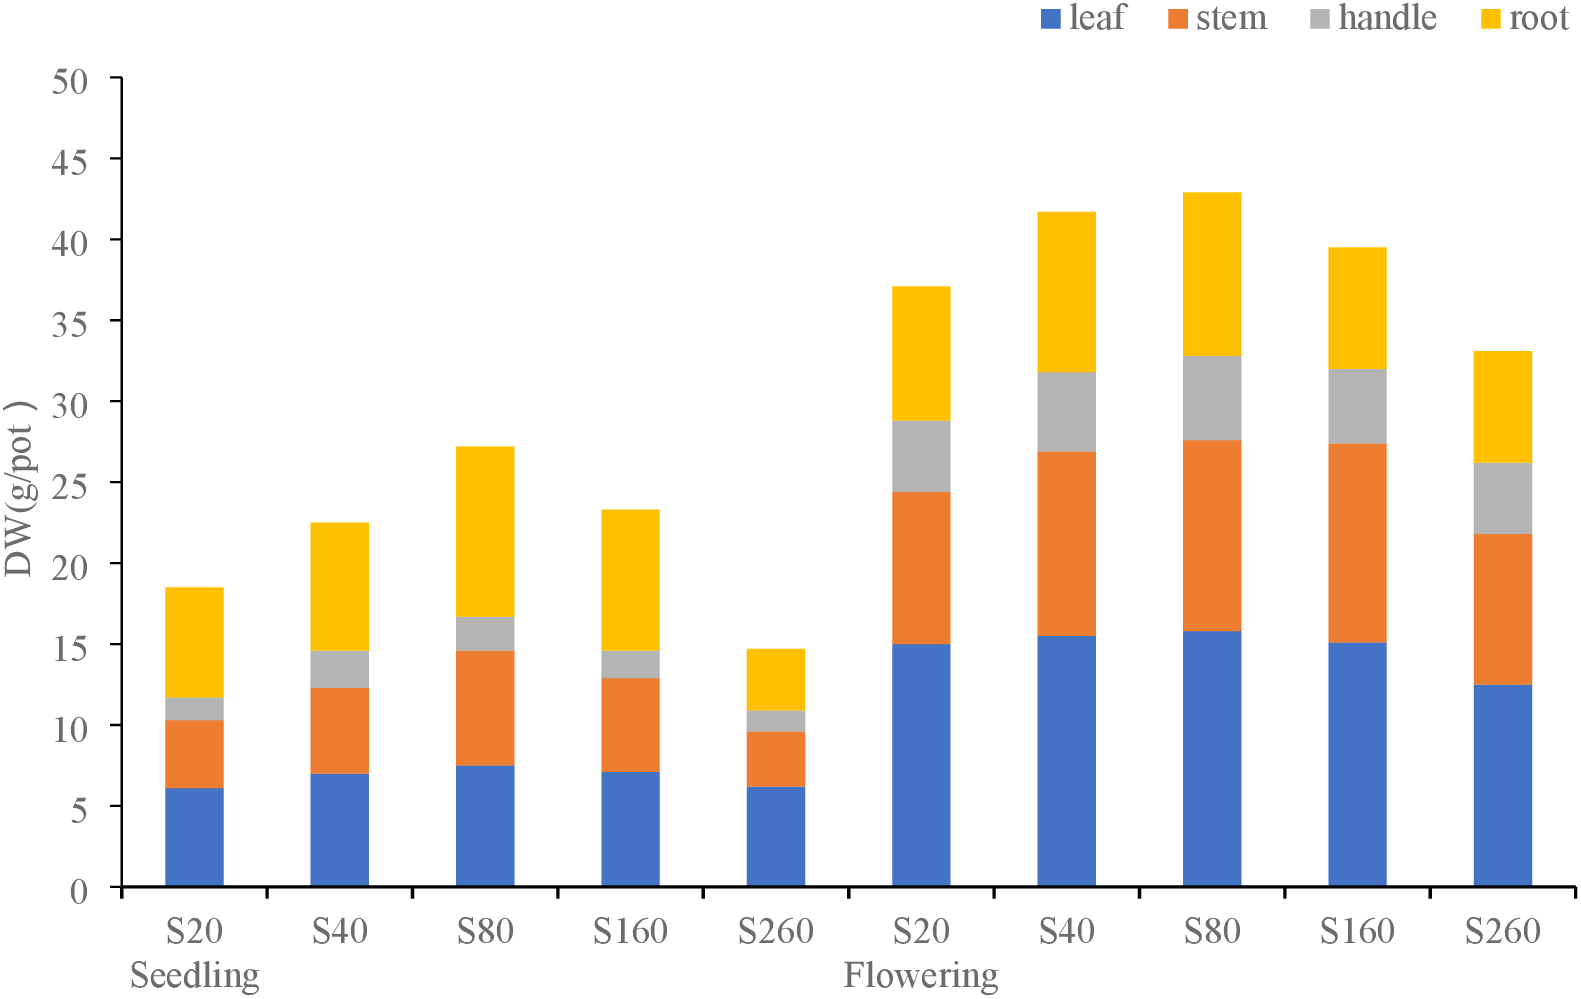
Figure 2: Dry matter distribution in different parts of soybean cultivar, Hefeng 55, under different sulfur treatments in the seedling and flowering stages
The distribution ratio of each part during the flowering stage was: leaf > stem > root > petiole. The distribution ratio of leaves was 36.4%–41.3% and reached a maximum under the S160 treatment. The proportion of stem distribution was 25.7%–29.2% and reached a maximum under the S20 treatment. The distribution ratio of petioles was 11.3%–13.3% and reached a maximum under the S260 treatment. The distribution ratio of the root system was 20.5%–23.5% and reached a maximum in the S80 treatment.
As shown in Figs. 1 and 2, the dry matter distribution of roots in the underground part at the seedling stage was substantially greater than that at the flowering stage, which may have been due to the slow growth of the aboveground part at the seedling stage, resulting in the growth rate of the underground part at the seedling stage being greater than that of the aboveground part. When soybeans enter the flowering stage, vegetative growth accelerates the growth rate of the aboveground part and increases biomass, resulting in the distribution of dry matter in the underground part at the flowering stage being smaller than that in the seedling stage.
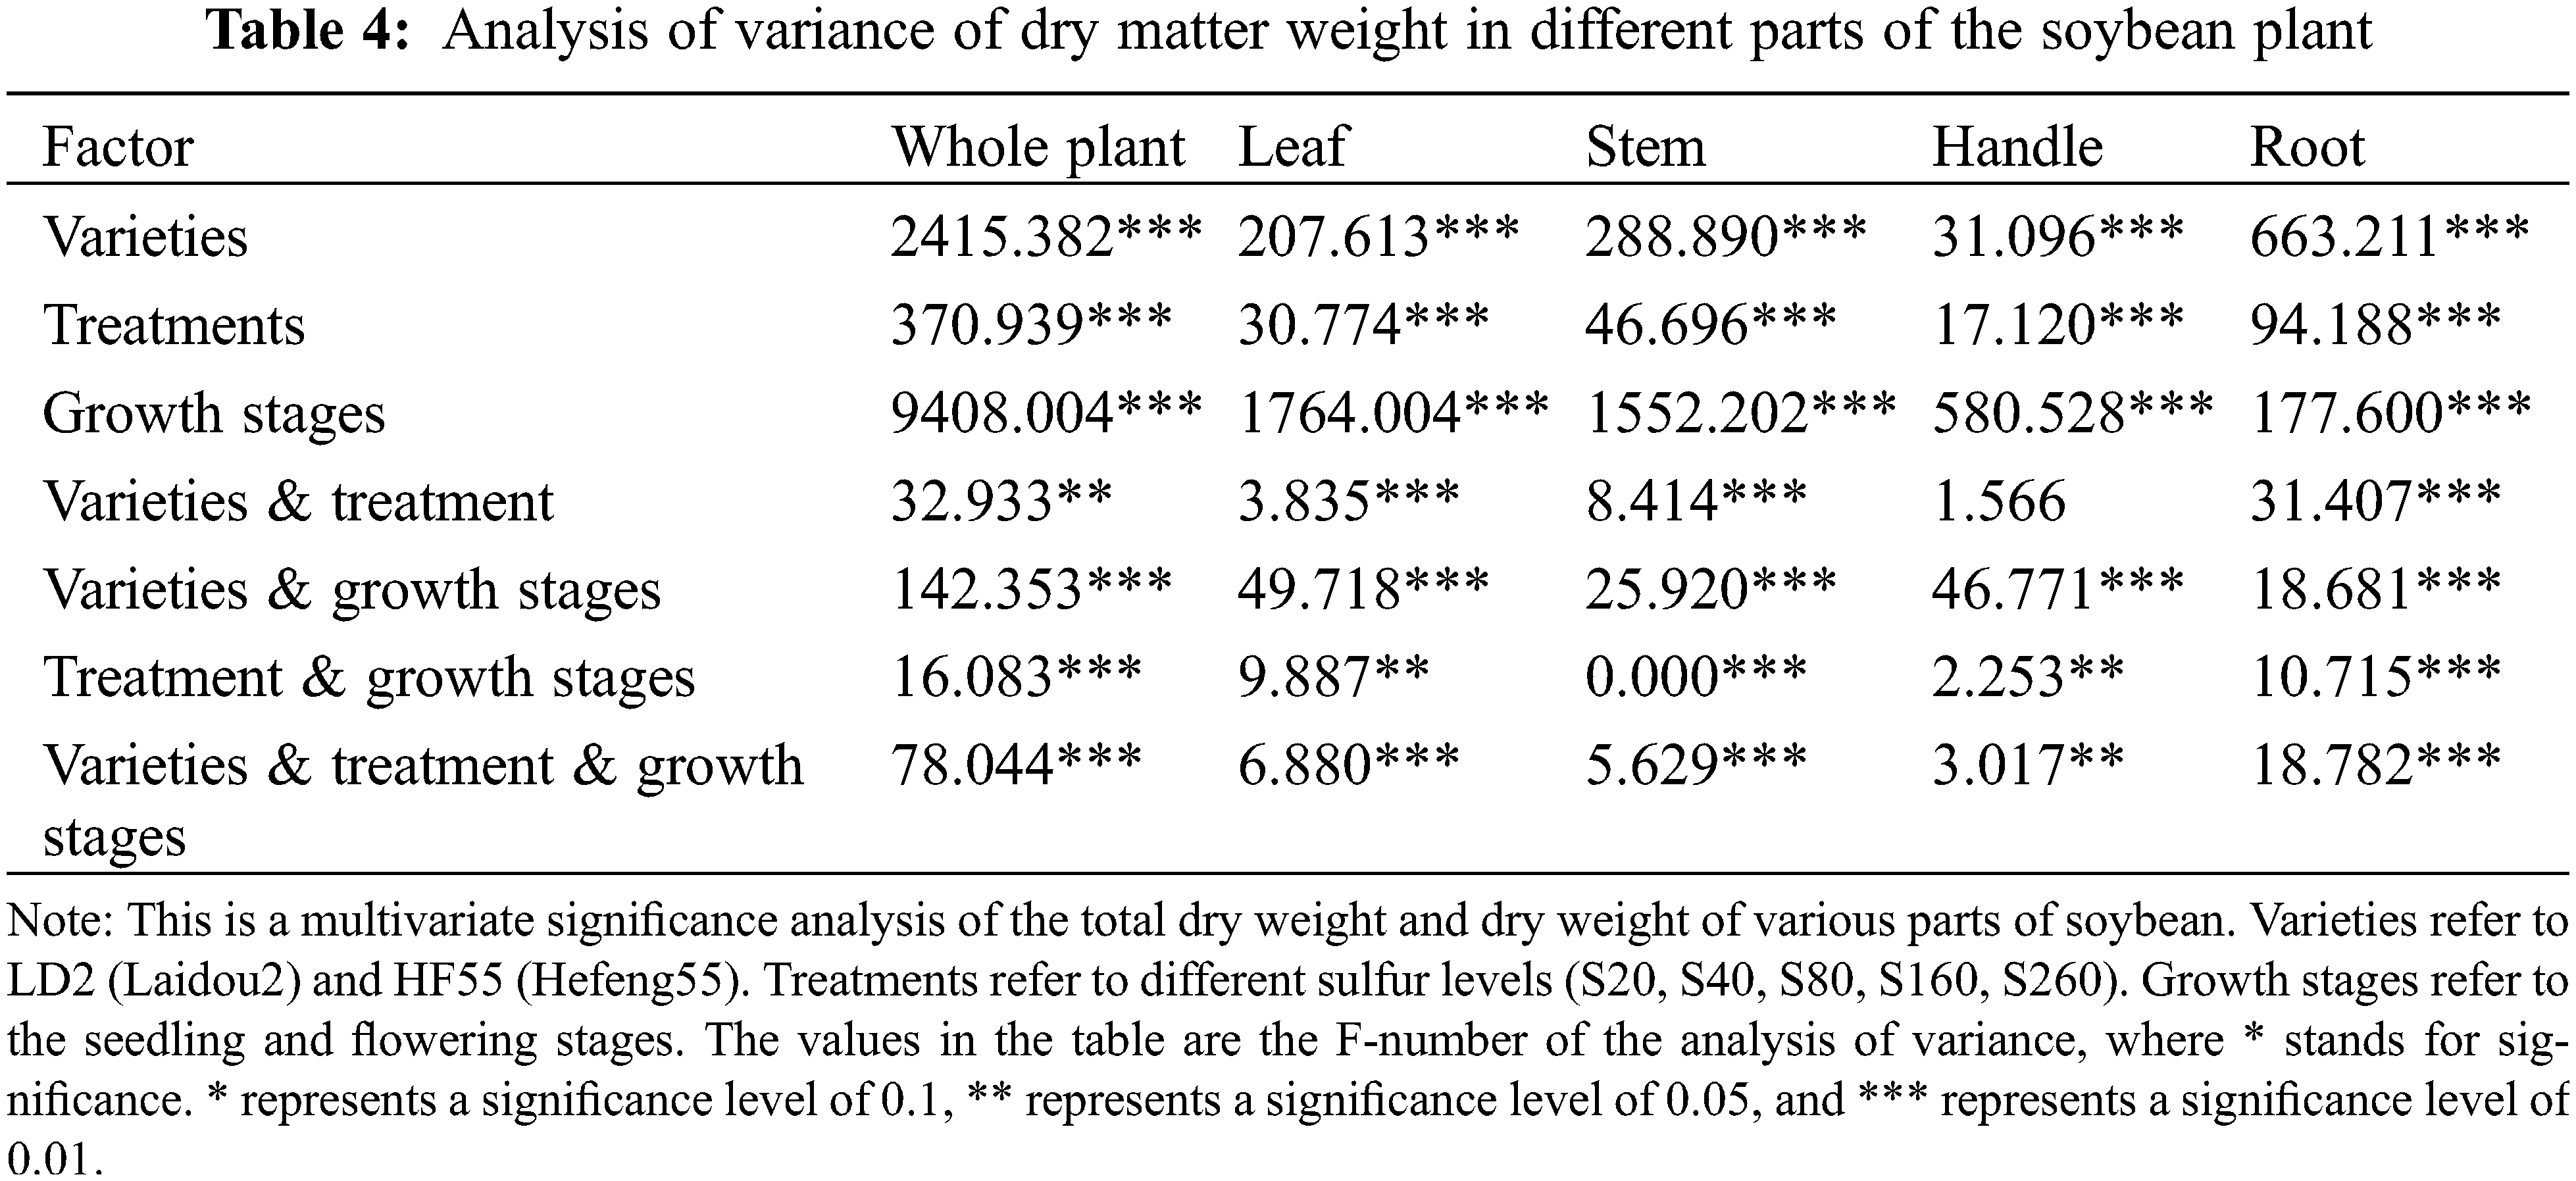
In order to analyze the independent and interactive effects of the three factors of different varieties, different treatments, and different growth periods on the measurement indicators, the multivariate analysis of variance was used to conduct statistical tests, and the results are shown in Table 4. It can be seen that the sig values of these F values are all less than 0.01, indicating that different varieties, different treatments, and different growth periods have significant effects on plant dry weight. In the interaction effect factors, the total dry weight of the two varieties and the dry weight of each part were significantly affected by different interaction effect factors, and the sig value of the F value was less than 0.01.
3.2 Effect of Sulfur Level on Nitrogen, Phosphorus, Potassium, and Sulfur Concentrations in Soybean Plants
3.2.1 Effect of Sulfur Level on Nitrogen Concentrations in Soybean Plants
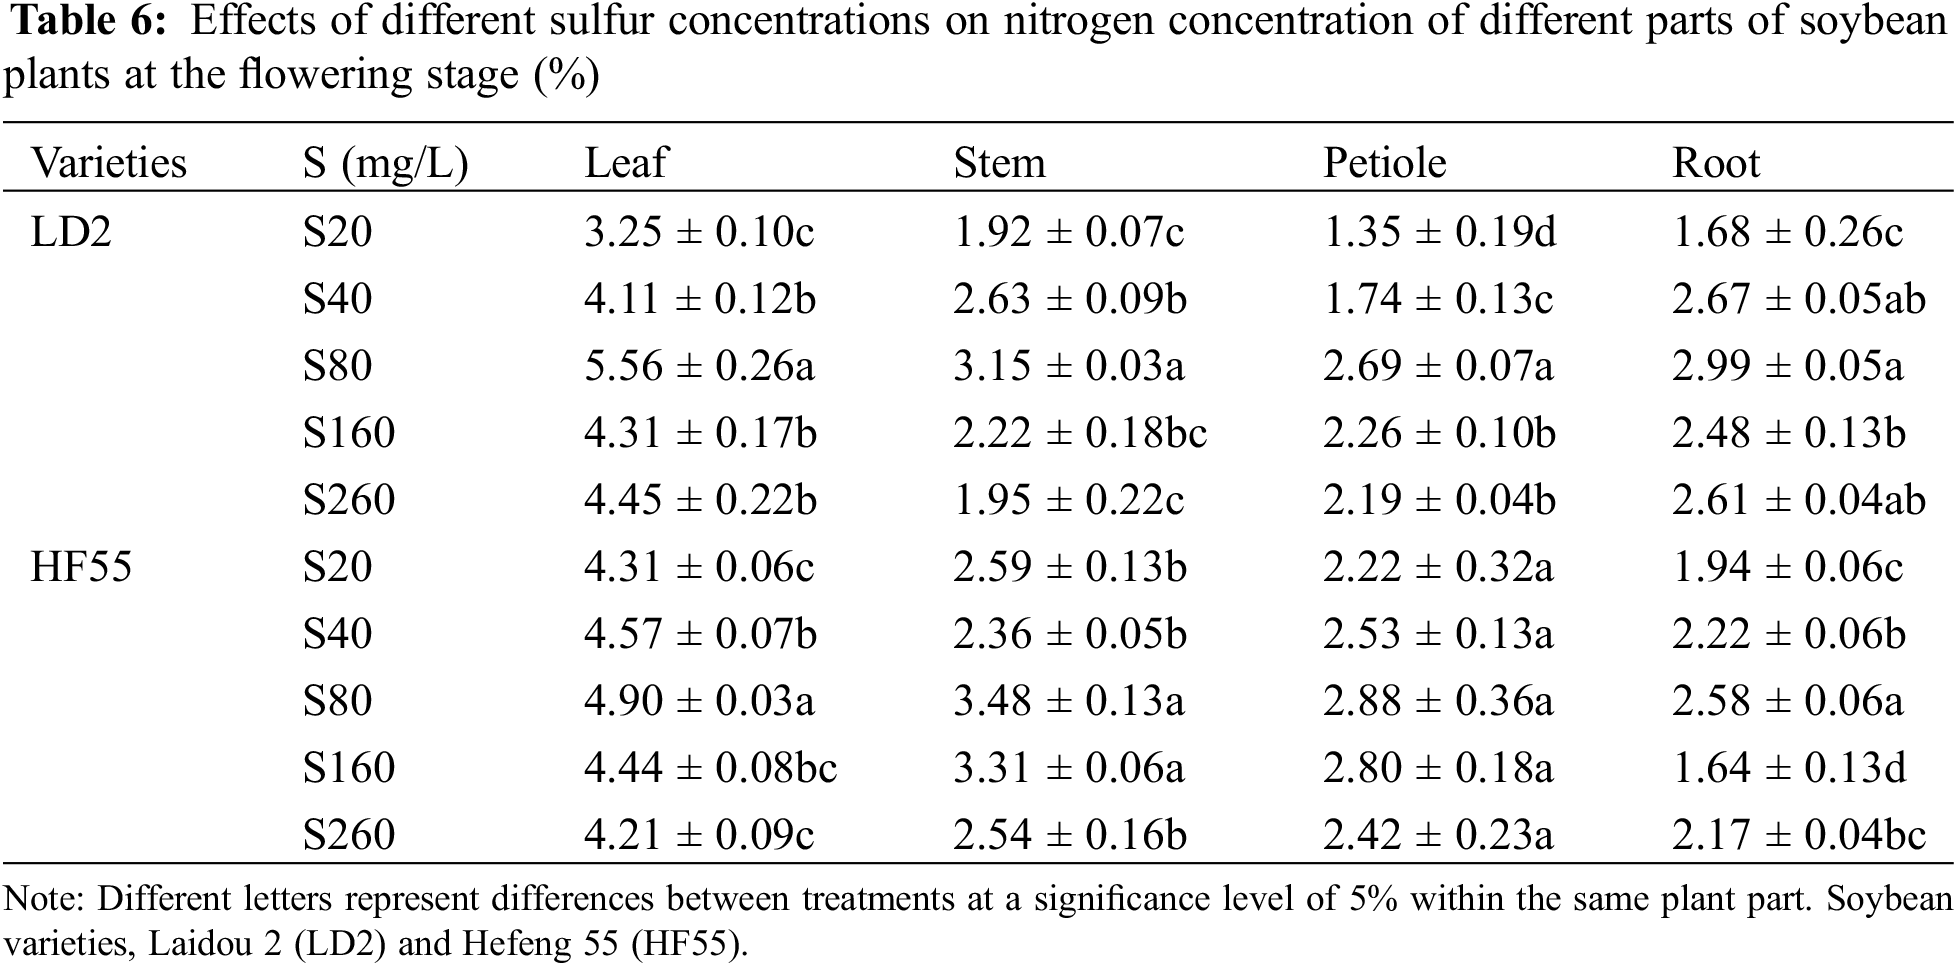
Sulfur concentration substantially affected the nitrogen concentration of soybean plants. There were marked differences in the nitrogen concentration among the different varieties, different stages within the same variety, and different parts of the same variety. For example, at the flowering stage, the nitrogen concentration in Laidou 2 and Hefeng 55 was substantially higher than that at the seedling stage. Moreover, the nitrogen concentration in the leaves was substantially higher than that in the stems, petioles, and roots (Tables 5 and 6).
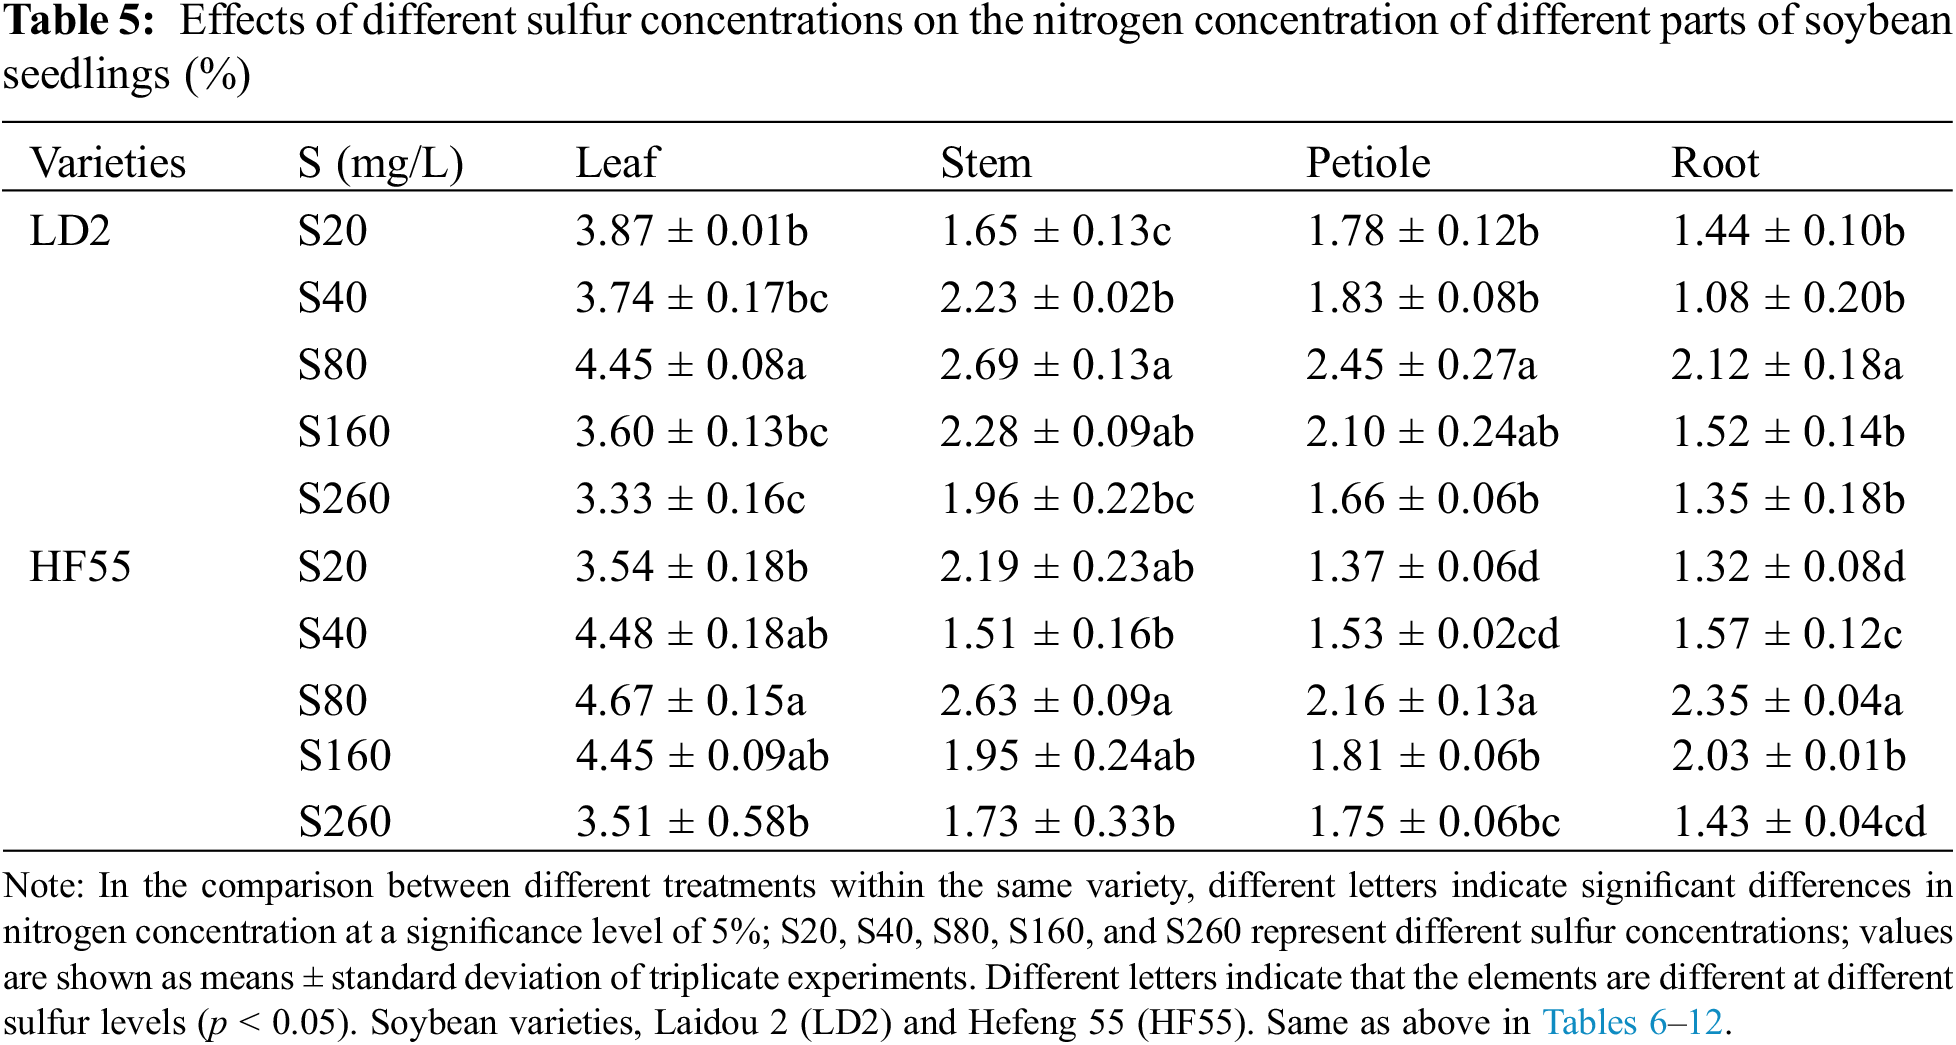
Regarding the nitrogen concentration in different plant parts during the seedling stage for Laidou 2 under the S20 condition, the order was leaf > petiole > stem > root. At other sulfur concentrations, it followed the sequence: leaf > stem > petiole > root. For Hefeng 55 under S20, leaf > stem > petiole > root; at S40, the order was leaf > root > petiole > stem; at S80, leaf > stem > root > petiole; at S160, leaf > root > stem > petiole; and at S260, leaf > petiole > stem > root.
During the seedling stage, the nitrogen concentration in the leaves and roots of Hefeng 55 was substantially higher than that in Laidou 2. Specifically, in the leaves, it was 19.9%, 4.9%, 23.5%, and 5.3% higher in the S40, S80, S160, and S260 treatments, respectively. In the roots, it was 45.7%, 10.6%, 33.7%, and 5.3% higher in the S40, S80, S160, and S260 sulfur treatments, respectively. There was no statistical difference in the stem nitrogen concentration between Laidou 2 and Hefeng 55 during the seedling stage. However, in the case of petiole nitrogen concentration, Laidou 2 had substantially higher values than Hefeng 55 at the seedling stage. Under S20, S40, S80, and S160 conditions, it was higher by 29.5%, 19.5%, 13.4%, and 15.7%, respectively.
During the flowering stage, the nitrogen concentration in the leaves and roots of Laidou 2 was substantially higher than that of Hefeng 55. Specifically, in the leaves, N was higher by 13.4% and 5.6% under the S80 and S260 conditions, respectively. In the roots, N was higher by 15.9%, 51.2%, and 20.7% under the S80, S160, and S260 conditions, respectively. The nitrogen concentration in the stems of Hefeng 55 was substantially higher than that of Laidou 2, with increases of 35.1%, 10.3%, 49.2%, and 29.9% in the S20, S80, S160, and S260 treatments, respectively. The nitrogen concentration in the petioles of Hefeng 55 was substantially higher than that of Laidou 2, with increases of 64.4%, 45.8%, 7.0%, 23.7%, and 10.3% under the S20, S40, S80, S160, and S260 conditions, respectively.
3.2.2 The Influence of Sulfur Concentration on Phosphorus Concentration in Soybean Plants
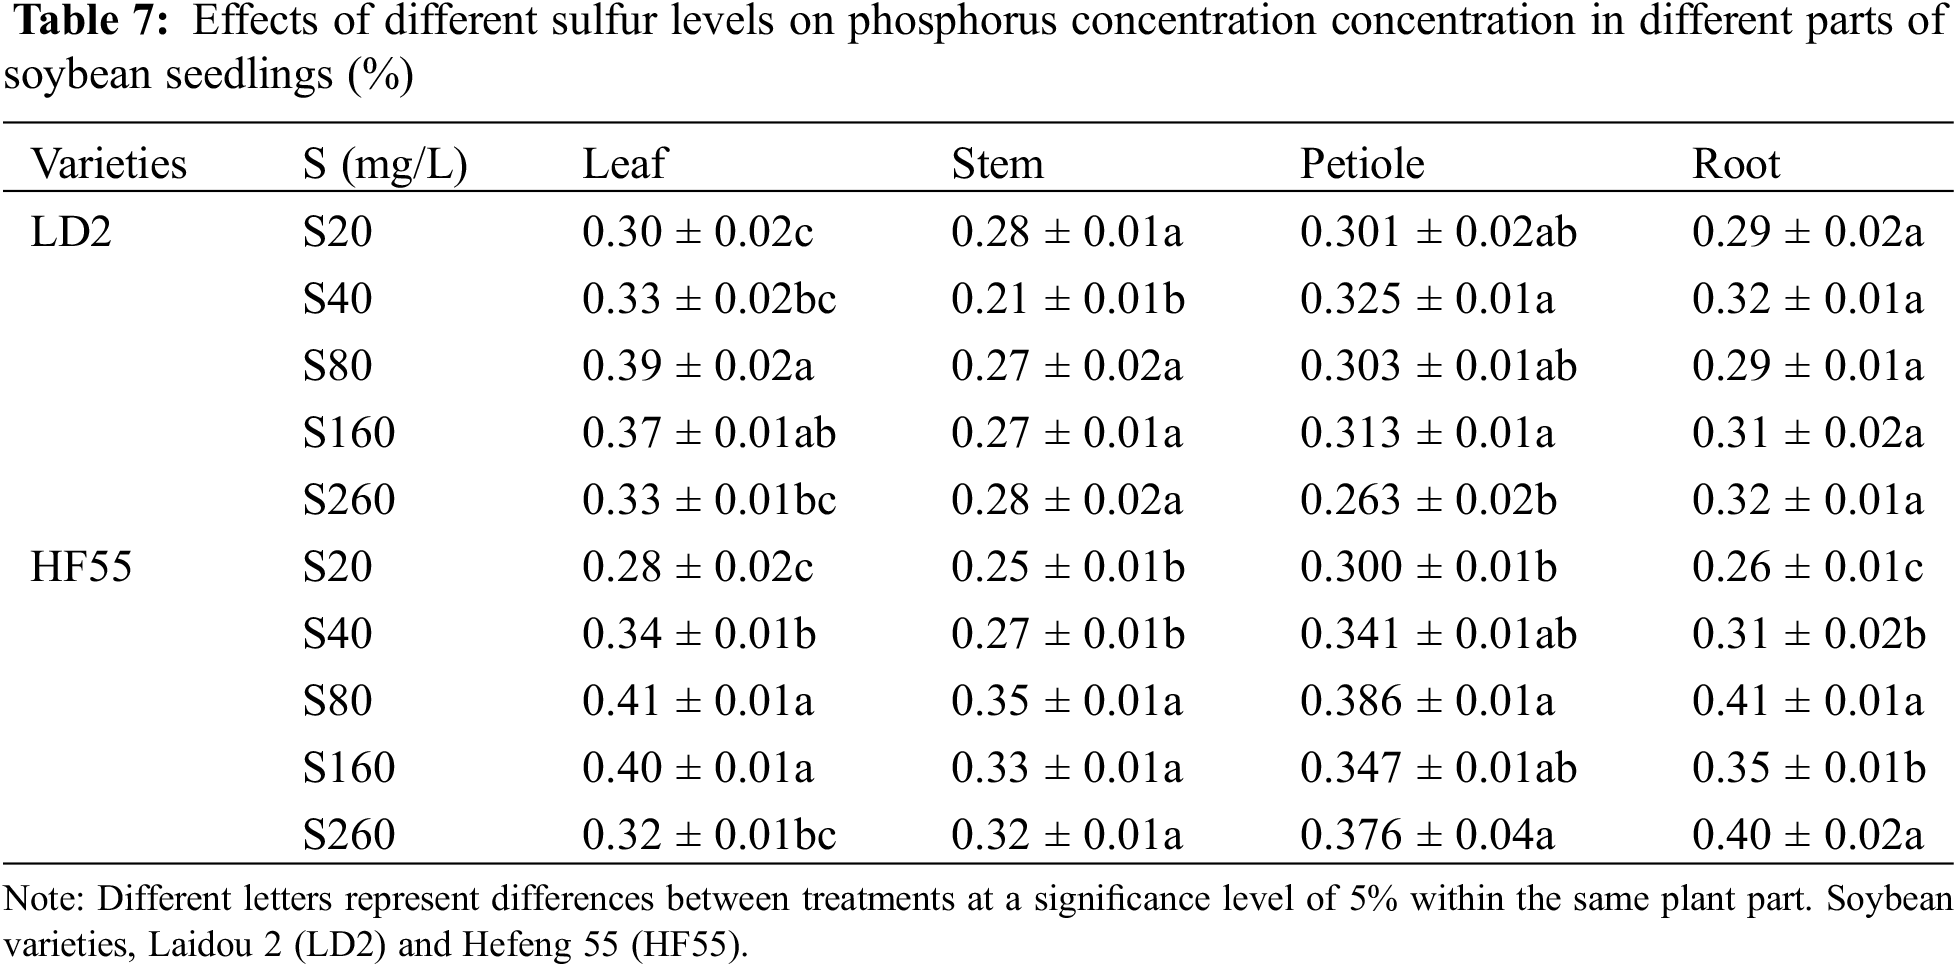
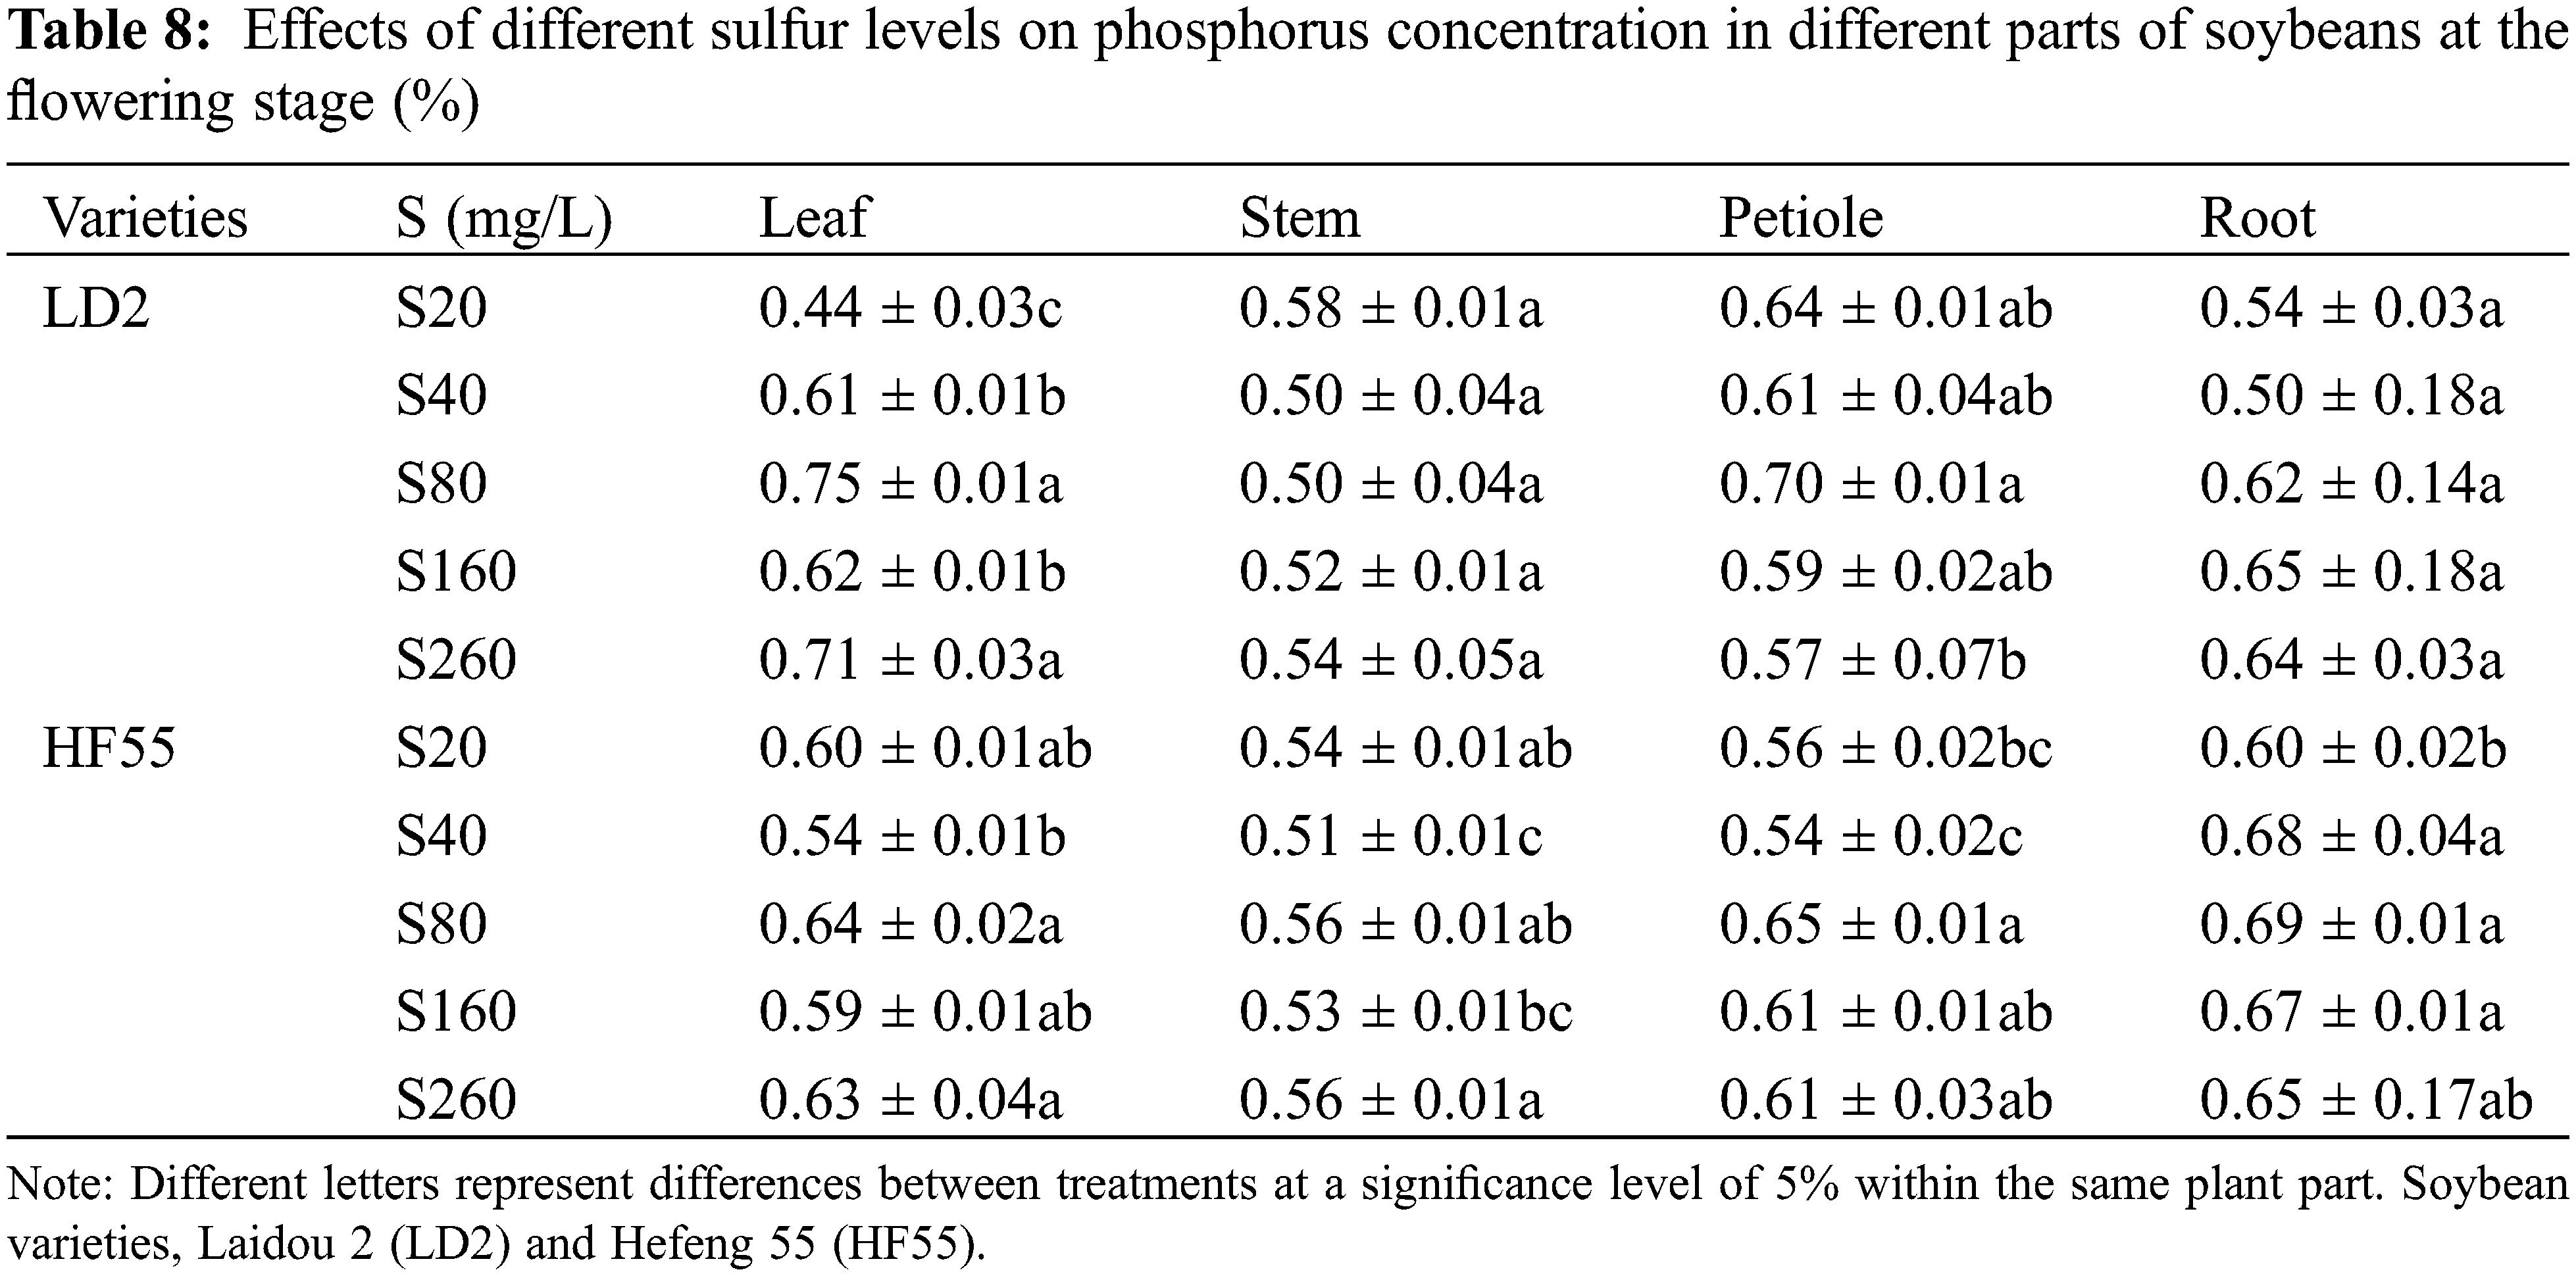
Sulfur levels substantially affected the phosphorus concentration of soybean plants. There were statistical differences in phosphorus concentration among different varieties, different stages within the same variety, and different parts of the same variety. The phosphorus concentration in all parts of Laidou 2 and Hefeng 55 during the flowering stage was substantially higher than that during the seedling stage (Tables 7 and 8).
During the seedling stage, P concentration in Laidou 2 was in the order petioles > leaves > roots > stems under S20 conditions; in the S40, S80, and S160 treatments, the order was leaf > petiole > root > stem; whereas in the S260 treatment, the order was leaf > root > stem > petiole. For Hefeng 55, in the S20 and S40 treatments, the order was petiole > leaf > root > stem. In the S80 and S260 treatments, the order was root > leaf > petiole > stem, whereas in the S160 treatment, it was leaf > root > petiole > stem.
During the flowering stage, Laidou 2 demonstrated the order petiole > stem > root > leaf under S20 conditions. Under the S40 conditions, the order was petiole > leaf > stem > root, whereas, under the S80 condition, the order was leaf > petiole > root > stem; under the S160 condition, roots > leaves > petioles > stems; and under the S260 condition, leaves > roots > petioles > stems. For Hefeng 55 under the S20 condition, the order was leaf > root > petiole > stem. Under the S40, S80, and S160 conditions, the order was root > petiole > leaf > stem, and under the S260 condition, the order was root > leaf > petiole > stem.
During the seedling stage, the phosphorus concentration of the leaves, petioles, stems, and roots in Hefeng 55 was substantially higher than that in Laidou 2. Specifically, in terms of leaf phosphorus concentration, Hefeng 55 exceeded Laidou 2 by 6.4%, 3.4%, 6.5%, and 9.5% under the S20, S40, S80, and S160 treatments, respectively. In terms of petiole phosphorus concentration, Hefeng 55 was higher than Laidou 2 by 4.0%, 27.4%, 10.9%, and 43.0% under the sulfur treatments of S40, S80, S160, and S260, respectively. The stem phosphorus concentration in Hefeng 55 was higher than Laidou 2 by 28.6%, 28.0%, 21.2%, and 13.7% under the S40, S80, S160, and S260 treatments, respectively. The root phosphorus concentration in Hefeng 55 was higher than Laidou 2 by 41.2%, 13.6%, and 24.5% under the S80, S160, and S260. During the flowering stage, the phosphorus concentration in the leaves of Laidou 2 was substantially higher than that of Hefeng 55. In S40, S80, S160, and S260, the phosphorus concentration in the leaves of Laidou 2 was higher by 12.8%, 18.7%, 5.5%, and 11.9%, respectively. There was no statistical difference in phosphorus concentration between petioles.
3.2.3 The Effect of Sulfur Levels on Potassium Concentration in Soybean Plants
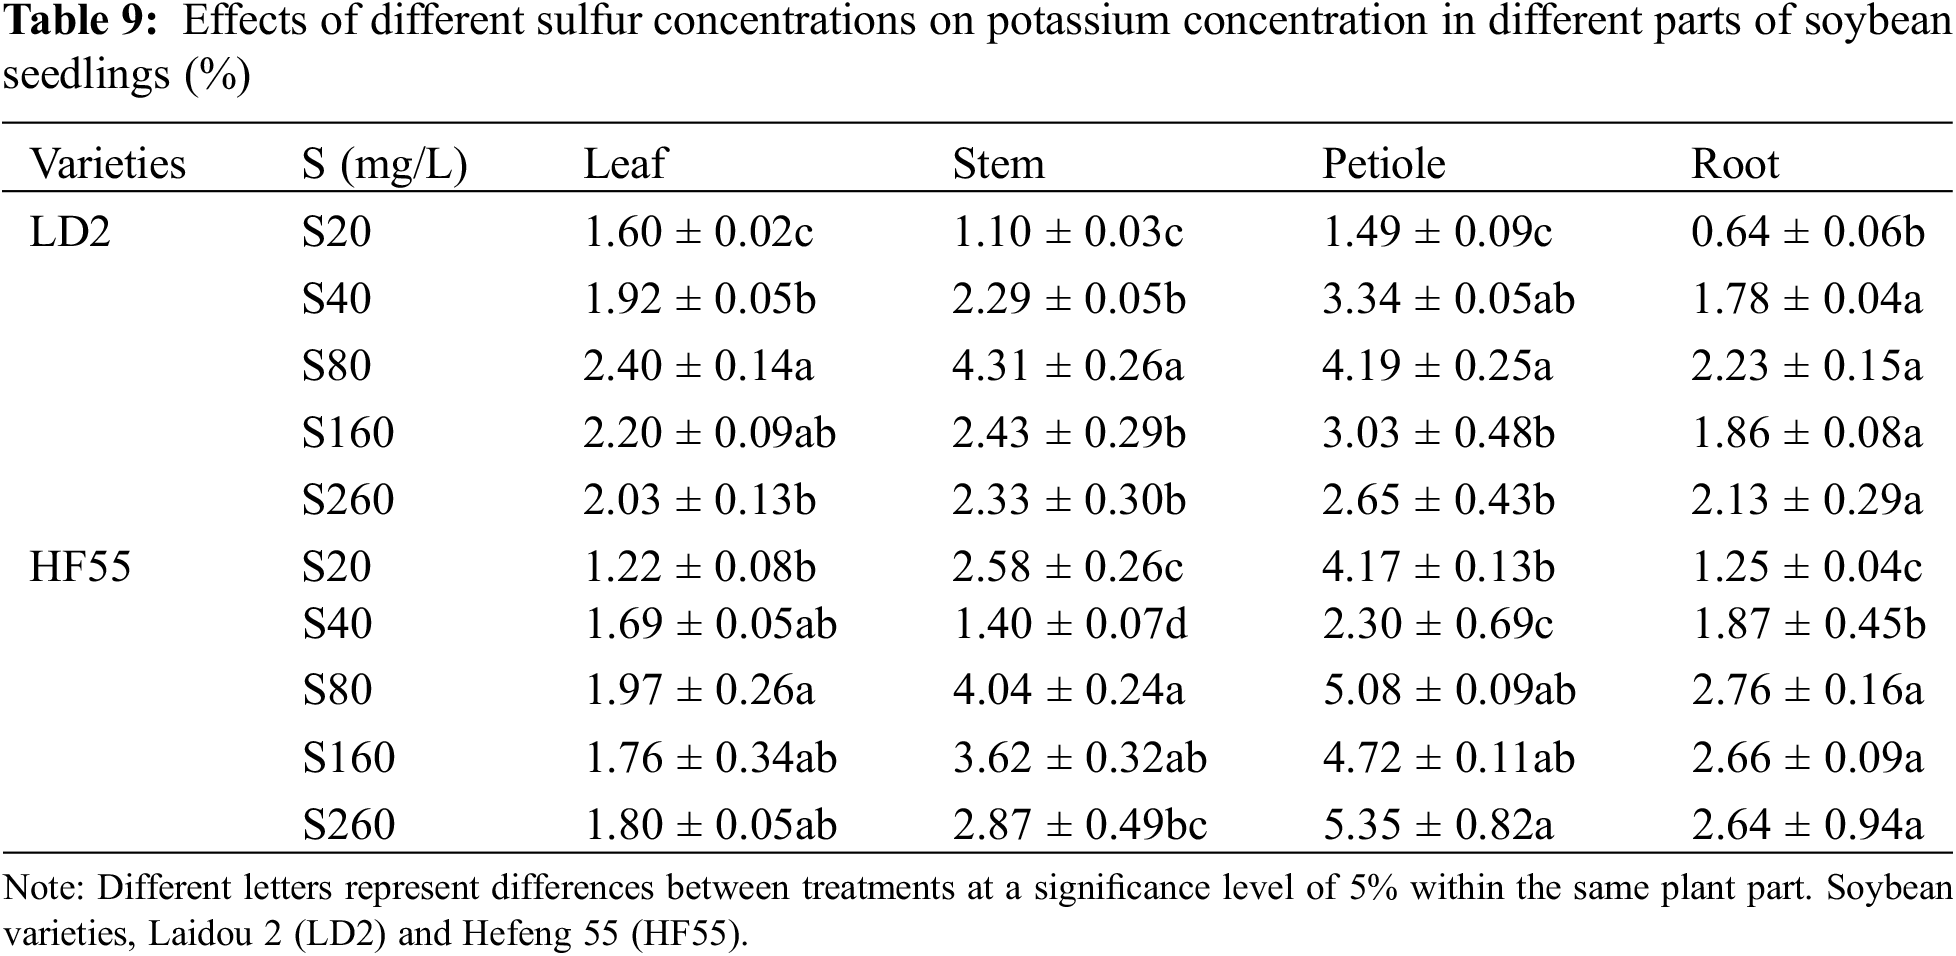
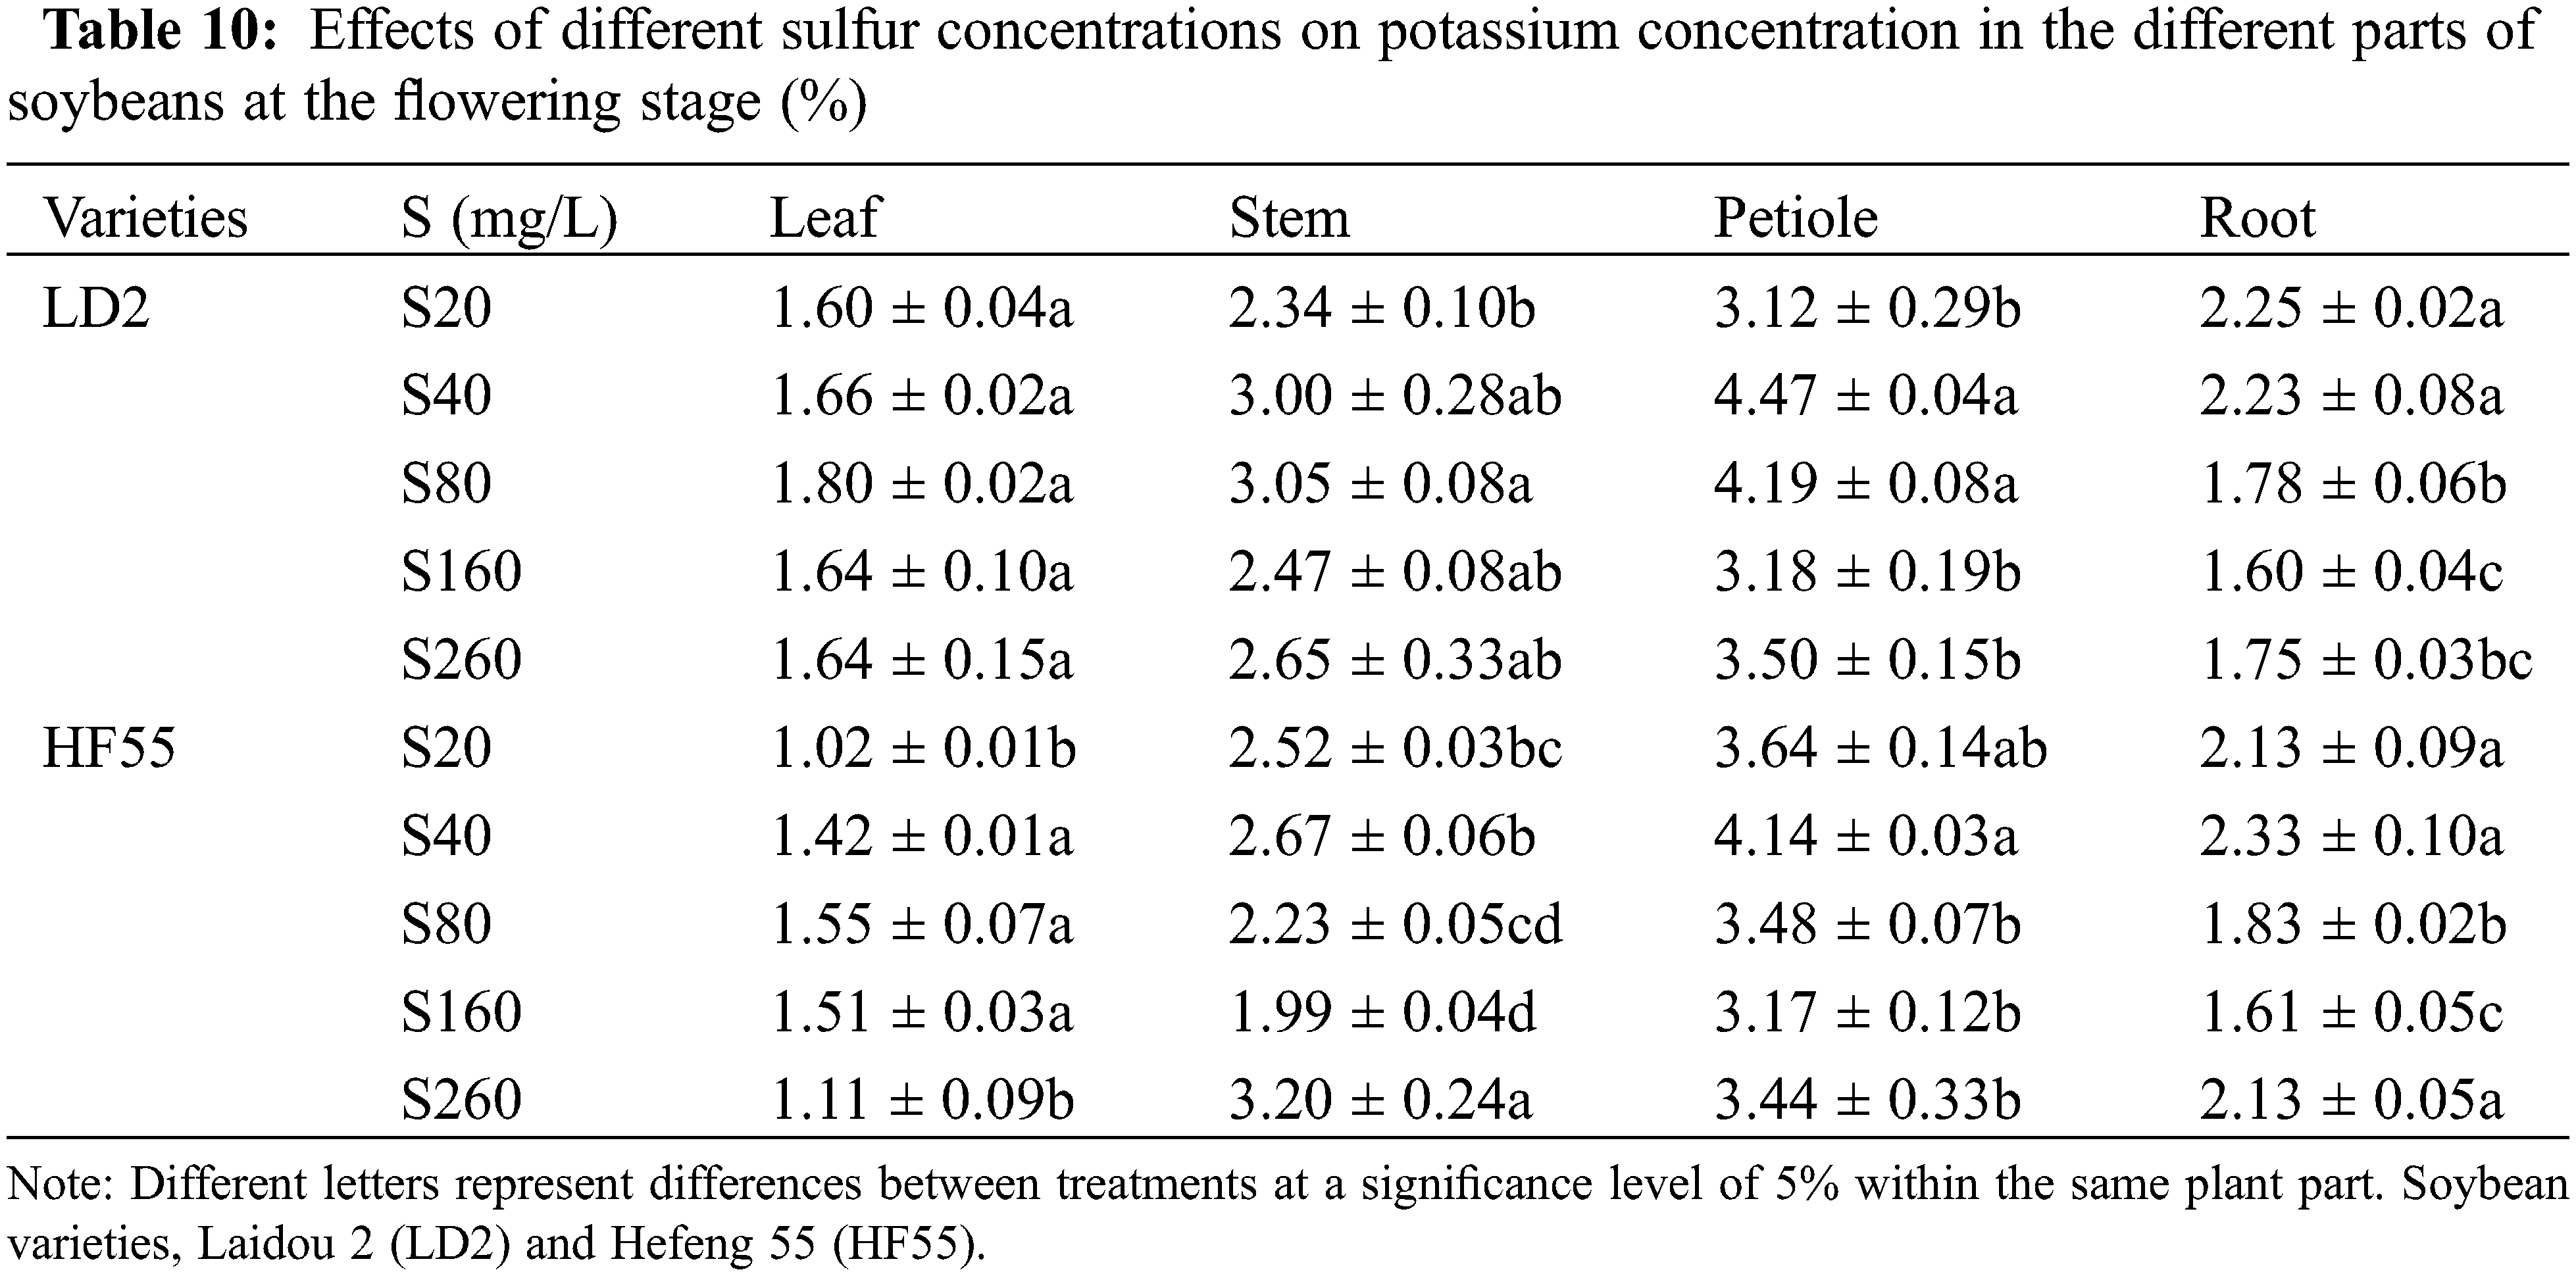
Sulfur nutrition level has a significant impact on the potassium concentration of soybean plants. In general, the potassium concentration in the seedling-stage plants was substantially higher than that in the flowering stage. There were statistical differences in the potassium concentration among the different varieties (Tables 9 and 10). Regarding the potassium concentration in different parts of the soybean plants, during the seedling stage, Laidou 2 demonstrated an order of leaf > petiole > stem > root under the S20 treatment, whereas, under the S40 and S160 treatments, the order was petiole > stem > leaf > root. Under S80 conditions, the order was stem > petiole > leaf > root, whereas, under S260 conditions, it was petiole > stem > root > leaf. For Hefeng 55, under all sulfur treatments, the order was petiole > stem > root > leaf.
During the flowering stage in Laidou 2, under the S20, S40, and S260 conditions, the order of K concentration in different plant parts was petiole > stem > root > leaf. Under the S80 and S160 treatments, the order was petiole > stem > leaf > root. For Hefeng 55, regardless of sulfur treatment, the order of potassium concentration was petioles > stems > roots > leaves.
During the seedling stage, the potassium concentration in the leaves and stems of soybean variety 2 was substantially higher than that in Hefeng 55. In the leaves (S20 to S260), the sulfur concentrations were higher by 30.9%, 13.5%, 22.2%, 25.2%, and 12.7% compared to S20. In the stems, the potassium concentration was higher by 63.9% and 6.6% in the S40 and S80 treatments, respectively. However, the petiole of variety Hefeng 55 substantially outperformed Laidaou, with increases of 179.5%, 21.4%, 55.8%, and 101.9% under the S20, S80, S160, and S260 conditions, respectively. The potassium concentration in the roots in Hefeng 55 was substantially higher than soybean variety 2, with increases of 95.6%, 5.1%, 23.4%, 43.4%, and 23.8% under the S20, S40, S80, S160, and S260 treatments during the seedling stage.
During the flowering stage, the potassium concentration in the leaves, stems, and petioles of soybean variety 2 was substantially higher than in Hefeng 55. In the leaves, the potassium concentration was higher by 57.7%, 15.8%, 15.9%, 7.9%, and 48.2% in the S20, S40, S80, S160, and S260 treatments, respectively. In the stems, the potassium concentration was higher by 12.2%, 36.4%, and 24.4% in the S40, S80, and S160 treatments, respectively. Regarding the petioles, they showed increases of 8.1%, 20.2%, 0.5%, and 1.9% under the S40, S80, S160, and S260 conditions, respectively. However, the potassium concentration in the roots of Hefeng 55 was substantially higher than soybean variety 2, with increases of 4.8%, 2.6%, 0.8%, and 21.7% under the S40, S80, S160, and S260 treatments, respectively.
3.2.4 Effect of Different Sulfur Fertilizer Application Rates on Sulfur Concentration in Soybean Plants
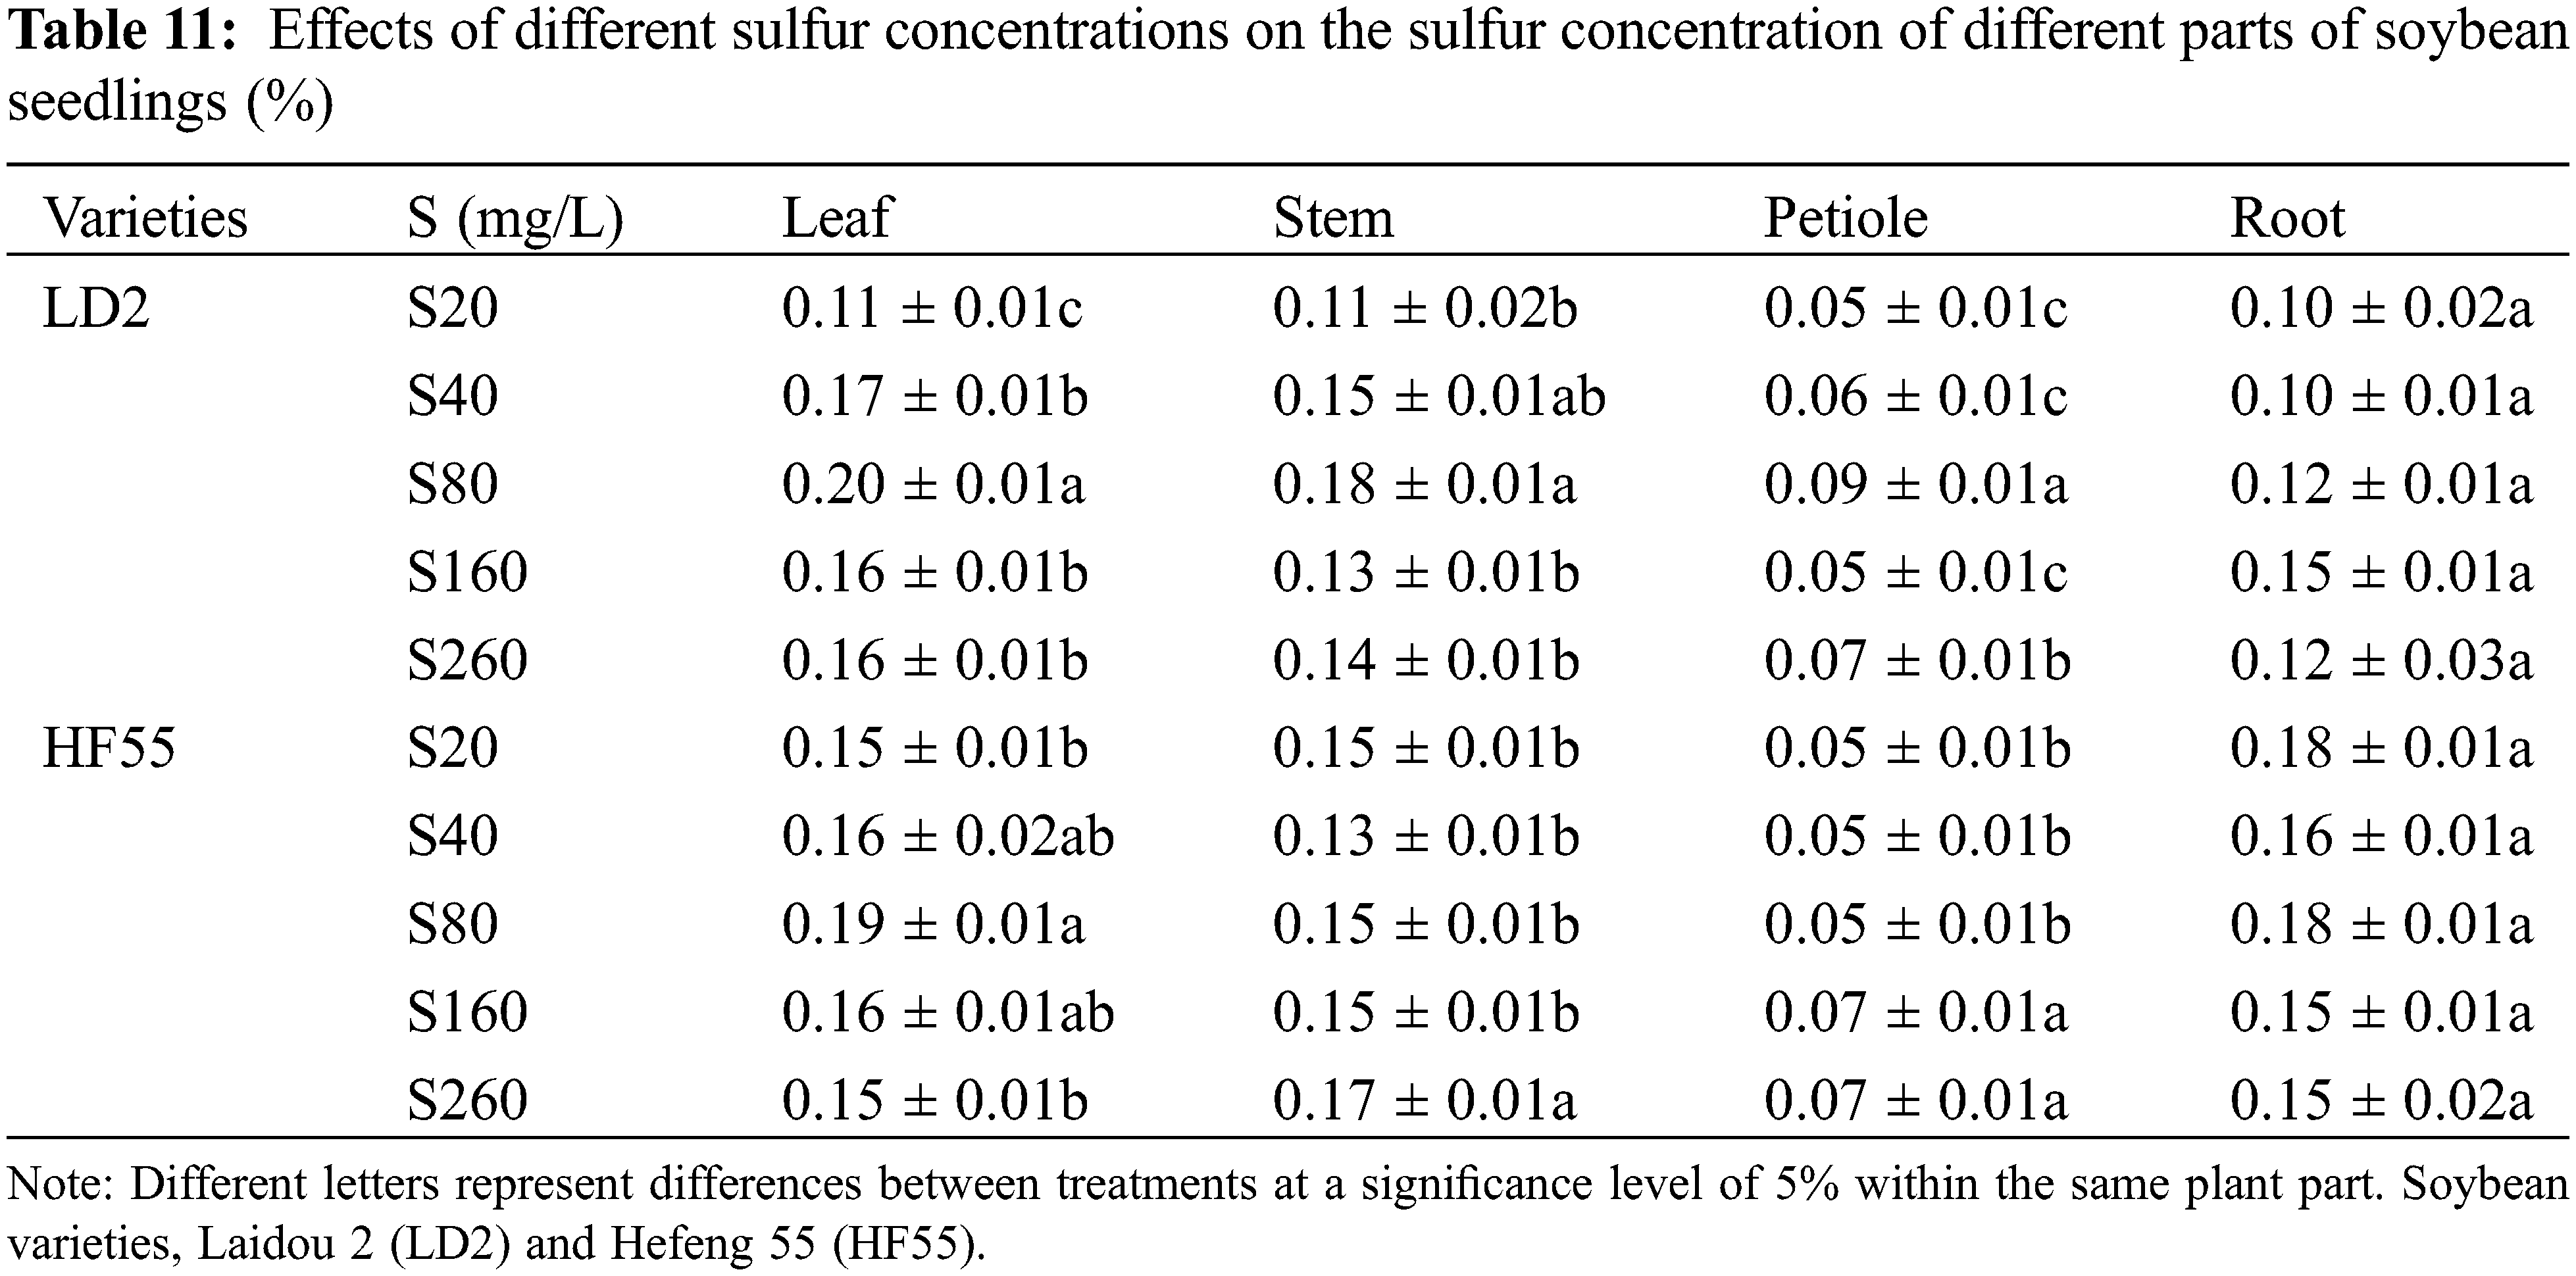
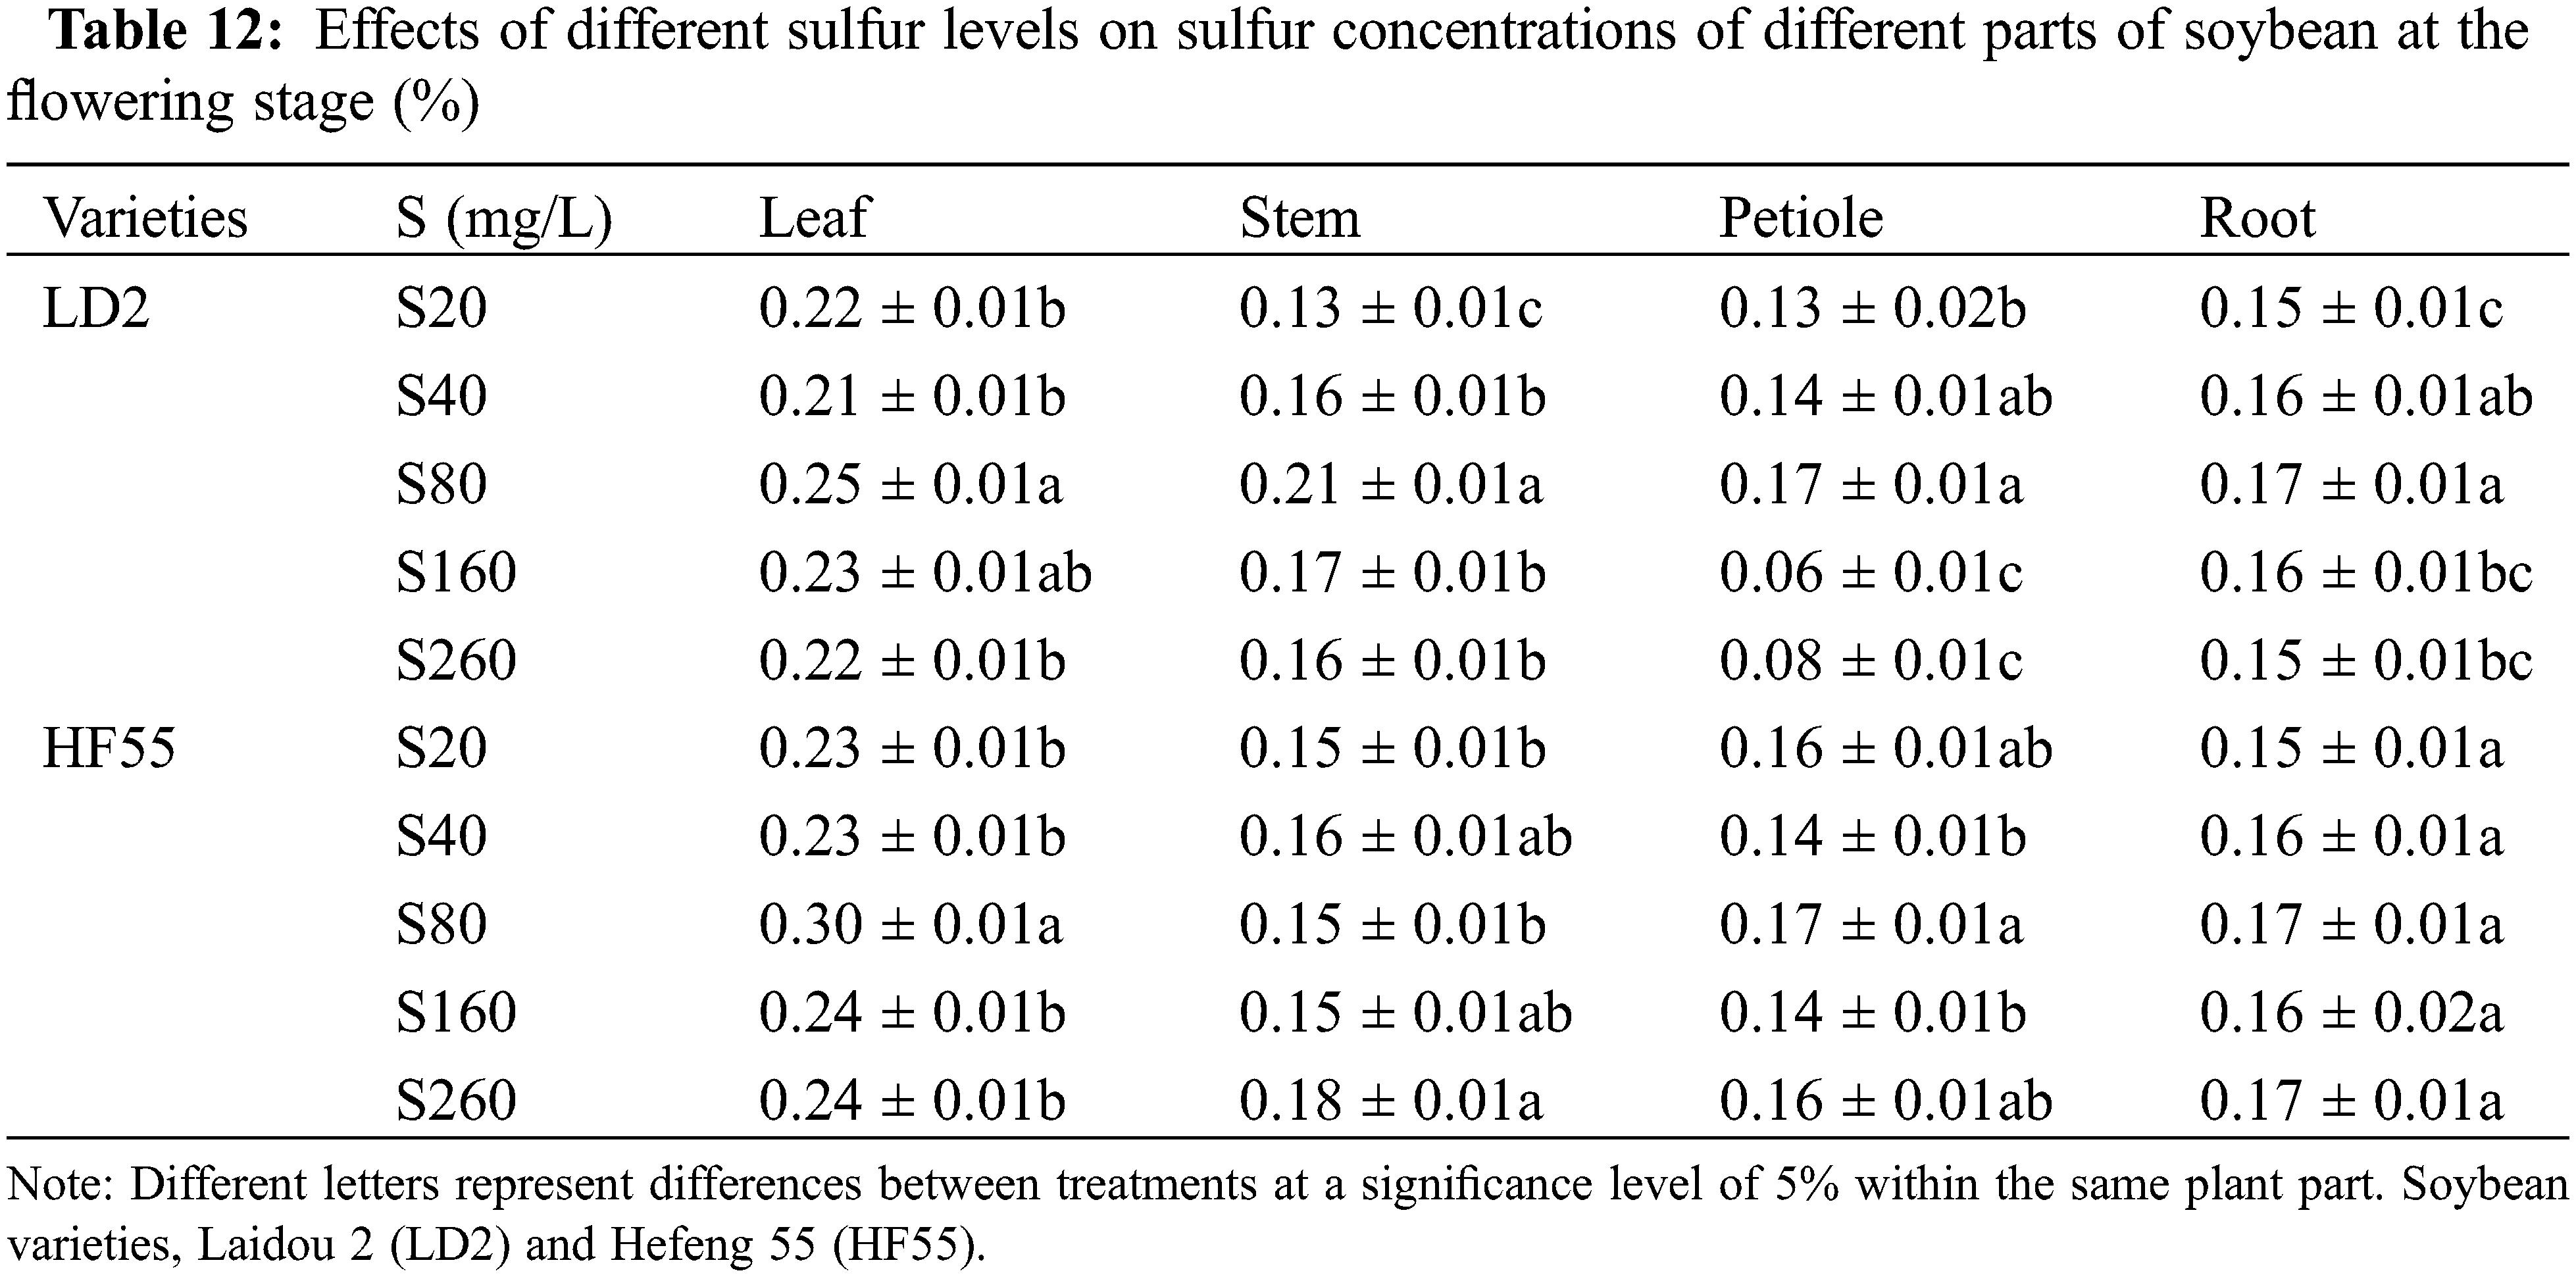
Sulfur nutrition had a substantial impact on the sulfur concentration of soybean plants. During the flowering stage, the sulfur concentration of the plants was noticeably higher than that during the seedling stage. There were statistical differences in sulfur concentration among the different varieties (Tables 11 and 12).
During the seedling stage, the order of the sulfur concentration in various parts of the Laidou 2 was: in S20, stem > leaf > root > petiole; in S40, S80, and S260, leaf > stem > root > petiole; and S160, leaf > root > stem > petiole. For the Hefeng 55 variety, in S20, the order was root > stem > leaf > petiole; in S40 and S80, leaf > root > stem > petiole; in S160, leaf > stem > root > petiole; and in S260, stem > leaf > root > petiole.
During the flowering stage, the sulfur concentration in various plant parts of soybean variety 2 showed the following trend: in S20, the order was leaf > root > petiole > stem; in S40, leaf > root > stem > petiole; and in S80, S160, and S260, leaf > stem > root > petiole. For Hefeng 55, in S20, the order was leaf > petiole > root > stem; in S40 and S160, leaf > root > stem > petiole; in S80, leaf > root > petiole > stem; and in S260, leaf > stem > root > petiole (Fig. 3).
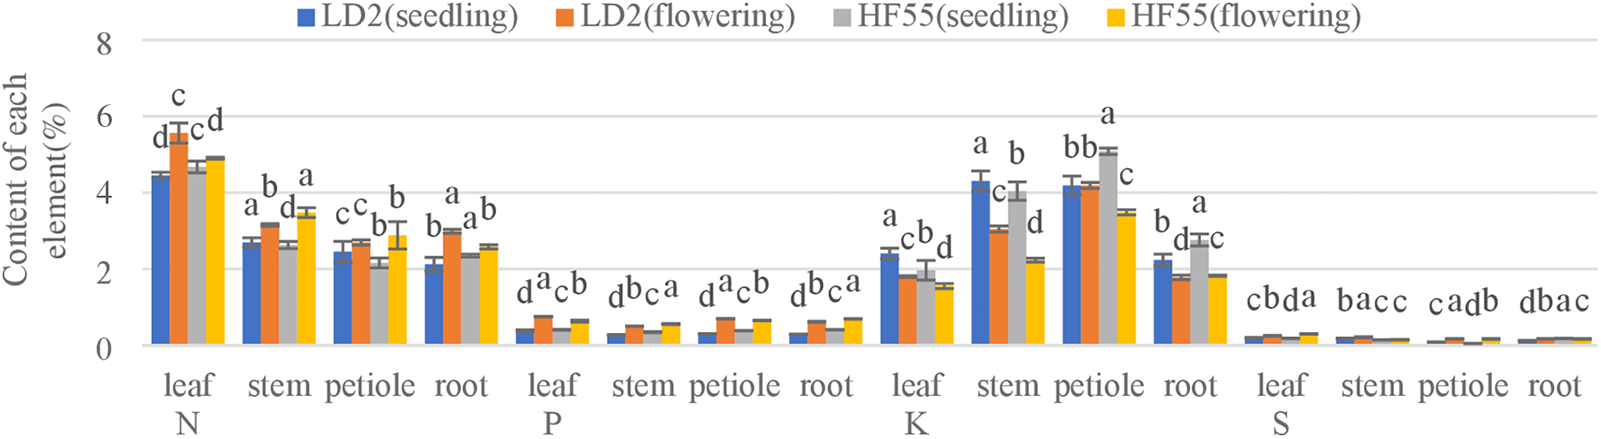
Figure 3: Comparison of element concentrations in various parts of soybean under S80 treatment. Note: Different letters represent significant differences between treatments at a significance level of 5% within the same plant part: soybean varieties, Laidou 2 (LD2), and Hefeng 55 (HF55)
During the seedling stage, the sulfur concentration in the leaves stems, and petioles of soybean variety 2 were substantially higher than that of Hefeng 55. Under the S40, S80, S160, and S260 treatments, the sulfur concentration in the leaves was higher by 6.1%, 4.8%, 1.9%, and 8.0%, respectively. The stems showed increases of 11.3% and 21.8% under the S40 and S80 conditions, respectively. The petioles demonstrated increases of 13.7%, 63.5%, and 2.9% under the S40, S80, and S260 conditions, respectively.
The sulfur concentration in the roots showed that variety Hefeng 55 had substantially higher levels than LD2 during the seedling stage, with increases of 80.8%, 60.4%, 52.9%, and 21.5% under the S20, S40, S80, and S260 conditions, respectively. During the flowering period, the sulfur concentration in the leaves of Hefeng 55 was substantially higher than that of Laidou 2; under the conditions of S20, S40, S80, S160, and S260, the sulfur concentration was higher by 7.9%, 5.6%, 30.4%, 4.4%, and 11.1%, respectively. The sulfur concentration in the stems, petioles, and roots of Laidou 2 was substantially higher than that of Hefeng 55. The sulfur concentration in the stems was higher by 42.9% and 13.2% under the S80 and S160 conditions, respectively. The sulfur concentration in the petioles was higher by 5.1% and 3.0% under the S40 and S80 conditions, respectively. The sulfur concentration in the roots was higher by 23.6% under S80 conditions.
3.2.5 Multifactor Analysis of Nitrogen, Phosphorus, Potassium and Sulfur Concentration
In order to analyze the independent and interactive effects of four factors, different varieties, different treatments, different parts, and different growth periods, on the measurement indicators, multivariate analysis of variance was used to conduct statistical tests, and the results are shown in Table 13. It can be seen that except for three cases (the influence of different varieties and different concentrations on phosphorus, the influence of different varieties and different periods on sulfur, and the influence of different treatments and different periods on phosphorus), the sig value of F value corresponding to other influencing factors is less than 0.01. At the same time, it can be seen in Figs. 4–7 that (in addition to the above three cases) there are obvious interactions between different varieties, different treatments, different parts and different growth periods, which can significantly affect the content of nitrogen, phosphorus, potassium and sulfur. The results showed that different varieties, different treatments, different parts, different growth stages and the combination of these four factors had significant effects on NPK concentration.
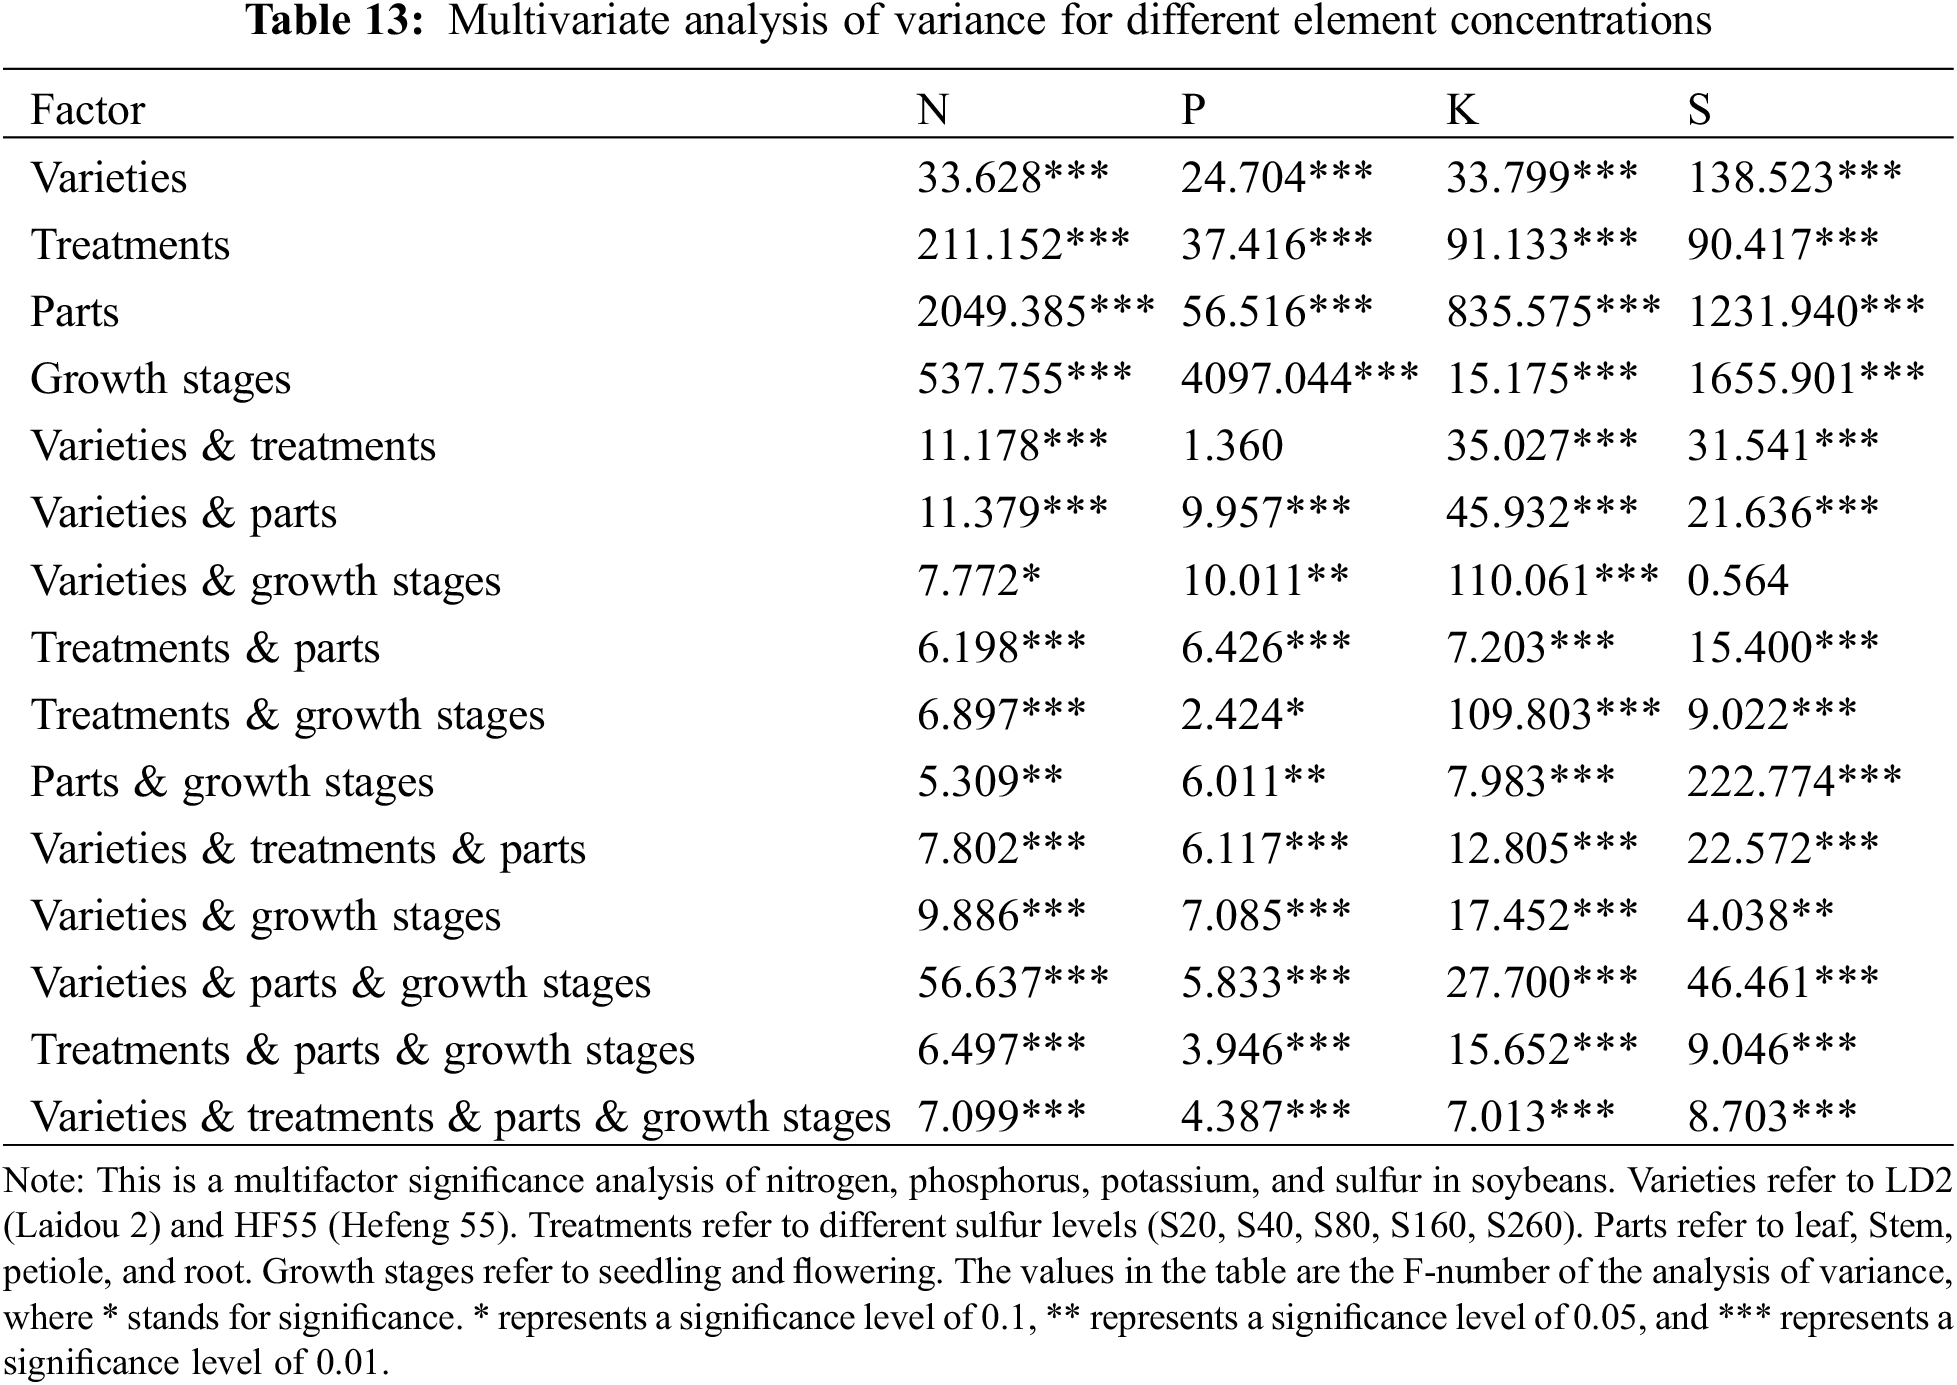
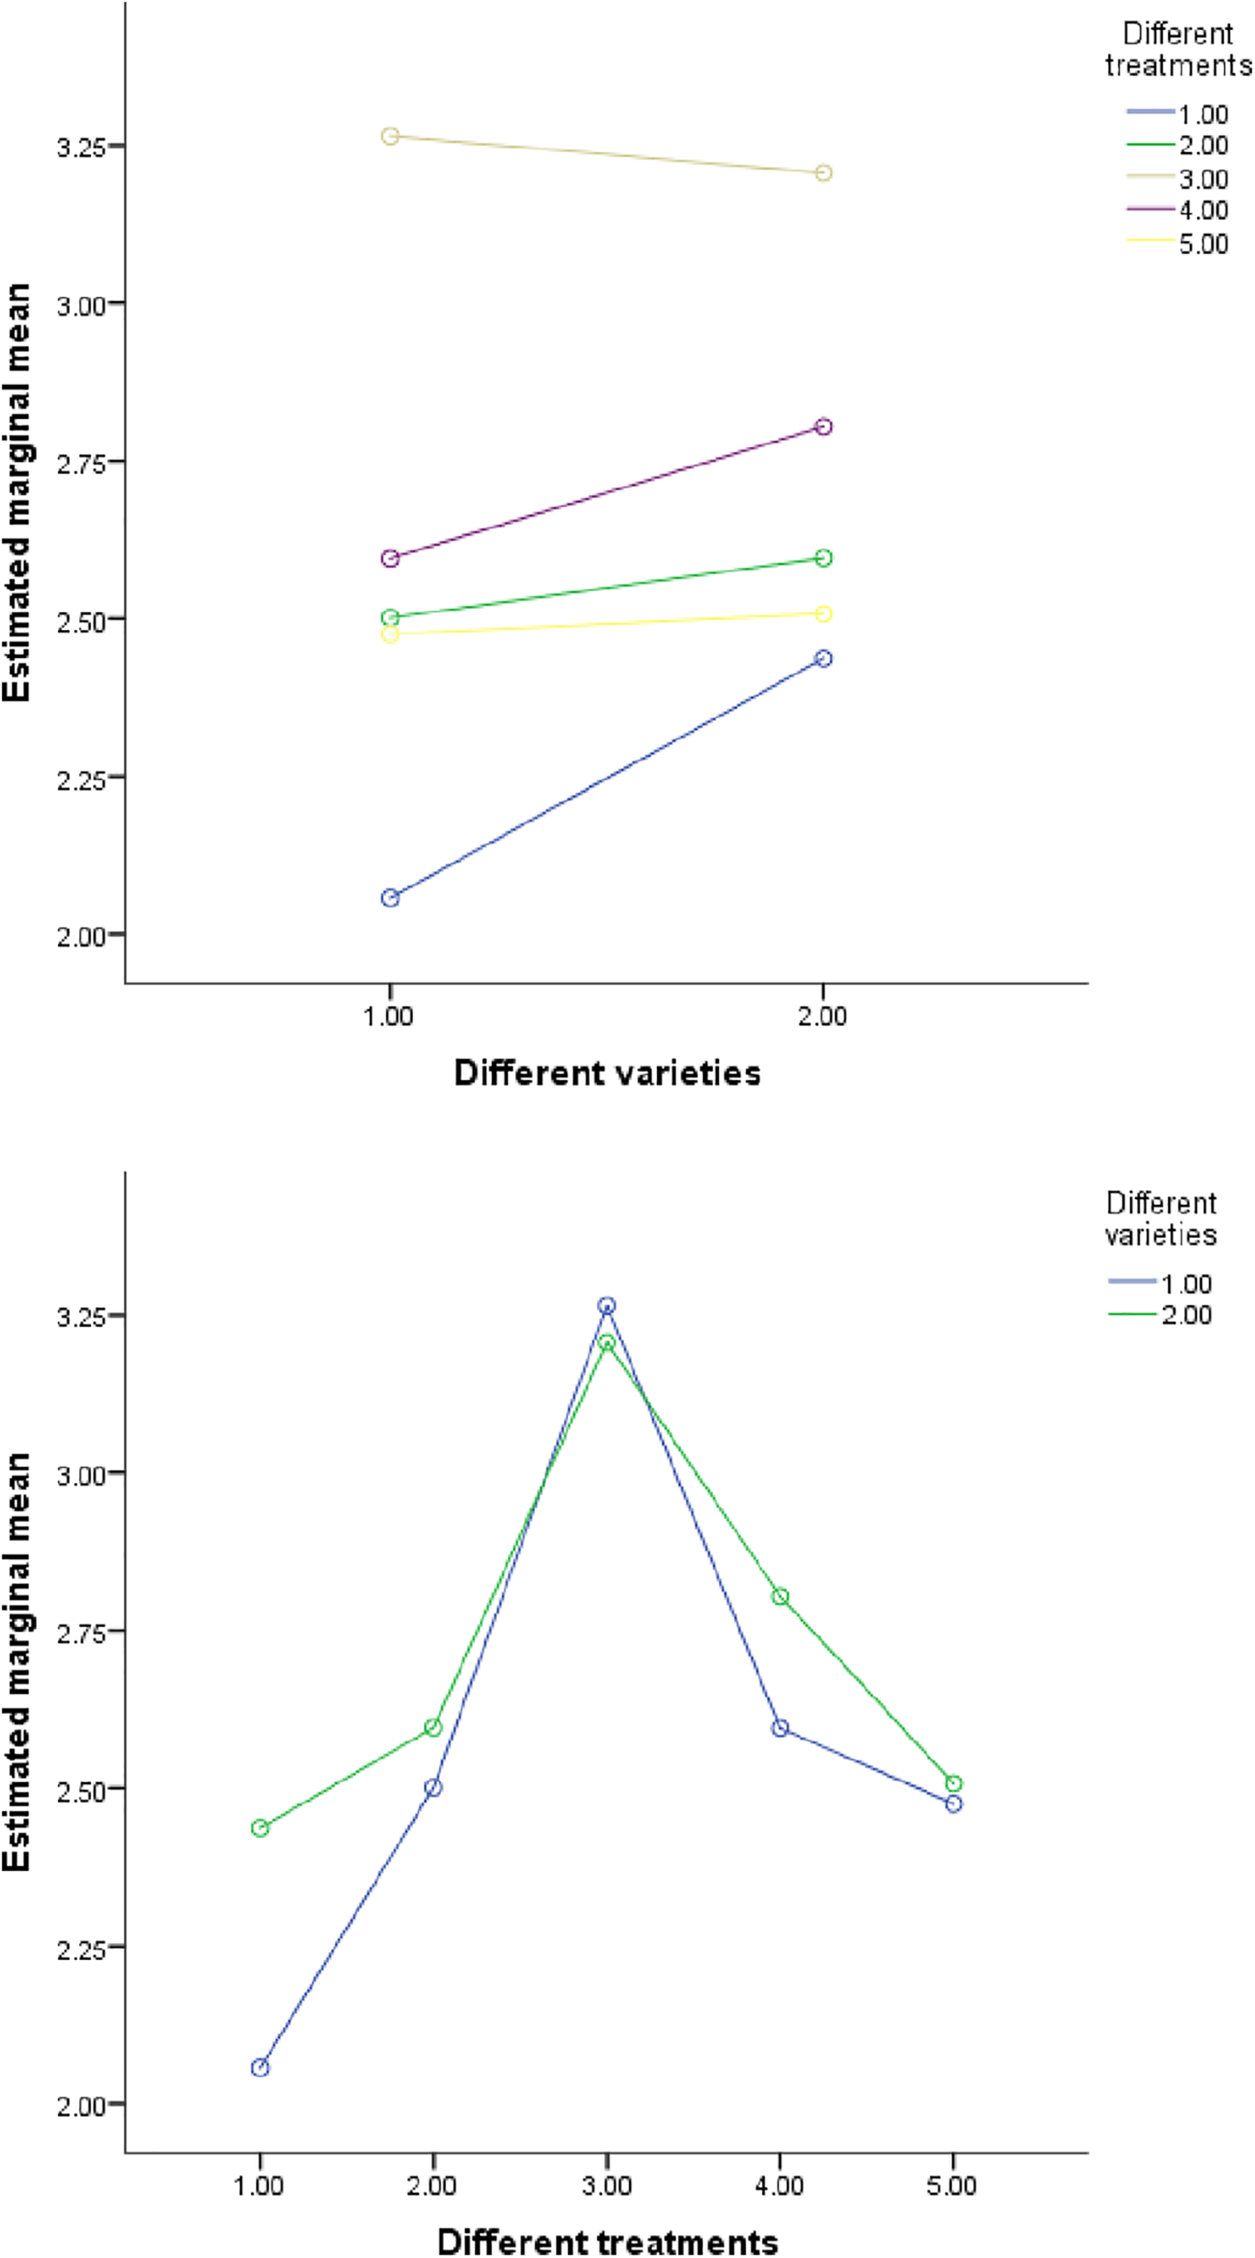
Figure 4: The influence of N element content in different interactions. Note: Variety 1 is LD2 (Laidou 2) and variety 2 is HF55 (Hefeng 55). Different treatments 1–5 refer to S20, S40, S80, S160 and S260, respectively. Different parts 1–4 correspond to leaf, stem, petiole and root, respectively. Period 1 is the seedling stage and period 2 is the flowering stage. In the figure, the horizontal and vertical coordinates represent the two factors. If the two lines are parallel, the interaction is not obvious; If the lines are not parallel, the interaction is significant. The same goes for the picture below
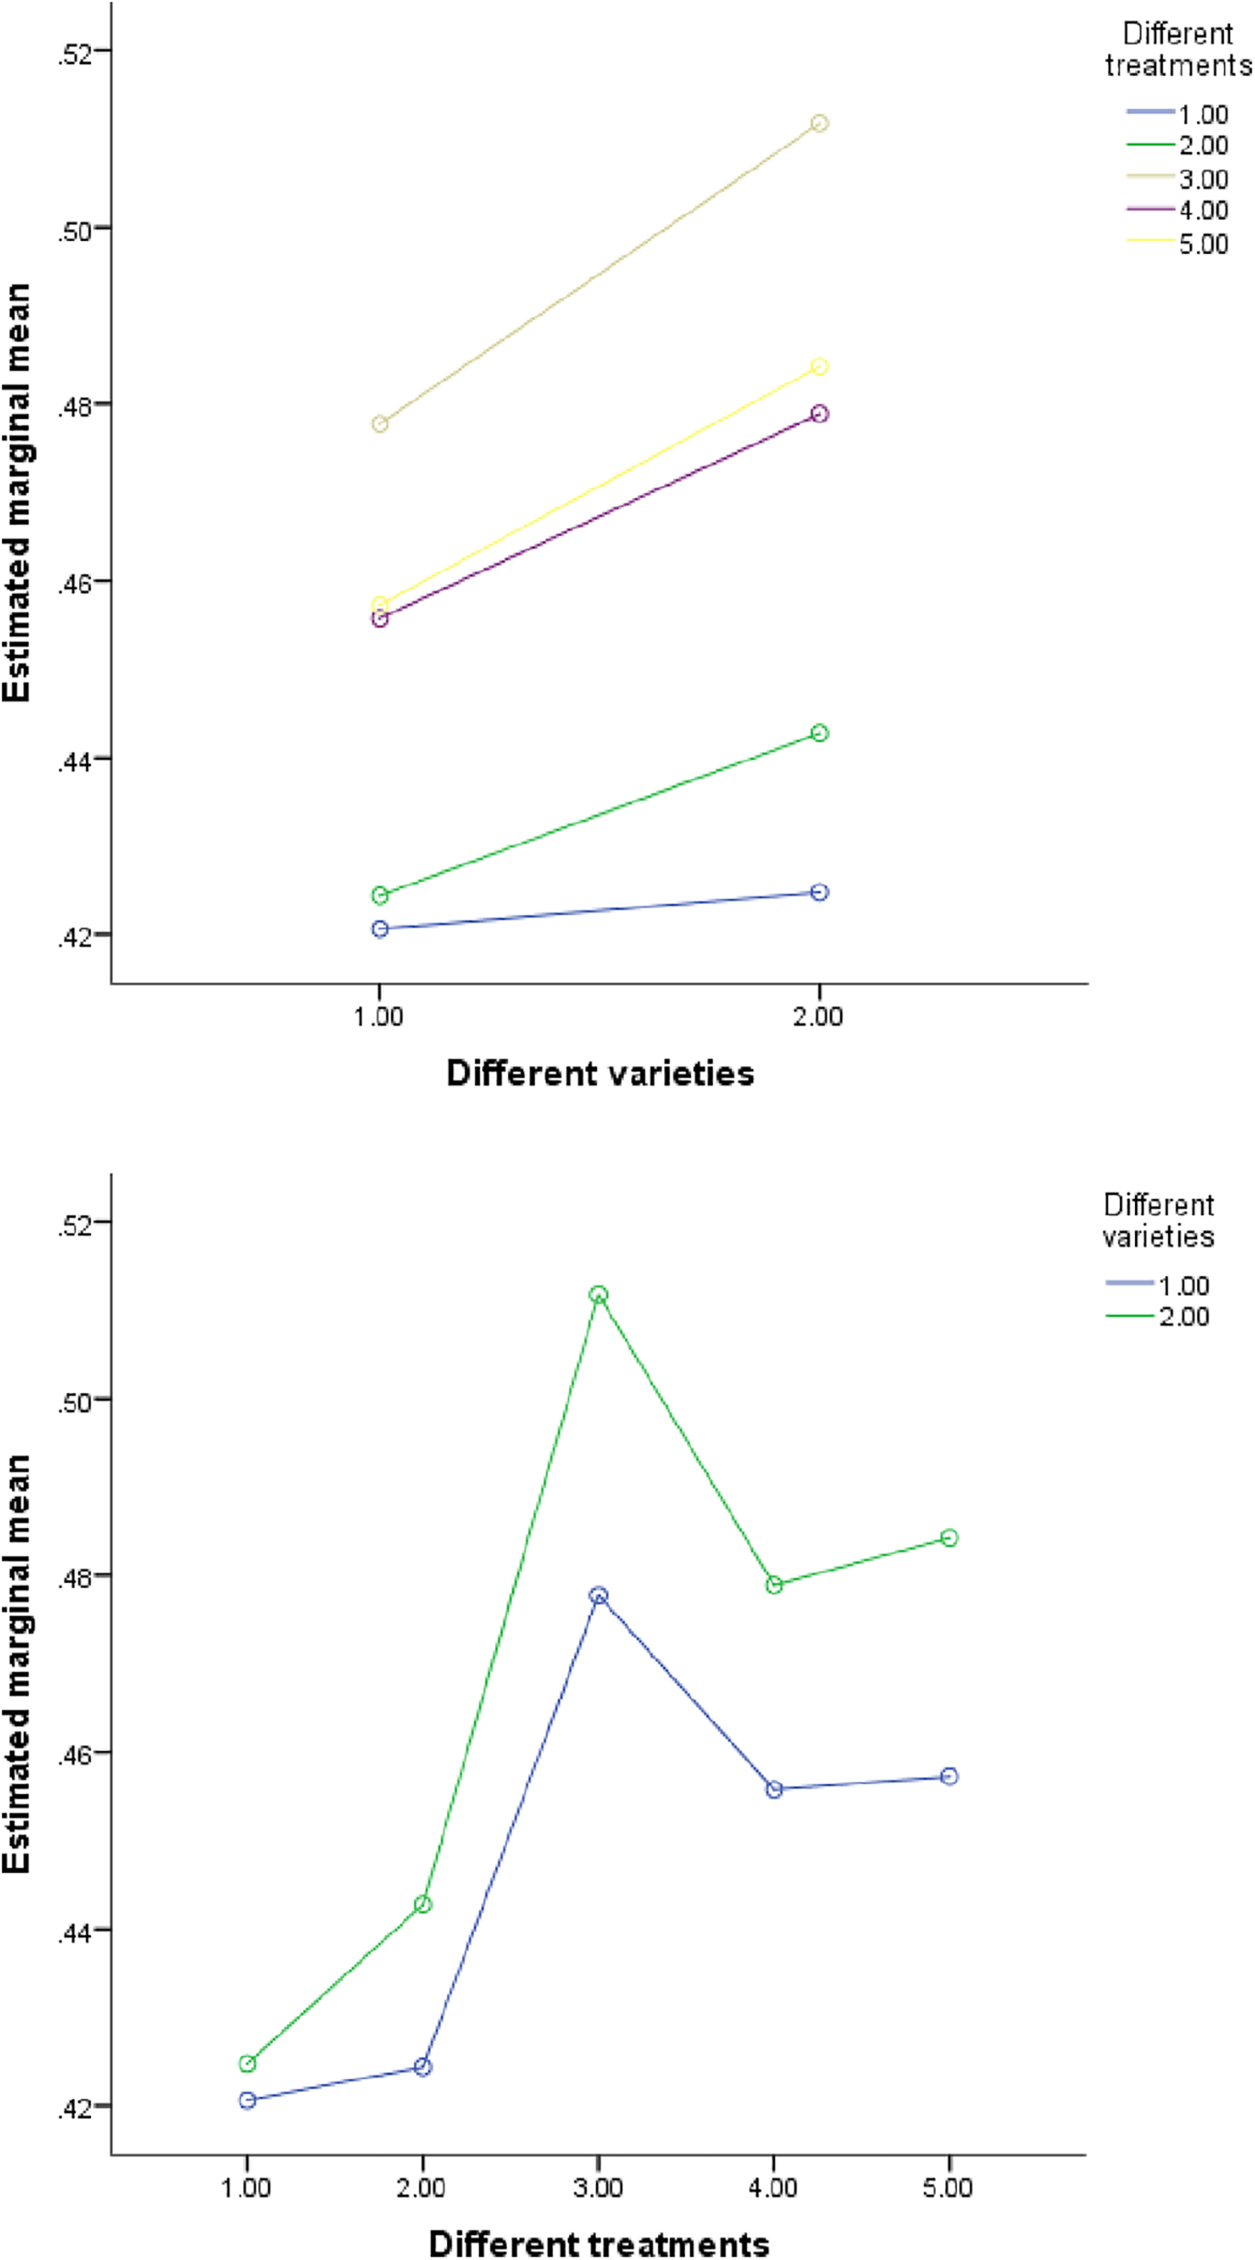
Figure 5: The influence of P element content in different interactions
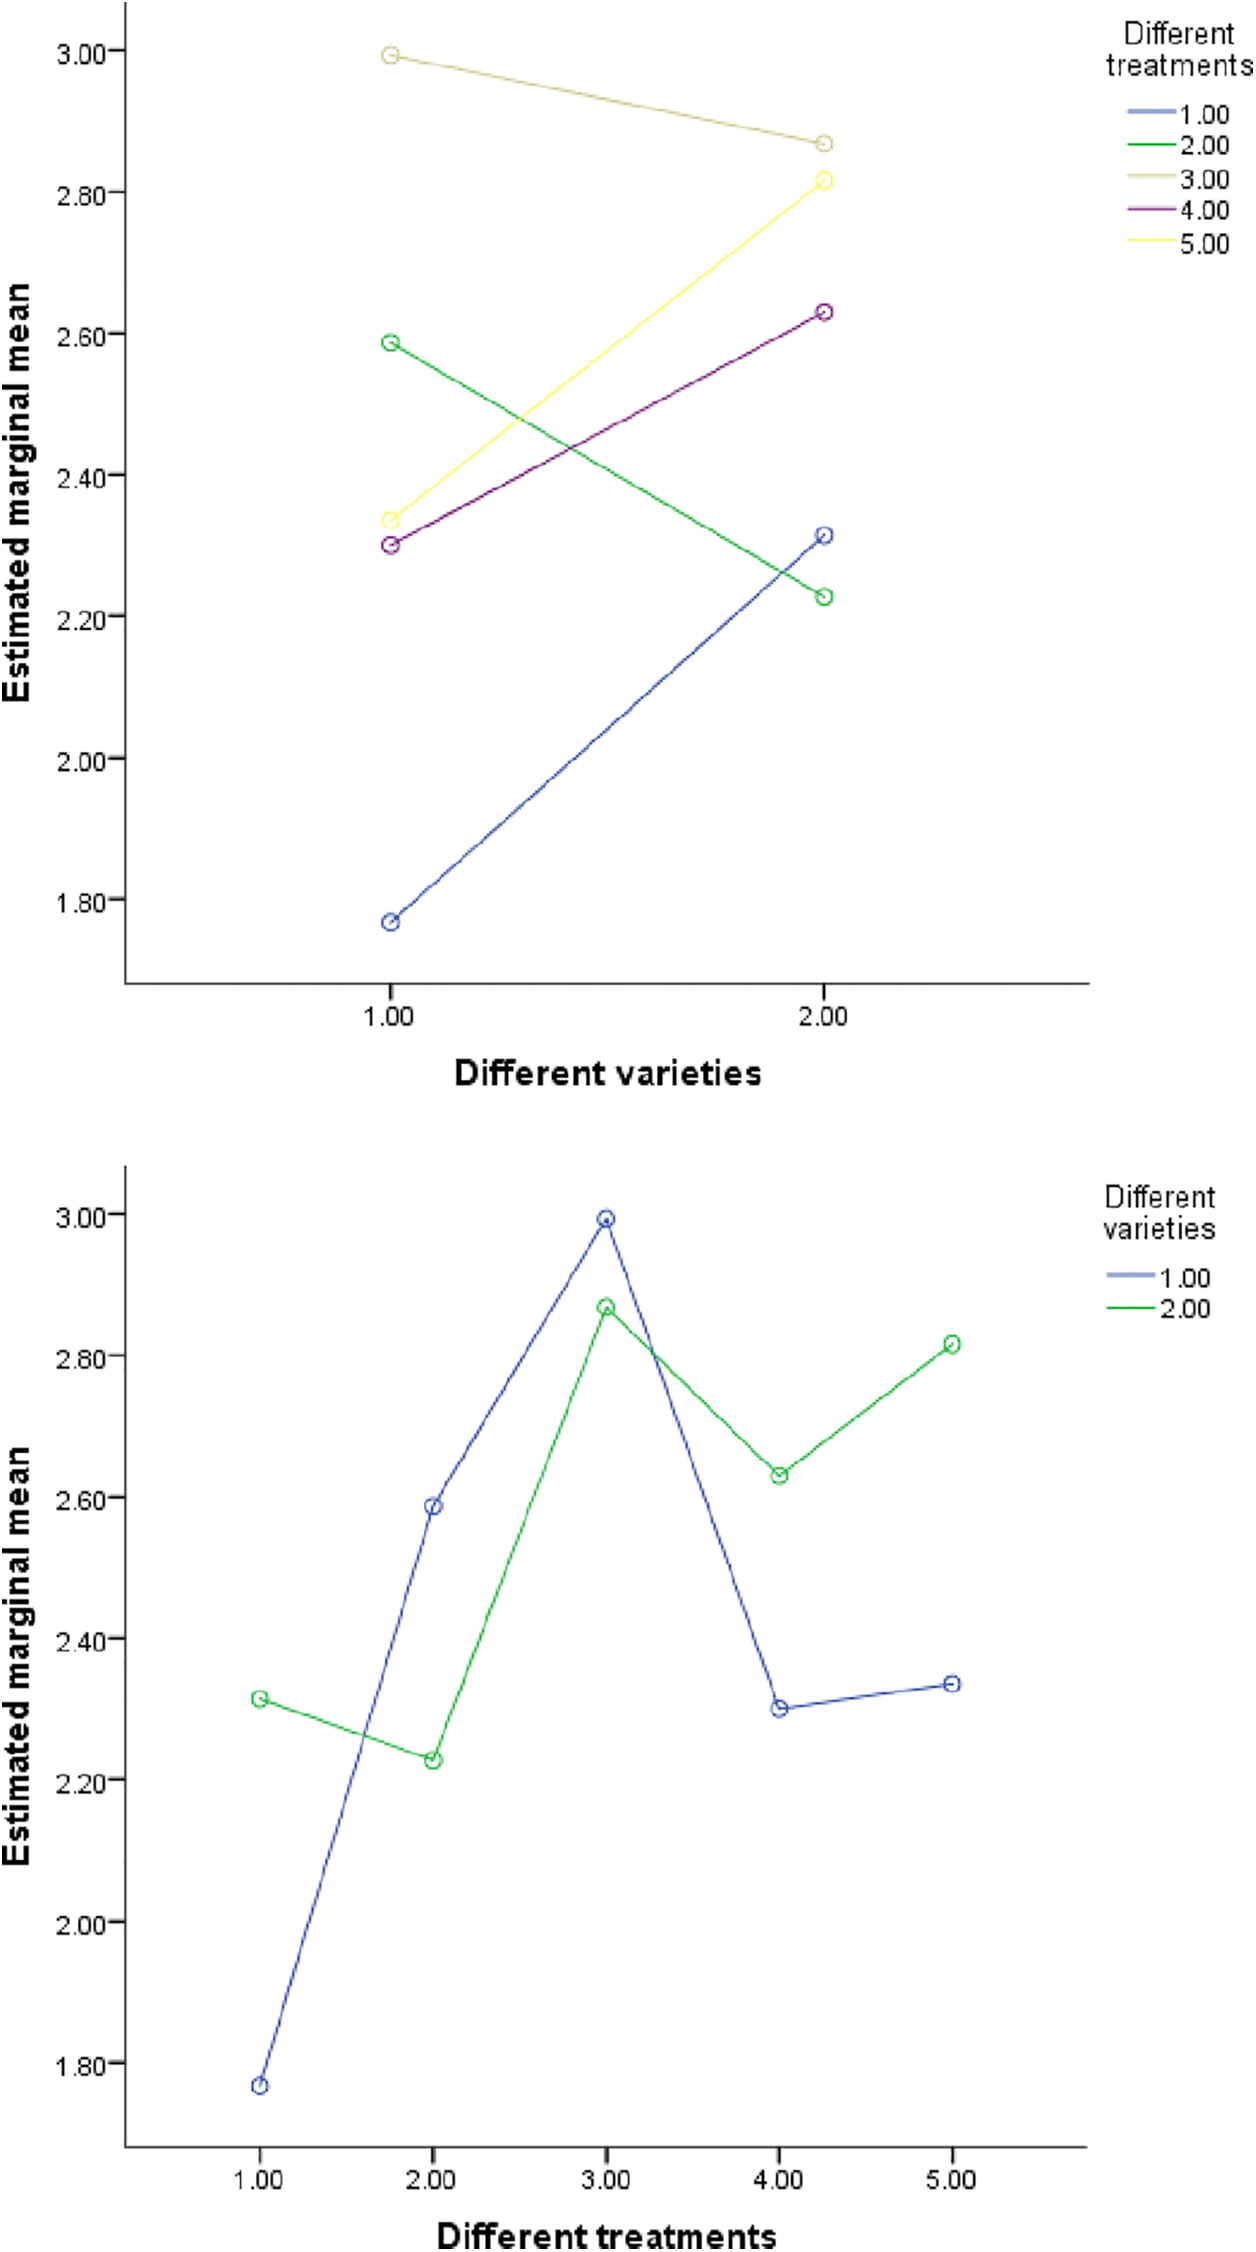
Figure 6: The influence of K element content in different interactions
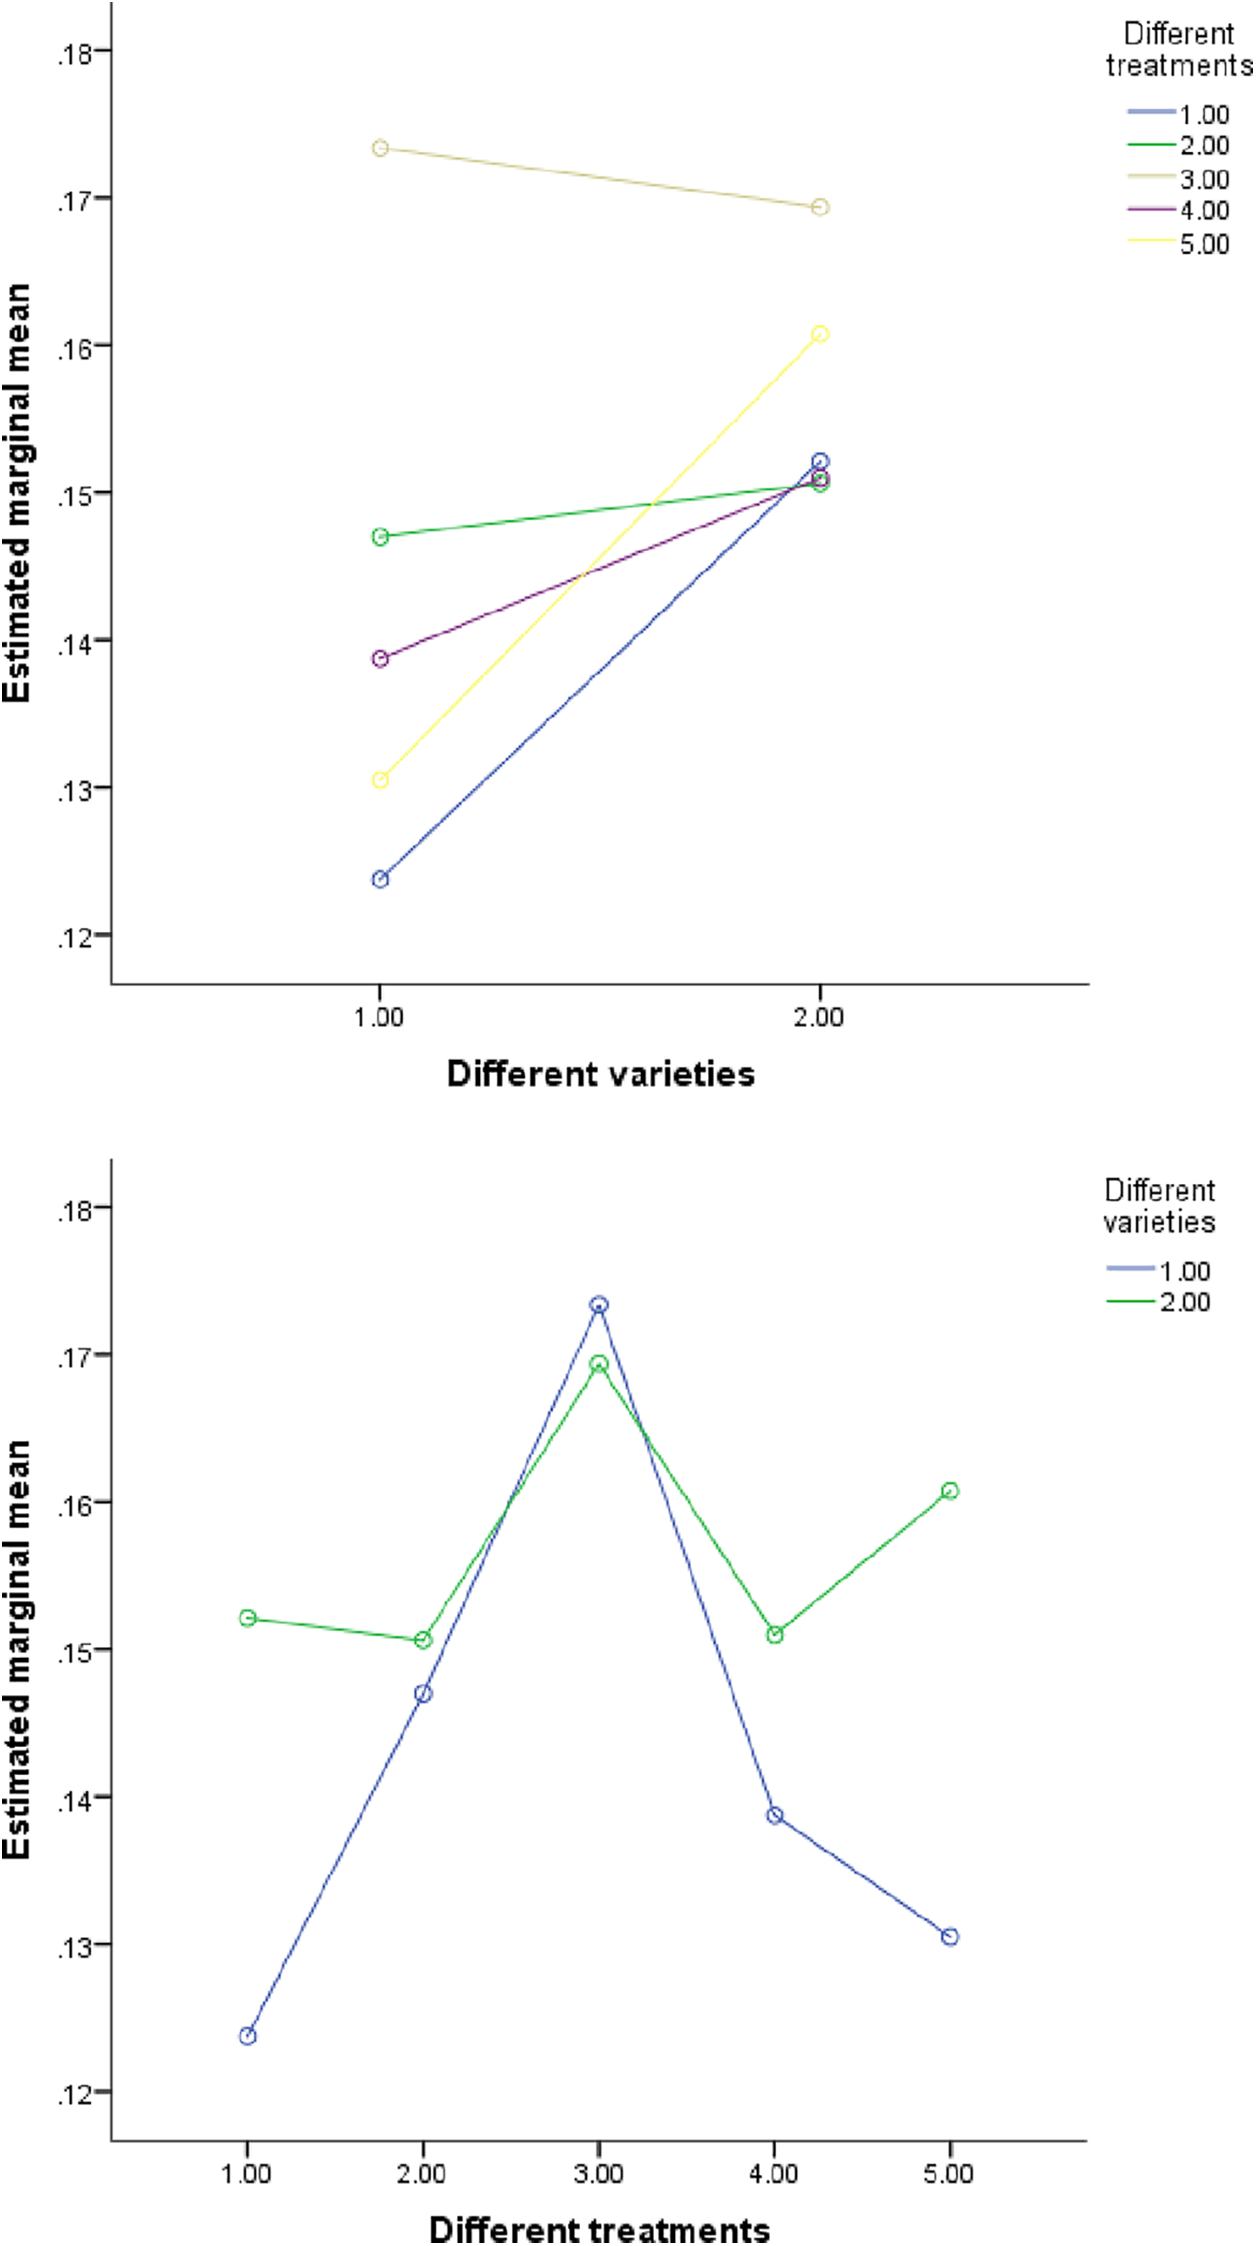
Figure 7: The influence of S element content in different interactions
4.1 Effect of Sulfur Level on Dry Matter Accumulation in Soybean Plants
The results of this experiment showed that the application of sulfur fertilizer could promote the accumulation of dry matter in various parts of soybean plants, and the distribution ratio in leaves was substantially higher than that of other parts. The studies of Rahman et al. [16–18] showed that the application of sulfur fertilizer to crops can promote the growth and development of plants and can increase the dry matter accumulation of potatoes, corn, and peanuts. Al-Amri et al. [19] showed that replacing cow dung (20 tons.ha–1) with sulfur (50 kg.ha–1) could increase the yield of onions, number of tubular leaves, and leaf area. Sulfur application increased the average yield per plant by 5.3% and the number of tubular leaves and leaf area by 19.8% and 7.2%, respectively, under different planting densities. The same conclusions were reached in the current experiment. The application of sulfur fertilizer promoted the growth of soybean plants; the dry matter weight of leaves, stems, petioles, and roots increased to varying degrees.
In studies by Islam et al. [20] and Neelam et al. [21], it was found that an appropriate amount of sulfur fertilizer could promote dry matter accumulation in plants, but when the sulfur treatment exceeded a certain range, the growth and accumulation of dry matter in plants were inhibited, which was similar to the results of the present study. In the current study, the dry matter accumulation of various parts of the soybean plants first increased and then decreased with an increase in sulfur nutrition. When the sulfur concentration continued to increase, it inhibited plant growth and reduced dry matter accumulation in various parts of the plants. Too much sulfur will affect different crops, which may be because excessive sulfur concentrations exceed the range that the plant can bear, interrupt the ion balance in the plant, and inhibit the accumulation of dry matter in various parts.
4.2 Effect of Sulfur Level on Nitrogen, Phosphorus, Potassium, and Sulfur Concentrations in Soybean Plants
In recent years, increasing attention has been paid to sulfur nutrition. The application of sulfur fertilizers can promote the absorption and utilization of various nutrients by plants [22]. However, different sulfur fertilizers have different effects on each nutrient element. Studies have shown that sulfur treatment of different crops can substantially increase plant nitrogen, phosphorus, potassium, and sulfur concentration [23,24]. Pai et al. [25] and Carciochi et al. [26] reported that the concentration of nitrogen, phosphorus, and potassium in plants was substantially higher than after a single application of nitrogen and sulfur under the application of two or three elements; the ratio of the two elements was not considered in this experiment. Keshavarz et al. [27] reported that the Zn utilization efficiencies of different wheat genotypes were different, which was the same as the results of the current experiment; the absorption of each nutrient in the two varieties differed, but the performance was the same. The nitrogen, phosphorus, potassium, and sulfur concentrations of the tested plants differed.
The N, P, K, and S in the leaves of different parts were substantially higher than those in the other parts. The concentrations of nitrogen, phosphorus, K, and sulfur in the leaves were in the order of nitrogen > potassium > phosphorus > sulfur, and the concentrations of nitrogen and potassium in the stems, petioles, and roots were substantially higher than those of phosphorus and sulfur. The changes in sulfur and potassium in leaves were greater than those in rhizomes, which may be because the demand for nutrients in leaves, the main photosynthetic organs during growth and development, is substantially greater than that in other organs [28]. An increase in sulfur nutrition caused an increase, then a decrease, in the concentrations of nitrogen, phosphorus, potassium, and sulfur in each part of the soybean plant. When the sulfur concentration was too high, the N, P, K, and sulfur in each part of the soybean plant decreased, which is similar to the results of Paliwal et al. [29] and Jadav et al. [30]. The reason for this phenomenon may be that excessive sulfur leads to an imbalance in other nutrient elements during plant growth. A high concentration of sulfur affects the pH value and microbial activity of the soil, thereby affecting the effective absorption of other nutrient elements by plants.
There is a close interaction between sulfur and various other elements during plant growth and development. Sulfur concentration has an important influence on plant growth, development, photosynthesis, and other physiological processes. The absorption and assimilation of nitrogen and sulfur are mutually regulated. Sulfur fertilization can lead to an increase in nitrogen uptake efficiency, which may be because sulfur can stimulate the nitrogen fixation process, affect nitrogen recovery, and increase nitrogen yield [31]. In legumes, the association between nitrogen and sulfur is also affected by nodules, and nodules have a high demand for sulfur [32]. The demand for nitrogen and sulfur in plants is balanced, and a reasonable supply of nitrogen and sulfur helps maintain the nitrogen: sulfur ratio in plants, which is conducive to the normal synthesis of proteins and other bioactive molecules. In contrast to other elements, the change in phosphorus concentration was very small with a change in sulfur concentration. The relationship between phosphorus and sulfur is mainly based on phosphate starvation reaction 1 (PHR1), an MYB-like transcription factor initially implicated in P homeostasis [33]. During crop growth and development, sulfur is involved in ATP synthesis, whereas sulfur and potassium are involved in the regulation of proteins, enzyme activity, and resistance [34]. Studies have shown that TOR complex 1 (TORC1) is involved in the response to and regulation of potassium flux [35], which may also regulate the interaction between potassium and sulfur. Potassium plays an important role in regulating osmotic pressure, maintaining cellular ion balance, and promoting plant photosynthesis and respiration [36]. During plant growth and development, sulfur and K interact and play synergistic roles in plant growth. The availability of sulfur affects the absorption and utilization of potassium by plants and vice versa.
The dry matter weight of the whole plant and the concentrations of nitrogen, phosphorus, K, and sulfur in different parts of the soybean first increased and then decreased with an increase in sulfur concentration, reaching the maximum value under the S80 treatment. The distribution ratio of dry matter in different parts of the soybean plants was leaf > root > stem > petiole at the seedling stage and leaf > stem > root > petiole at the flowering stage, and the trends among varieties were consistent. The effects of sulfur concentration on nitrogen, phosphorus, potassium, and sulfur concentration in different parts of the soybean plants varied. The N, P, and sulfur in the leaves, stems, and petioles at the flowering stage were higher than those at the seedling stage, and the K concentration at the seedling stage was higher than that at the flowering stage. This study explains in detail the specific effects of sulfur levels on nutrient accumulation at different growth stages, which helps to optimize agricultural production practices and fertilizer management strategies and provides a reference for environmental protection. Reasonable management of sulfur concentration can reduce pollutant emissions in soil and water and reduce negative impacts on the ecosystem.
Acknowledgement: We thank Shoukun Dong for his guidance and support; Xinhe Wei, Wei Zhao, and Yanbin Sun for participating in this experiment; and Northeast Agricultural University Agricultural College for providing experimental sites and equipment.
Funding Statement: This work was supported by the Natural Science Foundation of the Heilongjiang Province of China (Grant No. LH2021C023).
Author Contributions: Research conception and design: Shoukun Dong and Xinhe Wei; data collection: Xinhe Wei and Wei Zhao; analysis and explanation of the results: Xinhe Wei and Wei Zhao; preparation of the first draft: Xinhe Wei and Yanbin Sun. All authors reviewed the results and approved the final version of the manuscript.
Availability of Data and Materials: All data generated or analyzed during this study are included in this published article.
Ethics Approval: Not applicable.
Conflicts of Interest: The authors declare that they have no conflicts of interest to report regarding the present study.
References
1. Zou Y, Liu C. Nutritional constituents of Soybea grown in northeast region of China. Food Technol-Univ Galaţi. 2016;40(1):3–7. [Google Scholar]
2. Sáez-Plaza P, Michałowski T, Navas MJ, Asuero AG, Wybraniec S. An overview of the kjeldahl method of nitrogen determination. Part I. Early history, chemistry of the procedure, and titrimetric finish. Crit Rev Anal Chem. 2013;43(4):178–223. doi:10.1080/10408347.2012.751786. [Google Scholar] [CrossRef]
3. Gu QP, Zhou J. The development and revelation of the world soybean industry. In: Proceedings of the 2015 International Conference on Industrial Technology and Management Science; 2015; Tianjin, China. [Google Scholar]
4. Tylka GL, Wisner RN. Soybean rust and the food processing industry. Food Technol. 2005;59(6):1–2. [Google Scholar]
5. Thompson JF. Sulfur metabolism in plants. Annu Rev Plant Physiol. 1967;18(1):59–84. doi:10.1146/annurev.pp.18.060167.000423. [Google Scholar] [CrossRef]
6. Capaldi FR, Gratão PL, Reis AR, Lima LW, Azevedo RA. Sulfur metabolism and stress defense responses in plants. Trop Plant Biol. 2015;8(3–4):60–73. doi:10.1007/s12042-015-9152-1. [Google Scholar] [CrossRef]
7. Ram A, Kumar D, Babu S, Prasad D. Effect of sulphur on soil biological properties, residual fertility and yield of aerobic rice grown under aerobic rice-wheat cropping system in inceptisols. J Environ Biol. 2017;38(4):9–12. [Google Scholar]
8. Gorlas A, Marguet E, Gill S, Geslin C, Guigner JM, Guyot F, et al. Sulfur vesicles from thermococcales: a possible role in sulfur detoxifying mechanisms. Biochimie. 2015;118:358–363. [Google Scholar]
9. MorrisKatz S. Dioxide in atmosphere and its relation to plant life. Ind Eng Chem Res. 2002;41(11):2450–65. [Google Scholar]
10. Yamaguchi J. Sulfur deficiency of rice plants in the lower volta area, Ghana. S Soil Sci Plant Nutr. 2012;45(2):367–83. [Google Scholar]
11. Singh S, Singh V, Layek S. Influence of sulphur and zinc levels on growth, yield and quality of soybean (Glycine max L.). Int J Plant Sci. 2017;18(2):1–7. [Google Scholar]
12. Wang X, Li X, Wu Z, Dong S. Transcriptome analysis of soybean in response to different sulfur concentrations. Phyton-Int J Exp Bot. 2022;91(6):1165–82. [Google Scholar]
13. Kowaleeko CG, Babuie D. Interference problems with phosphoantimonylmolybdenem colorimetric measurement of phosphorus in soil and plant materials. Commun Soil Sci Plant Anal. 2007;38(9–10):1299–316. [Google Scholar]
14. Madagoudra YB, Jakkannagari C, Prakash T, Lokesh R, Adhikari P, Baral BR, et al. Effect of rate and time of nitrogen application on nutrient content and uptake in summer maize (Zea mays L.) and soil nutrient status after harvest. Int J Econ Plants. 2021;8(2):57–61. [Google Scholar]
15. Geeta PK, Shrawan S, Manisha S, Sandhya M, Navinder S, Mrinmoy R, et al. Dietary micronutrient content, heterosis and combining ability for breeding mineral-rich hybrids in early-and mid-maturity groups of Indian cauliflower. Sci Hortic. 2023;(2–3):312. [Google Scholar]
16. Rahman MW, Islam S, Islam MM, Hossain MS. Effect of sulphur on the yield and quality of potato varieties in Tista meander floodplain soil of Bangladesh. Int J Plant Sci. 2019;30(4):1–8. [Google Scholar]
17. Ogunsola KE, Adetunji MT. Effects of phosphorus and sulphur on dry matter yield of maize (Zea mays) in some soils at abeokuta, Ogun state, Nigeria. J Agron Crop Sci. 2016;15(2):1–8. [Google Scholar]
18. Karanja NK. Effect of sulphur and inoculation on nodulation, dry matter and nitrogen in groundnuts. East Afr Agric J. 2016;50(1–4):1–68. [Google Scholar]
19. Al-Amri BKF, Al-Abdaly MMM. Effect of adding sulfur and organic fertilizer on growth and yield of onions (Allium Cepa L.) under different plant densities. IOP Conf Series: Earth Env Sci. 2021;910(1):1–5. [Google Scholar]
20. Islam AKMS, Rana MS, Rahman DMM, Mian MJA, Rahman MM, Rahman MA, et al. Growth, yield and nutrient uptake capacity of rice under different sulphur levels. Turk J Agricu-Food Sci Technol. 2016;4(7):557–65. [Google Scholar]
21. Neelam C, Nalini P. Effect of sulfur on the growth, dry matter, tissue sulfur and carbohydrate concentration of Allium sativum L. and Allium cepa L. Ind J Agric Biochem. 2014;26(2):182–6. [Google Scholar]
22. Shah SH, Islam S, Mohammad F. Sulphur as a dynamic mineral element for plants: a review. J Soil Sci Plant Nutr. 2022;22(2):1–3. [Google Scholar]
23. Khadim D, Ahmed KA, Rahman JMM, Ahmad MI, Bushra K, Bashir A, et al. Effect of nitrogen in combination with different levels of sulfur on wheat growth and yield. ACS Omega. 2023;8(1):279–88. doi:10.1021/acsomega.2c04054. [Google Scholar] [PubMed] [CrossRef]
24. Barczak B, Knapowski T, Kozera W, Ralcewicz M. Effects of sulphur ferilization on the content and uptake of macroelements in narrow-leaf lupin. Rom Agric Res. 2014;31:245–51. [Google Scholar]
25. Pai VG, Prameela P, Vijayan R. Interactive effect of conservation tillage, potassium and magnesium sulphate fertilization on dry matter production, physiological and yield parameters, and yield of grain cowpea. Int J Environ Clim Change. 2023;13(8):1–10. [Google Scholar]
26. Carciochi WD, Salvagiotti F, Pagani A, Calvo NR, Eyherabide M, Rozas HS, et al. Nitrogen and sulfur interaction on nutrient use efficiencies and diagnostic tools in maize. Eur J Agron. 2020;116:1–11. [Google Scholar]
27. Keshavarz P, Forouhar M, Dadivar M. Investigation of Zn use efficiency and Zn fertilization efficiency in some genotypes of wheat. Maj āb va Khāk. 2016;29(6):1711–20. [Google Scholar]
28. Shabala S, Newman I. Light-induced changes in hydrogen, calcium, potassium, and chloride ion fluxes and concentrations from the mesophyll and epidermal tissues of bean leaves. Understanding the ionic basis of light-induced bioelectrogenesis. Plant Physiol. 1999;119(3):1115–24. doi:10.1104/pp.119.3.1115. [Google Scholar] [PubMed] [CrossRef]
29. Paliwal AK, Vajpai SK, Vajpai K. Interaction effect of sulphur and phosphorus application on yield and major nutrient composition of soybean (Glycine max L. Merrill) grown on alfisol. Asian J Soil Sci. 2009;4(1):113–7. [Google Scholar]
30. Jadav DP, Padamani DR, Polara KB, Parmar KB, Babaria NB. Interaction effect of sulphur and potassium on yield and nutrients uptake by sesame (Sesamum indicum L.). Asian J Soil Sci. 2010;5(1):144–7. [Google Scholar]
31. Tallec T, Diquélou S, Avice JC, Lesuffleur F, Lemauviel-Lavenant S, Cliquet J-B, et al. Availability of N and S affect nutrient acquisition efficiencies differently by trifolium repens and lolium perenne when grown in monoculture or in mixture. Environ Exp Bot. 2009;66(2):309–16. doi:10.1016/j.envexpbot.2009.02.002. [Google Scholar] [CrossRef]
32. Sébastien V, Jean-Bernard C, Emmanuelle P, Jean-Christophe A, Servane LL. How does sulphur availability modify n acquisition of white clover (Trifolium repens L.)? J Exp Bot. 2010;61(1):225–34. doi:10.1093/jxb/erp303. [Google Scholar] [PubMed] [CrossRef]
33. Hatem R, David S, Bulak A, Yves P. The transcription factor PHR1 plays a key role in the regulation of sulfate shoot-to-root fux upon phosphate starvation in arabidopsis. BMC Plant Biol. 2011;11(1):19. doi:10.1186/1471-2229-11-19. [Google Scholar] [PubMed] [CrossRef]
34. Gayathri P, Pandian PS. Evaluation of various levels of phosphorus and sulphur on yield and economics of Blackgram (Phaseolus mungo L) in Vylogam soil series of Madurai district. Int J Farm Sci. 2019;9(1):85–8. doi:10.5958/2250-0499.2019.00011.9. [Google Scholar] [CrossRef]
35. Cecilia P, Alba FB, Robbie L, Lynne Y. Reciprocal regulation of target of rapamycin complex 1 and potassium accumulation. J Biol Chem. 2017;292(2):563–74. doi:10.1074/jbc.M116.746982. [Google Scholar] [PubMed] [CrossRef]
36. Chen Y, Zhang S, Du S, Wang G, Zhang J, Jiang J. Effects of exogenous (K+) potassium application on plant hormones in the roots of tamarix ramosissima under NaCl stress. Genes. 2022;13(10):1–19. [Google Scholar]
Cite This Article
 Copyright © 2024 The Author(s). Published by Tech Science Press.
This work is licensed under a Creative Commons Attribution 4.0 International License , which permits unrestricted use, distribution, and reproduction in any medium, provided the original work is properly cited.
 Downloads
 Citation Tools