
 Submit a Paper
 Propose a Special lssue
 Open Access
ARTICLE

Genome-Wide Analysis for Yield-Related Agronomic and Biochemical Traits of Chinese and Bangladeshi Grass Pea Genotypes Using SSR Markers
1 Institute of Crop Sciences, Chinese Academy of Agricultural Sciences (CAAS), Beijing, 100081, China
2 Pulses Research Center, Bangladesh Agricultural Research Institute (BARI), Gazipur, 1701, Bangladesh
3 Hybrid Rice Division, Bangladesh Rice Research Institute (BRRI), Gazipur, 1701, Bangladesh
4 Northwest Agriculture & Forestry University, Yangling, 712199, China
5 International Center for Agricultural Research in the Dry Areas (ICARDA), New Delhi, 110012, India
6 Wheat Breeding Division, Bangladesh Wheat and Maize Research Institute, Dinajpur, 5200, Bangladesh
7 Zoology Department, College of Science, King Saud University, Riyadh, 11451, Saudi Arabia
8 Department of Botany, Hindu College Moradabad (Mahatma Jyotiba Phule Rohilkhand University, Bareilly), Moradabad, 244001, India
9 Department of Agronomy and Agroforestry, Centurion University of Technology and Management, Odisha, 761211, India
10 Soil Science Division, Bangladesh Wheat and Maize Research Institute, Dinajpur, 5200, Bangladesh
* Corresponding Authors: Sagar Maitra. Email: ; Akbar Hossain. Email:
Phyton-International Journal of Experimental Botany 2024, 93(8), 1781-1804. https://doi.org/10.32604/phyton.2024.048992
Received 23 December 2023; Accepted 30 April 2024; Issue published 30 August 2024
 View Full Text
 Download PDF
Abstract
Grass pea (Lathyrus sativus L.) is an imperative food crop cultured in dryland agricultural ecology. It is a vital source of dietary protein to millions of populaces living in low-income countries in South-East Asia and Africa. This study highlights the improvement of genomic properties and their application in marker-trait relationships for 17 yield-related characters in 400 grass pea genotypes from China and Bangladesh. These characters were assessed via 56 polymorphic markers using general linear model (GLM) (P+G+Q) and mixed linear model (MLM) (P+G+Q+K) in the tassel software based on the linkage disequilibrium and population structure analysis. Population structure analysis showed two major groups and one admixed group in the populace. Statistically significant loci pairs of linkage disequilibrium (LD) mean value (D′) was 0.479. A total of 99 and 61 marker-trait associations in GLM and MLM models allied to the 17 traits were accepted at a 5% level of significance. Among these markers, 21 markers were associated with more than one trait; 12 marker-trait associations passed the Bonferroni correction threshold. Both models found six markers C41936, C39067, C34100, C47146, C47638, and C43047 significantly associated with days to maturity, flower color, plant height, and seed per pod were detected in the Hebei and Liaoyang location (p ≤ 0.01), and the interpretation rate (R2 value) 11.2% to 43.6%. Conferring to the consequences, the association analysis methodology may operative system for quantitative, qualitative, and biochemical traits related to gene position mapping and support breeders in improving novel approaches for advancing the grass pea quality.Keywords
Supplementary Material
Supplementary Material FileGrass pea (Lathyrus sativus L.) is a vital pulse crop of profitable importance in Bangladesh, India, Pakistan, Nepal, and Ethiopia [1]. It is also cultured in Central, South, and Eastern Europe, West Asia, and North Africa [2]. Grass pea is mostly self-pollinated and diploid with 2n = 14, although the outcrossing rate is 2.2% [3]. Nutritional security, domestic food, and profitable earnings are possible through reinforcement and extension of the cropping patterns of legumes [4].
The Lathyrus genus has an unlimited implication as food and silage but is neglected. High protein content, erosion control, nitrogen fixation, and insect and disease resistance are extra advantages of Lathyrus species [5]. Lathyrus cultivation is deteriorating, putting the species at risk of genetic loss [6]. Lathyrus is a mineral source for cattle in Mediterranean climates [7,8]. Grass pea produces more seeds than other legumes, particularly in dry conditions, and does not shatter their pods. Farmers harvest the plant for seed production over feed [9]. Despite many advantages, consuming an anti-nutritional issue, β-N-oxalyl-L-α, β-diamino propionic acid (β-ODAP) in leaves of the plant with seeds is that reasons of a neurological disorder that consequences in stable paralysis of the lower limbs in individuals [10,11].
The main goals of grass pea breeding by reduce β-ODAP content and increase the combination of yield components such as seeds pod−1, pod plant−1, and forage yield varieties of grass pea [2]. The discovery of molecular markers associated with low diamino propionic acid (ODAP) allele’s transfer of this trait into locally adapted germplasm is a promising method for grass pea breeding [12].
Molecular markers provide various advantages over traditional phenotyping processes in plant materials regardless of environmental impacts [13]. Inter simple sequence repeat marker (ISSR) can be used in genome mapping, evolutionary biology, and genetic diversity for high polymorphism [14]. Expressed sequence tag-based simple sequence repeat (EST-SSR) markers may be used for proportional mapping and genetic linkage maps in a variety of species [15]. A single marker has specific advantages, but when combined, they produce a broad application in the assessment of population structure, genetic differences, and aided selection for crop development [14,16,17]. Some studies have revealed that both EST-SSR and ISSR markers are largely used to advance the genetic linkage maps [18].
Mostly, self-pollinated crop shows a high level of linkage disequilibrium (LD) and cross-pollinated crops show low LD because they will have a greater recombination degree and the linkage disequilibrium breakdown between gene loci [19]. High linkage disequilibrium performs small mapping resolution, whereas Association mapping in populations with low linkage disequilibrium needs many markers [20]. The non-sampling non-random association of alleles among linked or unlinked loci raised by linkage disequilibrium is based on Relationship mapping to detect genetic regions related to agronomic traits [19,21,22]. The population structure of germplasm pools is also essential for relations between genetic and useful diversity and is suitable for association studies [23]. As a result, population structure is involved as an effect in the model of association analysis [18,24].
Most of the traits such as yield, agronomy, quality, and resistance belong to quantitative traits measured by several genes from segregating populations in the crop. The discovery of quantitative trait loci (QTL) with slight contributions to phenotypic traits and atmospheric sensitivity is challenging [25]. The natural populations are taken as the experimental tools, identifying several alleles on the identical locus and directing the single loci. Linkage analysis detects the allele regulatory an object trait in advance; association analysis modifies the object of the gene rapidly [26].
The correlation coefficient of path analysis has a direct and indirect effect on yield per plant and yield-related traits. Path analysis exposes whether the association of the traits with yield is due to their direct effect or is a consequence of their indirect effect via other traits. Path analysis documents the division of the correlation coefficient between its components or mechanisms [27]. Path analysis is equitable by assessing the direct effect of one variable on another and also separates the correlation for its mechanisms [28]. The purposes of this study were (a) to evaluate the population structure and the genetic diversity of the 400 grass pea germplasm, (b) to detect SSR markers related to the studied traits, and (c) to evaluate the comprehensive effects of allelic arrangement for breeding visions.
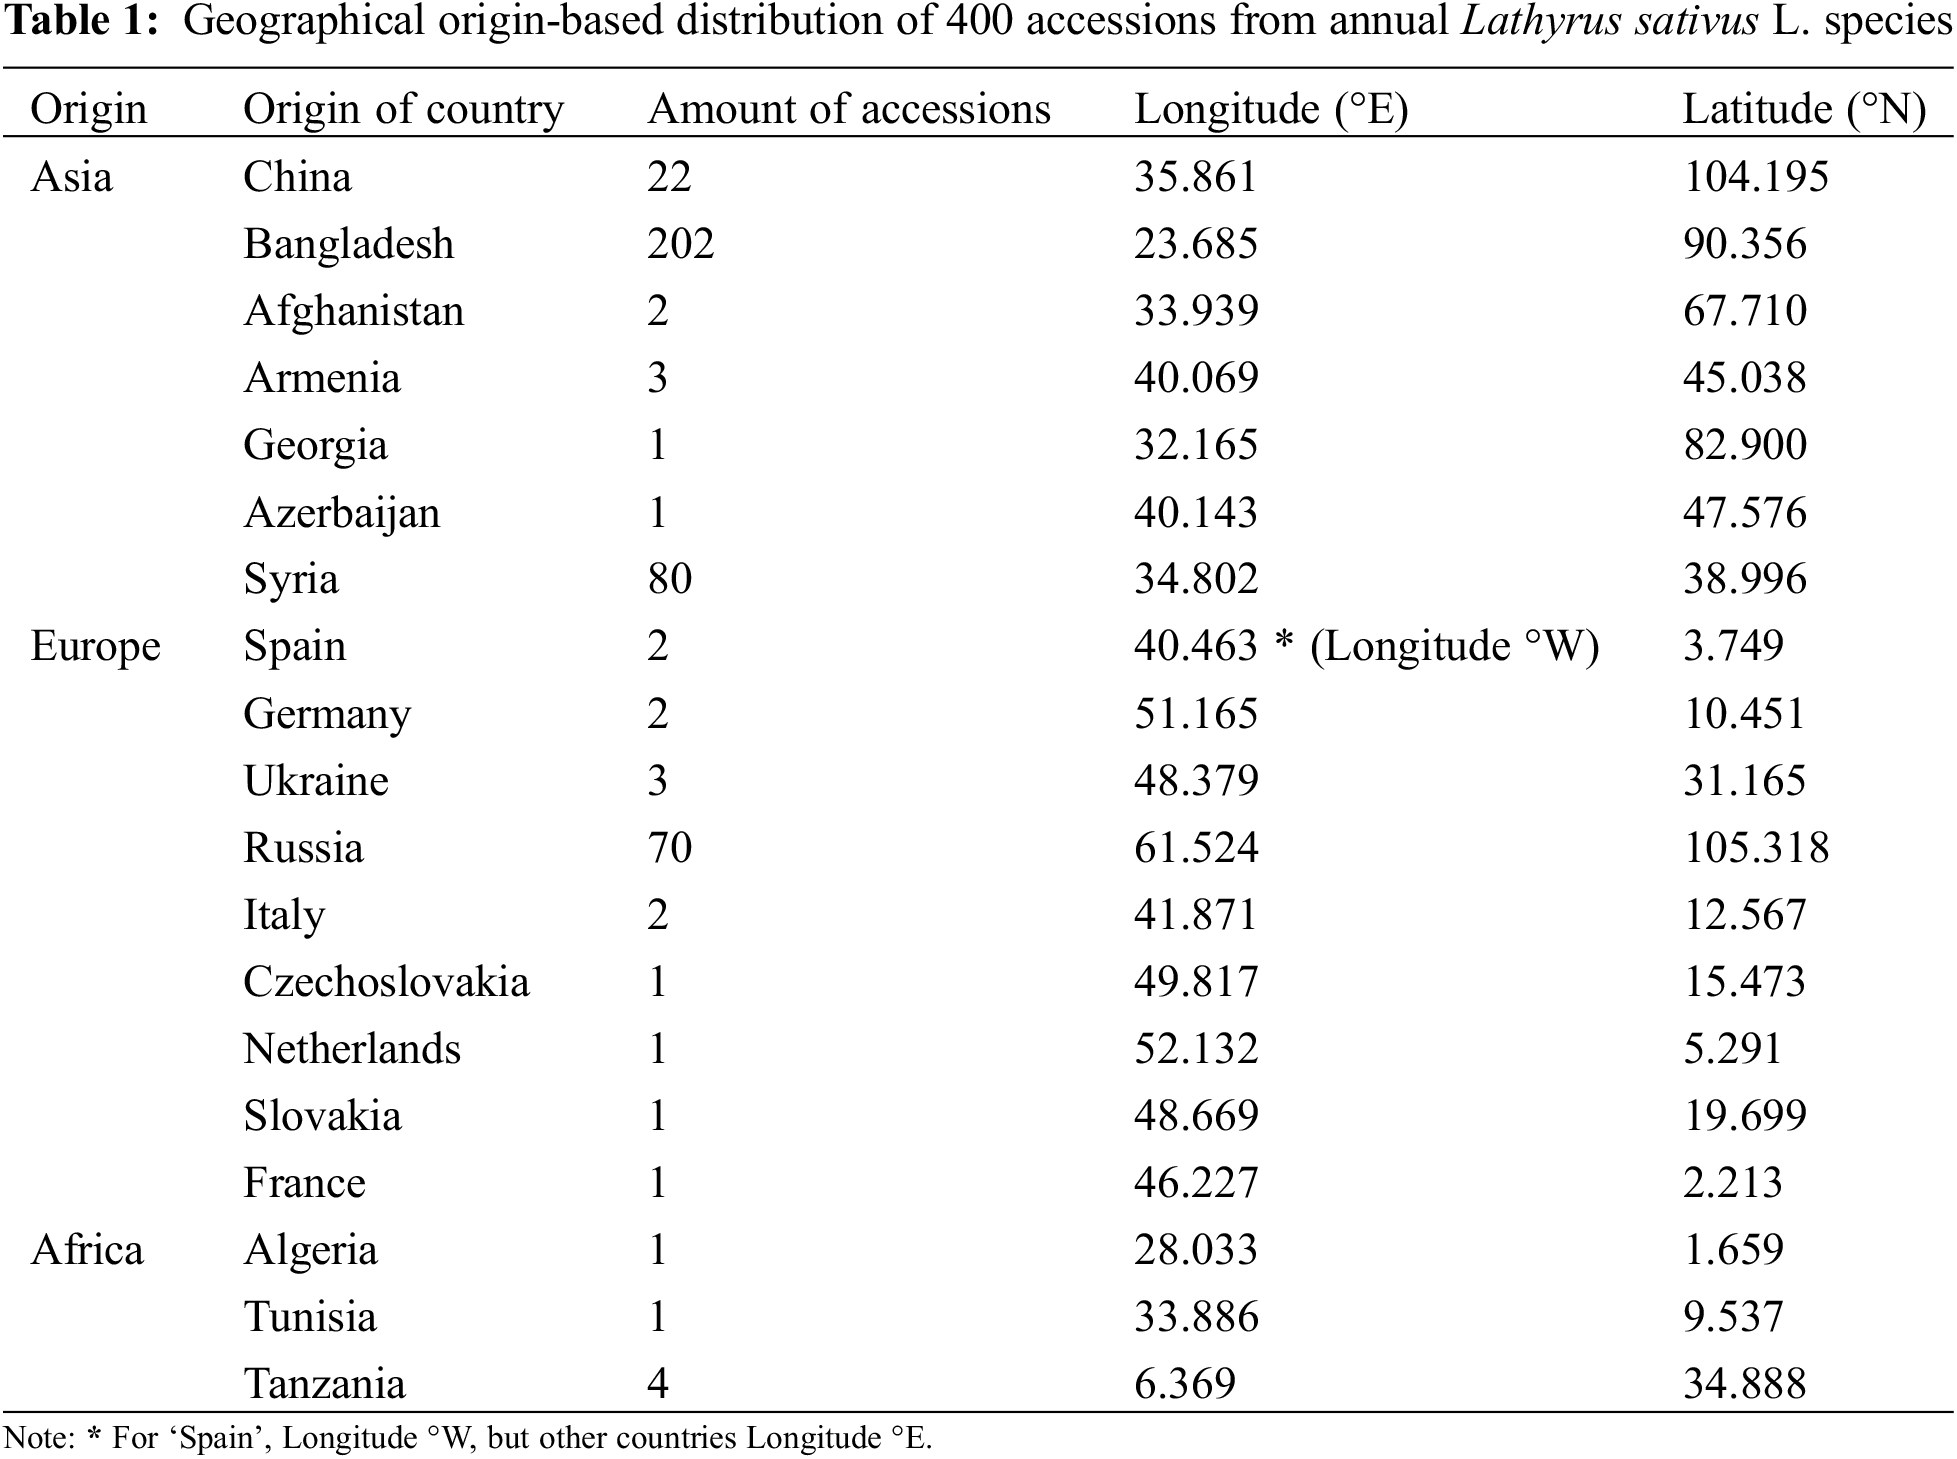
A total of 400 grass pea genotypes with 200 accessions from the Center for Crop Germplasm Resources, Chinese Academy of Agricultural Sciences (CAAS), China Which collected from China, Bangladesh, Afghanistan, Armenia, Georgia, Azerbaijan, Syria, Spain, Germany, Ukraine, Russia, Italy, Czechoslovakia, Netherland, Slovakia, France, Algeria, Tunisia, Tanzania and 200 accessions from Plant Genetic Resources Center, Bangladesh Agricultural Research Institute (BARI), Gazipur which collected from different regions of Bangladesh (Tables 1 and S1).
2.2 Procedures of Phenotypic Data, ODAP Detection, and Molecular Characterization
The 400 grass pea accessions (G1–G400) were planted in both locations. About 200 Bangladeshi accessions (G201–G400) were damaged by cold weather but the 200 Chinese accessions (G1–G200) were sustained in Liaoyang province in 2019. The study was designated for two years and two locations but we cannot include here 2nd-year data due to the pandemic situation of COVID-19. Only one year of the 200 Chinese accessions (9G1–G200) in both locations results were pooled. Each accession was planted in a single row with 15–20 plants. The plant-to-plant distance is 5–10 cm and row to row distance is 40 cm.
Five plants from each accession were randomly selected and surveyed for recording the observations for 11phenotypic traits for days to 1st flowering, days to 50% flowering (50% DF), flower color (FC) scoring 1 to 11 [29]; where, flower with white colour took 1 days, blue took 3, pink took 7, violet took 10 days to maturity (DM). Plant height (PH), Primary branches (PB), Pods per plant (PP), Seeds per pod (SP), Yield per plant (YP), 100 seed weight (100 SW).
In the case of seed coat color (SC) scoring 1 to 10 [29]; where, grey is scored in 3, grey mottled is scorded in 9, green mottled scorded in 10 for an average of five plants in both locations.
From both locations, we collected the leaves from the middle part of the stems while the plants were flowering and 2–3 gm of fresh leaf samples from 5 plants per accession dried out for 20 min at 110°C packed with aluminum foil and dry at room temperature before loading at −20˚C in falcon tubes for measuring six biochemical traits such as β-ODAP fresh (µgg−1), α-ODAP fresh (µgg−1), Total-ODAP fresh (µgg−1), β-ODAP dry (µgg−1), α-ODAP dry (µgg−1) and Total-ODAP dry (µgg−1) through the HPLC method. We used NaHCO3, FDNB (2, 4-dinitrofluorobenzene), BPS (phosphate buffer solution), and 100 mM NaAc-HAc (Sodium Acetate Buffer solution) for the preparation of ODAP standard. After preparation of ODAP standard stock solution of (not ginseng element) 5 mg/mL, prepared by NaHCO3 100 µL and 10 mg/mL FDNB solution, carry out the derivatization reaction in a constant temperature water bath at 60°C, take out (In a dry bath at 60°C for 30 min), cool in a room temperature. We used a 100 µL accurately pipette and gradually diluted with 0.5 mol/L NaHCO3 solution to 317.5, 158.75, 79.38, 39.69, 19.84, 9.92, 4.96 µg/mL. The series of standard solutions were added 800 µL of phosphate buffer solution filtered with a 0.45 µm organic phase and measured. Add 4.0 mL of NaHCO3 solution to 0.1g of dried grass pea leaf powder, incubate at 4°C for 5 min on a shaker, and centrifuge at 2000 r/min at 4°C for 10 min. Supernatant carefully handled 1 mL pipette of the into a 2 mL Eppendorf in a centrifuge tube. Centrifuge at 12,000 r/min for 10 min at room temperature. Take 0.1 mL of the supernatant in a 2 mL centrifuge tube to prepare the derivatization reaction. Add 100 µL FDNB to 100 µL sample, and bath in 60°C water bath for 30 min. Then add 0.8 mL of phosphate buffer. Dilute to 1 mL for later use. Then centrifuge at 12,000 rpm (Revolutions per minute) for 5 min, draw 700 µL of the supernatant, filter, and load the sample (Note: In the calculation, after calculating the corresponding β-ODAP concentration, multiply the reaction volume by 1 mL to calculate the total concentration). At the same time, derivatize the ODAP standard product to make the standard curve. Equilibrium of the chromatographic column respectively put acetonitrile, filtered deionized water, and 17% acetonitrile (use 0.1M, pH4.4 NaAc-) in the three storage bottles (A, B, C) of the chromatograph (HAc preparation). The column/needle was washed with 90% acetonitrile for 10 min, and then gradually adjusted the ratio of acetonitrile to water (online mixing of the instrument), so that the ratio of acetonitrile reached 20% (at least 20 min to complete), and finally equilibrated with 17% acetonitrile for 30 min until the detection signal baseline was level. Straight, the column pressure is constant.
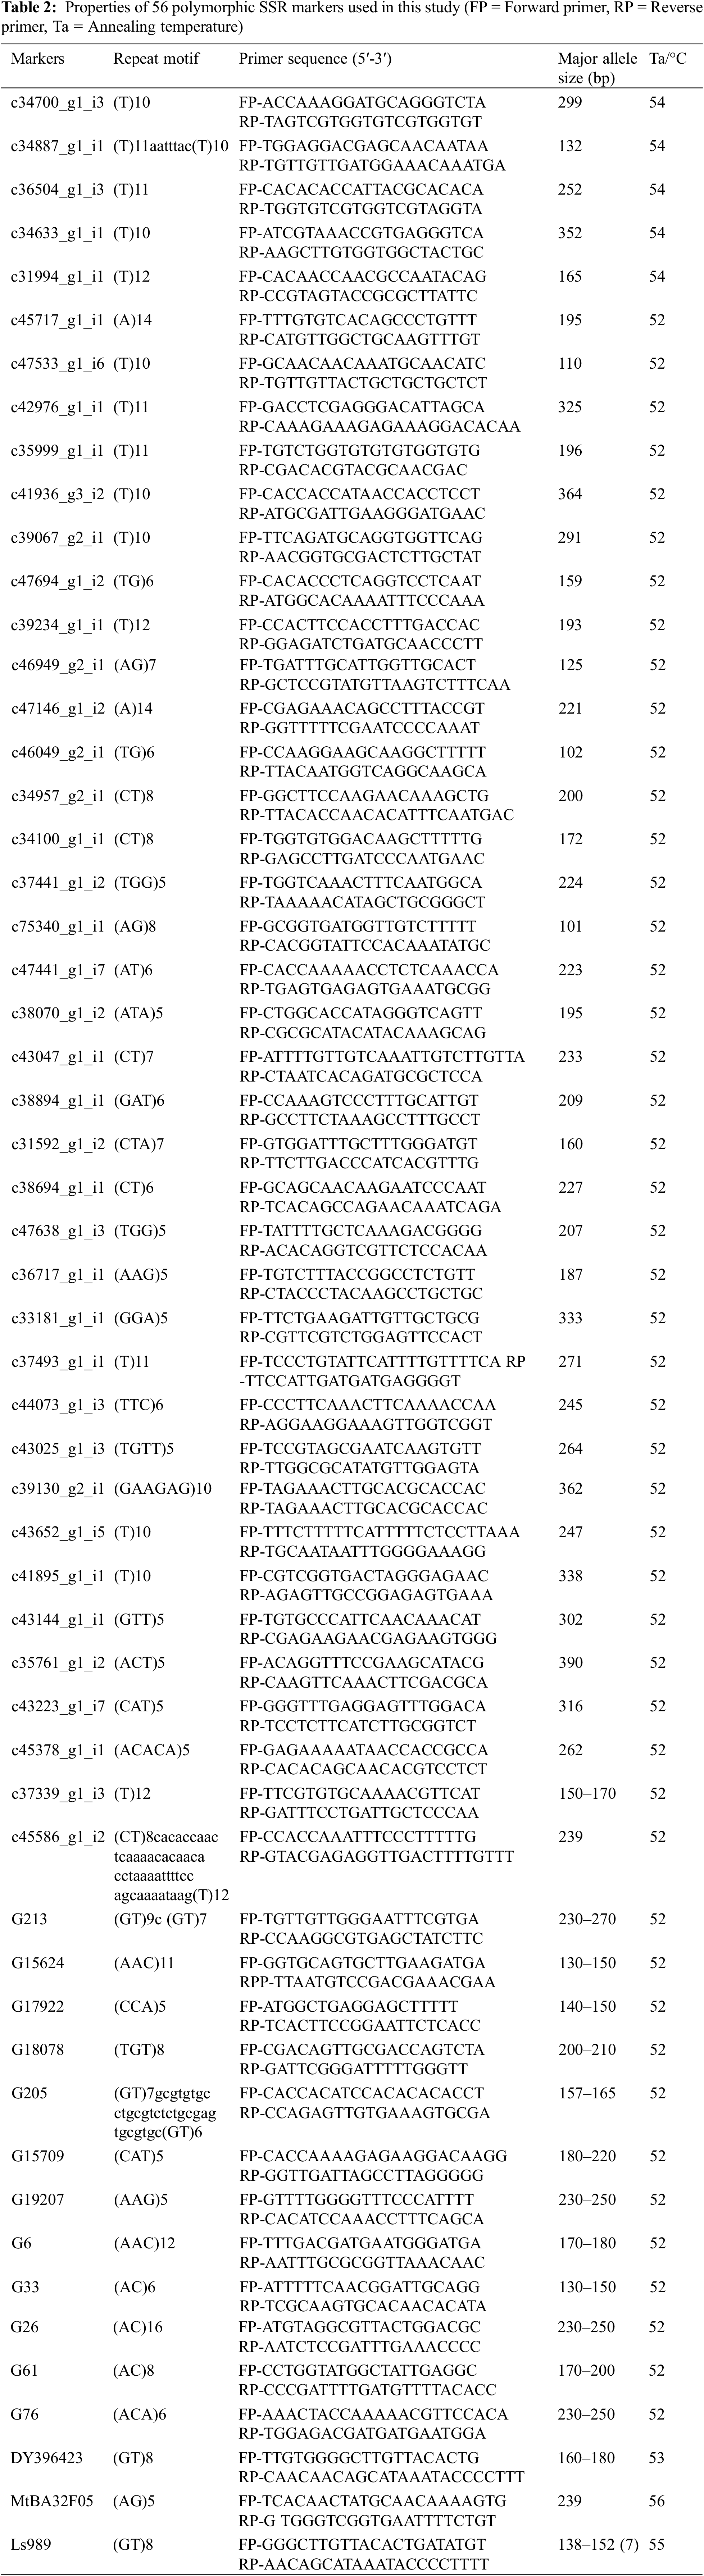
We used well-distributed SSRs; the legume genome database will find primers sequence (5′-3′), PCR product size (bp), and repeat motif of the SSRs markers (Table 2). Plants were grown in a net house and leaf samples were collected from 5 random young seedlings (20–30 days) and mixed. Then genomic DNA was extracted from the mixed leaf of 5 random young seedlings of each accession exploiting the Cetyl Trimethylammonium Bromide (CTAB) method [30,31]. Polymerase Chain Reactions (PCR) were conducted at a volume of 20 µL reaction comprising 10 µL 2x TagPCR Master Mix (Hooseen, Beijing, China), 2 µL primer, 3 µL of genomic DNA (30 ng) and dd H2O 5.0 µL. On the K960 Thermal Cycler (Jingle, Hangzhou, China), microsatellite loci were enlarged with the following cycle: 5 min of initial denaturation at 95°C; 35 cycles of (denaturation for 30 s at 95°C, 30 s at annealing temperature, 45 s prolongation at 72°C) and final elongation at 72°C for 10 min. Gel electrophoresis was conducted using 8% non-denaturing polyacrylamide gel with 280 Volts and 50 watts and visualized through 0.1% silver nitrate staining (Fig. S1). Gel documentation was done using a BIO-RAD Gel Doc XR + machine. SSR results were scored according to the band size using AlphaEaseFC4.0 (Alpha Inotech, San Leandro, CA, USA).
To determine the genetic distance using the Power marker software 3.25 [32]. To estimate population genetic structure using the STRUCTURE V2.3.4 [33] based on an admixture model, where the K value was set to 1 to 10. The run was repeated 4 times for each K, K = 2 by way of best value based on LnP(D) with the method distinct by Evanno et al. [34]. The method regulates the suitable K value and estimates the Q parameter. The kinship coefficient (kinship) is generated by TASSEL V4.3 software. Path analysis was conducted using R studio 1.4.1717. Marker-trait associations were designed through general linear model (GLM) [35] and mixed linear model (MLM) association assessment including Q (structure likeness) + K (kinship) conditions into the TASSEL V4.3 software package. The p values of the marker linked with the QTL were controlled by multiple analysis rectification through regulation of the false detection rate. The number of permutation runs in GLM was set to 10000. Significant MTAs were declared up to α = 5% [36]. The data density and normality, data variability parameters as well as correlation analysis of 11 phenotypic traits and 6 biochemical traits use the STAR V2.01 software (Fig. S2).
3.1 Genotypic Data-Based Population Genetic Structure Analysis of Grass Pea
198 SSR markers were randomly screened to validate polymorphism first 28% of them were polymorphic which means 56 polymorphic markers were used to calculate the Polymorphism Information Content (PIC) of the markers and genetic diversity of the 400 grass pea germplasm but the location of markers in the chromosome is unknown (Table S2). Evanno’s ΔK and LnP (D) explain two genetically different populaces (i.e., K = 2) based on delta K standards. The population structure showed that the total population was separated into two main groups and one admixed collection (Fig. 1). The Red color Pop1 group exposed 48.25% (193 accessions) which come from Bangladesh. The Green color Pop2 group displayed 47.75% (191 accessions) coming from diverse environmental areas (China, Bangladesh, Afghanistan, Armenia, Georgia, Azerbaijan, Syria, Spain, Germany, Ukraine, Russia, Italy, Czechoslovakia, Netherland, Slovakia, France, Algeria, Tunisia, Tanzania) which delivered from Chinese Academy of Agricultural Sciences (CAAS), China and also revealed their genetic correlation is very adjacent with Chinese accessions. Moreover, Pop1 and Pop2 are distinct from each other, Admixture containing 4.00% (16 accessions) between Pop1 and Pop2, among them, nine genotypes from Pop1 and seven accessions from Pop2. PCA and PCoA also supported the population structure analysis (Figs. 1 and S3).
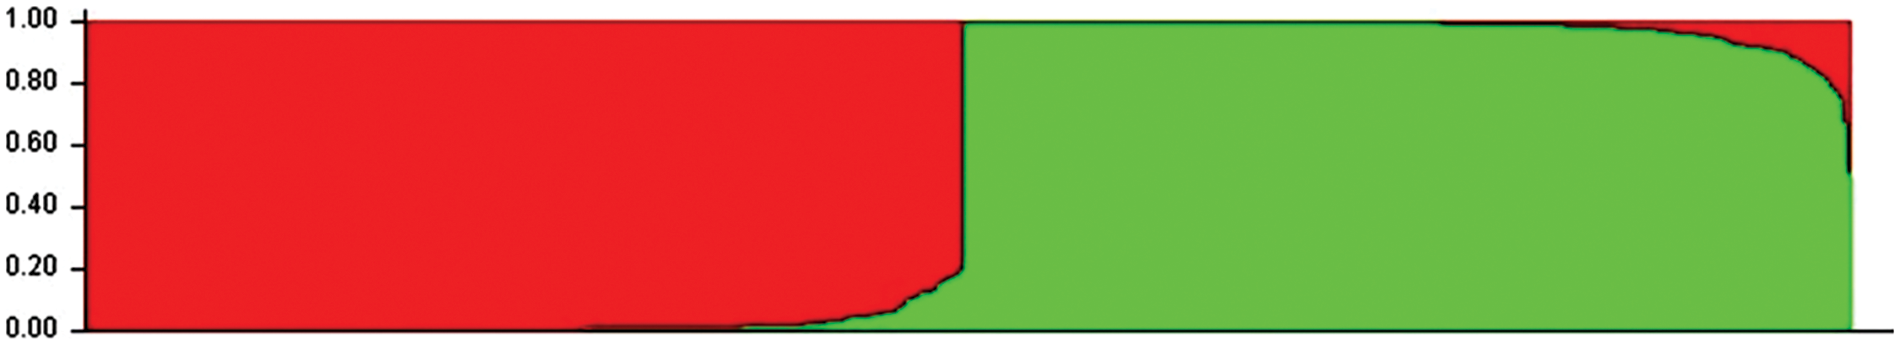
Figure 1: Population structure of 400 grass pea germplasm collected across the world (K = 2) where Pop1 (Red) belongs to 48.25%, Pop2 (Green) belongs to 47.75% and Admixed group belongs to 4.00%
3.2 Phenotypic Variation of Yield-Related Agronomic and Biochemical Traits
We observed large variations in studied traits among the grass pea accessions in our study. A total of 400 accessions were divided into two parts; Chinese accessions G1–G200 and Bangladeshi accessions G201–400 which showed highly significant (p < 0.0001) variances occurred with 11 yields related agronomic traits and 6 biochemical traits separately grown at Hebei and Liaoyang province in 2019. The phenotypic data (Table 3) of 17 traits (11 phenotypic and 6 biochemical traits) in two environments were studied for each accession and were employed for association study.
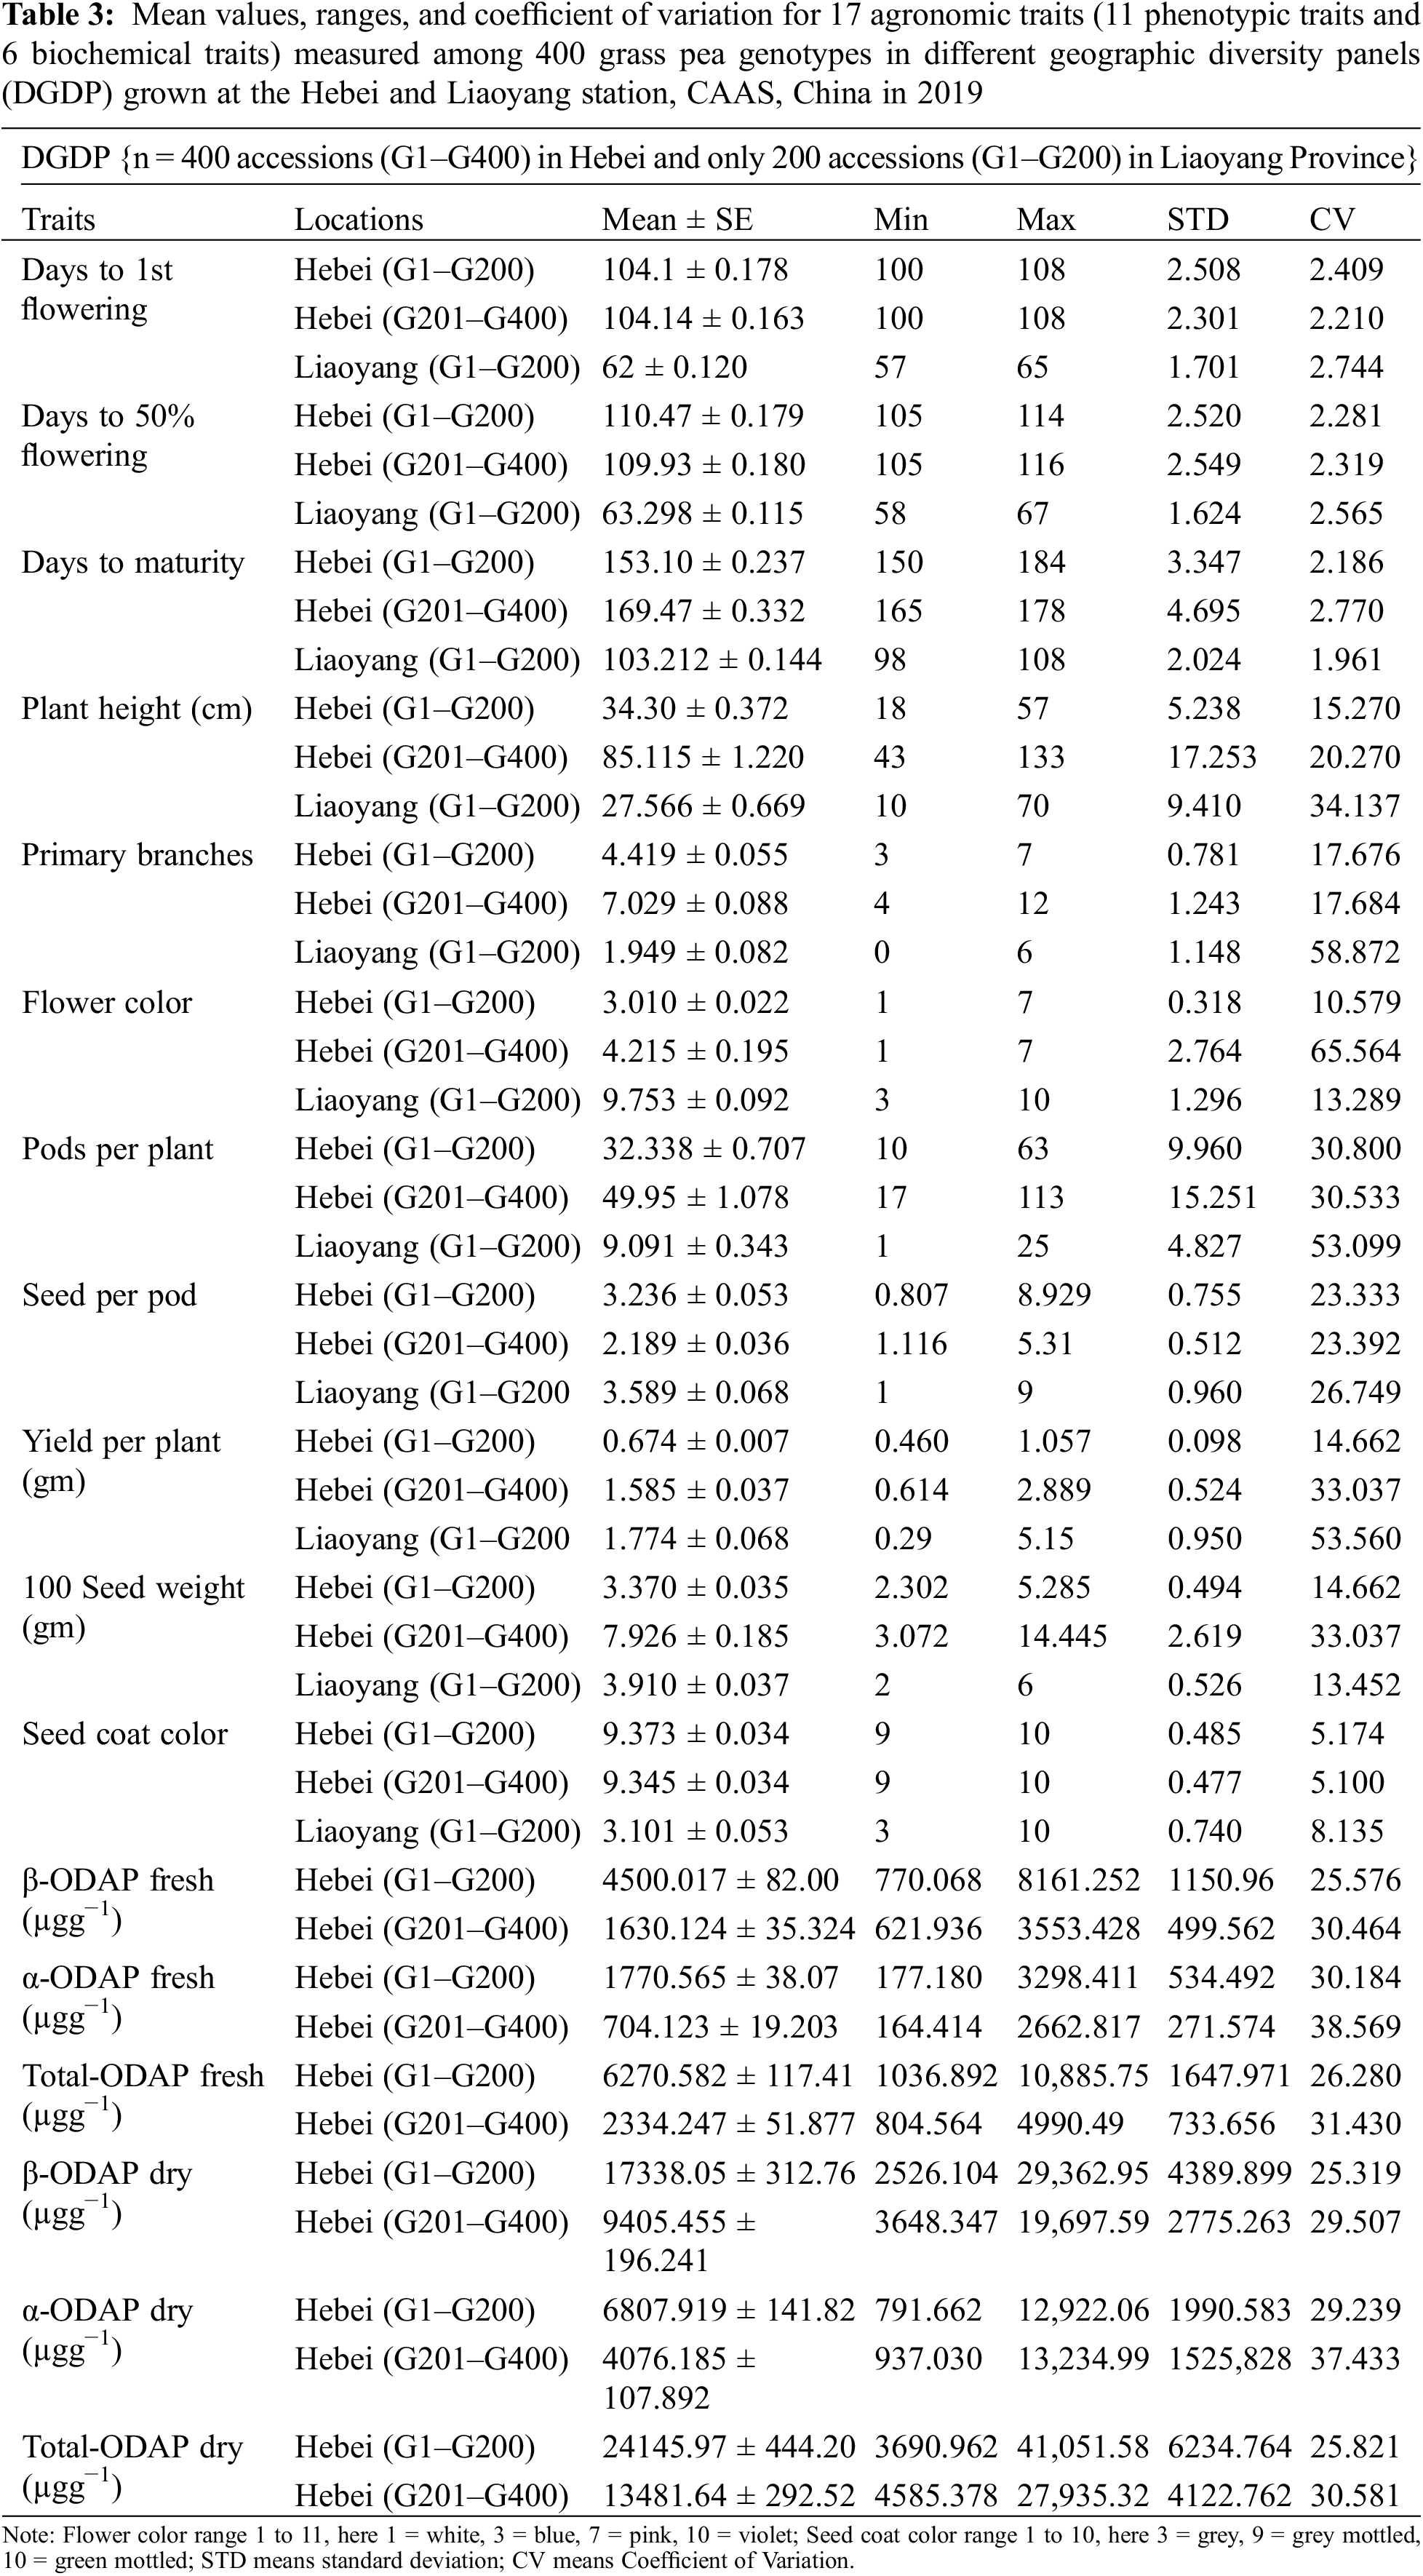
This study observed that the grass pea cultivars from different environmental areas have a vast variation in each experiment site. Among the 10 agronomic traits the higher coefficient of variation in 1st DF (2.744%), 50% DF (2.565%), PH (34.137%), PB (58.872%), PP (53.099%), SP (26.749%) and YP (53.560%) was discovered in Liaoyang location than Hebei location among the Chinese accessions (G1–G200). DM (2.770%), FC (65.564%), and 100 SW (33.037%) are the higher coefficient of variation in Bangladeshi accessions (G201–G400) than Chinese accessions in the Hebei location. The phenotypic coefficient of variance was highest in FC (65.564%) and lowest in 50% DF (2.565%) among the agronomic traits. In a qualitative trait, SC (8.135%) was the higher coefficient of variation observed in Liaoyang than Hebei location (both accessions). Among the biochemical traits the higher coefficient of variation was observed in β ODAP fresh (30.464%), β ODAP dry (29.507%), α ODAP fresh (38.569%), α ODAP dry (37.433%), T ODAP fresh (31.430%) and T ODAP dry 30.581%) of Bangladeshi accessions than Chinese accessions at Hebei location. The highest coefficient of variation was observed in α ODAP fresh (38.569%), and the lowest in β ODAP dry (29.507%). It is important to further study seventeen traits among multiple environments over several years.
3.3 Correlation and Path Coefficient
Correlation analysis specified that there are significant relations among the considered traits (Table 4). In the Hebei location for genotypes G1–G200, strong positive correlations were found between YPP and 100 SW; among the six biochemical traits (correlation range 0.71 to 0.98) and between 50% DF and 1st DF. SC showed a strong negative correlation with YPP, 100 SW, and SC and FC showed a strong negative correlation with YPP, 100 SW, and SC. SC showed a moderate positive correlation with 100 SW and YPP, between DM and PH, and finally 50% DF and 1st DF showed a moderate positive correlation with DM, PH, YPP, and 100 SW, respectively. A moderate negative correlation was found between 50% DF, 1st DF, and SP and FC at p ≤ 0.05 (Fig. 2a).
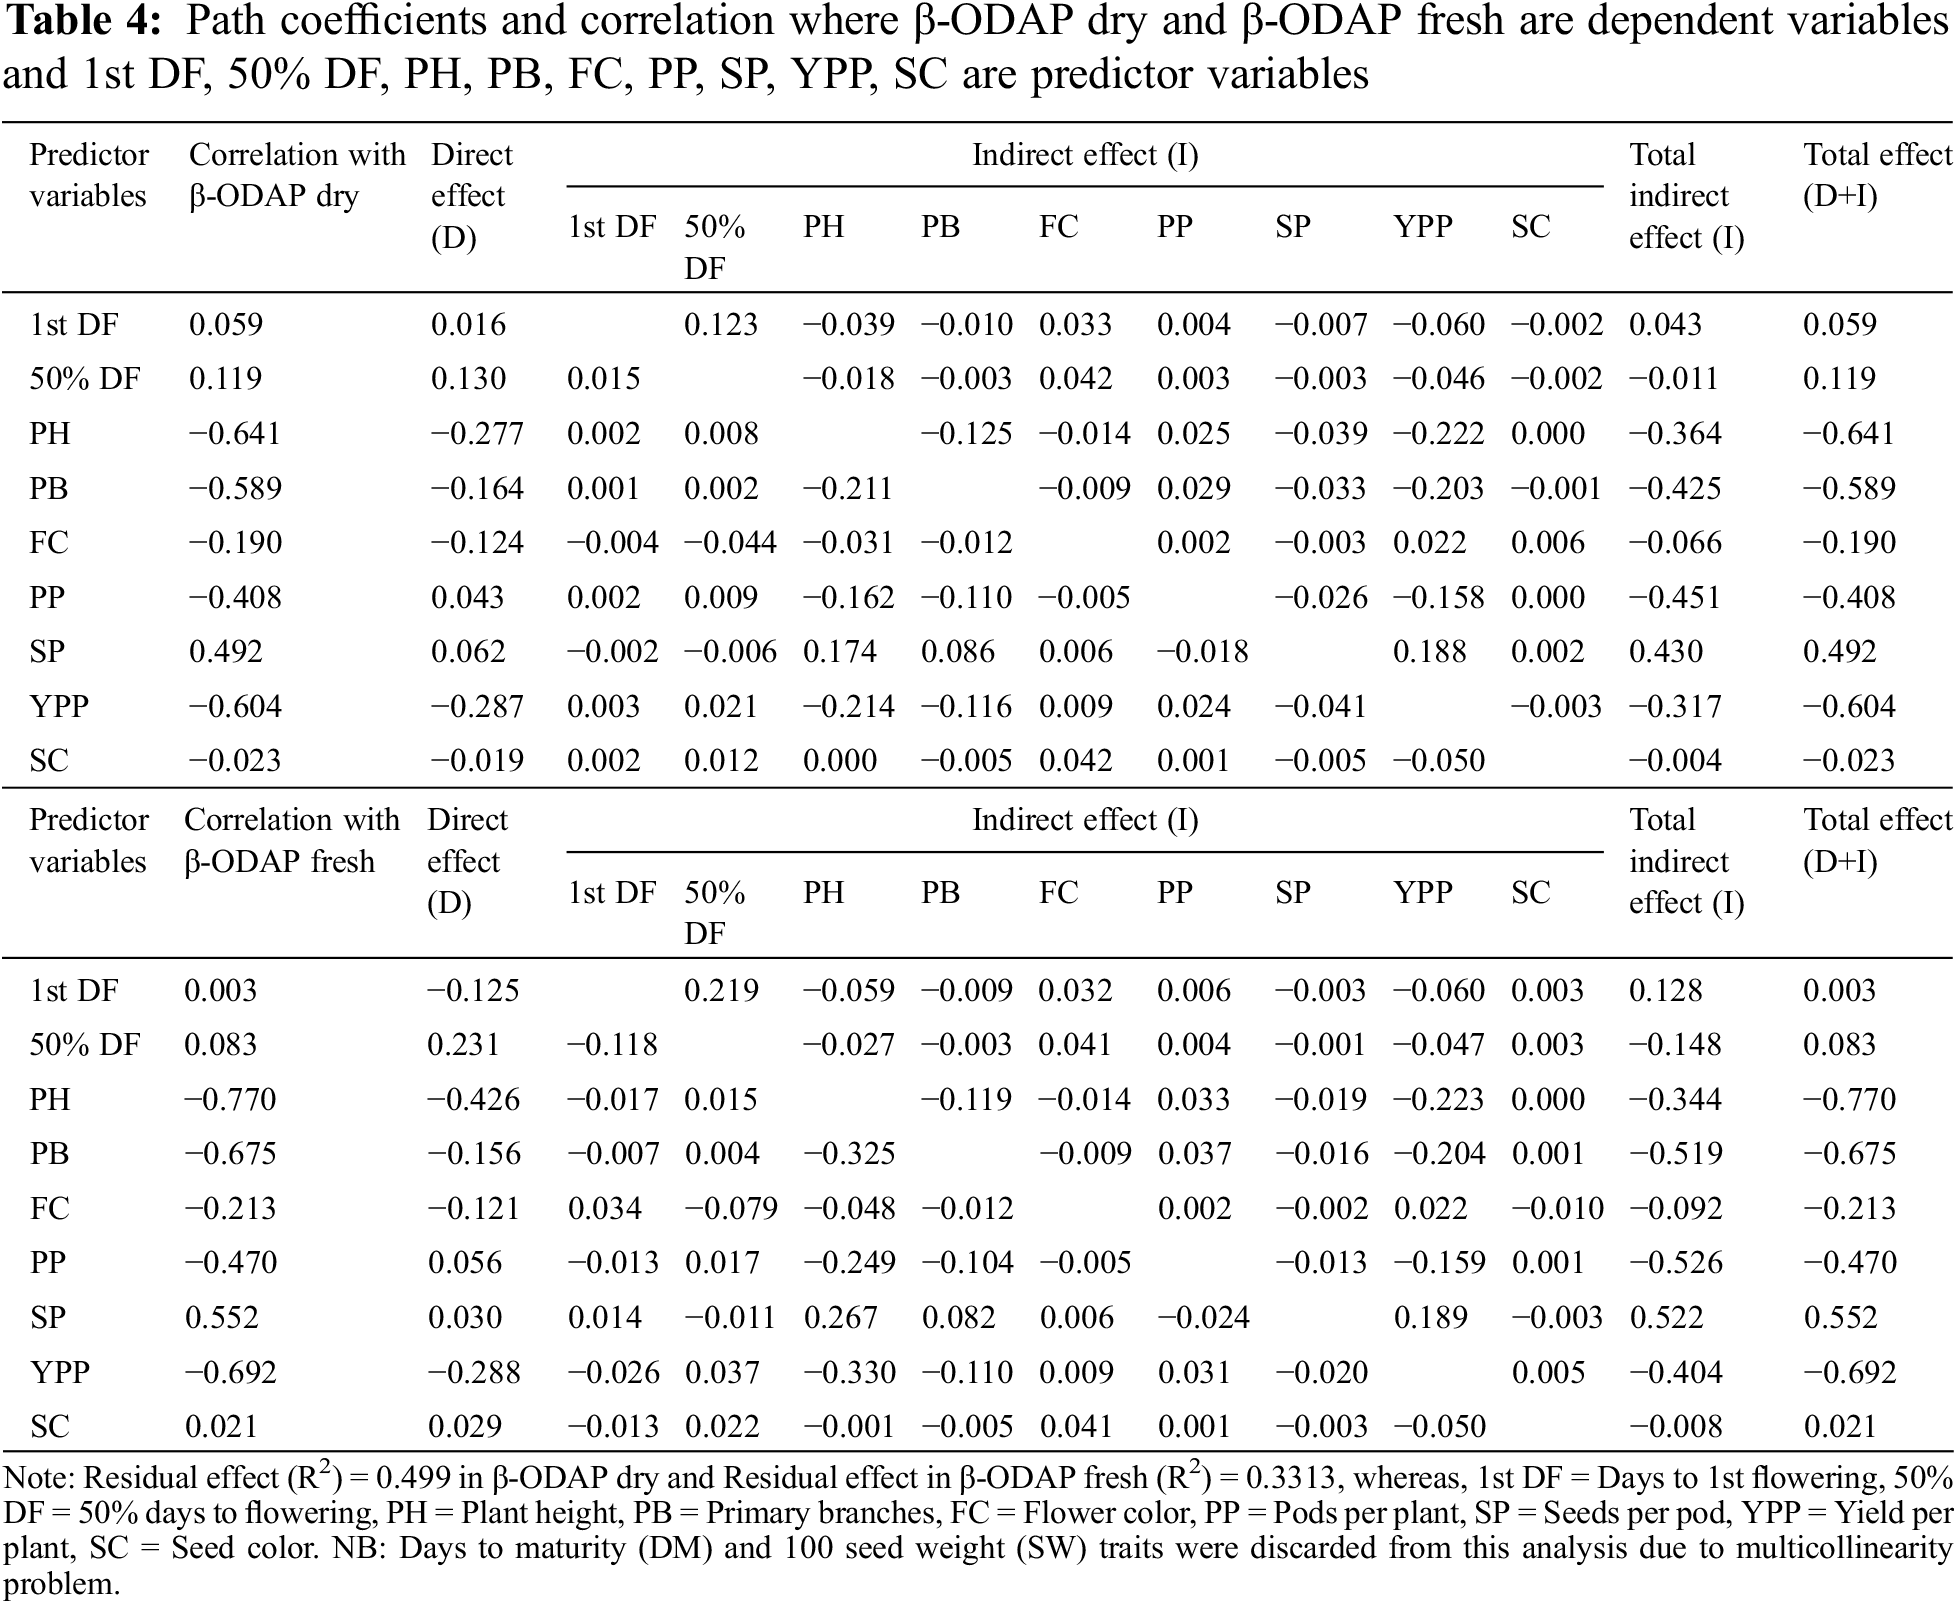
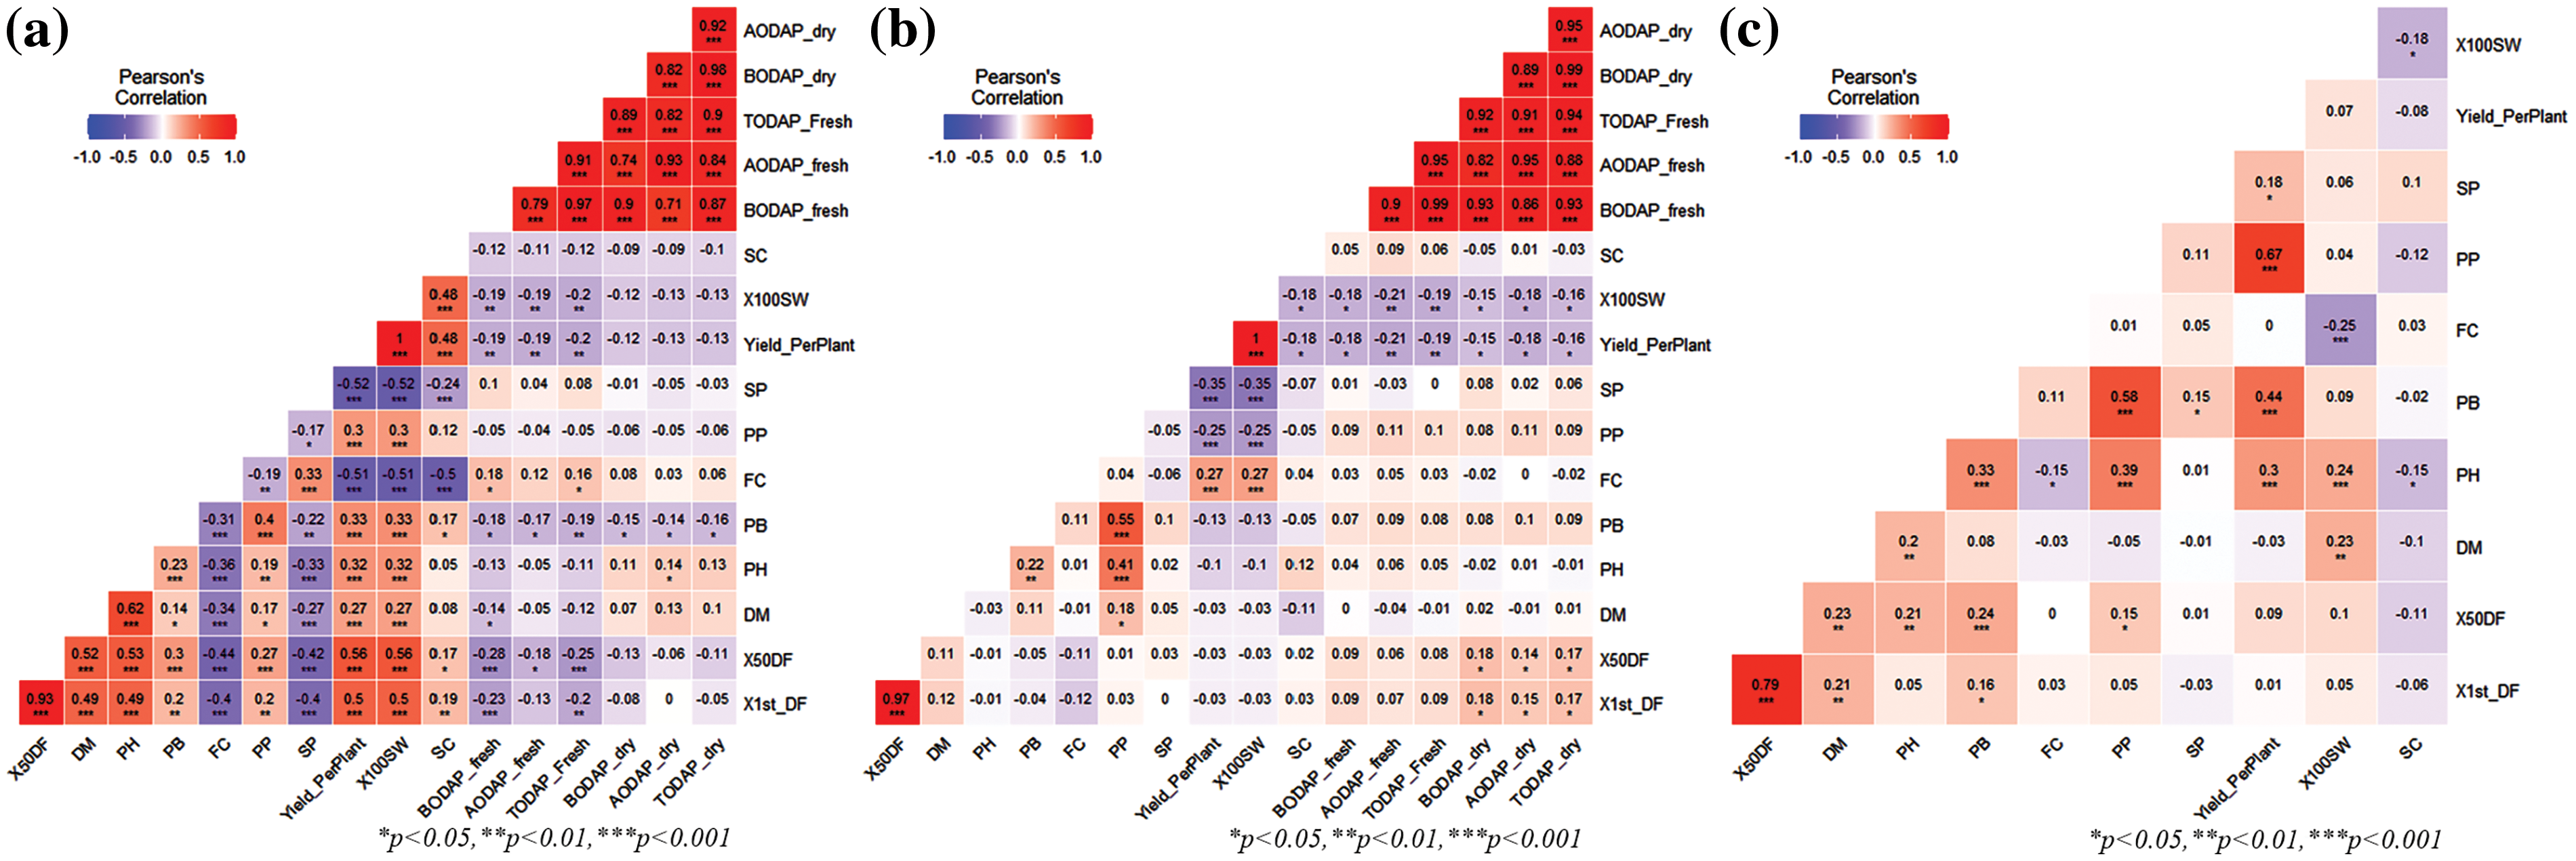
Figure 2: The correlation of 17 traits (10 agronomic traits, 1 qualitative trait, and 6 biochemical traits) in two environments among (a) Hebei (G201–G400), (b) Hebei (G1–G200), (c) Liaoyang (G1–G200)
In the Hebei location for genotypes G200–G401, strong positive correlations were found between YPP and 100 SW; between 50% DF and 1st DF, and among the six biochemical traits (correlation range 0.82 to 0.99). There is no strong negative correlation. A moderate positive correlation was found between PB and PP; and between PH and PP at a 5% significance level (Fig. 2b). In the Liaoyang location for genotypes G1–G200, there was no strong positive correlation. A moderate positive correlation was found between 50% DF and 1st DF; and between PB and PP. Most of the agronomic traits showed a low positive correlation to each other but only SC showed a negative correlation with 1st DF, 50% DF, DM, PH, PB, PP, YPP, and 100 SW at p ≤ 0.05 (Fig. 2c).
In the case of β-ODAP dry, Table 4 shows that days to 1st flowering (1st DF), 50% days to flowering (50% DF), PP and SP exerted a positive direct effect on β-ODAP dry (0.016, 0.130, 0.043 and 0.062, respectively), whereas PH, PB, FC, YPP and SC had a negative direct effect on β-ODAP dry (−0.277, −0.164, −0.124, −0.287 and −0.019, respectively) but the total effect of 1st DF, 50% DF and SP were positive. The highest positive indirect effects on β-ODAP dry were observed with SP (0.188, 0.174) through YPP and PH, respectively. The highest negative indirect effects on β-ODAP dry were observed with PH (−0.222) through YPP and YPP (−0.214) through PH. The residual effect explains how best the independent variables account for the variability of the dependent variable (β-ODAP dry) and its value is 0.499.
In the case of β-ODAP fresh, Table 4 shows that 50% DF, PP, SP, and SC exerted a positive direct effect on β-ODAP fresh (0.231, 0.056, 0.030 and 0.029, respectively), whereas 1st DF, PG, PB, FC, YPP, and SC had a negative direct effect on β-ODAP fresh (−0.125, −0.426, −0.156, −0.121 and −0.288, respectively) but the total effect was positive on 1st DF (0.003), 50% DF (0.083), SP (0.552) and SC (0.021) and negative on PH (−0.777), PB (−0.675), FC (−0.213), PP (−0.470) and YPP (−0.692). The highest positive indirect effects on β-ODAP fresh were observed with SP (0.267, 0.189) through PH and YPP, respectively. The highest negative indirect effects on β-ODAP fresh were observed with PH (−0.223) through YPP and 50% DF (−0.118) through 1st DF. For the dependent variable, the β-ODAP fresh residual value is 0.3313.
3.4 Linkage Disequilibrium Analysis
The distribution diagrams of the genome-wide linkage disequilibrium (LD) attenuation were drawn in TASSEL 4.3 based on R2 and D′ from the results of the LD and the genetic distance. The basis and premise of association analysis is the between gene linkage disequilibrium of the diversity of object traits and gene (locus) polymorphism to find marker loci with the purposes of specific genes strictly associated with phenotypic differences. In total, 1526 arrangements of 56 pairs of SSR primers were found, of which the arrangements with R2 ≥ 0.1 were considered for 93.18%. The probability of p ≤ 0.01 was sustained and there remained were unbalanced combinations in the pair (Fig. 3), where the R2 value ranged from 0.020–0.696 and D′ ranged from 0.143–0.862. The 56 pairs of SSR primers nominated in this study have linkage imbalance in 400 grass pea germplasm from the consequence of analysis, which can be associated with considerable traits.
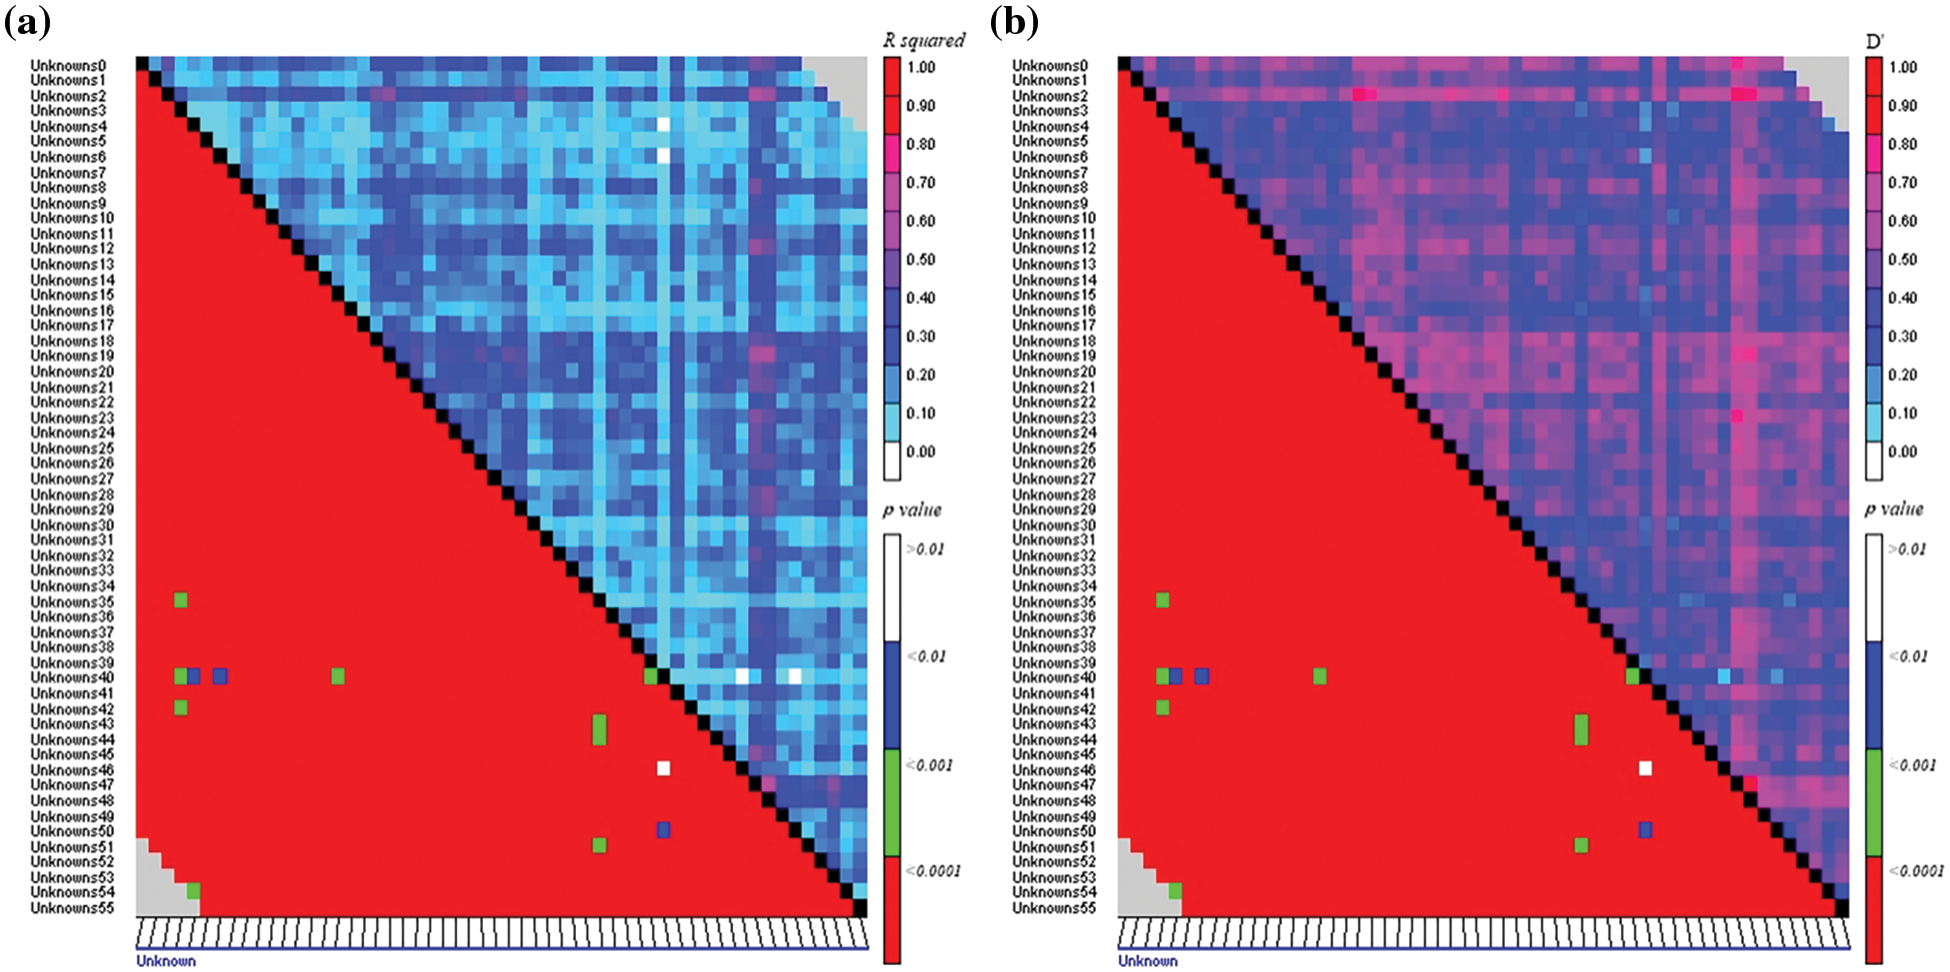
Figure 3: Linkage disequilibrium (LD) between SSR markers showing with (a) R2 and p value (b) D′ and p value
3.5 Association Studies of SSR Marker with Yield-Related Agronomic and Biochemical Traits
The interrelated Q value and Q+K value of grass pea resources were used as covariates in the GLM_Q and MLM_Q+K models correspondingly, and the association studies of the 56 SSR molecular markers with yield-related agronomic traits, qualitative traits, and biochemical traits are executed to detect the associated markers and set on their interpretation rate. Of the marker-trait associations identified for individual trials, 99 MTAs (Marker trait associations) as listed in the GLM model and 61 MTAs as listed in the MLM model (Table 5) were selected based on their p value and occurrence in multiple trials. The sequences of 56 polymorphic SSR markers listed and diversity statistics were provided in Tables 2 and S2.
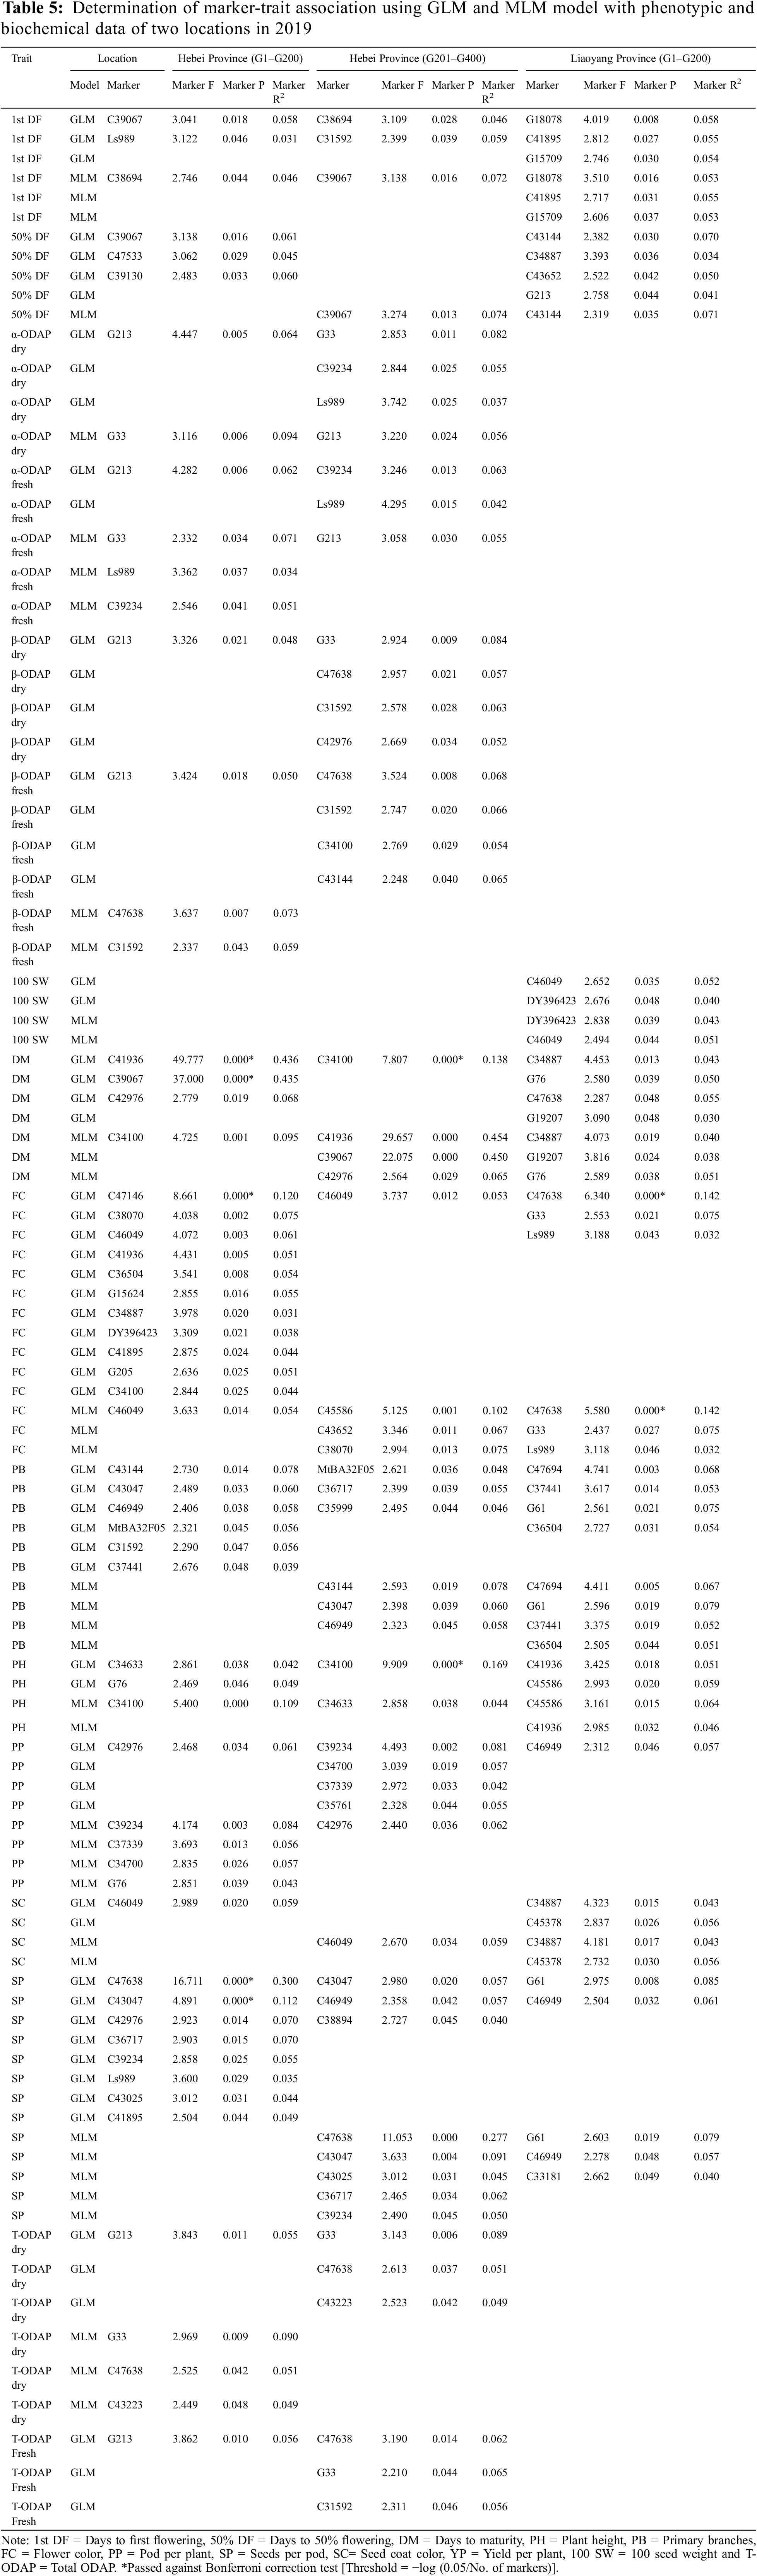
Based on the genotype data, phenotypic data, and the Q-matrix from population structure results, a general linear model and mixed linear model were used to analyze the marker-trait associations. Four hundred genotypes (G1–G200) and (G201–G400) were used to reveal the marker-trait association. Among the 56 SSR markers, 5, 5, and 23 markers were significantly associated at <0.1%, <1%, and <0.05% levels, respectively for 11 traits in the GLM model. Maximum 43.6% PVE was found for C41936. In the MLM model, 13 and 5 markers were significantly associated at <1% and <0.05% levels, respectively for 7 traits. A maximum of 45.37% PVE was found for the same marker C41936 (Table 5).
3.6 Yield-Related Agronomic Traits
We observed that the results of GLM_Q and MLM_Q+K study all yield-related agronomic traits are significantly associated in Hebei and Liaoyang locations among the genotypes G1–G200 and G201–G400 at p ≤ 0.05 (Table 3). For days to 1st flowering, the five markers in the MLM analysis outcomes are the same as those identified in the GLM outcomes, and these five markers C39067, C38694, G18078, C41895, and G15709 were identified in both models having PVE values ranging from 4.6% to 7.2%. For days to 50% flowering the two markers in the MLM analysis outcomes are the same as those identified in the GLM outcomes, and these two markers C39067 and C43144 were identified in both models having PVE values ranging from 6.1% to 7.4%. For days to maturity, the seven markers in the MLM analysis outcomes are the same as those identified in the GLM outcomes, and these seven markers C34100, C41936, C39067, C42976, C34887, G19207, and G76 were identified in both models having PVE value ranged 3.8% to 9.5%. For plant height, the four markers in the MLM analysis outcomes are the same as those identified in the GLM outcomes, and these four markers C34100, C34633, C45586, and C41936 were identified in both models having PVE values ranging from 4.4% to 10.9%.
For primary branches, the seven markers in the MLM analysis outcomes are the same as those identified in the GLM outcomes, and these seven markers C43144, C43047, C46949, C47694, G61, C37441, and C36504 were identified in both models having PVE value ranged 5.1% to 7.9%. For flower color, the seven markers in the MLM analysis outcomes are the same as those identified in the GLM outcomes, and these seven markers C46049, C45586, C43652, C47638, G33, C38070, and Ls989 were identified in both models having PVE value ranged 0.1% to 14.2%. For pods plant−1 the four markers in the MLM analysis outcomes are the same as those identified in the GLM outcomes, and these four markers C39234, C37339, C34700, and C42976 were identified in both models having PVE values ranging from 4.2% to 8.4%. For seeds per pod, the six markers in the MLM analysis outcomes are the same as those identified in the GLM outcomes, and these six markers C47638, C43047, C43025, C36717, C39234, and C46949 were identified in both models having PVE values ranged 4.4% to 27.7%. For seed color, the three markers in the MLM analysis outcomes are the same as those identified in the GLM outcomes, and these three markers C46049, C34887, and C45378 were identified in both models having PVE values ranging from 4.3% to 5.9%. For yield per plant, no marker-trait association was found in this analysis against yield per plant. For 100 seed weight, the two markers in the MLM analysis outcomes are the same as those identified in the GLM outcomes, and these two markers DY396423 and C46049 were identified in both models having PVE values ranging from 4.0% to 5.2% (Table 5).
Six biochemical traits showed MTAs in Hebei province for genotypes G1–G200 and genotypes G201–G400 but in Liaoyang province, data are not available here. We observed that the results of GLM_Q and MLM_Q+K studies all biochemical traits are significantly associated in Hebei location among the genotypes G1–G200 and G201–G400 at p ≤ 0.05. For α-ODAP dry the two markers in the MLM analysis outcomes are the same as those identified in the GLM outcomes, and these two markers G33 and G213 were identified in both models having PVE values ranging from 5.6% to 9.4%. For β-ODAP dry total of five marker traits were associated, β-ODAP dry was significantly associated with the G213 marker having PVE 4.8% among the genotypes G1–G200 and with three markers G33, C47638 and C43223 having PVE ranged from 4.9% to 8.9% among the genotypes G201–G400. There is no marker shown in the MLM and GLM outcomes. For total-ODAP dry the three markers in the MLM analysis outcomes are the same as those identified in the GLM outcomes, and these three markers G33, C47638, and C43223 were identified in both models having PVE values ranging from 5.1% to 9.0%. For α-ODAP fresh the three markers in the MLM analysis outcomes are the same as those identified in the GLM outcomes, and these three markers Ls989, C39234, and G213 were identified in both models having PVE values ranging from 3.4% to 5.5%. For β-ODAP fresh the two markers in the MLM analysis outcomes are the same as those identified in the GLM outcomes, and these two markers C47638 and C31592 were identified in both models having PVE values ranging from 5.9% to 7.3%. For total-ODAP fresh was significantly associated with the G213 marker having PVE 5.6% among the genotypes G1–G200 and with three markers G33, C47638 and C31592 having PVE ranged from 5.6% to 6.5% among the genotypes G201–G400. There is no marker shown in the MLM analysis outcomes are the same as those identified in the GLM outcomes.
Among the 56 polymorphic SSR markers, 21 markers were associated with more than one trait. G213 is associated with seven traits viz., 50% DF, α-ODAP dry, α-ODAP fresh, β-ODAP dry, β-ODAP fresh, T-ODAP dry, T-ODAP fresh and C47638 also associated with seven traits namely β-ODAP dry, β-ODAP fresh, DM, FC, SP, T-ODAP dry, T-ODAP fresh. Three markers associated with 5 traits such as Ls989 associated with 1st DF, α-ODAP dry, α-ODAP fresh, FC, SP whereas, C31592 was related with 1st DF, β-ODAP dry, β-ODAP fresh, PB, T-ODAP fresh and G33 showed association with α-ODAP dry, β-ODAP dry, FC, T-ODAP dry, T-ODAP Fresh. Four markers are associated with four traits such as C34887 (50% DF, DM, FC, SC), C39234 (α-ODAP dry, α-ODAP fresh, PP, SP), C42976 (β-ODAP dry, DM, PP, SP) and C34100 (β-ODAP fresh, DM, FC, PH). Twelve markers are linked with two to three traits.
4.1 Population Structure Analysis
Assessment of population genomic structure is a precondition for genome-wide association studies because population structure is generally responsible for false associations [21]. A practically exact population structure may clue to greater genetic variances between groups, supplementary genetic relationships in every group as well as mostly decrease the deficiency in association analysis [37]. Therefore, the precision of the association study rests on whether the population structure was suitable [38]. Earlier, a reporter evaluated genotype clusters in cotton using Q-matrix [20]. Some reporters such as cotton [39,40], rice [41], and grass pea [42] evaluated the population structure by STRUCTURE software to indicate K values and population structure with K conforming to the highest structural level. The whole population was divided into two major populations and one admixed population, which was equitable to remove the false association things in the analysis of association studies. The diversity and kinship between two groups are related to geographical locations. The grass pea (Lathyrus sativus) found in Bangladesh formed a completely separate group indicating that human activities did not influence the diversity in Bangladesh but other locations’ diversity was influenced by human activities. That means Bangladesh might be the center of origin of Lathyrus sativus which is supported by the previous finding of Smartt [43].
4.2 Phenotypic Variation of 17 Traits
As a dry areas crop grass pea accessions revealed the mean of the eleven yield-related phenotypic traits against the Chinese genotypes (G1–G200) and Bangladeshi genotypes (G201–G400) in Hebei location was higher than Chinese genotypes (G1–G200) in Liaoyang location but the Coefficient variation (CV%) of most of the yield-related phenotypic traits against the Chinese genotypes (G1–G200) in Liaoyang province was higher than Hebei province among the same genotypes (G1–G200) but three traits such days to maturity, flower color and 100 seed weight were showed the higher coefficient of variation in Bangladeshi accessions (G201–G400) than Chinese accessions in Hebei location. Interestingly the qualitative trait seed color showed a higher coefficient of variation of Chinese genotypes (G1–G200) in Liaoyang than the Hebei location against genotypes (G1–G200) and genotypes (G201–G400). The former study showed that grass pea has a large difference among different phenotypic traits dependent on genotypes and ecosystem and also they have observed the same finding among the different phenotypic traits [5,44–46]. The mean of six biochemical traits of Chinese genotypes (G1–G200) showed higher than Bangladeshi genotypes (G201–G400) in the Hebei location but the Coefficient variation (CV%) of biochemical traits Bangladeshi genotypes (G201–G400) were higher than Chinese genotypes (G1–G200) in Hebei location. Previous studies reported that the effect of genotypes on protein or ODAP content is very important because it changes highly depending on environmental factors (soil and ecosystem) and they have observed the same finding among the biochemical traits [44].
4.3 Correlation and Path Coefficient
The correlation studies explain only the nature and amount of link of yield-related agronomic traits but it does not deliver the specifics of direct and indirect effects. Correlation studies (Fig. 2) specified that yield per plant showed a moderate to strongly positive correlation with traits such as 100 seed weight, seed color, pods per plant, plant height, days to 1st flowering, and days to 50% flowering. Some traits were found to be strongly negative with yield per plant that is seed per pod and flower color. These correlations of similar findings were reported by Singh et al. [47] and Ratna et al. [48] reported that yield per plant was negatively correlated with plant height. We also found that six biochemical traits showed a strong positive correlation among the genotypes G1–G200 and G201–G400 in the Hebei location and correlation range (0.71 to 0.98). Interestingly, we observed that ODAP contents were significantly low and a negative correlation showed with all agronomic traits (Fig. 2). This outcome can be hopeful to advance new varieties with low ODAP content and high-yielding varieties and convey a good message was caused through the toxin reduction and this idea also should be taken consideration with the future breeding prospect [49].
Path coefficient analysis (Table 4) is an arithmetical method to divide the correlation coefficients into direct and indirect effects of independent variables on dependent variables. The study of path analysis specified that total correlation coefficients with β-ODAP fresh and dry as well as the outcome of partitioning these correlations interested in indirect and direct effects contributions through other variables. From Correlation Studies, we found that the correlation coefficient between β-ODAP (fresh and dry) and the predictor variables is almost equal to its total effect. Therefore, correlation explains the true relationship and a direct selection through these traits will be effective. However, when the positive direct and indirect effects were added to the negative direct and indirect effects for traits, the sum of direct and indirect effects of the studied traits was positive and negative which means days to 1st flowering (1st DF), days to 50% flowering (50% DF), seed pod−1 (SP) and seed color (SC) have positively influenced the β-ODAP dry and β-ODAP fresh using the total effect. But the remaining traits plant height (PH), primary branches (PB), flower color (FC), pod plant−1 (PP), and yield plant−1 (YPP) were negatively influenced in both cases. Similar findings regarding plant height (PH) and Pod plant−1 (PP) were shown by Yang [50] and also showed plant height negatively and Pod plant−1 positively correlated with seed yield at the genotypic level. Lambein et al. [49] reported that the correlation of β-ODAP content with yield and yield-correlated traits such as 1000 seed weight (SW) and Pods plant−1 (PP) were significant and negative. So, the negative and significant correlation between β-ODAP and yield should be taken into consideration with this aspect by the breeders.
The preliminary element of all LD statistics is the variance among the practical and predictable haplotype incidences at polymorphic loci, and the scientific formulas for calculations may be established [21]. Concisely, LD is considered pairwise between two polymorphic positions; and the most commonly used LD procedures are R2 and D′. The interval of both parameters varies from 0 to 1. But our study showed R2 value ranged from 0.020–0.696 and D′ ranged from 0.143–0.862, and high LD showed less mapping resolution for less amount of marker as a self-pollinated crop, whereas Association mapping in populaces with low LD needs a high amount of markers [20].
4.5 Association Studies for Yield-Related Agronomic and Biochemical Traits
Different previous studies have reported that the Q value of population structure analysis can effectively improve the reliability of the association analysis [51]. In association analysis, the MLM model is more appropriate than the GLM model [52,53]. The MLM model not only reflects the impact of the Q value in the population structure but also reflects the K value of genetic association that interrupts the association analysis. A total of 99 and 61 MTAs (Marker trait associations) were shown in GLM and MLM models, respectively. In the MLM analysis outcomes, an entire of 5 markers related to agronomic traits were identified in total accessions (p ≤ 0.01), and phenotypic variance explained (PVE) by these MTAs varied from 10.21% to 45.37%. In the MLM analysis outcomes, an entire of seven markers related to biochemical traits (ODAP content) were identified in total accessions (p ≤ 0.01), and phenotypic variance explained (PVE) by these MTAs varied from 3.4% to 9.4%. In the future, these markers may be helpful for marker-assisted molecular breeding of grass pea considerable traits. Nevertheless, using a varied germplasm pool, widely distributed markers, multi-year phenotypic data, and multi-environment might reduce MTA analysis error. The 56 markers alleles (p ≤ 0.05) linked with 17 traits used for GWAS in this study were paralleled to other reported QTLs in grass peas. An earlier study has specified that marker-based gene pyramiding is an active policy for marker-aided selection [54]. In the current study, 21 SSR markers with promising alleles were associated with more than one trait in grass pea and might be useful for the advancement of grass pea accessions in future breeding platforms.
Linkage disequilibrium between a locus and a marker that consults or inspires a phenotypic trait is the foundation for association mapping. The amount of recombination examined differs significantly between classic linkage mapping and association mapping techniques of QTL finding. The likelihood of identifying meaningful marker-trait relationships over small genetic distances improved dramatically when diverse genotypes were used. In our study, among the 56 polymorphic SSR markers, 21 markers were associated with more than one trait in GLM and MLM models among the studied genotypes. In our study, using GLM and MLM models and passing in Bonferroni correction test we observed that the results of GLM and MLM model, a total of 6 markers C41936, C39067, C34100, C47146, C47638, and C43047 associated with our studies considerable traits days to maturity, flower color, plant height and seed per pod were detected in the Hebei and Liaoyang location (p ≤ 0.01), and the interpretation rate (R2 value) 11.2% to 43.6% (Table 3). The markers IPL-102 and IPL-65 showed significant association with the number of days to flowering and days to maturity having high R2 values in both GLM and MLM model analyses reported in a study [51]. So, these markers may be the genetic cause for the relationship between the pleiotropic properties of genes and the traits.
The selected six SSR primers, i.e., C41936, C39067, C34100, C47146, C47638, and C43047 might be used in our considerable traits and pooled via marker-assisted selection to advance accessions for excellent yield superiority. The biochemical traits (ODAP content) are low; and negative correlation with all agronomic traits in this study. The evidence of this study delivered the phenotypic variation of yield-related traits, population structure, and elite alleles stimulated us to take a further study to recommend an exhaustive outline for applying the studied outcomes in the platform for future genetics and in grass pea breeding. So it is a good message for low ODAP and high-yielding grass pea varieties. Low ODAP content high-yielding germplasms might be nominated as parents in the breeding platform based on the association outcomes and it will establish the base for new detailed association mapping lessons.
Acknowledgement: Authors are thankful to the Researchers Supporting Project Number (RSP2025R7) King Saud University, Riyadh, Saudi Arabia.
Funding Statement: We acknowledge the financial support from the Protection and Utilization of Crop Germplasm Resources project from the Ministry of Agriculture and Rural Affairs of China (2019NWB036-07), China Agriculture Research System of MOF and MARA-Food Legumes (CARS-08), National Infrastructure for Crop Germplasm Resources Project from the Ministry of Science and Technology of China (NICGR2019), Agricultural Science and Technology Innovation Program (ASTIP) in CAAS and Bangladesh-Second Phase of the National Agricultural Technology Program-Phase II Project, Bangladesh Agricultural Research Council (BARC), Bangladesh (P149553). This project was also supported by Researchers Supporting Project Number (RSP2025R7), King Saud University, Riyadh, Saudi Arabia.
Author Contributions: Conceptualization, Md. Mosiur Rahman, Md. Ruhul Quddus, Quanle Xu, Muhammad Malek Hossain, Rong Liu, Mengwei Li, Xin Yan, Guan Li, Yishan Ji, Chenyu Wang, Saleh Alfarraj, Tao Yang, Xuxiao Zong and Muhammad Malek Hossain; methodology, Md. Mosiur Rahman, Md. Ruhul Quddus, Quanle Xu, Muhammad Malek Hossain, Rong Liu, Mengwei Li, Xin Yan, Guan Li, Yishan Ji, Chenyu Wang, Saleh Alfarraj, Tao Yang, Xuxiao Zong and Muhammad Malek Hossain; software, Md. Mosiur Rahman, Akbar Hossain, Saleh Alfarraj, Sagar Maitra and Sagar Maitra, Mohammad Javed Ansari; validation, Md. Mosiur Rahman, Md. Ruhul Quddus, Quanle Xu, Muhammad Malek Hossain, Rong Liu, Mengwei Li, Xin Yan, Guan Li, Yishan Ji, Chenyu Wang, Saleh Alfarraj, Tao Yang, Xuxiao Zong and Muhammad Malek Hossain; formal analysis, Quanle Xu, Md. Mosiur Rahman,Saleh Alfarraj, Akbar Hossain, Sagar Maitra and Sagar Maitra, Mohammad Javed Ansari; investigation, Md. Mosiur Rahman, Md. Ruhul Quddus, Quanle Xu, Muhammad Malek Hossain, Rong Liu, Mengwei Li, Xin Yan, Guan Li, Yishan Ji, Chenyu Wang, Ashutosh SarkerS, Tao Yang, Xuxiao Zong and Muhammad Malek Hossain; resources, Quanle Xu, Md. Mosiur Rahman, Ashutosh Sarker, AH and Sagar Maitra, Mohammad Javed Ansari; data curation, Quanle Xu, Md. Mosiur Rahman, Ashutosh Sarker, Akbar Hossain, Sagar Maitra and Saleh Alfarraj,Mohammad Javed Ansari; writing—original draft preparation, Md. Mosiur Rahman, Md. Ruhul Quddus, Quanle Xu, Muhammad Malek Hossain, Rong Liu, Mengwei Li, Xin Yan, Guan Li, Yishan Ji, Chenyu Wang, Ashutosh Sarker, Tao Yang, Xuxiao Zong and Muhammad Malek Hossain; writing—review and editing, Quanle Xu, Md. Mosiur Rahman, Ashutosh Sarker, Akbar Hossain and Sagar Maitra, Mohammad Javed Ansari; visualization, Quanle Xu, Md. Mosiur Rahman, Ashutosh Sarker, Akbar Hossain, Sagar Maitra and Sagar Maitra, Mohammad Javed Ansari; supervision, Quanle Xu, Akbar Hossain, Saleh Alfarraj, Mohammad Javed Ansari, Sagar Maitra and Ashutosh Sarker; project administration,Quanle Xu, Md. Mosiur Rahman, Ashutosh Sarker, Akbar Hossain, Sagar Maitra and Mohammad Javed Ansari; funding acquisition, Quanle Xu, Md. Mosiur Rahman, Ashutosh Sarker, Akbar Hossain, Sagar Maitra and Sagar Maitra, Mohammad Javed Ansari. All authors reviewed the results and approved the final version of the manuscript.
Availability of Data and Materials: The datasets generated during and/or analyzed during the current study are available from the corresponding authors upon reasonable request.
Ethics Approval: Not applicable.
Conflicts of Interest: The authors declare that the research was conducted in the absence of any commercial or financial relationships that could be construed as a potential conflict of interest.
Supplementary Materials: The supplementary material is available online at https://doi.org/10.32604/phyton.2024.048992.
References
1. Soren KR, Konda AK, Gangwar P, Tiwari VA, Shanmugavadivel PS, Parihar AK, et al. Development of SSR markers and association studies of markers with phenology and yield-related traits in grass pea (Lathyrus sativus). Crop Pasture Sci. 2020;71(8):768–75. [Google Scholar]
2. Rathi D, Chakraborty S, Chakraborty N. Grasspea, a critical recruit among neglected and underutilized legumes, for tapping genomic resources. Curr Plant Biol. 2021;26:100200. [Google Scholar]
3. Kumar S, Gupta P, Barpete S, Choukri H, Maalouf F, Sarkar A. Chapter 12-Grass pea. In: The beans and the peas. From orphan to mainstream crops. Woodhead Publishing; 2021. p. 273–87. doi:10.1016/B978-0-12-821450-3.00005-6. [Google Scholar] [CrossRef]
4. Affrifah NS, Uebersax MA, Amin S. Nutritional significance, value-added applications, and consumer perceptions of food legumes: a review. Legume Sci. 2023;5(4):e192. [Google Scholar]
5. Lassoued S, Giosafatto CV, Mariniello L, Neila TF. Morphological characterization and in vitro digestibility of seven Lathyrus sativus (grass pea) accessions originating from Eurasia, Africa, and Canada. Eur Food Res Technol. 2023;249(9):2419–32. [Google Scholar]
6. Aci MM, Lupini A, Badagliacca G, Mauceri A, Lo Presti E, Preiti G. Genetic diversity among Lathyrus ssp. based on agronomic traits and molecular markers. Agronomy. 2020;10(8):1182. [Google Scholar]
7. Vaezi B, Mohtashami R, Jozian A, Mirzaei A. Evaluation of genotype× environment interaction and stability analysis of grain and forage yield of grass pea (Lathyrus sativa L.) genotypes. J Crop Breed. 2023;15(45):183–93. [Google Scholar]
8. Chowdhury MA, Slinkard AE. Genetic diversity in grasspea (Lathyrus sativus L.). Gen Resour Crop Evol. 2000;47:163–9. [Google Scholar]
9. Arslan M. Importance of grass pea (Lathyrus sativus L.) and bitter vetch (Vicia ervilia L.) as promising legumes against of global climate change. J Adnan Menderes Univ Agric Fac. 2019;16(1):97–104. [Google Scholar]
10. Edwards A, Njaci I, Sarkar A, Jiang Z, Kaithakottil GG, Moore C, et al. Genomics and biochemical analyses reveal a metabolon key to β-L-ODAP biosynthesis in Lathyrus sativus. Nature Commun. 2023;14(1):876. doi:10.1038/s41467-023-36503-2. [Google Scholar] [PubMed] [CrossRef]
11. Rajendran K, Sarker A, Singh M, Abd El-Moneim AM, Nakkoul H. Variation for seed protein and ODAP content in grass pea (Lathyrus sativus L.) germplasm collections. Ind J Gen Plant Breed. 2019;79(02):438–43. [Google Scholar]
12. Hanbury CD, Siddique KHM, Galwey NW, Cocks PS. Genotype-environment interaction for seed yield and ODAP concentration of Lathyrus sativus L. and L. cicera L. in Mediterranean-type environments. Euphytica. 1999;110(1):45–60. [Google Scholar]
13. Kumar Yadav V, Radhakrishna A, Mohan Das M, Singh T, Yadav S, Sharma P, et al. Deciphering genetic diversity in grass pea (Lathyrus sativus L.) collections using agronomic and forage quality traits and SSR markers. J Agric Sci Technol. 2022;24(6):1429–42. [Google Scholar]
14. Sen Gupta D, Barpete S, Kumar J, Kumar S. Breeding for better grain quality in Lathyrus. In: Gupta DS, Gupta S, Kumar J, editors. Breeding for enhanced nutrition and bio-active compounds in food legumes. Cham: Springer; 2021. p. 131–56. doi:10.1007/978-3-030-59215-8_6. [Google Scholar] [CrossRef]
15. Das A, Parihar AK, Barpete S, Kumar S, Gupta S. Current perspectives on reducing the β-ODAP content and improving potential agronomic traits in grass pea (Lathyrus sativus L.). Front Plant Sci. 2021;12:703275. [Google Scholar] [PubMed]
16. Lioi L, Galasso I. Development of genomic simple sequence repeat markers from an enriched genomic library of grass pea (Lathyrus sativus L.). Plant Breed. 2013;132(6):649–53. doi:10.1111/pbr.12093. [Google Scholar] [CrossRef]
17. Arslan M, Basak M, Aksu E, Uzun B, Yol E. Genotyping of low β-ODAP grass pea (Lathyrus sativus L.) germplasm with EST-SSR markers. Brazilian Archiv Biol Technol. 2020;63:e20190150. [Google Scholar]
18. Björn B, Paulo MJ, Kowitwanich K, Sengers M, Visser RGF, van Eck HJ. Population structure and linkage disequilibrium unravelled in tetraploid potato. Theor Appl Genet. 2010;121(6):1151–70. [Google Scholar]
19. Gaut BC, Long AD. The lowdown on linkage disequilibrium. Plant cell. 2003;15(7):1502–6. [Google Scholar] [PubMed]
20. Gonçalves L, Rubiales D, Lourenço M, Patto MC. Exploring grass pea (Lathyrus sativus L.) genetic diversity in Mediterranean changing climate conditions. Eur J Agron. 2024;156(2):127142. doi:10.1016/j.eja.2024.127142. [Google Scholar] [CrossRef]
21. Beji S, Fontaine V, Devaux R, Thomas M, Negro SS, Bahrman N, et al. Genome-wide association study identifies favorable SNP alleles and candidate genes for frost tolerance in pea. BMC Genomics. 2020;21:1–21. [Google Scholar]
22. Nicolas SD, Péros JP, Lacombe T, Launay A, Le Paslier MC, Bérard A, et al. Genetic diversity, linkage disequilibrium and power of a large grapevine (Vitis vinifera L.) diversity panel newly designed for association studies. BMC Plant Biol. 2016;16:1–9. [Google Scholar]
23. Crosta M, Romani M, Nazzicari N, Ferrari B, Annicchiarico P. Genomic prediction and allele mining of agronomic and morphological traits in pea (Pisum sativum) germplasm collections. Front Plant Sci. 2023;14:1320506. [Google Scholar] [PubMed]
24. Gawenda I, Schröder-Lorenz A, Debener T. Markers for ornamental traits in Phalaenopsis orchids: population structure, linkage disequilibrium and association mapping. Mol Breed. 2012;30(1):305–16. [Google Scholar]
25. Kosev V, Vasileva V. Genetic analysis of quantitative traits of grass pea (Lathyrus sativus L.) genotypes. Genetika. 2019;51(2):571–84. [Google Scholar]
26. Mekonen DA, Abraham A, Oselebe H, Afiukwa C, Abebe TD, Zemene A, et al. Estimation of ODAP contents and heritability of quantitative traits in grass pea (Lathyrus sativus L.) accessions from North-Western Ethiopia. Cogent Food Agric. 2024;10(1):2319174. [Google Scholar]
27. Srivastava A, Sharma A, Singh T, Kumar R. Correlation coefficient and path coefficient in field pea (Pisum sativum L.). Int J Curr Microbiol Appl Sci. 2018;7(2):549–53. [Google Scholar]
28. Bahadur L, Devi B. Estimation of correlation and path analysis coefficient among yield and yield attribution trails of field pea (Pisum sativum L.). J Pharmaco Phytochem. 2021;10(1):1696–9. [Google Scholar]
29. IPGRI. Descriptors for Lathyrus spp. International Plant Genetic Resource Resources Institute (IPGRI). Rome, Italy, 2000. p. 60. [Google Scholar]
30. Dellaporta S, Wood J, Hick J. A plant DNA mini-preparation: version 2. Plant Molecular Biology Report. 1983;1:19–21. [Google Scholar]
31. Rana MM, Aycan M, Takamatsu T, Kaneko K, Mitsui T, Itoh K. Optimized nuclear pellet method for extracting next-generation sequencing quality genomic DNA from fresh leaf tissue. Methods Protocols. 2019;2(2):54. [Google Scholar] [PubMed]
32. Liu KJ, Muse SV. Power Marker: an integrated analysis environment for genetic marker analysis. Bioinformatics. 2005;21(9):2128–9. [Google Scholar] [PubMed]
33. Li Z, Cheng F, Lan S, Guo J, Liu W, Li X, et al. Investigation of genetic diversity and epidemiological characteristics of Pasteurella multocida isolates from poultry in southwest China by population structure, multi-locus sequence typing and virulence-associated gene profile analysis. J Vet Med Sci. 2018;80(6):921–9. [Google Scholar] [PubMed]
34. Evanno G, Regnaut S, Goudet J. Detecting the number of clusters of individuals using the software structure: a simulation study. Mol Ecol. 2005;14(8):2611–20. [Google Scholar] [PubMed]
35. Bradbury PJ, Zhang Z, Kroon DE Casstevens TM, Ramdoss Y, Buckler ES, et al. TASSEL: software for association mapping of complex traits in diverse samples. Bioinformatics. 2007;23(19):2633–5. [Google Scholar] [PubMed]
36. Benjamini Y, Hochberg Y. Controlling the false discovery rate: a practical and powerful approach to multiple testing. J Royal Stat Soc. 1995;57(1):289–300. [Google Scholar]
37. Mohamed A, García-Martínez S, Carbonell P, José Ruiz J, Loumerem M. Genetic diversity assessment of Spanish and some endangered Tunisian pea (Pisum sativum L.) accessions based on microsatellite markers (SSRs). Chem Biodiver. 2023;20(5):e202201033. [Google Scholar]
38. Gumede MT, Gerrano AS, Amelework AB, Modi AT. Analysis of genetic diversity and population structure of cowpea (Vigna unguiculata (L.) Walp) genotypes using Single Nucleotide Polymorphism markers. Plants. 2022;11(24):3480. [Google Scholar] [PubMed]
39. Cai CP, Ye WX, Zhang TZ, Guo WZ. Association analysis of fiber quality traits and exploration of elite alleles in Upland cotton cultivars/accessions (Gossypium hirsutum L.). J Integ Plant Biol. 2014;56(1):51–62. [Google Scholar]
40. Qin HD, Chen M, Yi XD, Bie S, Zhang C, Zhang YC. Identification of associated SSR markers for yield component and fiber quality traits based on frame map and upland cotton collections. PLoS One. 2015;10(1):e0118073. [Google Scholar] [PubMed]
41. Islam MZ, Khalequzzaman M, Prince MFRK, Siddique MA, Rashid ESMH, Ahmed MSU. Diversity and population structure of red rice germplasm in Bangladesh. PLoS One. 2018;13(5):e0196096. [Google Scholar] [PubMed]
42. Wang F, Yang T, Burlyaeva M, Li L, Jiang J, Fang L, et al. Genetic diversity of grass pea and its relatives species revealed by SSRs markers. PLoS One. 2015;10(3):e0118542. [Google Scholar] [PubMed]
43. Tripathi K, Gore PG, Singh M, Pamarthi RK, Mehra R, Gayacharan C. Legume genetic resources: status and opportunities for sustainability. In: Hasanuzzaman M, editor. Legume crops-prospects, production and uses. 2020. p. 182. doi:10.5772/intechopen.91777. [Google Scholar] [CrossRef]
44. Basaran U, Acar Z, Karacan M, Onar AN. Variation and correlation of morpho-agronomic traits and biochemical contents (protein and β-ODAP) in Turkish grass pea (Lathyrus sativus L.) landraces. Turk J Field Crops. 2013;18(2):166–73. [Google Scholar]
45. Oten M. Evaluation of genetic variability of some local grass pea (Lathyrus sativus L.) genotypes using different statistical analysis. Legume Res. 2023;46(8):967–72. [Google Scholar]
46. Rybinski W, Szot B, Rusinek R. Estimation of morphological traits and mechanical properties of grass pea seeds (Lathyrus sativus L.) origination from EU countries. Int Agrophys. 2008;22(3):261–75. [Google Scholar]
47. Singh S, Verma V, Singh B, Sharma VR, Kumar M. Genetic variability, heritability and genetic advance studies in pea (Pisum sativum L.) for quantitative characters. Ind J Agric Res. 2019;53(5):542–7. [Google Scholar]
48. Ratna M, Begum S, Husna A, Dey SR, Hossain MS. Correlation and path coefficient analysis in Basmati rice. Bangladesh J Agric Res. 2015;40(1):153–61. [Google Scholar]
49. Lambein F, Travella S, Kuo YH, Van Montagu M, Heijde M. Grass pea (Lathyrus sativus L.orphan crop, nutraceutical or just plain food? Planta. 2019;250:821–38. [Google Scholar] [PubMed]
50. Yang G, Yang Y, Guan Y, Xu Z, Wang J, Yun Y, et al. Genetic diversity of shanlan upland rice (Oryza sativa L.) and association analysis of SSR markers linked to agronomic traits. Biomed Res Int. 2021;7588652, 11. doi:10.1155/2021/7588652. [Google Scholar] [PubMed] [CrossRef]
51. Price AL, Zaitlen NA, Reich D, Pattersson N. New approaches to population stratification in genome-wide association studies. Nat Rev Genet. 2010;11(7):459–63. doi:10.1038/nrg2813. [Google Scholar] [PubMed] [CrossRef]
52. Zhang Z, Ersoz E, Lai CQ, Todhunter RJ, Towari HK, Gore MA, et al. Mixed linear model approach adapted for genome-wide association studies. Nat Genet. 2010;42(4):355–60. doi:10.1038/ng.546. [Google Scholar] [PubMed] [CrossRef]
53. Sacco A, Matteo AD, Lombardi N, Trotta B, Punzo A. Quantitative varietal loci pyramiding for fruit quality traits in tomato. Mol Breed. 2013;31(1):217–22. doi:10.1007/s11032-012-9763-2. [Google Scholar] [PubMed] [CrossRef]
54. Sari H, Eker T, Tosun HS, Mutlu N, Celik I, Toker C. Mapping QTLs for super-earliness and agro-morphological traits in RILs population derived from interspecific crosses between Pisum sativum × P. fulvum. Curr Iss Mol Biol. 2023;45(1):663–76. [Google Scholar]
Cite This Article
 Copyright © 2024 The Author(s). Published by Tech Science Press.
This work is licensed under a Creative Commons Attribution 4.0 International License , which permits unrestricted use, distribution, and reproduction in any medium, provided the original work is properly cited.
 Downloads
 Citation Tools