
 Submit a Paper
 Propose a Special lssue
 Open Access
ARTICLE

Impacts of Defoliation on Morphological Characteristics and Non-Structural Carbohydrates of Populus talassica × Populus euphratica Seedlings
1 College of Life Science and Technology, Tarim University, Xinjiang Production and Construction Corps Key Laboratory of Protection and Utilization of Biological Resources in Tarim Basin, Alar, 843300, China
2 Agricultural Science Research Institute of the First Division, Xinjiang Production and Construction Corps, Alar, 843300, China
* Corresponding Author: Zhanjiang Han. Email:
Phyton-International Journal of Experimental Botany 2024, 93(7), 1689-1703. https://doi.org/10.32604/phyton.2024.052814
Received 16 April 2024; Accepted 11 June 2024; Issue published 30 July 2024
 View Full Text
 Download PDF
Abstract
Leaves are important ‘source’ organs that synthesize organic matter, providing carbon sources for plant growth. Here, we used Populus talassica × Populus euphratica, the dominant species in ecological and timber forests, to simulate carbon limitation through artificial 25%, 50%, and 75% defoliation treatments and explore the effects on root, stem, and leaf morphology, biomass accumulation, and carbon allocation strategies. At the 60th d after treatment, under 25% defoliation treatment, the plant height, specific leaf weight, root surface area and volume, and concentrations of non-structural carbohydrates in stem and root were significantly increased by 9.13%, 20.00%, 16.60%, 31.95%, 5.12%, and 9.34%, respectively, relative to the control. There was no significant change in the growth indicators under 50% defoliation treatment, but the concentrations of non-structural carbohydrates in the leaf and stem significantly decreased, showing mostly a negative correlation between them. The opposite was observed in the root. Under 75% defoliation treatment, the plant height, ground diameter, leaf number, single leaf area, root, stem, and total biomass were significantly reduced by 14.15%, 10.24%, 14.86%, 11.31%, 11.56%, 21.87%, and 16.82%, respectively, relative to the control. The concentrations of non-structural carbohydrates in various organs were significantly reduced, particularly in the consumption of the starch concentrations in the stem and root. These results indicated that carbon allocation strategies can be adjusted to increase the concentration of non-structural carbohydrates in root and meet plant growth needs under 25% and 50% defoliation. However, 75% defoliation significantly limited the distribution of non-structural carbohydrates to roots and stems, reduced carbon storage, and thus inhibited plant growth. Defoliation-induced carbon limitation altered the carbon allocation pattern of P. talassica × P. euphratica, and the relationship between carbon reserves in roots and tree growth recovery after defoliation was greater. This study provides a theoretical basis for the comprehensive management of P. talassica × P. euphratica plantations, as well as a reference for the study of plantation carbon allocation strategies in the desert and semi-desert regions of Xinjiang under carbon-limitation conditions.Keywords
Since the 1950s, large-scale artificial afforestation increasingly occurred globally [1]. According to The State of the World’s Forests 2022 [2], 7% of the global forest area consisted of plantations in 2020, with an area of approximately 294 million hectares, and the plantation area’s growth rate has shown a decreasing trend. Globally, approximately 36% of plantation area comes from the East Asia region [3], with China’s plantation area currently being the largest in the world [4]. The construction of plantations aids in the recovery of ruined forests and land degradation, as well as in improving biodiversity. Additionally, plantations provide effective supplements to the timber supply, thereby relieving the pressure of natural forest harvesting. The management of afforestation species is very important for improving forest growth and development, and consolidating afforestation achievements. As an important ‘source’ organ for synthesizing organics, leaves provide carbon sources for the growth and development of trees. Defoliation or leaf damage is a common way in which environmental stresses or anthropogenic disturbances affect the growth of tree seedlings [5], causing changes in the supply of organic, thereby affecting or threatening the normal growth and physiological metabolism of trees.
Carbon limitation can be divided into two types. One is the limitation of photosynthesis, which leads to insufficient carbon sources (carbon supply) in the tree, triggering a carbon source limitation that affects tree growth; the other is that stress (including defoliation caused by drought, pest outbreaks, and animal feeding) can lead to a reduction in the ability to utilize carbon in the tree, triggering a carbon sink (carbon utilization) limitation that affects tree growth [6,7]. Non-structural carbohydrates (NSCs), which are important components of plant carbon storage, include starch and soluble sugars [8], and the two can be reversibly transformed during carbon storage and carbon utilization under certain conditions [9]. NSCs play roles in the growth, metabolism, and defense systems of trees, as well as in the recovery from external disturbances (grazing, drought, and fire) [10–12]. Thus, when carbon synthesis is limited, plants consume stored NSCs to maintain activities, such as growth and development, metabolism, and physiological defense. The reduction of NSCs to the minimum threshold required to maintain growth and development inhibits plant growth and may lead to the threat of carbon starvation and death [13]. Defoliation may lead to both carbon supply limitation and carbon utilization limitation in tree growth [14], and artificial defoliation treatments are often used in experiments to simulate carbon limitation to examine how carbon allocation in plants reacts to defoliation.
Defoliation directly leads to a decrease in the total number and area of tree leaves, resulting in limited carbon synthesis and insufficient available carbon supply, which triggers a carbon source limitation. For example, for three consecutive years, 100% artificial defoliation was performed on Quercus velutina, and it was found that the ground diameter, total biomass, and NSC concentration of Q. velutina were consistently lower than the control [5]. Piper et al. [15] argued that the NSC content in the Nothofagus pumilio stem significantly decrease under 50% defoliation treatment, with changes in starch content playing a dominant role. In addition, under defoliation, trees can improve long-term viability by adjusting carbon allocation pattern of various organs, leading to slower growth and increased carbon storage. Puri et al. [16] found that Pinus pinaster branch and stem growth significantly decreases after defoliation treatments. Additionally, the NSC concentration is lower during the initial growth stage, and then, it increases and may even exceed that of the control group. However, defoliation significantly affects tree growth but not necessarily the NSC content; consequently, it has been hypothesized that this growth inhibition is not due to carbon limitation [17]. Variations in these research findings could stem from the degree of carbon limitation in plants and their response strategies. Therefore, studying the carbon allocation pattern and dynamic response after defoliation is of great theoretical significance for understanding tree adaptation strategies and regulatory mechanisms. In addition, defoliation may also lead to changes in NSCs, which can affect the hydraulic characteristics of the trees [18]. The main manifestation is that defoliation reduces the total leaf area of the crown, reduces transpiration, affects the water diversion ability of the tree, reduces water transport efficiency [19,20], and causes carbon utilization limitations [14]. NSCs can also participate in hydraulic regulation, such as osmotic regulation, embolization repair, and other processes [13,21]. In the next step of research, we may explore the impact of carbon limitation on the hydraulic traits of P. talassica × P. euphratica seedlings, with the purpose of gaining a broader understanding of the comprehensive impacts of carbon limitation on tree growth.
Populus talassica (♀) × Populus euphratica (♂) [22] is a perennial deciduous tree with excellent characteristics, such as straight stem shape, excellent timber, flush stand, and fast growth, and it is widely planted in Northwest China [23]. In the previous field survey focusing on P. talassica × P. euphratica plantations and farmland shelterbelts in Xinjiang, it was determined that it is susceptible to carbon limitation caused by factors such as Apocheima cinerarius infestations, animal consumption, and anthropogenic interference, which reduces its popularization area and value. This research employed P. talassica × P. euphratica, the dominant species in ecological and timber forests, as the material and established different defoliation intensities to simulate carbon limitation, exploring the effects on morphology, biomass accumulation, and carbon allocation strategies of various organs. The aim was answer: (1) With the increase of defoliation intensities, what are the morphological changes of P. talassica × P. euphratica seedlings? (2) How is the carbon allocation strategies of P. talassica × P. euphratica seedlings under different defoliation intensities? This provided the groundwork for the thorough management of P. talassica × P. euphratica plantations and for understanding the mechanisms of tree self-sustainability and self-renewal.
2.1 Overview of the Study Site
This study was conducted in the plantation of P. talassica × P. euphratica in the 10th Regiment of First Division, Alar, Xinjiang (81°18′08″ E, 40°36′13″ N and altitude of 1014 m). Anually, the temperature, solar radiation, precipitation, sunshine hours, and evaporation average stand at 12.1°C, 133.7–146.3 Kcal cm–2, 40.1–82.5 mm, 2556.3–2991.8 h, and 1876.6–2558.9 mm, respectively.
2.2 Plant Material and Experimental Treatments
The soil type was loam, The pH was 8.03. The contents of organic matter, alkali-hydrolyzed N, available K, and available P were 21.34 g·kg−1, 17.08, 143.07 and 22.05 mg·kg−1, in that order. Black plastic film was laid in early April 2023, and annual P. talassica × P. euphratica cuttings cultivated in the area were planted with the standard 30 cm × 30 cm spacing between plants. Cuttings are about 20 cm long and inserted into the underground part by about 10 cm. After 2.5 months of stable growth and sprouting, seedlings with good consistent growth, having no pests or diseases on their leaves, were separated into 4 groups of 50 each. Then, three groups were randomly selected for defoliation in a bottom-up order, with 25% defoliation (D25) indicating cutting one of every four leaves, 50% defoliation (D50) indicating cutting one of every two leaves, and 75% defoliation (D75) indicating cutting three of every four leaves. It was necessary to cut off the whole leaf and only retain the petiole, without considering the leaf age. Additionally,, it was necessary to ensure that the terminal buds were not damaged to ensure the full development of the branches. Another group served as the control (CK), and tagged these groups properly.
2.3 Measurement of Growth Indexes
The day of the defoliation treatment was set as day 0. The initial plant height, ground diameter, and leaf number of the treated seedlings were measured. The leaf indexes, including length, width, and area, were determined using ImageJ analysis software (1.44 P, National Institutes of Health, Bethesda, MD, USA). The leaves were dried 105°C for quarter and then reached at constant weight at 80°C to determine their dry weights. These indexes were determined every 15 days, a total of five times.
Additionally, At the 30th and 60th d after treatment, root and biomass indicators were measured in 6 times repeatedly. The root indicators, including length, surface area, and volume, were measured by a dual-light color scanner (MICROTEK ScanMaker, i800 Plus) and a LA-S series analyzer system (Hangzhou Wanshen Testing Technology Co., Ltd., Hangzhou, China). The dry weights, including root, stem, and leaf, were measured separately. And the leaf shape index (LSI), specific leaf weight (SLW), and root/top ratio (R/T) were calculated.
2.4 Measurement of NSC Concentration
The NSC concentrations of different organs were determined using the anthrone-sulfuric acid method [24] on the 30th and 60th d after treatment. The dried tissue materials were first powdered using a pulverizer and passed through a 100-mesh sieve. In total, 0.1000 g of organ samples and 10 mL of distilled water were poured into a 15-mL test tube, which was then sealed. Samples were placed in a boiling water bath for half-hour with constantly shaking, and extracted three times. The supernatants were collected in a 25-mL volumetric flask. The test tubes were washed epeatedly, then made up to volume, which was used for the determination of soluble sugars.
In total, each of the above sediment was treated with 2 mL of distilled water, gelatinized for 15 min at boiling water and cooled. Afterwards, 2 mL of 9.2 mol·L−1 HClO4 solution was introduced, and mixed for 15 min to ensure a full reaction. In total, 4 mL of distilled water was combined and blended thoroughly, followed by centrifuge at 3000 r·min−1 for 10 min. Supernatants were transferred into 50-mL volumetric flasks, followed by the addition of 2 mL of 4.6 mol·L−1 HClO4 solution. Samples were shaken for 15 min. Then, 5 mL of distilled water was introduced, mixed and centrifuged for 10 min. Residues were combined. The test tubes were washed repeatedly with distilled water, then made up to volume. 620 nm was used for colorimetric determinations of soluble sugar and starch concentrations. adding the two values to obtain NSC concentration. Concentrations of soluble sugar and starch were determined as follows:
where C represents the sugar concentration calculated from the glucose standard curve, VT represents total volume of sample extraction solution, VS represents sampling volume during measurement, W represents dry weight of samples, n represents dilution factor, and 0.9 represents the starch conversion coefficient.
Statistical analyses were performed using SPSS 25.0. The data were analyzed using a one-way ANOVA with Duncan’s method for multiple comparisons (p < 0.05). Differences in leaf indexes, root architecture, biomass, and concentration of non-structural carbohydrates between the 30th and 60th d of the same treatment were analyzed using independent sample t-tests (p < 0.05). Result were presented as means ± SEs. Charts were generated using Origin 2022.
3.1 Effects of Defoliation on Plant Heights and Ground Diameters of P. talassica × P. euphratica Seedlings
As the defoliation intensity increased, plant heights and ground diameters showed trends from increasing to decreasing (Fig. 1). Under the D25 treatment, plant heights increased significantly from the 45th d in comparison with contrast, whereas ground diameters increased significantly only after the 15th d. Plant heights under the D75 treatment decreased significantly from the 15th d, and ground diameters decreased significantly from the 30th d. Over time, the increases in plant heights and ground diameters of each treatment group showed slow-fast-slow trends. The plant height changes reached a maximum at 15–30 d in the CK and D75 treatment groups, whereas those of the D25 and D50 treatment groups reached maximums at 30–45 d. The ground diameter changes were greater at 15–30 d and then gradually decreased.
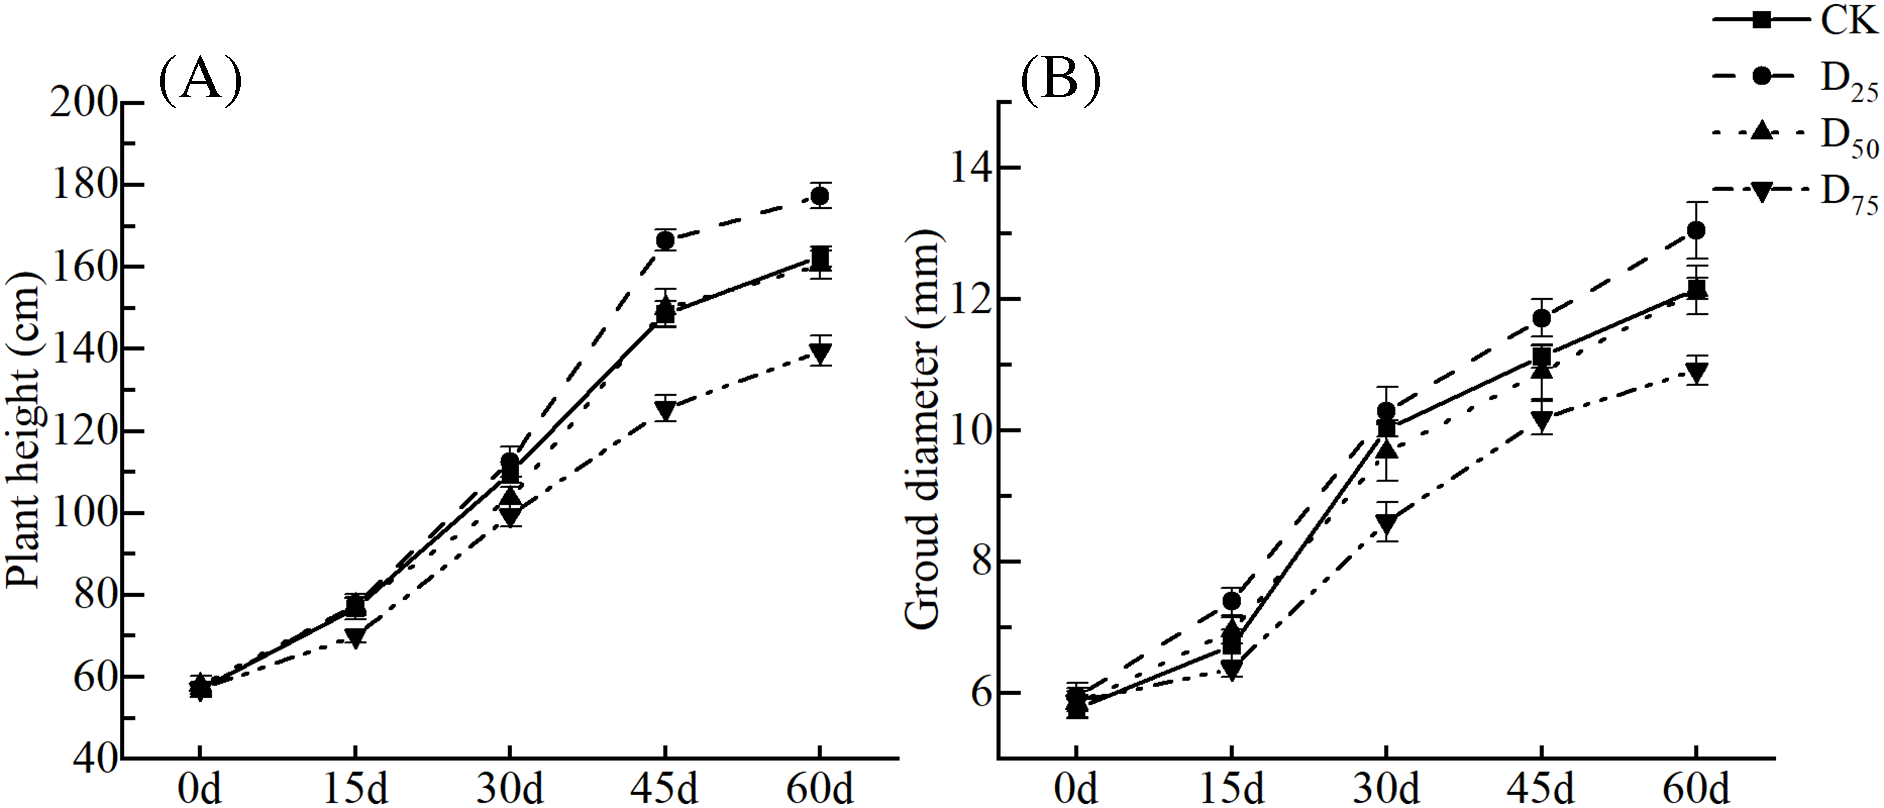
Figure 1: Effect of defoliation on plant heights (A) and stem diameters (B) of P. talassica × P. euphratica seedlings
Note: Data represent Mean ± SE, and lowercase letters indicate that different treatments for the same observed time are significantly different (p < 0.05).
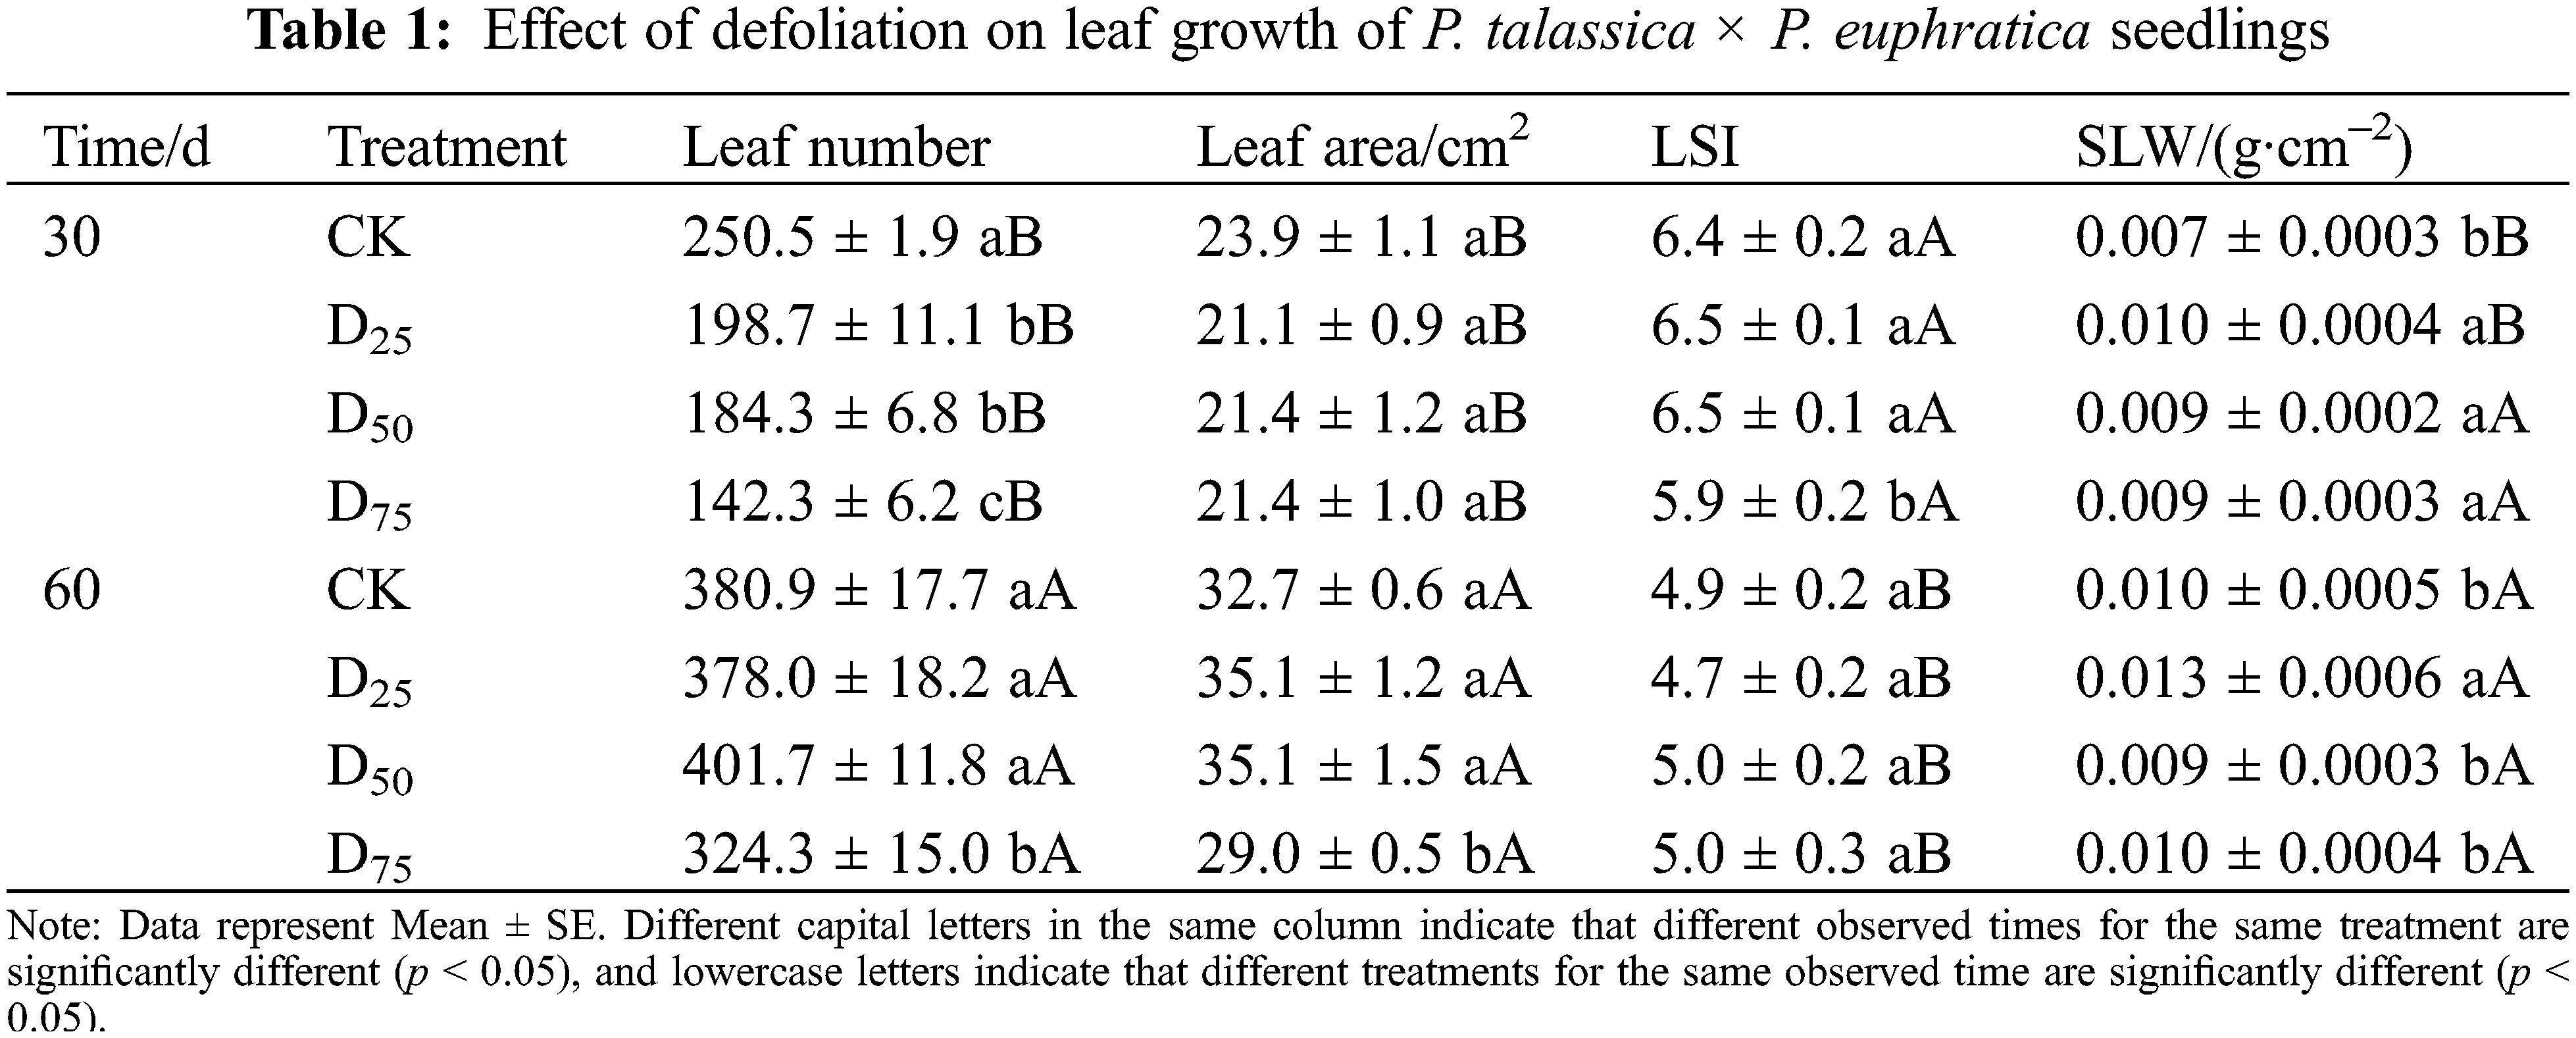
3.2 Effects of Defoliation on Leaf Growth of P. talassica × P. euphratica Seedlings
The leaf traits under different defoliation intensities are shown in Table 1. At the 30th d after treatment, leaf number reduced as the defoliation intensity enhanced. Three defoliation treatments successively significantly reduced by 20.68%, 26.43%, and 43.28% in comparison with contrast. The difference in leaf area was not significant. LSI significantly decreased by 7.81% only under the D75 treatment in comparison with contrast. SLW showed a trend from increasing to decreasing with the increase of defoliation intensities, and the three defoliation intensities were significantly exceed control. At the 60th d, leaf number and area significantly decreased in comparison with contrast only under D75 treatment. The LSI has recovered to no significant change. Compared with other treatments, the SLW was significantly increased under D25 treatment. Over time, the leaf number and area gradually increased, while LSI gradually decreased. The SLW gradually increased under CK and D25 treatments, while there was no significant change in D50 and D75 treatments.
3.3 Effects of Defoliation on the Root Architecture of P. talassica × P. euphratica Seedlings
Fig. 2 illustrates the changes in root architecture under different defoliation intensities. The total root lengths, root surface areas, and root volumes showed increasing and then decreasing trends along with the increase in defoliation intensity, except for the total root length at the 60th d and root volume at the 30th d. At the 30th d after treatment, the total root length and root surface area were the greatest under the D50 treatment, at 660.83 cm and 226.86 cm2, respectively, which were significantly exceed CK by 55.07% and 42.39%, respectively. The total root length was significantly exceed D25 by 45.81%, but this was not significantly different compared with the D75 treatment. By the 60th d, the total root lengths were no longer significantly different, and the root surface area was 463.21 cm2 under the D25 treatment, which was only significantly greater than that of the CK (Fig. 2A,B). There was not significant different in the root volume by the 30th d. However, by the 60th d, the root volume was 59.49 cm3 under the D25 treatment, which was a significant increase of 31.95% compared with the CK. There were no significant changes between the others and CK (Fig. 2C).
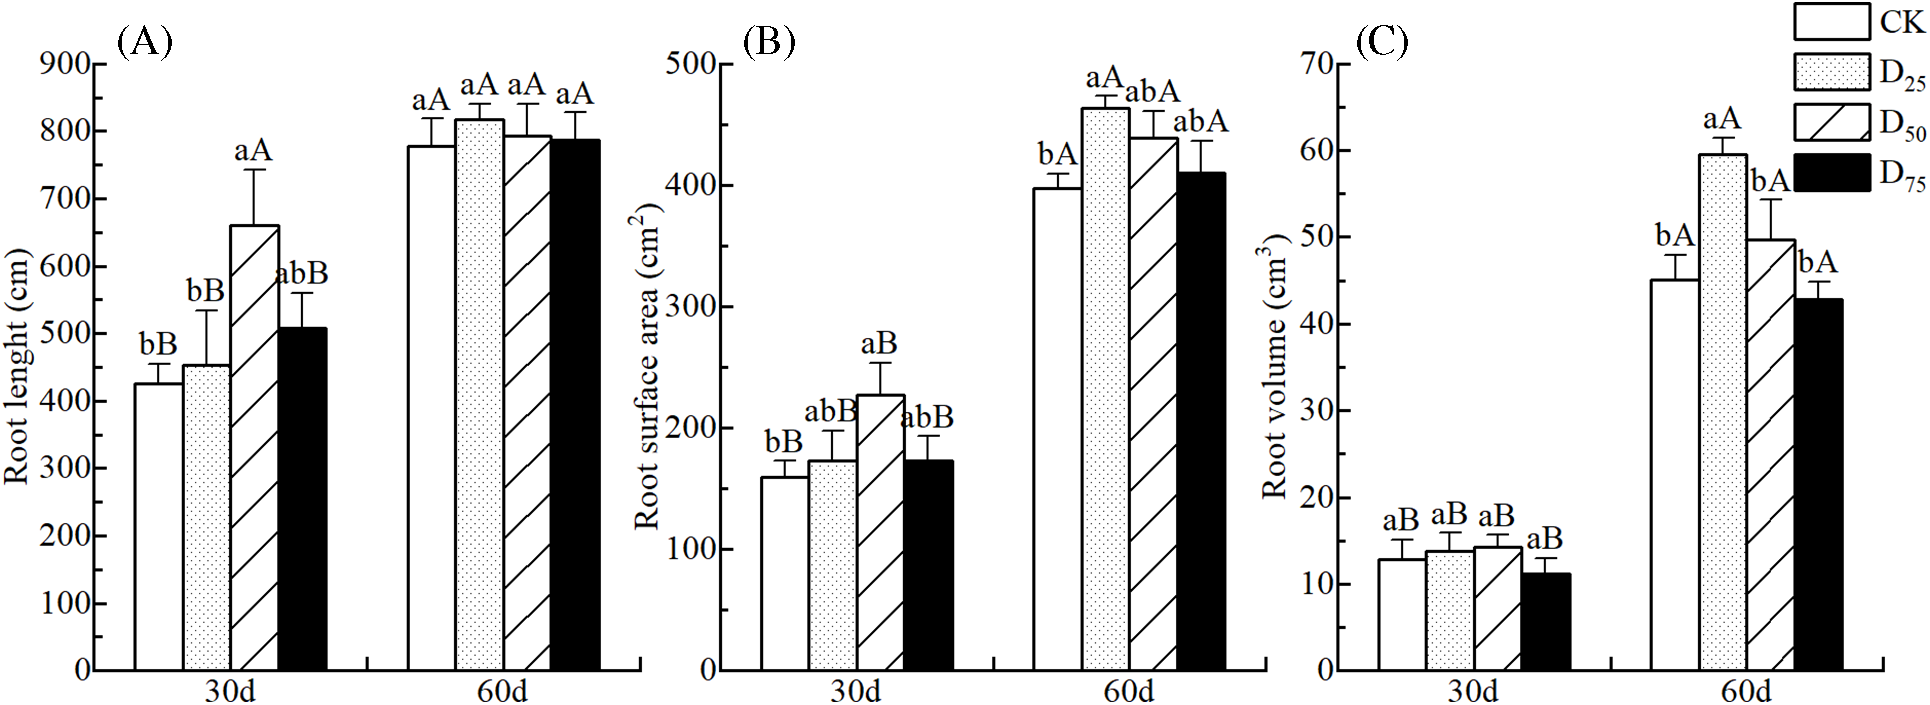
Figure 2: Effect of defoliation on the root length (A), root surface area (B), and root volume (C) of P. talassica × P. euphratica seedlings
Note: Data represent Mean ± SE. Different capital letters in the same column indicate that different observed times for the same treatment are significantly different (p < 0.05), and lowercase letters indicate that different treatments for the same observed time are significantly different (p < 0.05).
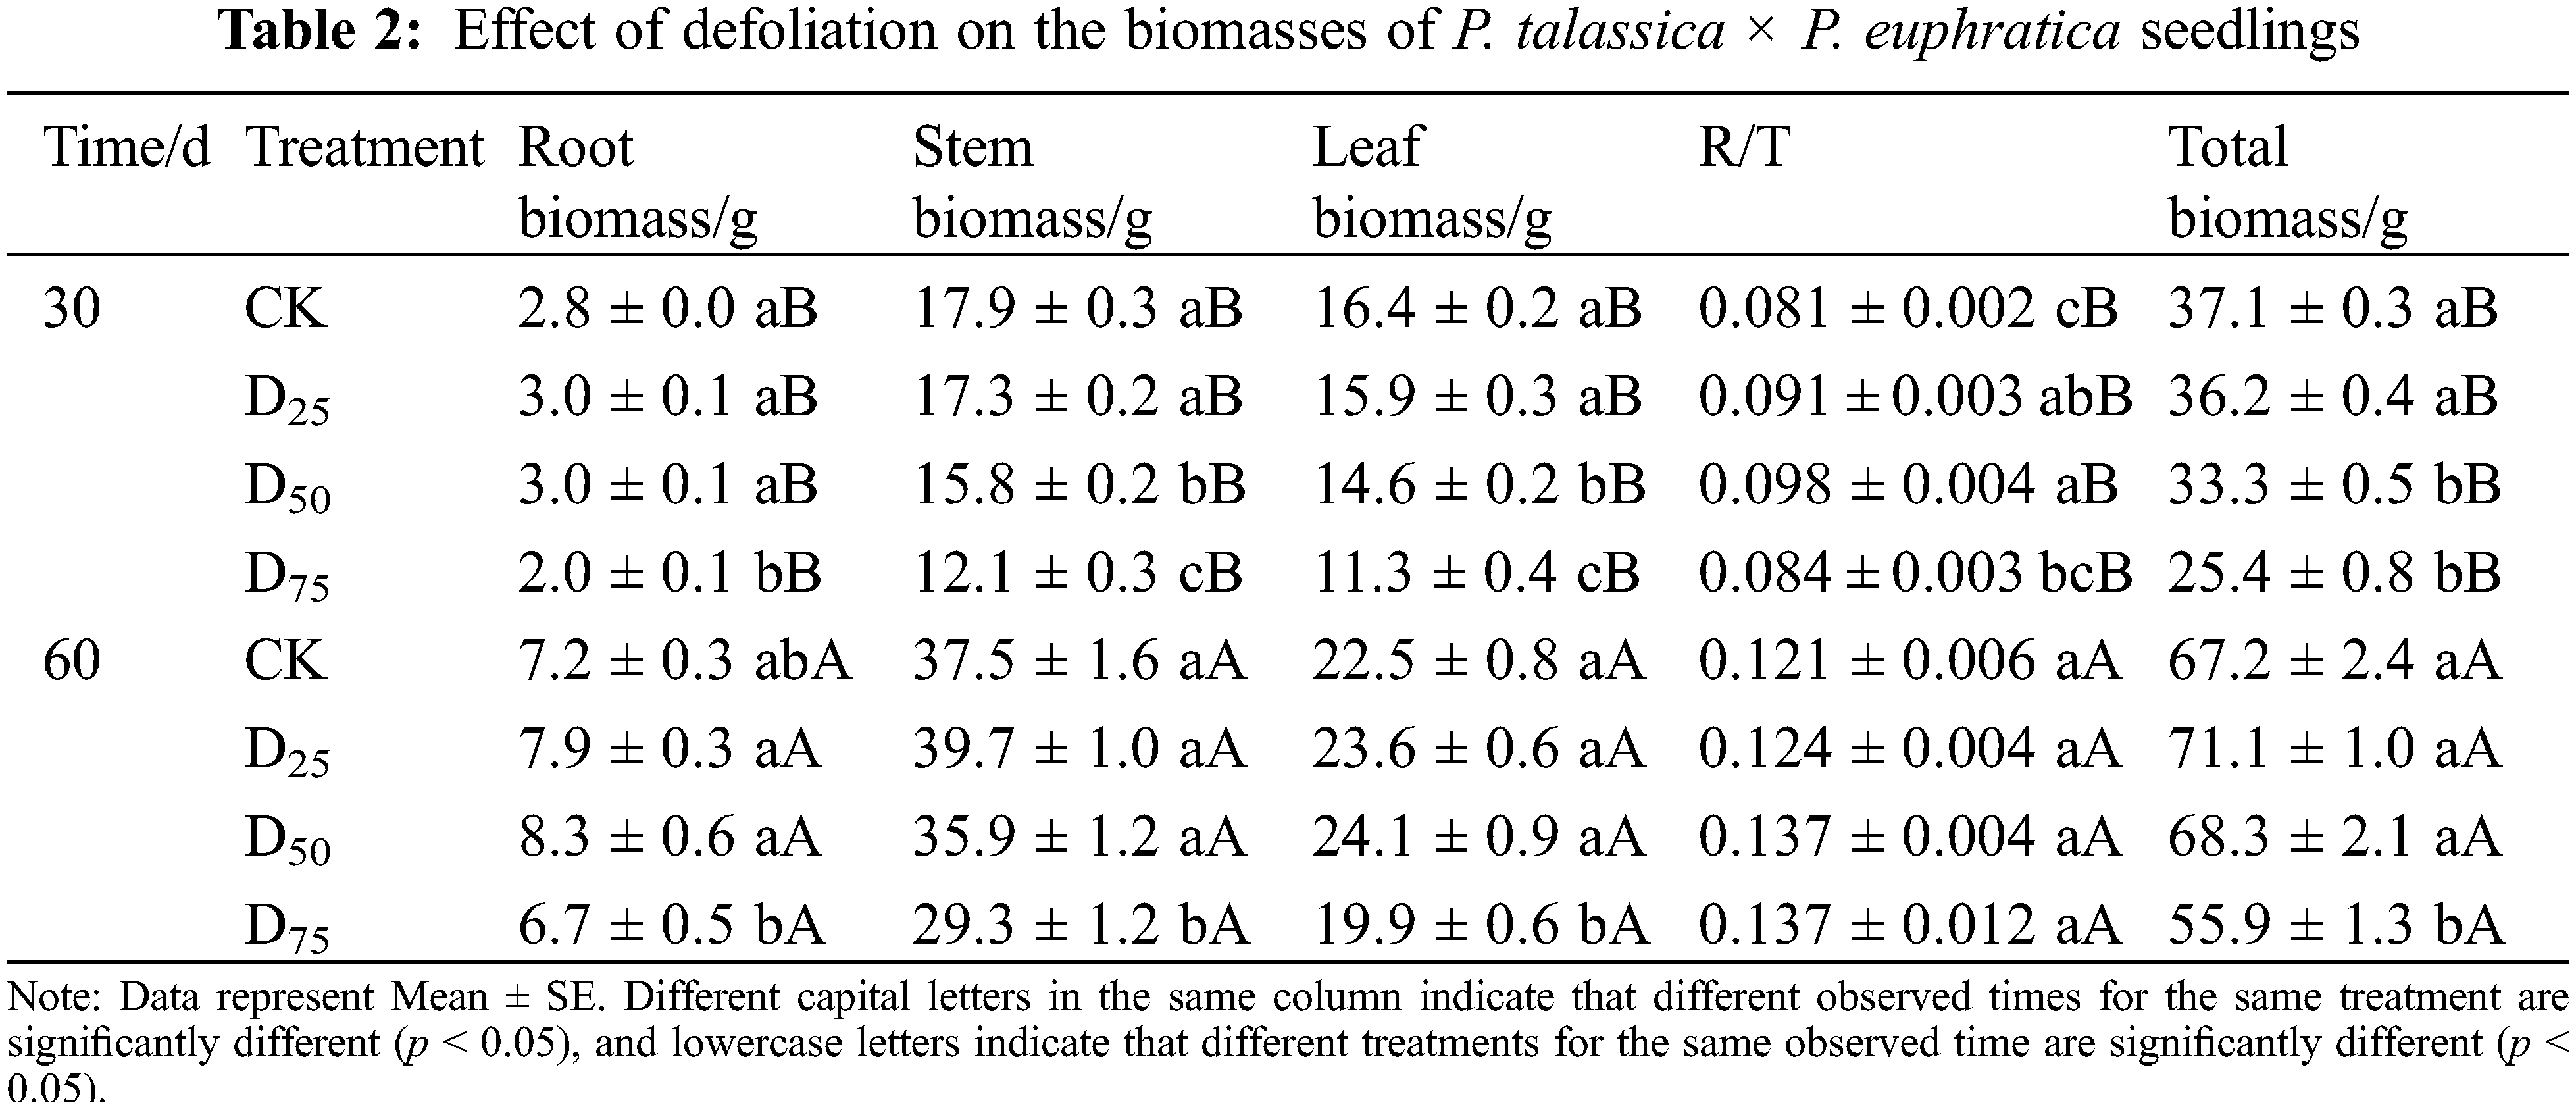
3.4 Effects of Defoliation on the Biomasses of P. talassica × P. euphratica Seedlings
The effects in biomass of root, stem, leaf, total, and R/T under different defoliation intensities are shown in Table 2. At the 30th d after treatment, the stem, leaf, and total biomasses decreased as the defoliation intensity increased. Compared with the CK, they were significantly reduced by 12.06%, 11.31%, and 10.28% under the D50 treatment, respectively, and by 32.32%, 31.43%, and 31.66% under the D75 treatment, respectively. The root biomass and R/T showed trends from increasing to decreasing as the defoliation intensity increased. The root biomass was significantly reduced by 28.72% in D75, and the R/T successively significantly increased by 12.35% and 20.99% in the D25 and D50 treatments in comparison with contrast. At the 60th d, with the increase in defoliation intensities, the biomasses of root, stem, leaf, total, and R/T, showed trends from increasing to decreasing. Compared with CK, stem, leaf, and total biomasses significantly decreased by 21.81%, 11.48%, and 16.83% under the D75 treatment, respectively, whereas the root biomass and R/T of each defoliation treatment group showed no significant changes compared with the CK.
3.5 Effects of Defoliation on the NSC Concentrations of P. talassica × P. euphratica Seedlings
Changes in the NSC concentrations of various organs under different defoliation intensities are shown in Fig. 3. At the 30th d, the NSC concentration in leaf increased along with defoliation intensity, and all the treatments achieved significant levels in comparison to CK. Among them, soluble sugar concentrations increased significantly in three treatment groups, whereas the starch concentrations decreased significantly by 24.63% and 27.49% under the D25 and D75 treatments, respectively (Fig. 3A–C). The NSC concentration in stem tended to increase and reached a significance level only under the D50 treatment. The soluble sugar concentration in stem increased significantly under the D50 treatment. Although the starch concentrations increased significantly under the D75 treatment, the soluble sugar concentrations tended to decrease (Fig. 3D–F). The NSC concentration trend in root was opposite to that in leaf, and soluble sugar and starch concentrations of three treated groups showed significantly decreasing trends (Fig. 3G–I). By the 60th d, the NSC concentration in leaf decreased as the defoliation intensity increased, reaching significance levels, decreasing by 9.82% and 14.17%, under the D50 and D75 treatments, respectively, compared with the CK. The soluble sugar concentration changed similarly, whereas the starch concentrations did not change significantly. When the defoliation intensity increased, the NSC concentrations in stem and root had a tendency of increasing at the beginning and decreasing in late, reaching significant levels and maximum values under the D25 treatment. The changes in soluble sugar concentrations were similar, whereas the starch concentrations showed significant decreasing trends. Over time, under the defoliation treatments, the soluble sugar and NSC concentrations in various organs gradually higher (except for the soluble sugar concentration in stem under D50 treatment), while the change was no significant at the starch concentration in leaf. The starch concentration in the stem gradually increased under D25 and D50 treatments. The starch concentration in root gradually increased under D25 treatment, while the opposite was observed under D50 and D75 treatments.
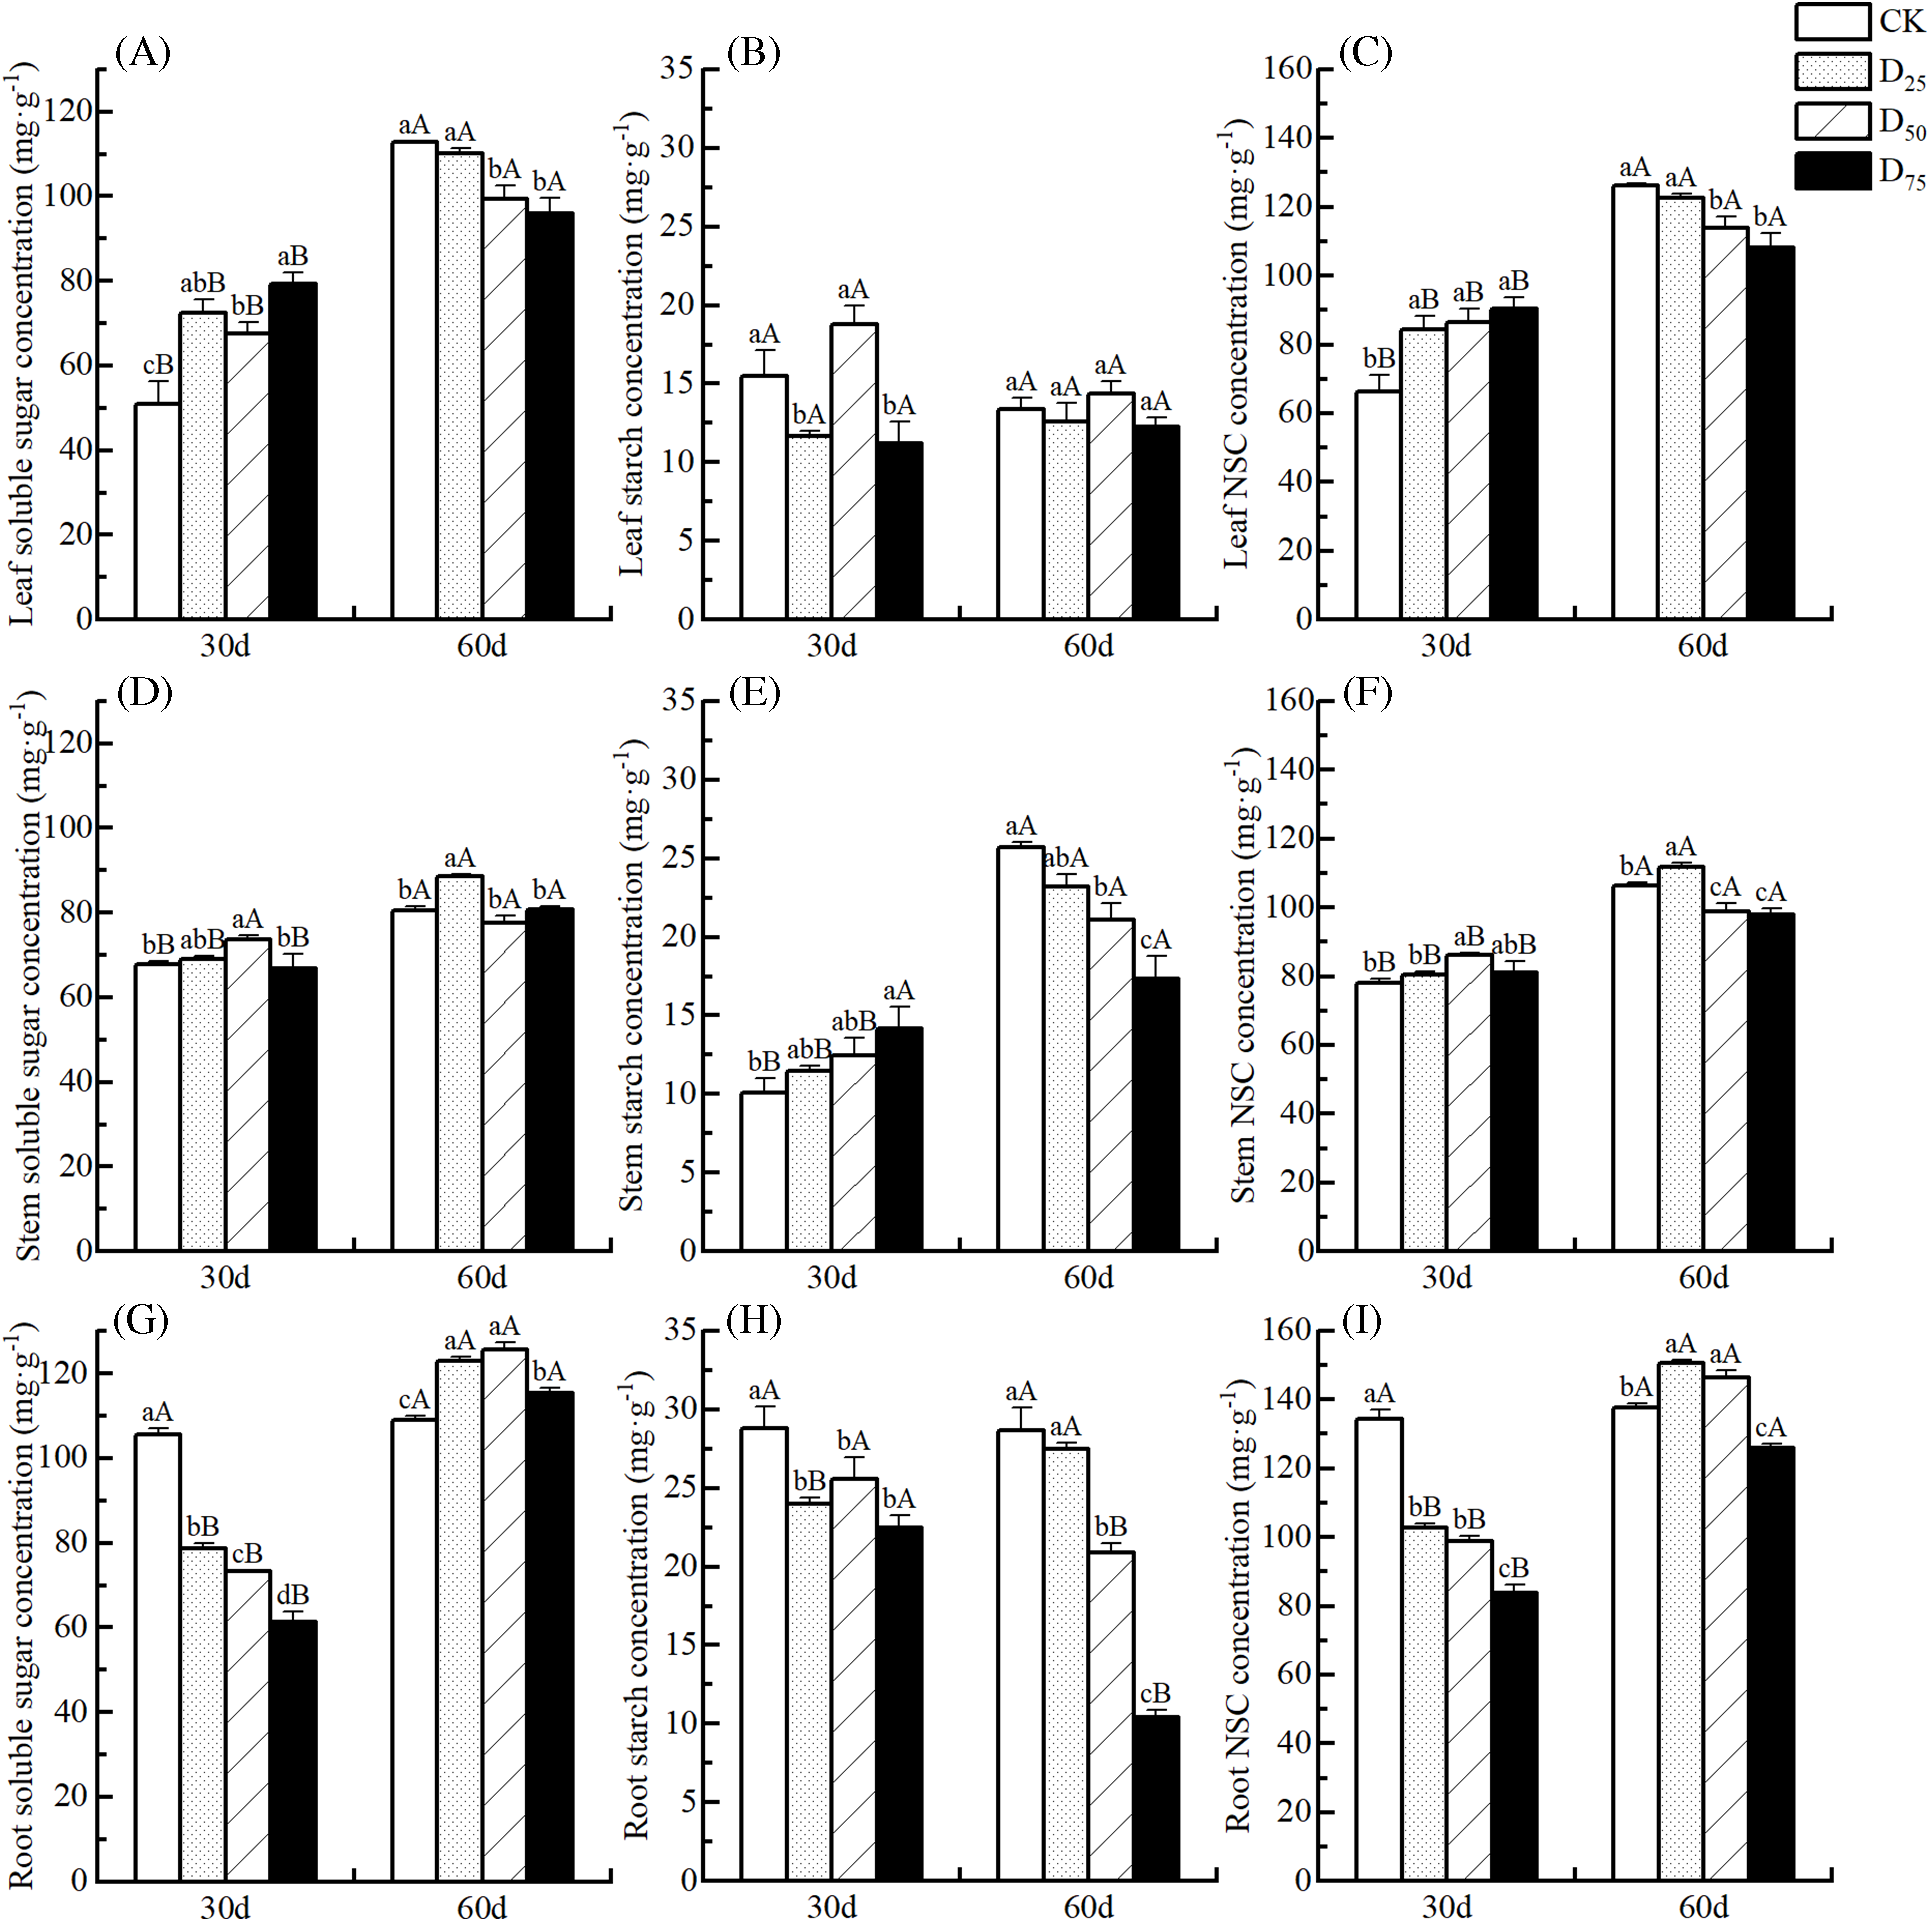
Figure 3: Effect of defoliation on the soluble sugar, starch, and NSC concentrations in various organs of P. talassica × P. euphratica seedlings. (A)–(C): leaf; (D)–(F): stem; (G)–(I): root
Note: Data represent Mean ± SE. Different capital letters in the same column indicate that different observed times for the same treatment are significantly different (p < 0.05), and lowercase letters indicate that different treatments for the same observed time are significantly different (p < 0.05).
3.6 Correlation Analysis between Growth Indicators and Non-Structural Carbohydrates of P. talassica × P. euphratica Seedlings
At the 60th d, pearson correlation analysis of growth indicators and NSCs in various organs are shown in Fig. 4. The soluble sugar concentration in leaf was significant negative correlated with leaf biomass in CK, including the NSC concentration in leaf and stem biomass, and the starch concentration and volume in root. The starch concentration in stem was significantly positively correlated with root biomass. In addition, the relationship between the starch concentration in root and stem biomass, total biomass were also like this. Under D25 treatment, the soluble sugar concentration in leaf was markedly or highly markedly negatively correlated with root volume and total biomass, while there was a notable positive correlation relationship between the starch concentration in leaf and LSI. The soluble sugar concentration in stem showed greatly positively correlated with root length, but exhibited opposite trends with root biomass and R/T. The NSC concentration in stem showed a significant positive correlation with root surface area, but opposite to leaf number, root biomass, and R/T. Under D50 treatment, Growth indicators and nonstructural carbohydrates in leaf and stem mostly showed significant negative correlations, e.g., the soluble sugar concentrations in leaf and stem biomass, the starch concentration in leaf and leaf area, the NSC concentrations in stem and root surface area. There was a significant positive correlation between the soluble sugar concentration in root and root length, along with the starch concentration in root and leaf area, and the NSC concentration in root and root biomass. Under D75 treatment, there was a highly significant positive correlation between the soluble sugar concentration in leaf and R/T, along with the NSC concentration in stem and root biomass. Significant positive correlation between NSC concentration in stem and root volume, while the NSC concentration in root was opposite to R/T.
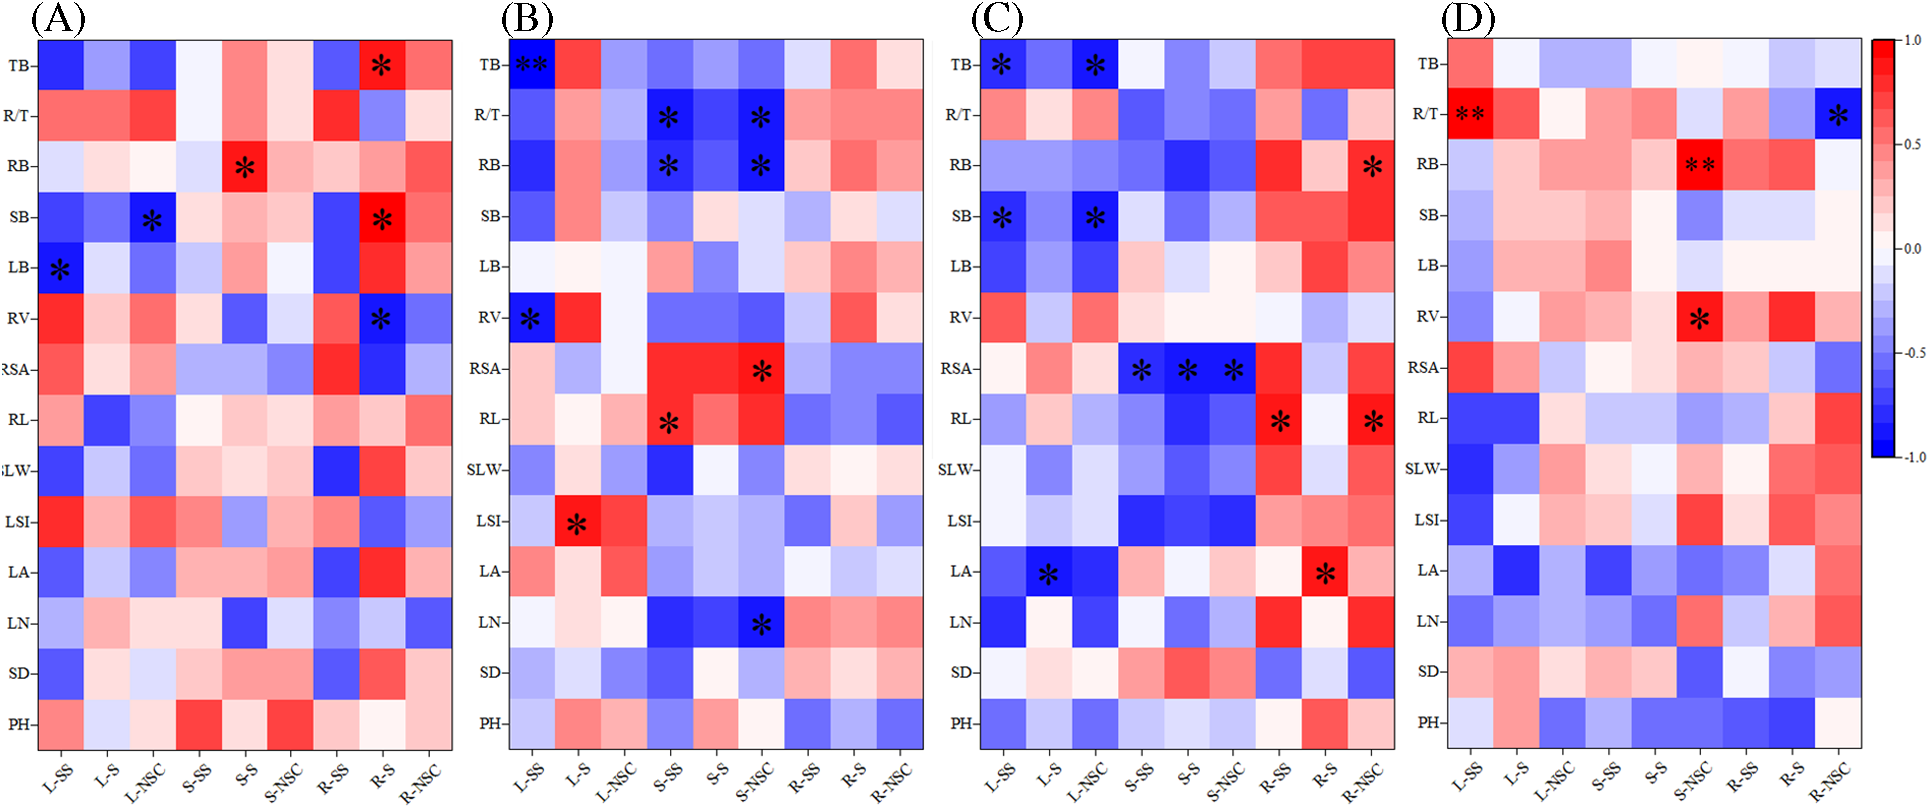
Figure 4: Correlation analysis between growth indicators and non-structural carbohydrates of P. talassica × P. euphratica seedlings. (A) CK; (B) D25 treatment; (C) D50 treatment; (D) D75 treatment. Abscissa: L-SS: soluble sugar concentration in leaf; L-S: starch concentration in leaf; L-NSC: NSC concentration in leaf; S-SS: soluble sugar concentration in stem; S-S: starch concentration in stem; S-NSC: NSC concentration in stem; R-SS: soluble sugar concentration in root; R-S: starch concentration in root; R-NSC: NSC concentration in root. Ordinate: PH: plant height; SD: stem diameter; LN: leaf number; LA: leaf area; RL: root lenght; RSA: root surface area; RV: root volume; LB: leaf biomass; SB: stem biomass; RB: root biomass; TB: total biomass
4.1 Effects of Defoliation on the Aboveground of P. talassica × P. euphratica Seedlings
Defoliation affects the growth of trees by decreasing the branch growth rate, and the incremental changes in stem diameter and plant height. It affects the radial growth of trees more than the longitudinal growth [25–27], and it decreases the new leaf number, decreases the leaf area, and increases the specific leaf area [28,29]. Growth indicators (plant height, ground diameter, and leaf number) are reflections of growth status and reveal changes in plant growth adaptations. Barry et al. [30] suggested that the plant height and ground diameter of Eucalyptus globulus and Eucalyptus nitens decreased under the 40% defoliation treatment. In this study, the increases in plant heights and ground diameters of P. talassica × P. euphratica became less and less as the defoliation intensity enhanced. Over time, 25% defoliation treatment promoted plant height and ground diameter, resulting in taller plants and robust growth, whereas the 75% defoliation treatment suppressed the plant height and ground diameter. This is probably because P. talassica × P. euphratica has self-compensating mechanisms [31]. These self-repair mechanisms may not be able to compensate for defoliation greater than 50%, leading to higher stress responses, resulting in stunted plant heights and ground diameters.
Leaves have strong environmental sensitivity and plasticity [32], and changes in their morphological structures will directly affect the photosynthetic efficiency of the plant. This leads to changes in the distribution and utilization of photosynthetic products, which affects plant growth. Previous study showed that the new leaf number and the leaf area are related to defoliation intensity and harvest time, nevertheless, the adverse impact of high-intensity defoliation on these indicators intensifies with time [33]. As a dominant species in plantations, P. talassica × P. euphratica has many leaves and branches, and leaves are spirally and interactively attached to the branches. In this study, with the defoliation intensity increased, the new leaf number increased initially, followed by an decrease. Compared with CK, the leaf number under 75% defoliation treatment was always significantly reduced, the leaf area was significantly reduced at the 60th d, and the LSI was significantly reduced only at the 30th d. This may indicate an adjustment in leaf morphology in response to nutrient deficiencies caused by leaf area loss. The SLW significantly increased under the defoliation treatments at the 30th d. A change in SLW is related to the trade-off between photosynthetically relevant tissue structures and thinning tissues [34], but it cannot simply be assumed that SLW shows a positive correlation with photosynthetic rate, because the latter is also related to the species and growth environment [35,36]. Owing to the compensatory photosynthesis [37] could not supply the requirements for normal growth of P. talassica × P. euphratica seedlings, resulting in a shortage of photosynthetic products, a decrease in leaf biomass accumulation, and a decreasing trend in SLW.
4.2 Effects of Defoliation on the Root Architecture and Biomass of P. talassica × P. euphratica Seedlings
As an vital ‘sink’ organ for tree growth, root development requires the consumption of large amounts of photosynthetic products. Defoliation leads to reductions in the leaf area and carbon sources, and the allocation of carbohydrates to various organs changes, which may lead to a carbon imbalance, resulting in weakened root development or even death [38,39]. Defoliation alters root growth, including attenuating or stagnating lateral root growth, which makes plant recovery difficult [40]. In this study, at the 30th d after treatment, as the defoliation intensity increased, the total root lengths and surface areas showed increasing and then decreasing trends. Under 50% defoliation, root length and surface area were greatest, but there was no significant change in root volume. This indicates that the moderate defoliation intensity is favorable to the growth of root systems within a certain period of time. By the 60th d, the total root length did not change significantly, but root surface area and volume showed increasing and then decreasing trends, with only the 25% defoliation treatment showing significant increases in root surface area and volume. Thus, defoliation treatments changed the carbon source allocation strategy in the plant, The light and moderate defoliation intensities, stimulated root growth, which increased the water and nutrient uptake levels [41,42].
As a basic biological characteristic and functional trait, biomass reflects the carbon storage and also the accumulations of acquired substances and energy [43]. The defoliation treatments directly affected the plant carbon acquisition ability, which in turn affected the accumulation of plant biomass. The biomass allocation of each organ is not only affected by the plant species, environmental factors, and defoliation intensity, it is also closely related to the harvest time [44]. Helbig et al. [45] applied three consecutive defoliation treatments to five species of Populus and three species of Salix. They significantly reduced the plant heights and the fresh weights of the aboveground biomasses and had greater effects on Populus than on Salix species. In this study, defoliation treatments affected biomass allocation in P. talassica × P. euphratica. At the 30th d, there was no significant change in root biomass, significant decreases in stem and leaf biomasses, and a significant increase in the R/T under 50% defoliation. By the 60th d, the indexes were no longer significantly different compared with the CK. This suggests that in the short term, under a moderate defoliation intensity, P. talassica × P. euphratica seedlings preferentially reduced stem and root biomass accumulations to compensate for carbon supply limitations, but they were able to recover growth within a certain time period. However, a higher defoliation intensity instead promotes the accumulation of biomass [46]. However, in this study, the biomass of each organ was always significantly reduced under the 75% defoliation treatment, which shows that the heavy defoliation intensity severely inhibited the growth of seedlings. This may have been due to insufficient carbon storage in the organs of the P. talassica × P. euphratica seedlings to cope with the limited carbon supply caused by heavy defoliation. This resulted in stress that negatively affected the its growth.
4.3 Effects of Defoliation on the NSC Concentrations of P. talassica × P. euphratica Seedlings
The regeneration capacity of trees is crucial for preserving vegetative diversity in forest ecosystems [47], whereas the allocation of NSCs to various organs significantly influences the growth and development of trees. It also reflects the adaptive capacity of trees in response to changes or disturbances in the external environment [48]. Alabarce et al. [49] demonstrated that Araucariaceae angustifolia is tolerant to branch and leaf damage, and it can respond to damage by increasing starch content. It also increases flavonoid concentrations in the leaf and stem, which protects it from animal consumption-related damage by weighing the allocation strategy between defense and tolerance during individual growth and development. In this study, defoliation significantly increased the NSC concentration in leaf at the 30th d, whereas the NSC concentration in root decreased. The overall performance is the consumption of NSCs in root. It may be that after defoliation, P. talassica × P. euphratica seedlings preferentially promote new branches grow, and photosynthate mainly accumulated in the leaves. However, with an insufficient carbon supply, the conversion of starch to soluble sugar is promoted and carbon utilization increases. Because photosynthetic products cannot be transported to the root system in time, P. talassica × P. euphratica seedlings may preferentially consume NSCs from the root system to maintain root development. This involves increasing growth of fine root and surface area, as well as the ability to absorb water and nutrients from the soil, in accordance with the proximity principle [50,51]. By the 60th d, with the increase in the defoliation intensity, the NSC concentration of each organ gradually reduced, indicating that NSCs in leaf and stem began to accumulate from the root under light and moderate defoliation intensities. Additionally, the consumption of the starch concentration in stem was dominant. This may be why defoliation inhibits the longitudinal growth of trees [52]. However, under the 75% defoliation treatment, the NSC concentration significantly decreased due to the lower starch concentrations in root and stem. This indicates that under long-term heavy defoliation, carbon storage in the stem and root can no longer compensate for the insufficient allocation of photosynthesis products owing to the reduction in leaf area; therefore, plant growth and development are limited. Long-term exposure to such an environment may even lead to the death of P. talassica × P. euphratica seedlings owing to carbon starvation. Thus, the starch content (carbon storage) is instrumental in forest growth and development, including physiological defenses and other processes [53].
4.4 Correlation between Growth Indicators and Non-Structural Carbohydrates of P. talassica × P. euphratica Seedlings
The contents and distribution of NSC in different plant tissues can reflect differences in the response of plant organs to carbon supply status and adaptation to environmental changes [54]. This research examined the correlation between growth indicators and non-structural carbohydrates of P. talassica × P. euphratica seedlings subjected to different defoliation methods. The results showed that defoliation affected the NSC concentration of its organs and regulated growth. Under different defoliation intensities, the correlation between the concentrations of NSCs and growth indicators varies in various organs. At the 60th d, with the decrease of defoliation intensities, the soluble sugar and NSC concentrations in leaf gradually decreased, and a decreasing trend of negative correlation with total biomass. This may be due to the fact that as the defoliation intensity increases, the leaf number and total area reduced, and the accumulation of leaf NSCs decreased, resulting in a reduced impact on the total biomass. Under D50 treatment, the NSC concentrations in leaf and stem showed a negative correlation with most growth indicators, while the NSC concentrations in roots showed a positive correlation with most growth indicators. These results indicate that under moderate defoliation intensity, NSCs in root contributes significantly to plant growth, i.e., the NSC concentration in root is crucial for plants to respond to environmental changes [55]. As a fast-growing tree species, P. talassica × P. euphratica requires more photosynthate to supply its growth during the seedling stage. Heavy defoliation directly leads to the slowing down of plant growth, the reduction of biomass, and the decrease of NSC concentrations in various organs, which disrupts carbon balance [56]. At this time, non-structural carbohydrates in stem showed mostly positive trends with root morphology and biomass, while the NSC concentrations in leaf and root are not strongly correlated with most growth indicators. This may be because the carbon storage in the root is greatly consumed, and newly synthesized carbon is not transported to the root in time, requiring a longer recovery time [57].
Defoliation affected the plant height, ground diameter, leaf number, root architecture, biomass accumulation, and NSC allocation strategies of P. talassica × P. euphratica seedlings, and they changed dynamically over time. Within a time period, the damage caused by light and moderate defoliation on plant root architecture and biomass could be recovered by adjusting the allocation of NSCs, and this could even promote plant height, ground diameter, and leaf number. Severe defoliation significantly reduced plant height, ground diameter, leaf number, single-leaf area, organ biomass accumulation, and NSC concentration. In particular, it depleted the starch concentrations in the stem and root, limiting plant growth. The main reason for the energy imbalance and under-compensated plant growth under severe defoliation may depend on the insufficient root NSC concentration and newly synthesized carbon. This provided the groundwork for the thorough management of P. talassica × P. euphratica plantations and is a reference for the study of carbon allocation strategies in forests under carbon-limited conditions. In the future, in accordance with the geographical characteristics of Xinjiang, we will carry out multi-factor interaction experiments by combining defoliation with drought, light, and other environmental factors, to explore the impacts of carbon limitation and carbon regulatory mechanisms on forest growth.
Acknowledgement: Thank Deqiang Lu, Jianyin Shi and Dongya Zhang for providing germplasm resources and technical support.
Funding Statement: This work was funded by the Talents ans its Youth Project of Xinjiang Production and Construction Corps (38000020924, 380000358).
Author Contributions: The authors confirm contribution to the paper as follows: study conception and design: Zhanjiang Han; data collection: Mengxu Su, Zhen Zhao; analysis and interpretation of results: Mengxu Su, Zhanjiang Han, and Xiaofeng Wu; draft manuscript preparation: Mengxu Su, Zhanjiang Han, and Jiaju Wu. All authors reviewed the results and approved the final version of the manuscript.
Availability of Data and Materials: The original data in this study can be obtained by contacting the corresponding author.
Ethics Approval: None.
Conflicts of Interest: The authors declare that they have no conflicts of interest to report regarding the present study.
References
1. Szulecka J, Pretzsch J, Seccob L. Paradigms in tropical forest plantations: a critical reflection on historical shifts in plantation approaches. Int For Rev. 2014;16(2):128–43. [Google Scholar]
2. Food and Agriculture Organization of the United Nations. The state of the world’s forests 2022: Forest pathways for green recovery and building inclusive, resilient and sustainable economies. Rome: FAO; 2022. p. 166. [Google Scholar]
3. Abbasi OA, Tang X, Harris NL, Glodman ED, Gamarra JGP, Herold M, et al. Spatial database of planted forests in East Asia. Sci Data. 2023;10(1):480. [Google Scholar] [PubMed]
4. Cheng K, Yang H, Guan H, Ren Y, Chen Y, Chen M, et al. Unveiling China’s natural and planted forest spatial-temporal dynamics from 1990 to 2020. ISPRS J Photogramm Remote Sens. 2024;209:37–50. [Google Scholar]
5. Wiley E, Casper BB, Helliker BR. Recovery following defoliation involves shifts in allocation that favour storage and reproduction over radial growth in black oak. J Ecol. 2017;105(2):412–24. [Google Scholar]
6. Wiley E, Helliker B. A re-evaluation of carbon storage in trees lends greater support for carbon limitation to growth. New Phytol. 2012;195(2):285–9. [Google Scholar] [PubMed]
7. Handa TI, Körner C, Hättenschwiler S. A test of the treeline carbon limitation hypothesis by in situ CO2 enrichment and defoliation. Ecology. 2005;86(5):1288–300. [Google Scholar]
8. Charlotte CR, Sharon MH. Nonstructural carbohydrates explain post-fire tree mortality and recovery patterns. Tree Physiol. 2023;44(2):tpad155. [Google Scholar]
9. Latt CR, Nair PKR, Kang BT. Reserve carbohydrate levels in the boles and structural roots of five multipurpose tree species in a seasonally dry tropical climate. For Ecol Manag. 2001;146(1):145–58. [Google Scholar]
10. Adams HD, Zeppel MJB, Anderegg WRL, Hartmanm H, Landhäusser SM, Tissue DT, et al. A multi-species synthesis of physiological mechanisms in drought-induced tree mortality. Nat Ecol Evol. 2017;1(9):1285–91. [Google Scholar] [PubMed]
11. Plotkin AB, Blumstein M, Laflower D, Pasquarella VJ, Chandler JL, Elkinton JS, et al. Defoliated trees die below a critical threshold of stored carbon. Funct Ecol. 2021;35(10):2156–67. [Google Scholar]
12. Piper FI, Paula S. The role of nonstructural carbohydrates storage in forest resilience under climate change. Curr For Rep. 2020;6(40):1–13. [Google Scholar]
13. McDowell NG. Mechanisms linking drought, hydraulics, carbon metabolism, and vegetation mortality. Plant Physiol. 2011;155(3):1051–9. [Google Scholar] [PubMed]
14. Sandra S, Sara P, Günter H. Growth reduction after defoliation is independent of CO2 supply in deciduous and evergreen young oaks. New Phytol. 2017;214(4):1479–90. [Google Scholar]
15. Piper FI, Fajardo A. Foliar habit, tolerance to defoliation and their link to carbon and nitrogen storage. J Ecol. 2014;102(5):1101–11. [Google Scholar]
16. Puri E, Hoch G, Körner C. Defoliation reduces growth but not carbon reserves in Mediterranean Pinus pinaster trees. Trees. 2015;29(4):1187–96. [Google Scholar]
17. Piper FI, Gundale MJ, Fajardo A. Extreme defoliation reduces tree growth but not C and N storage in a winter-deciduous species. Ann Bot. 2015;115(7):1093–103. doi:10.1093/aob/mcv038. [Google Scholar] [PubMed] [CrossRef]
18. Sala A, Woodruff DR, Meizer FC. Carbon dynamics in trees: feast or famine. Tree Physiol. 2012;32(1):764–75. doi:10.1093/treephys/tpr143. [Google Scholar] [PubMed] [CrossRef]
19. Palacio S, Hoch G, Sala AN, Körner C, Millard P. Does carbon storage limit tree growth? New Phytol. 2014;201(4):1096–100. doi:10.1111/nph.12602. [Google Scholar] [PubMed] [CrossRef]
20. Hillabrand RM, Hacke UG, Lieffers VJ. Defoliation constrains xylem and phloem functionality. Tree Physiol. 2019;39(7):1099–108. doi:10.1093/treephys/tpz029. [Google Scholar] [PubMed] [CrossRef]
21. Sevanto S, McDowell NG, Dickman LT, Pangle R, Pockman WT. How do trees die? A test of the hydraulic failure and carbon starvation hypotheses. Plant Cell Environ. 2014;37(1):153–61. doi:10.1111/pce.12141. [Google Scholar] [PubMed] [CrossRef]
22. Sun Y, Liu Y, Su MX, Han ZJ, Shi JY. Evaluation of salt and drought tolerances of Populus talassica × Populus euphratica seedlings using leaf anatomical structures and physiological processes. Pak J Bot. 2023;55(4):1205–14. [Google Scholar]
23. Su MX, Zhang M, Liu Y, Han ZJ. Abscisic acid, paclobutrazol, and salicylic acid alleviate salt stress in Populus talassica × Populus euphratica by modulating plant root architecture, photosynthesis, and the antioxidant defense system. Forests. 2022;13:1864. [Google Scholar]
24. Chen J, Dong T, Duan B, Korpelainen H, Niinements Ü., Li C. Sexual competition and N supply interactively affect the dimorphism and competiveness of opposite sexes in Populus cathayana. Plant, Cell Environ. 2015;38(7):1285–98. [Google Scholar] [PubMed]
25. Eyles A, Pinkard EA, Mohammed C. Shifts in biomass and resource allocation patterns following defoliation in Eucalyptus globulus growing with varying water and nutrient supplies. Tree Physiol. 2009;29(6):753–64. [Google Scholar] [PubMed]
26. Ferretti M, Ghosh S, Gottardini E. Stem radial growth is negatively related to tree defoliation and damage in conifers, northern Italy. Front For Glob Change. 2021;4:775600. [Google Scholar]
27. Alcorn PJ, Bauhus J, Smith RGB, Thomas D, James R, Nicotra A. Growth response following green crown pruning in plantation-grown Eucalyptus pilularis and Eucalyptus cloeziana. Can J For Res. 2008;38(4):770–81. [Google Scholar]
28. Anderegg WRL, Callaway ES. Infestation and hydraulic consequences of induced carbon starvation. Plant Physiol. 2012;159(4):1866–74. [Google Scholar] [PubMed]
29. Wiley E, Huepenbecker S, Casper BB, Helliker BR. The effects of defoliation on carbon allocation: can carbon limitation reduce growth in favour of storage? Tree Physiol. 2013;33(11):1216–28. [Google Scholar] [PubMed]
30. Barry K, Pinkard E. Growth and photosynthetic responses following defoliation and bud removal in eucalypts. For Ecol Manag. 2013;293:9–16. [Google Scholar]
31. Corona C, Leeper AC, LaMontagne JM. Differential defoliation and mortality of white spruce and balsam fir by eastern spruce budworm. For Ecol Manag. 2022;508:120042. [Google Scholar]
32. Lourens P, Frans B. Leaf traits are good predictors of plant performance across 53 rain forest species. Ecology. 2006;87(7):1733–43. [Google Scholar]
33. Calvo-Irabién LM, Zapata MT, Iriarte-Vivar S. Effects of leaf harvest on Thrinax radiata palm: implications for management and conservation. J Trop For Sci. 2009;21(1):34–44. [Google Scholar]
34. Wright IJ, Reich PB, Westoby M, Ackerly DD, Baruch Z, Bongers F, et al. The worldwide leaf economics spectrum. Nature. 2004;428(6985):821–7. [Google Scholar] [PubMed]
35. Amin PP, Hassan F, Enayatolah T. Nitrogen, phosphorous and potassium levels affected growth indices, leaf gas exchange parameters and biomass production of henna (Lawsonia inermis L.) ecotypes. Ind Crop Prod. 2021;163:113297. [Google Scholar]
36. Zhang J, Wu B, Zhu Y, Li Y, Lu Q, Yao B. Responses of Nitraria tangutorum to water and photosynthetic physiology in rain enrichment scenario. Acta Ecol Sin. 2013;33(3):172–7. [Google Scholar]
37. Sweet GB, Wareing PF. Role of plant growth in regulating photosynthesis. Nature. 1966;210(5031):77–9. doi:10.1038/210077a0. [Google Scholar] [CrossRef]
38. Palacio S, Paterson E, Hester AJ, Nogués S, Lino G, Anadon-Rosell A, et al. No preferential carbon-allocation to storage over growth in clipped birch and oak saplings. Tree Physiol. 2020;40(5):621–36. doi:10.1093/treephys/tpaa011. [Google Scholar] [PubMed] [CrossRef]
39. Gill AR, Jackson BR. Global patterns of root turnover for terrestrial ecosystems. New Phytol. 2000;147(1):13–31. doi:10.1046/j.1469-8137.2000.00681.x. [Google Scholar] [CrossRef]
40. Willaume M, Pagès L. How periodic growth pattern and source/sink relations affect root growth in oak tree seedlings. J Exp Bot. 2006;57(4):815–26. doi:10.1093/jxb/erj059. [Google Scholar] [PubMed] [CrossRef]
41. Motoyuki H, Noboru F, Atsushi Y. Theory of grazing optimization in which herbivory improves photosynthetic ability. J Theor Biol. 2007;248(2):367–76. doi:10.1016/j.jtbi.2007.05.018. [Google Scholar] [PubMed] [CrossRef]
42. Liu M, Gong JR, Yang B, Ding Y, Zhang Z, Wang B, et al. Differences in the photosynthetic and physiological responses of Leymus chinensis to different levels of grazing intensity. BMC Plant Biol. 2019;19(1):558. [Google Scholar] [PubMed]
43. Cornwell WK, Ackerly DD. Community assembly and shifts in plant trait distributions across an environmental gradient in coastal California. Ecol Monogr. 2009;79(1):109–26. [Google Scholar]
44. Poorter H, Niklas KJ, Reich PB, Oleksyn J, Poot P, Mommer L. Biomass allocation to leaves, stems and roots: meta-analyses of interspecific variation and environmental control. New Phytol. 2012;193(1):30–50. [Google Scholar] [PubMed]
45. Helbig CE, Müller MG, Landgraf D. Effects of leaf loss by artificial defoliation on the growth of different poplar and willow varieties. Forests. 2021;12(9):1224. [Google Scholar]
46. Hartnett DC, Jacqueline PO, Kathryn S, Ditlhogo MK. Coping with herbivory at the juvenile stage: responses to defoliation and stem browsing in the African savanna tree Colophospermum mopane. J Trop Ecol. 2012;28(2):161–9. [Google Scholar]
47. Fukushima M, Kanzaki M, Hara M, Ohkubo T, Preechapanya P, Choocharoen C. Secondary forest succession after the cessation of swidden cultivation in the montane forest area in Northern Thailand. For Ecol Manage. 2008;255(5):1994–2006. [Google Scholar]
48. Fang J, Liu F, Shugart HH, Yan X. Using a simple representation of non-structural carbohydrates allocation to predict wood growth in temperate forests. J Geophys Res-Biogeo. 2022;127(12):e2022JG007085. [Google Scholar]
49. Alabarce FS, Dillenburg LR. A possible ontogenetic trade-off between defense and tolerance in response to simulated herbivory in seedlings and saplings of Araucaria angustifolia. Theor Exp Plant Phys. 2014;26(2):147–56. [Google Scholar]
50. Gersony JT, Hochberg U, Rockwell FE, Park M, Holbrook NM. Leaf carbon export and nonstructural carbohydrates in relation to diurnal water dynamics in mature oak trees. Plant Physiol. 2020;183(4):1612–21. [Google Scholar] [PubMed]
51. Gaucher C, Gougeon S, Mauffette Y, Messier C. Seasonal variation in biomass and carbohydrate partitioning of understory sugar maple (Acer saccharum) and yellow birch (Betula alleghaniensis) seedlings. Tree Physiol. 2005;25(1):93–100. [Google Scholar] [PubMed]
52. Sudachkova EN, Milyutina LI, Romanova IL, Astrakhantseva NV. Effect of defoliation on the growth and metabolism of Scots pine. Contemp Probl Ecol. 2015;8(1):21–7. doi:10.1134/S199542551501014X. [Google Scholar] [CrossRef]
53. Gregory JM, Sahar M, Mark AAM, Patterson JA, Tetlow IJ, Emes MJ. Starch as a source, starch as a sink: the bifunctional role of starch in carbon allocation. J Exp Bot. 2017;68(16):4433–53. doi:10.1093/jxb/erx291. [Google Scholar] [PubMed] [CrossRef]
54. Jin Y, Li J, Liu C, Liu Y, Zhang Y, Sha L, et al. Carbohydrate dynamics of three dominant species in a Chinese savanna under precipitation exclusion. Tree Physiol. 2018;38(9):1371–83. doi:10.1093/treephys/tpy017. [Google Scholar] [PubMed] [CrossRef]
55. Tod LO, Richard LL. Long-term effects of defoliation on quaking aspen in relation to genotype and nutrient availability: plant growth, phytochemistry and insect performance. Oecologia. 2004;139(1):55–65. doi:10.1007/s00442-003-1481-3. [Google Scholar] [PubMed] [CrossRef]
56. Dong T, Duan B, Korpelainen H, Niinemets Ü, Li C. Asymmetric pruning reveals how organ connectivity alters the functional balance between leaves and roots of Chinese fir. J Exp Bot. 2019;70(6):1941–53. doi:10.1093/jxb/erz013. [Google Scholar] [PubMed] [CrossRef]
57. Landhäusser SM, Lieffers VJ. Defoliation increases risk of carbon starvation in root systems of mature aspen. Trees. 2012;26(2):653–61. doi:10.1007/s00468-011-0633-z. [Google Scholar] [CrossRef]
Cite This Article
 Copyright © 2024 The Author(s). Published by Tech Science Press.
This work is licensed under a Creative Commons Attribution 4.0 International License , which permits unrestricted use, distribution, and reproduction in any medium, provided the original work is properly cited.
 Downloads
 Citation Tools