
 Submit a Paper
 Propose a Special lssue
 Open Access
ARTICLE

Genetic Variability and Phenotypic Correlations Study among Grain Quality Traits and Mineral Elements Concentrations in Colored and Non-Colored Rice (Oryza sativa L.)
1 Agricultural Biotechnology Department, College of Agricultural and Food Science, King Faisal University, Al-Ahsa, 31982, Saudi Arabia
2 Plant Pathology Research Institute, Agriculture Research Center, Giza, 12619, Egypt
3 Rice Research and Training Center, Field Crop Research Institute, Agriculture Research Center, 33717, Egypt
4 Biological and Geological Sciences Department, Faculty of Education, Ain Shams University, Cairo, 11511, Egypt
5 Biochemistry Department, Faculty of Agriculture, Cairo University, Giza, 12613, Egypt
* Corresponding Authors: Adel A. Rezk. Email: ; Heba I. Mohamed. Email:
(This article belongs to the Special Issue: Recent Research Trends in Genetics, Genomics, and Physiology of Crop Plants)
Phyton-International Journal of Experimental Botany 2024, 93(7), 1733-1748. https://doi.org/10.32604/phyton.2024.052739
Received 13 April 2024; Accepted 14 June 2024; Issue published 30 July 2024
 View Full Text
 Download PDF
Abstract
Twenty-four rice genotypes were examined to assess genetic variability, heritability, and correlations for seven-grain quality traits, eight nutritional elements, and protein. ANOVA revealed significant differences for the quality traits studied. For every trait under study, the phenotypic coefficient of variation was higher than the correspondence genotypic coefficient of variation. Heritability in a broad sense varied from 29.75% for grain length to 98.31% for the elongation trait. Hulling percentage recovery had a highly significant positive correlation with milling and head rice percentage. Consequently, milling percentage had a highly positive correlation with head rice percentage. In amylose percentage, all the genotypes belonged to low amylose except the Hassawi-1 variety, which had intermediate amylose content. Mineral nutrition contents of magnesium (Mg), sodium (Na), potassium (K), calcium (Ca), copper (Cu), manganese (Mn), zinc (Zn), iron (Fe), or protein percentage gave different variations for 24 rice genotypes under all the nutritional elements. Among the 24 genotypes, ten rice genotypes–HighNutrient-1, HighNutrient-2, HighNutrient-9, HighNutrient-8, HighNutrient-3, Hassawi-2, HighNutrient-7, HighNutrient-6, Hassawi-1, and HighNutrient-4–had the highest heist value for all nutritional and protein contents, and could be used as a donor to improving new varieties. There was a positive and significant correlation between magnesium Mg, K, Zn and Fe. Consequently, K had a positive correlation with zinc Zn, Fe, and protein percentage. Clustering analysis was divided into two groups: the first group included all genotypes rich in nutrients, while the remaining genotypes with low nutritional content were included in the second group.Keywords
One of the most essential foods is rice (Oryza sativa L.) and it provides most of the human needs for carbohydrates, nutrient elements, calories, and protein. In Asia and Africa, rice makes up 50%–80% of daily caloric consumption, making it an especially essential source of energy [1–3]. Therefore, one of the primary goals of rice breeding is to improve rice quality, a complex attribute that includes grain appearance, milling, cooking, eating, or nutritional value [4]. Nutrient elements are important components in human nutrition, which will help directly and indirectly in strengthening the human immune system [5–8]. The immune system is responsible for resistance to diseases, and it is considered a wall against any attack on the human body. The essential nutrient elements also contribute to the building of bones and the development and growth of organs in children [9,10]. Anyway, the quality of food is estimated based on what it contains of important elements such as zinc, phosphorus, potassium, magnesium, and other elements necessary for human life [11–13]. Therefore, scientists resorted to increasing these components in some crops, such as the production of golden rice, which was known to increase vitamin A in it, and there are also many varieties now known to be rich in the necessary elements important to humans [14,15]. As for the security of food and nutrition, micronutrient deficiencies are seen as one of the new threats, especially in developing countries [16].
Rice breeders developed new varieties rich in proteins and micronutrients through conventional breeding and genetic engineering. Through the use of breeding approaches, these technologies offer the chance to select genotypes rich in micronutrients for direct application or to genetically modify staple crops [17,18]. Since then, scientists have worked to improve rice varieties and reduce production barriers by examining the genetic variability of the crop. This is necessary because the development of successful rice breeding programs depends on the presence of genetic variability and character association in rice [19–21]. Thus, to begin an effective breeding program, a thorough assessment of genetic variability utilizing appropriate metrics including genotypic coefficient of variation, heritability estimates, or genetic progress is required before program initiation [22].
Genetic variety is the occurrence of individual differences brought about by variations in their upbringing and genetic composition [23–26]. Genetic variation analysis facilitates the observation of germplasm and the prediction of probable genetic traits by breeders [27]. Until recently, morphological characterization was a useful technique for detecting genetic material. Nevertheless, it is no longer a useful strategy for differentiating commercial genotypes [28] due to the commercial genotype higher consistency in morphological features and the limited number of morphological traits available [29].
Therefore, the current study aims to estimate the essential nutritional elements in white rice grains under study and to study the genetic parameters and genetic diversity among twenty-four rice genotypes.
In this study, 24 genotypes of different types of rice were selected on basis of grain quality characteristics, important nutritional elements, and growing during the 2020–2021 seasons (Table 1). These genotypes come from different sources, nine from Korea, two from Kingdom of Saudi Arabia, four from International Rice Research Institute (IRRI), and nine from Egypt. However, there was diversity in the selection of these genotypes, which included 16 japonica types, four indica types, and four indica-Japonica types used in this study (Fig. 1).
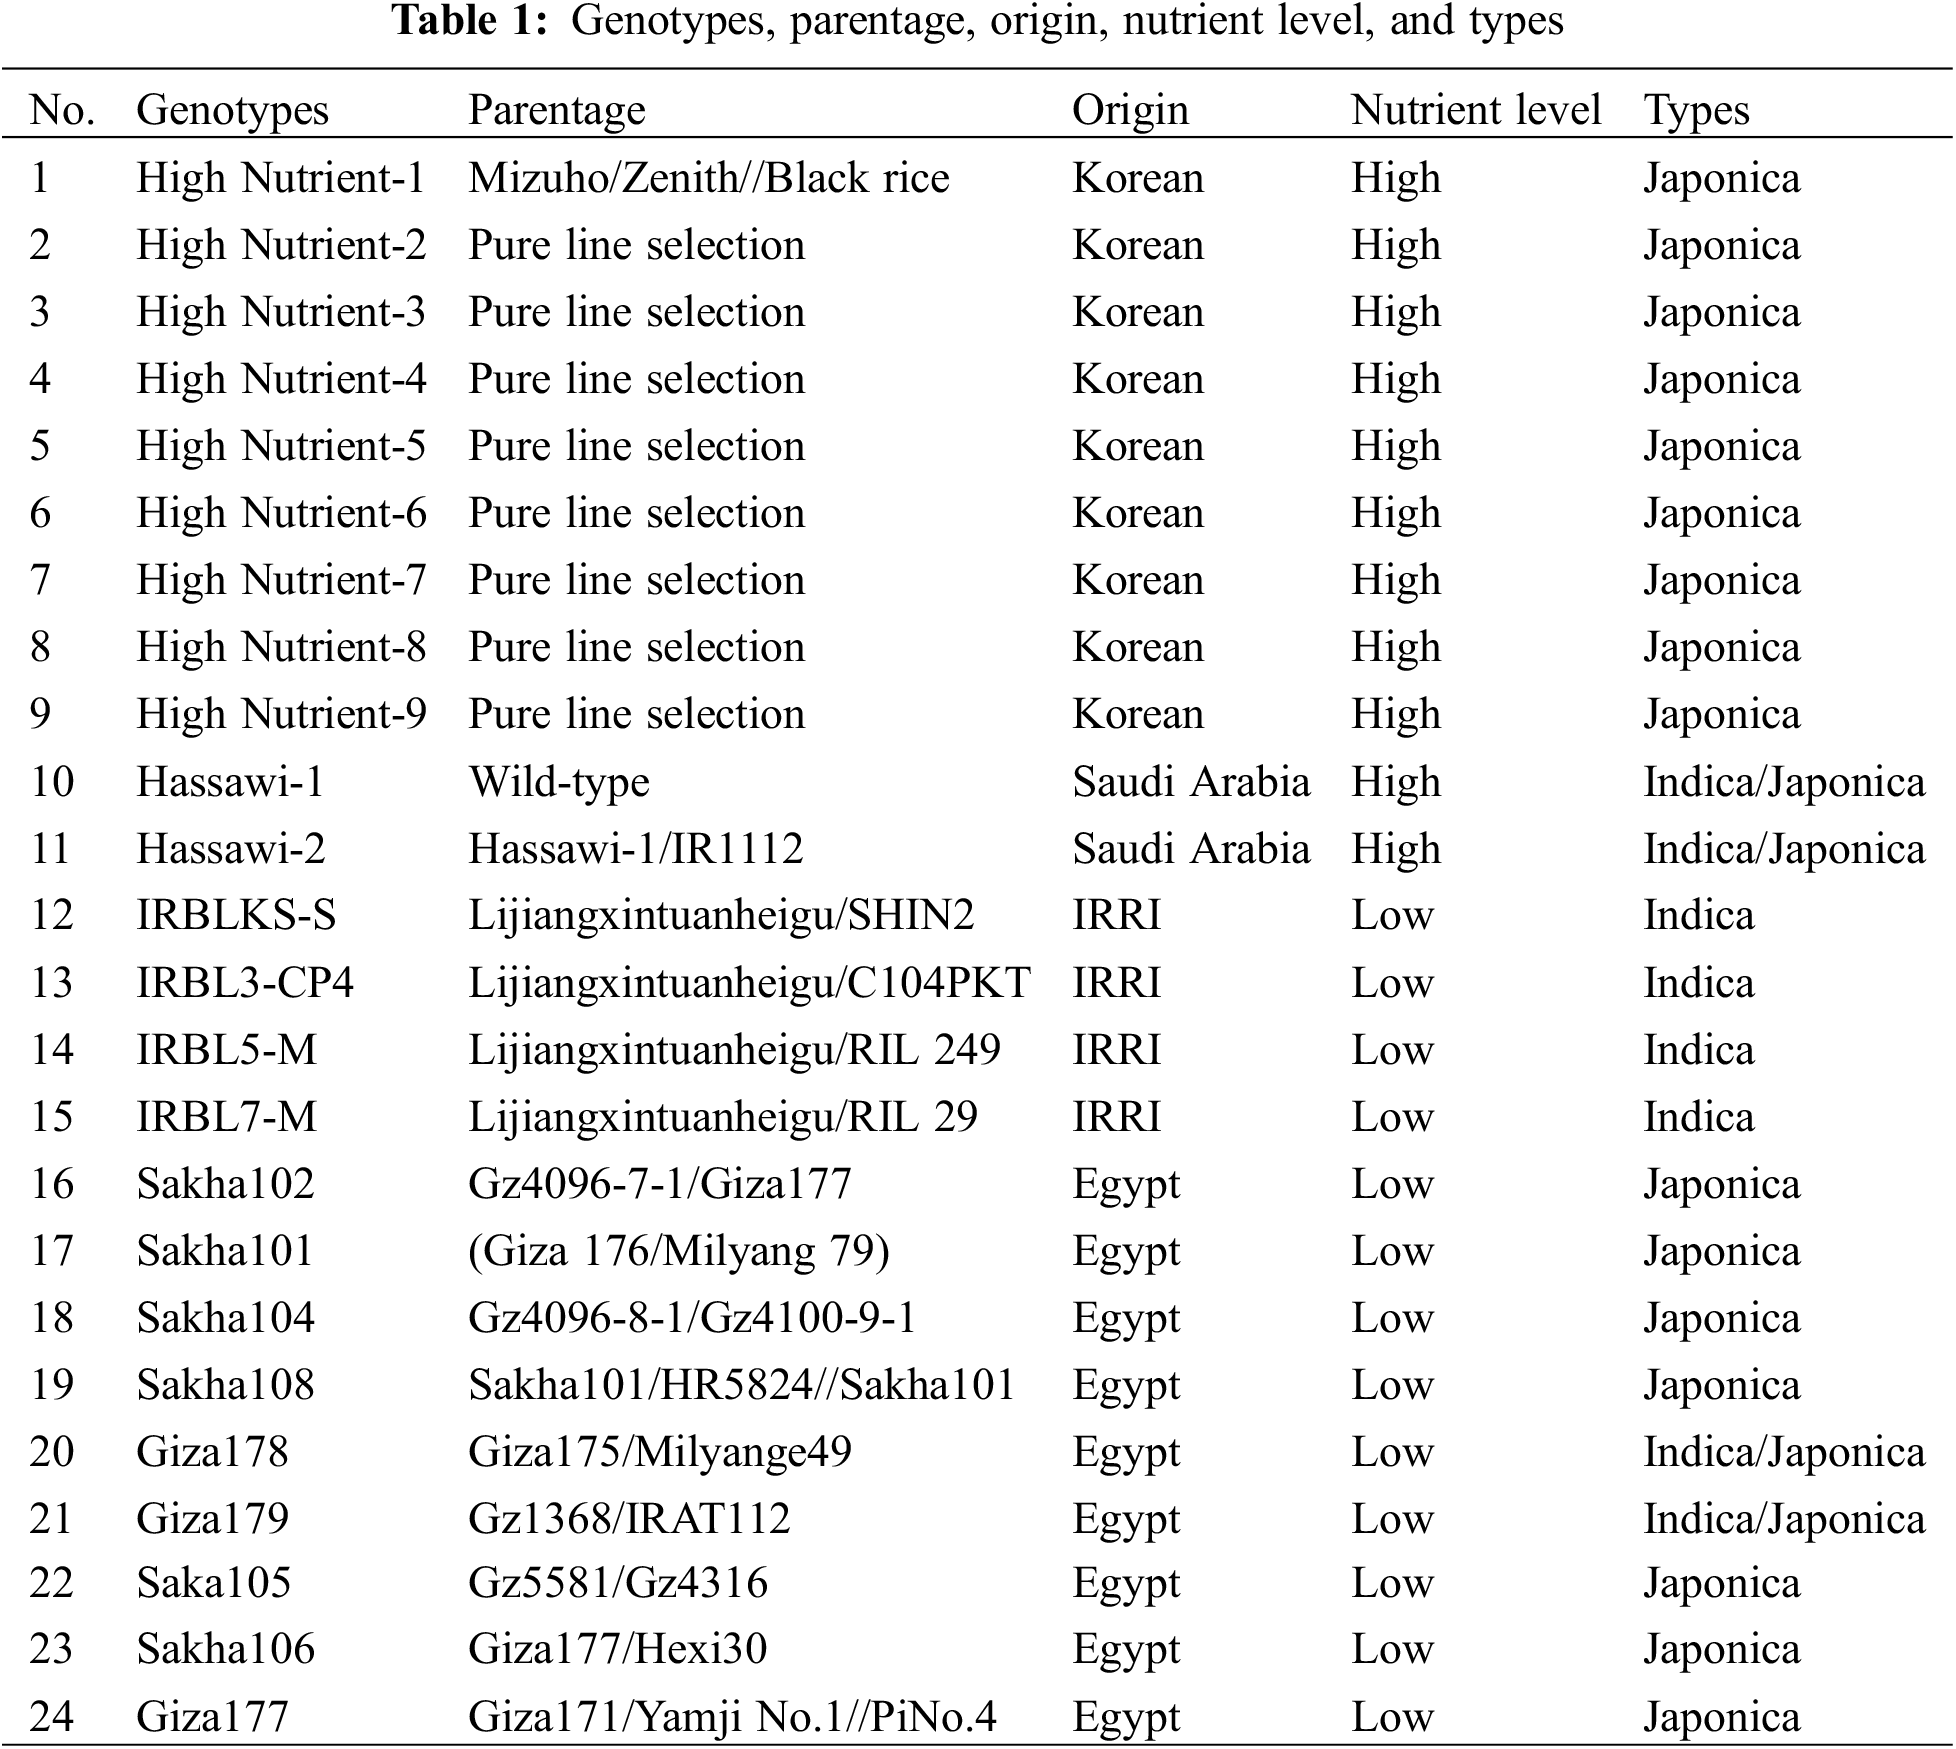
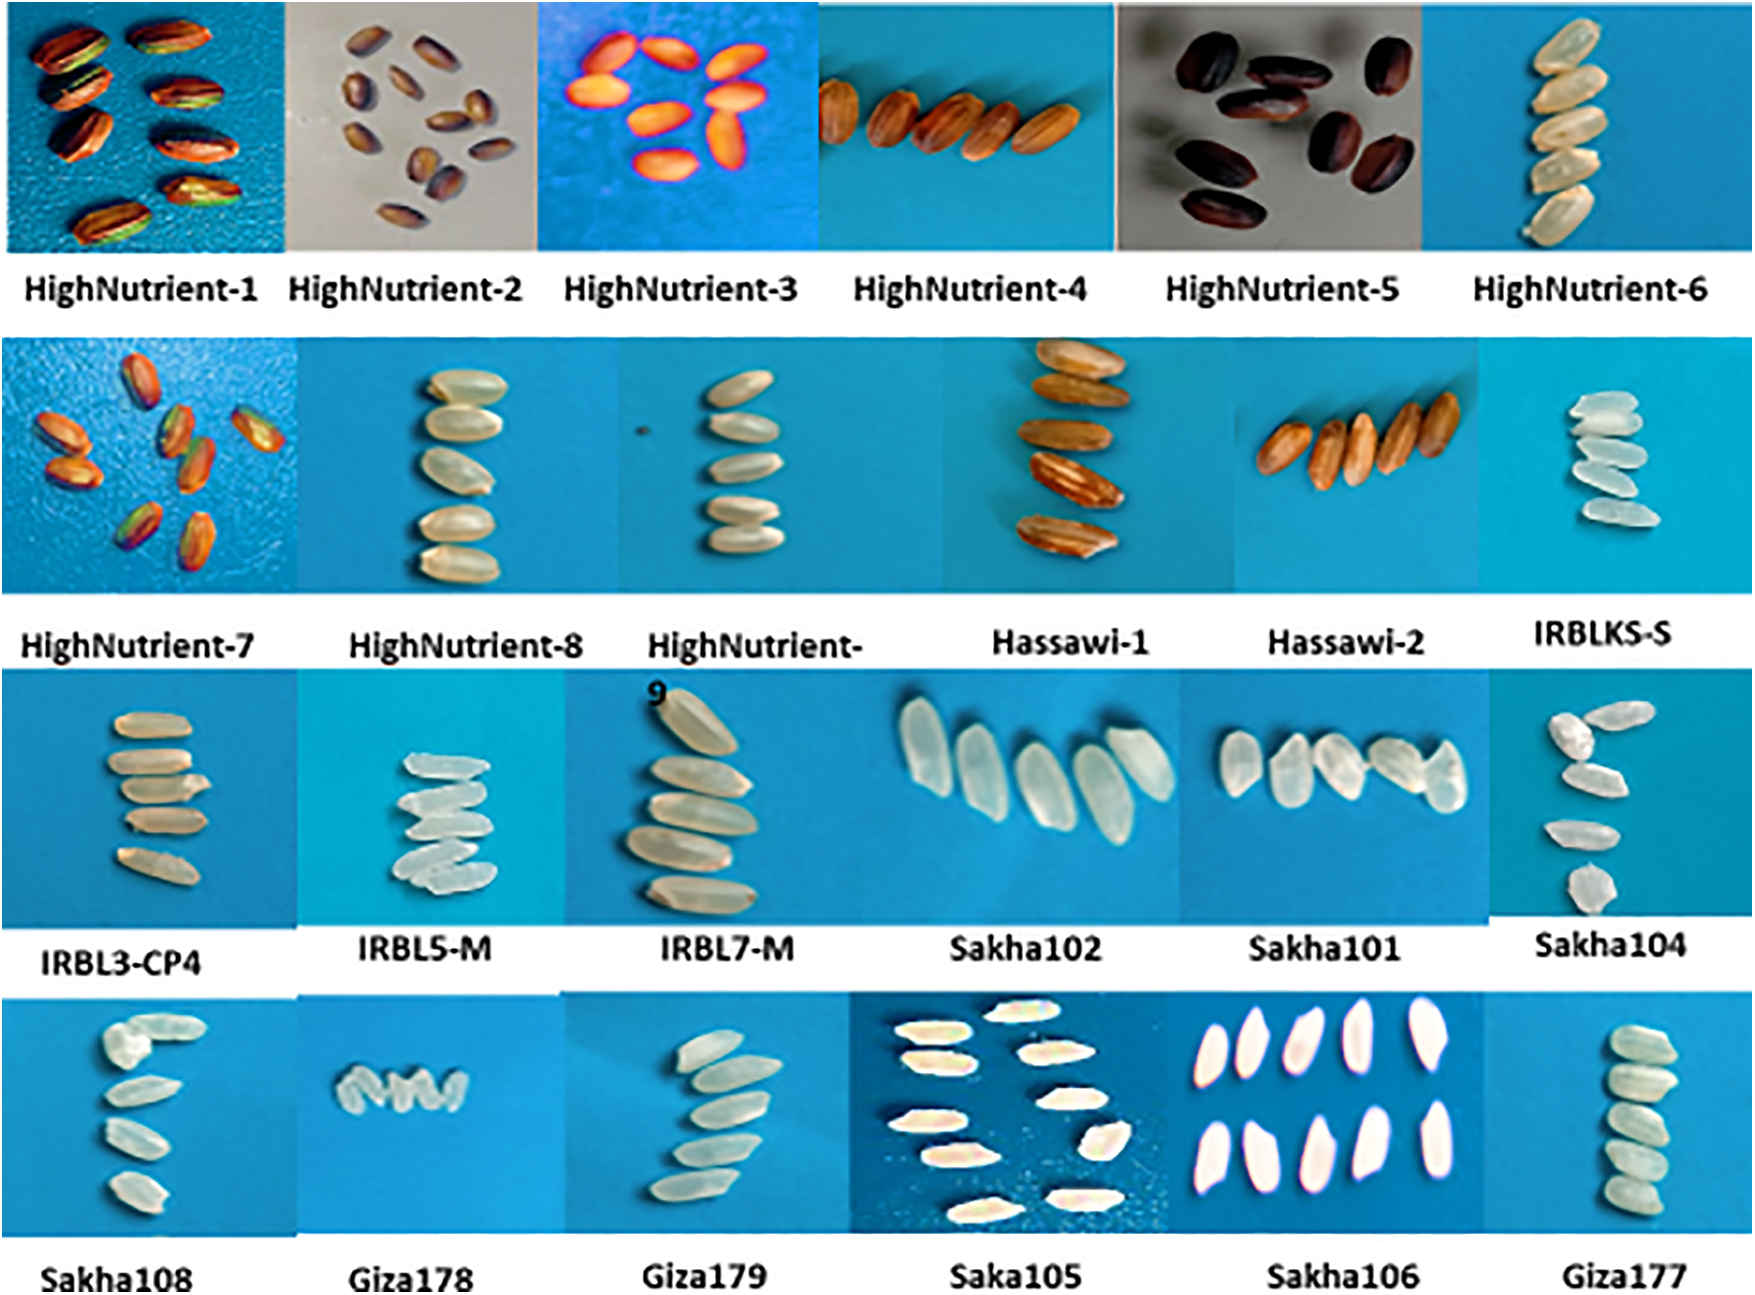
Figure 1: 24 rice genotypes including 16 Japonica, four Indica and four one Indica-Japonica
Seven grain quality traits were analyzed in all genotypes, and samples were collected after harvest and dried at 14% moisture. From each entry, 150 g well dried paddy was hulled in a mini “Satake Rice Machine” to get brown rice. The brown rice was passed through “Satake Rice whitening and caking machine” to obtain uniform polished grains. The polished samples were sieved to separate whole kernels from the broken ones. However, hulling percentage was computed on the amount of weight of hulling rice divided to weight of brown rice by 100, milling percentage was computed on the amount of weight milling rice divided to weight of brown rice by 100, while head rice percentage was computed for the amount of weight of whole grains divided to the weight of paddy samples by 100, as previously detailed by Adair [30]. In addition, the length grain was calculated according to a specific scale, which classified to extra-long (>7.50 mm), long (6.61–7.50 mm), medium (5.51–6.60 mm), and short (<5.50 mm), while, grain shape classified based on length-width ratio to slender (>3.00 mm), medium (2.01–3.00 mm), bold (1.01–2.00 mm) as suggested by Khush et al. [31], gelatinization temperature (G.T.), which was visually graded on a 7-point numerical scale devised by Little et al. [32] and split into classes as follows, represented processes such as alkali spreading and removal of starchy endosperm. (1) No effect on the kernel (very high); (2) Swollen kernel (high); (3) Swollen kernel, collar incomplete or narrow (high-intermediate); (4) Swollen kernel, collar complete and wide (intermediate); (5) Split or segmented kernel, collar complete and wide (intermediate); (6) Kernel scattered, blending with the collar (low); (7) Completely scattered and intermingled kernel (very low). While Juliano [33] and Little et al. [32] determined the elongation and amylose percentages and the varieties were classified according to amylose ratio to waxy (0%–5.0%), very low (5.1%–12%), low (12.1%–20%), intermediate (20.1%–25%) and high (>25.0%).
2.3 Estimation of Nutrients Concentrations
Milled grain samples of 24 different rice genotypes were dried at 60°C for 48 h. The samples were then ground to a fine powder [34]. One gram of milled rice was digested with hydrochloric acid 20% after dry washing for five hours at 450°C in a muffle oven. While calcium, iron, sodium, potassium and heavy metals in the samples were evaluated using flame atomic absorption spectrometry, the P concentration was confirmed using a colorimetric procedure known as the ascorbic acid method [35] and a UV+80 visible spectrophotometers.
For every season, analysis of variance was performed on assumption that cultivars being studied are random. Two experiments were statistically combined over two seasons because experiment’s error variances were statistically homogeneous, as stated by Le Clerg et al. [36]. After that, experiments were subjected to analysis of variance, which was utilized to separate gross phenotypic variability into components attributed to genetic (hereditary) and non-genetic (environmental) factors and estimate their relative magnitudes. Comparably, the overall diversity among phenotypes when produced in variety of relevant conditions is known as phenotypic variance [37]. Thus, formula of Wricke et al. [38], Prasad et al. [39], was used to estimate variance components, genotypic (Vg), phenotypic (Vp), or error (Ve) variances. According to Allard [40], broad-sense heritability (h2B) was calculated on genotypic mean basis. Dissimilarity coefficients were calculated according to Sneath et al. [41]. The programme NTSYS-PC version 2.1 was used to create similarity matrices [42].
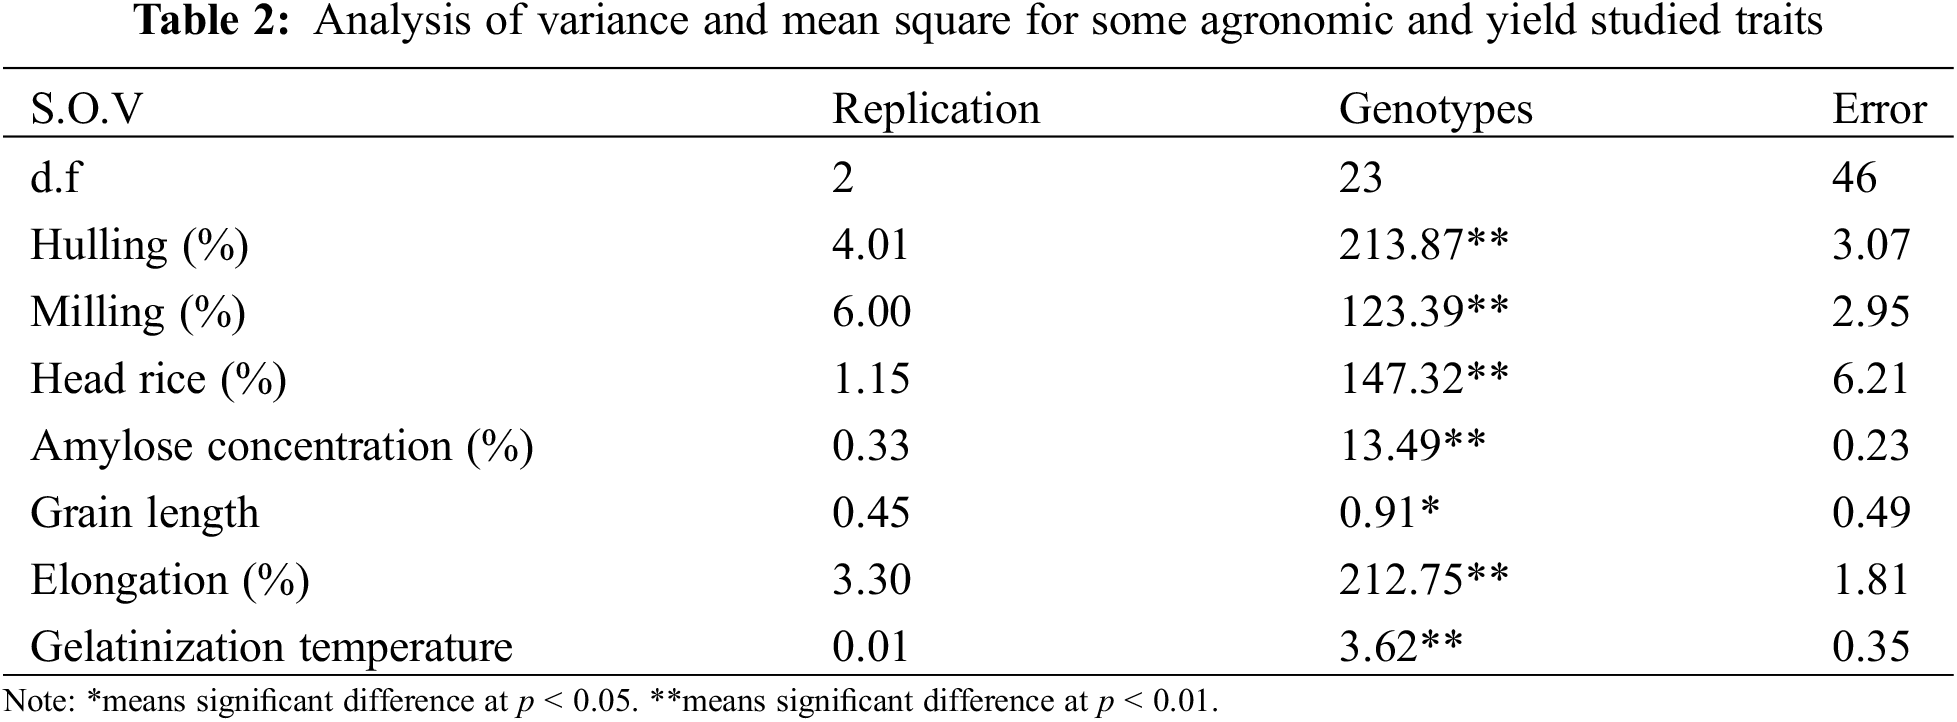
Considering genotypes under study’s wild range, the ANOVA showed that there are extremely significant differences among 24 rice genotypes (Table 2). Certain characteristics were very important, including the percentages of hulling, milling, head rice, elongation, amylose concentration (AC), and gelatinization temperature. There was a broad range of genetic variation among the 24 rice genotypes employed in this study, nevertheless, as seen by the results’ highly significant variances among genotypes. Zaghum et al. [1] as well as Roy et al. [43] reported on this as well.
3.2 Mean Performance of Grain Quality Traits
Genotypes were significantly varied for grain quality traits under study (Table 3). The results for hulling traits ranged from 57.7 with Hassawi-2 to 88.2 with Sakha104. Anyhow, the Egyptian varieties gave the highest value for hulling percentage, while the two Saudi Arabian varieties (Hassawi-2 and Hassawi-1) had the lowest value. For milling percent, the highest value was found with the Giza177 variety (72.39%), while the lowest one was 50.4% with Hassawi-2. Also, the same result was found for head rice percentage, but the lowest one was found with High Nutrient-5 (44.1%).
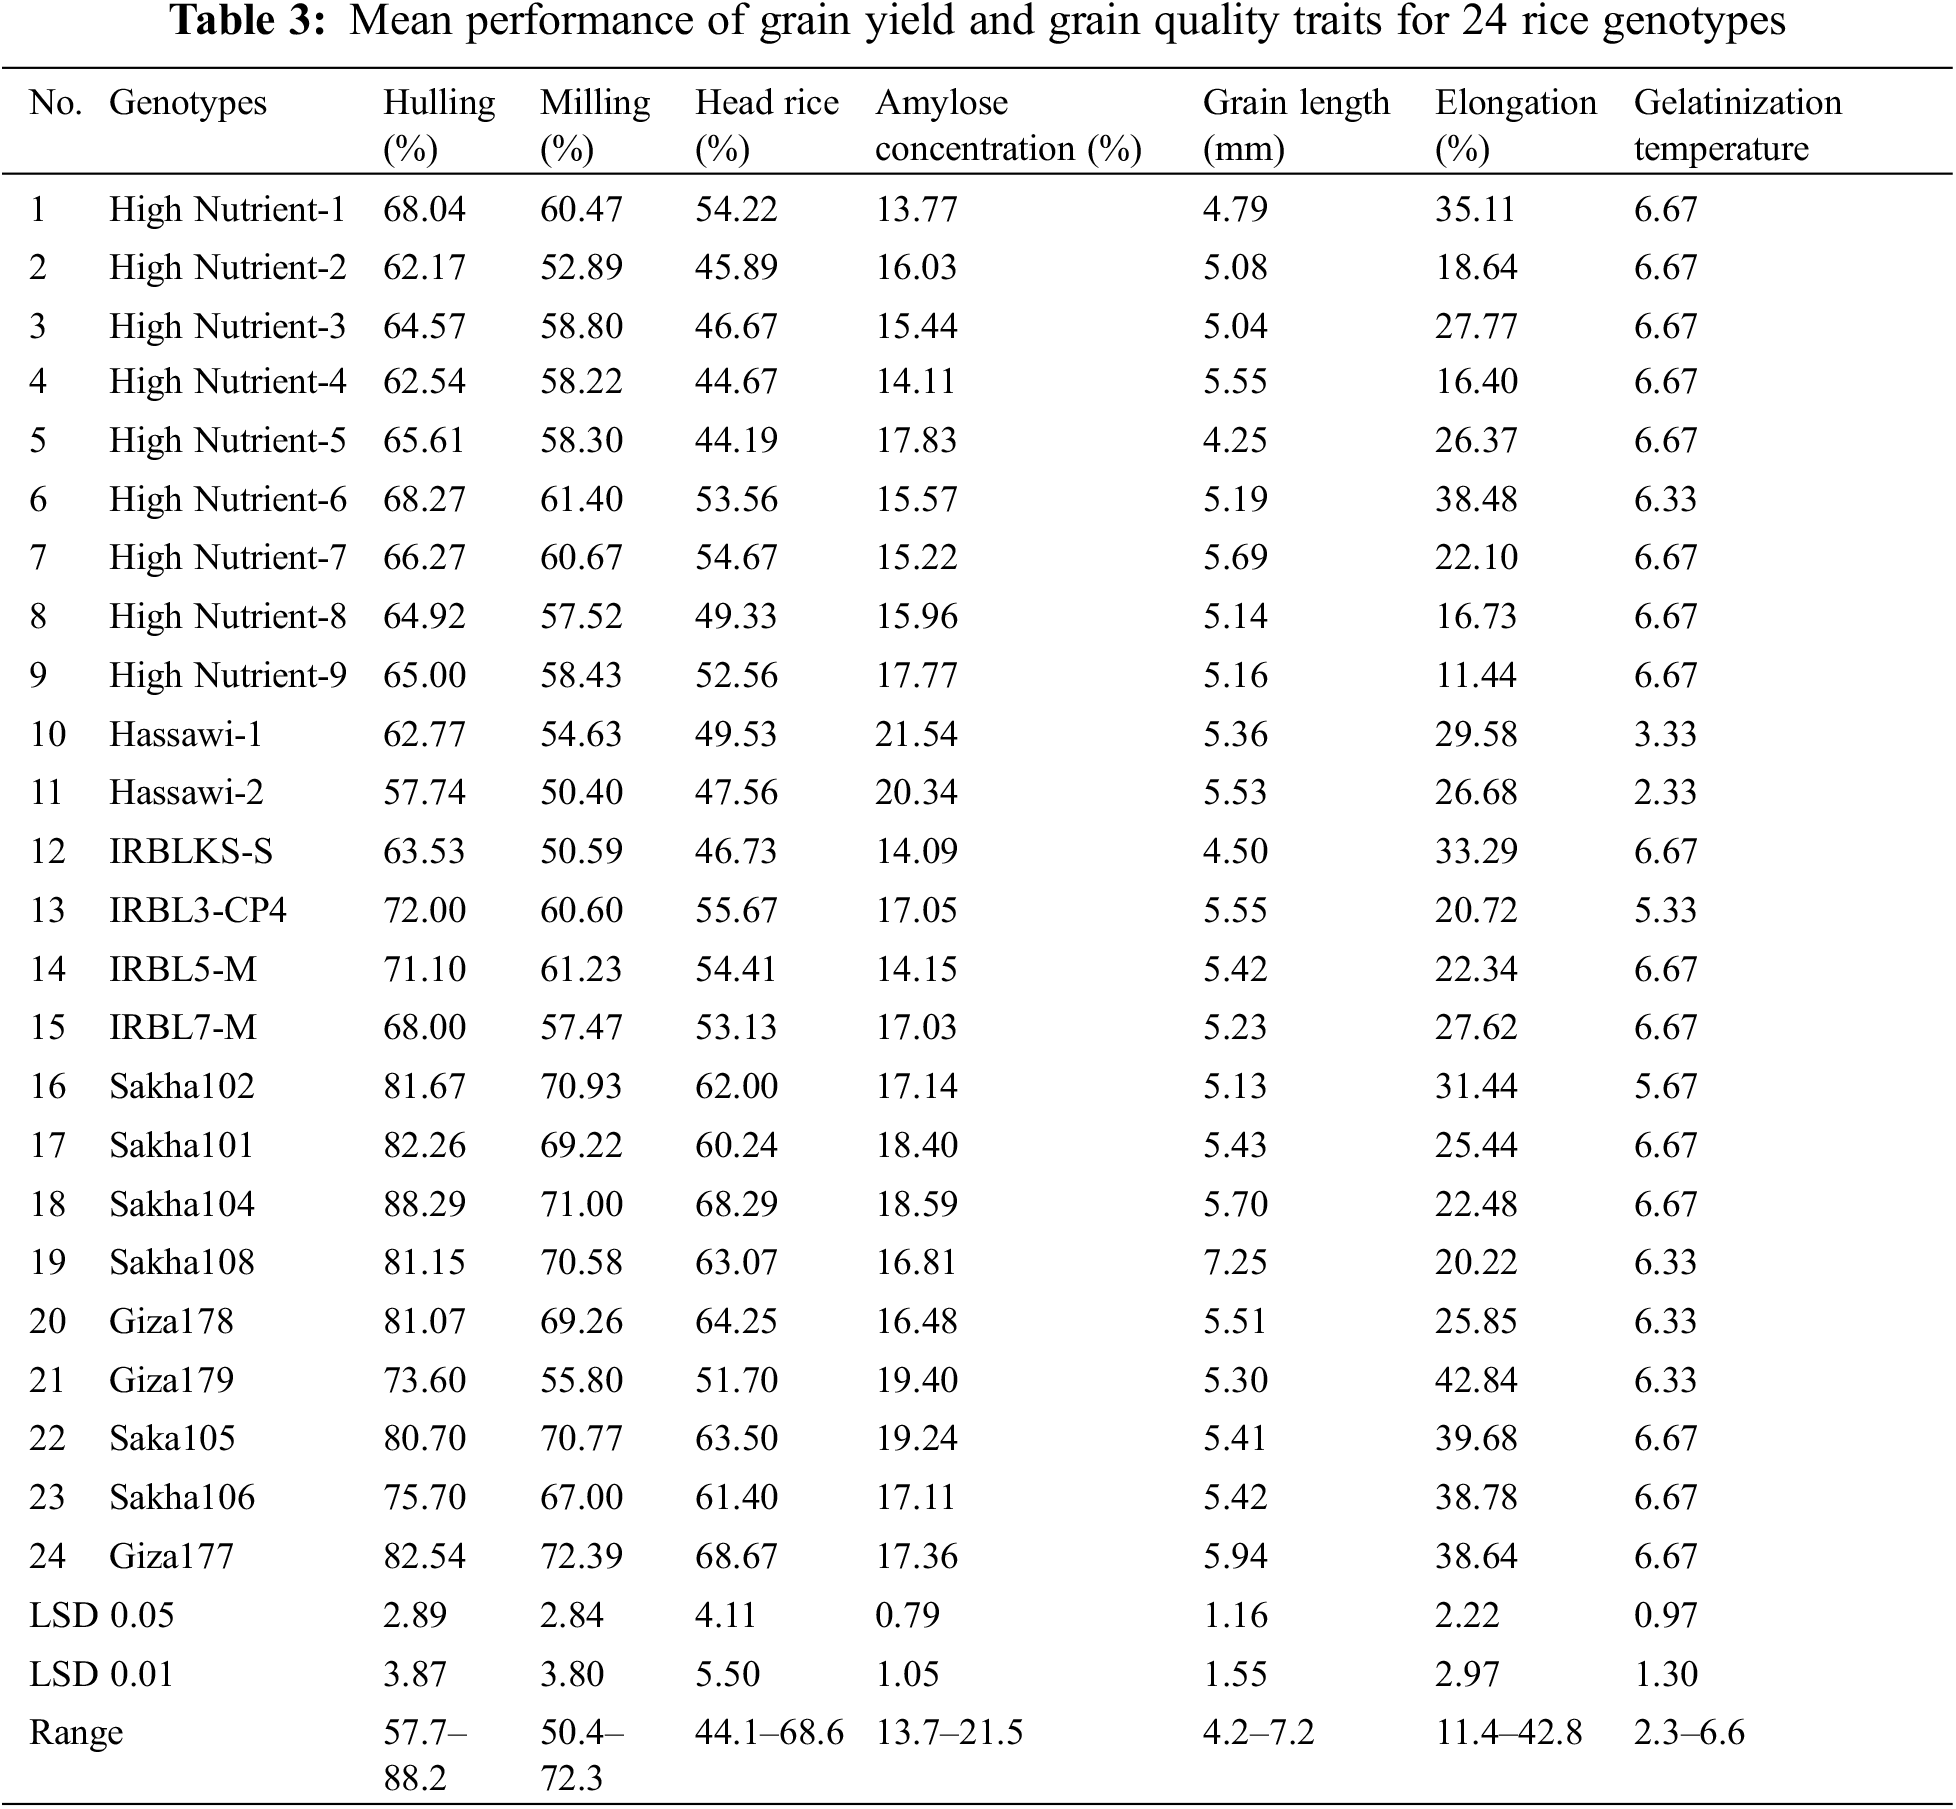
Concerning the amylose percentage, the results ranged from 13.77 to 21.54, and according to Juliano [33], amylose was classified into very low (7–10), low (11–20), intermediates (21–23), or high (24–26). These classifications reflected that all the genotypes belonged to low amylose except the Hassawi-1 variety, which had intermediate amylose concentration (Table 3). Similar results with those of Fatma et al. [44], Lu et al. [4] highlighted that a rice variety’s amylose concentration affects all of its cooking and eating qualities. The variety Giza179 had the highest elongation trait value (42.8), while the High Nutrient-9 variety had the lowest value (11.4) for elongation percentage. According to the gelatinization temperature trait, the results ranged from 2.3 to 6.6; however, the Hassawi-1 and Hassawi-2 varieties gave the lowest values of gelatinization temperature (GT), and the rest of the of the genotypes gave the highest values. In any case, Fig. 1 shows a difference in the colors of the milled grains, as colors different from the natural white color are associated with an increase in the concentration of nutrients.
3.3 Phenotypic and Genotypic Variability
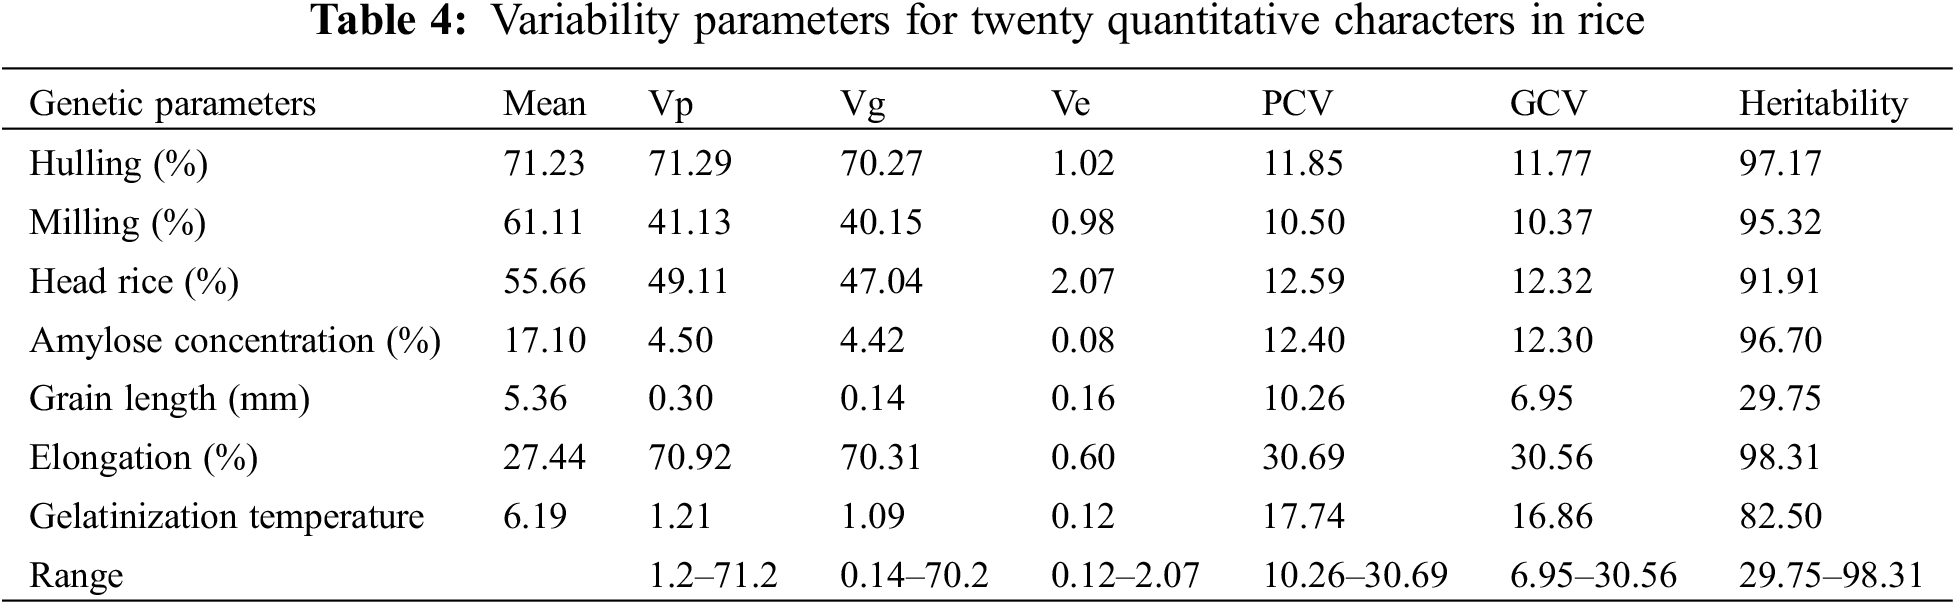
Table 4 displays estimates of phenotypic and genotypic variances as well as genotypic and phenotypic coefficients of variation (GCV and PCV, respectively). Table 4 shows genotypic coefficients of variation (GCV) for grain length (mm) and elongation percentage, which varied from 6.95 to 30.56. However, the phenotypic coefficients of variation (PCV) varied from 10.26% for the grain length to 30.69% for the percentage of elongation (Table 4). The PCV percent was primarily influenced by environmental factors and cultural traditions, as evidenced by the fact that it was greater than the genotypic PCV percent for all attributes across all genotypes. Table 4 shows the GCV percent values for head rice, hulling %, milling percentage, elongation percentage, grain length, and gelatinization temperature. The seven quantitative features have heritability estimates ranging from 29.75% for grain length to 98.31% for elongation percentage, when viewed in a wide sense.
3.4 Correlation Analysis among the Studied Traits
Trait relationship was ascertained by phenotypic correlation analysis, and the outcome is displayed in Fig. 2. The proportion of head rice (0.928) and milling (0.924) showed a highly significant positive association with the hulling (%), while the milling percentage also demonstrated a highly positive correlation (0.912) with the head rice percentage. On the other hand, gelatinization trait was significantly positive with head rice, milling, and hulling percentages. The amylose concentration had negative correlation with gelatinization trait (−0.601).
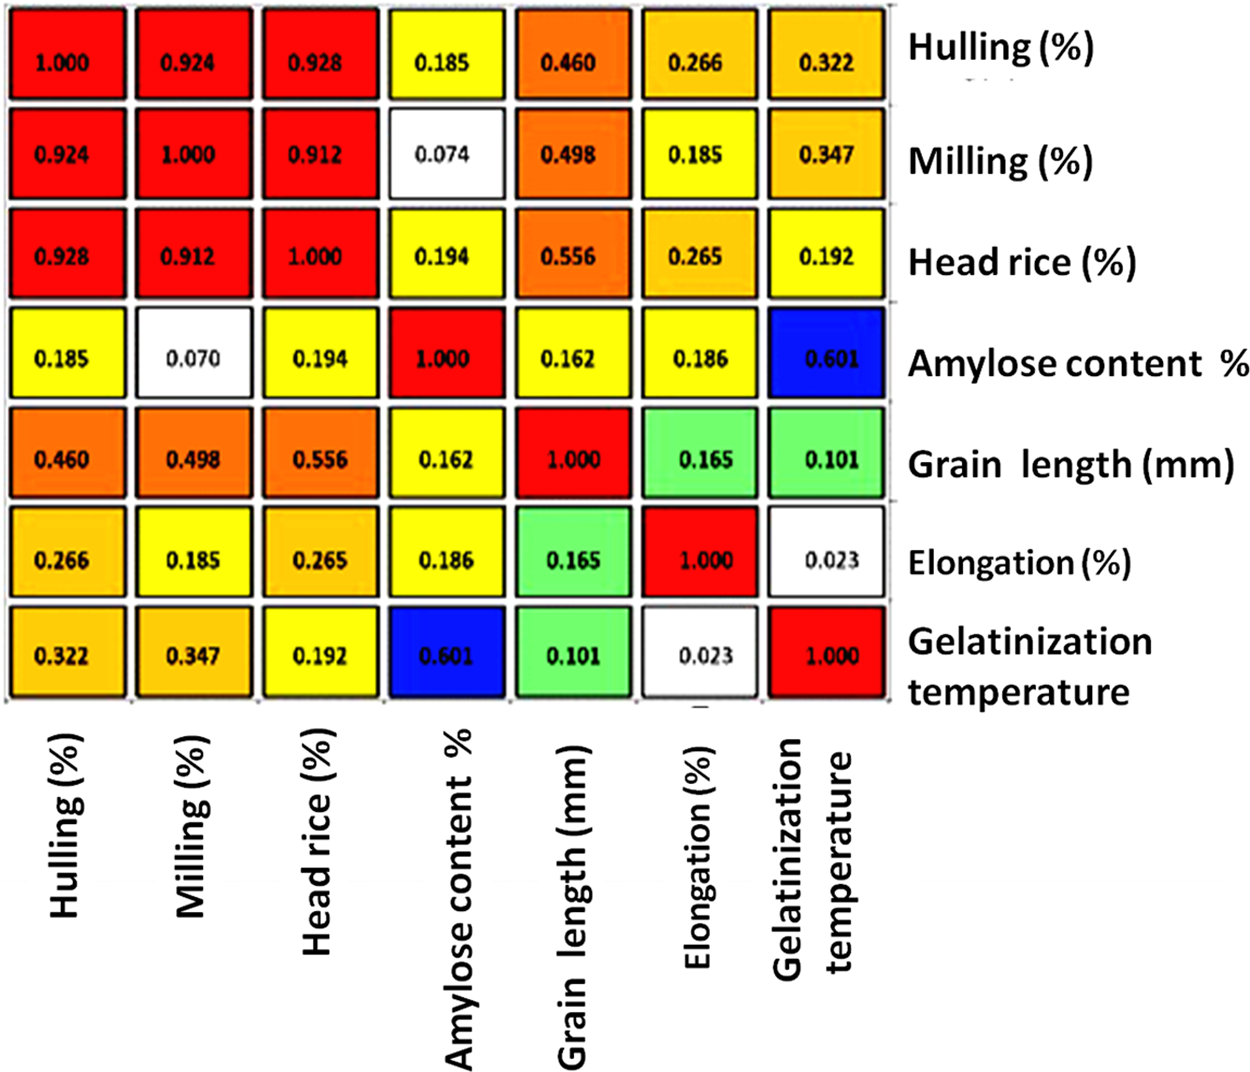
Figure 2: Pearson correlation coefficients for seven grain quality traits of 24 rice genotypes. The color assigned to a point in the heat map grid indicates the intensity of a particular link between two traits. Red indicates a positive association, whereas blue indicates a negative correlation
3.5 Estimation of Micronutrient and Protein Percentage
The concentrations of magnesium (Mg), sodium (Na), potassium (K), calcium (Ca), copper (Cu), manganese (Mn), zinc (Zn), iron (Fe), or protein in milled rice of 24 rice genotypes were listed in Figs. 3–5. The results also noted that concentrations of Mg, Na, K, Ca, Cu, Mn, Zn, Fe, or protein percentage showed different variations under all the nutritional elements. The means of Mg, Na, K, and Ca concentrations for all genotypes were 1250, 275, 2625, and 757.5 ppm, and the ranges were 1250–2125, 207.5–367.5, 2600–4500, and 510.0–932.5 ppm, respectively (Fig. 3). Among the 24 genotypes, ten rice genotypes: HighNutrient-1 (2125 ppm), ighNutrient-2 (2050 ppm), HighNutrient-9 (1925 ppm), HighNutrient-8 (1900 ppm), HighNutrient-3 (1875 ppm), Hassawi-2 (1875 ppm), HighNutrient-7 (1775 ppm), HighNutrient-6 (1775 ppm), Hassawi-1 (1750 ppm), and HighNutrient-4 (1750 ppm) gave the heist value for Mg concentrations (Fig. 3). Whereas, the Na concentrations of 24 genotypes ranged from 207.5 to 367.5, and the highest value was found with the HighNutrient-8 variety (367.5 ppm), while the lowest one was found with Giza179 (207.5 ppm). According to K concentrations, 21 rice genotypes gave a high value and ranged from 2600 to 4500 ppm. However, a high value was found with HighNutrient-1, HighNutrient-3, and HighNutrient-2 (Fig. 3).
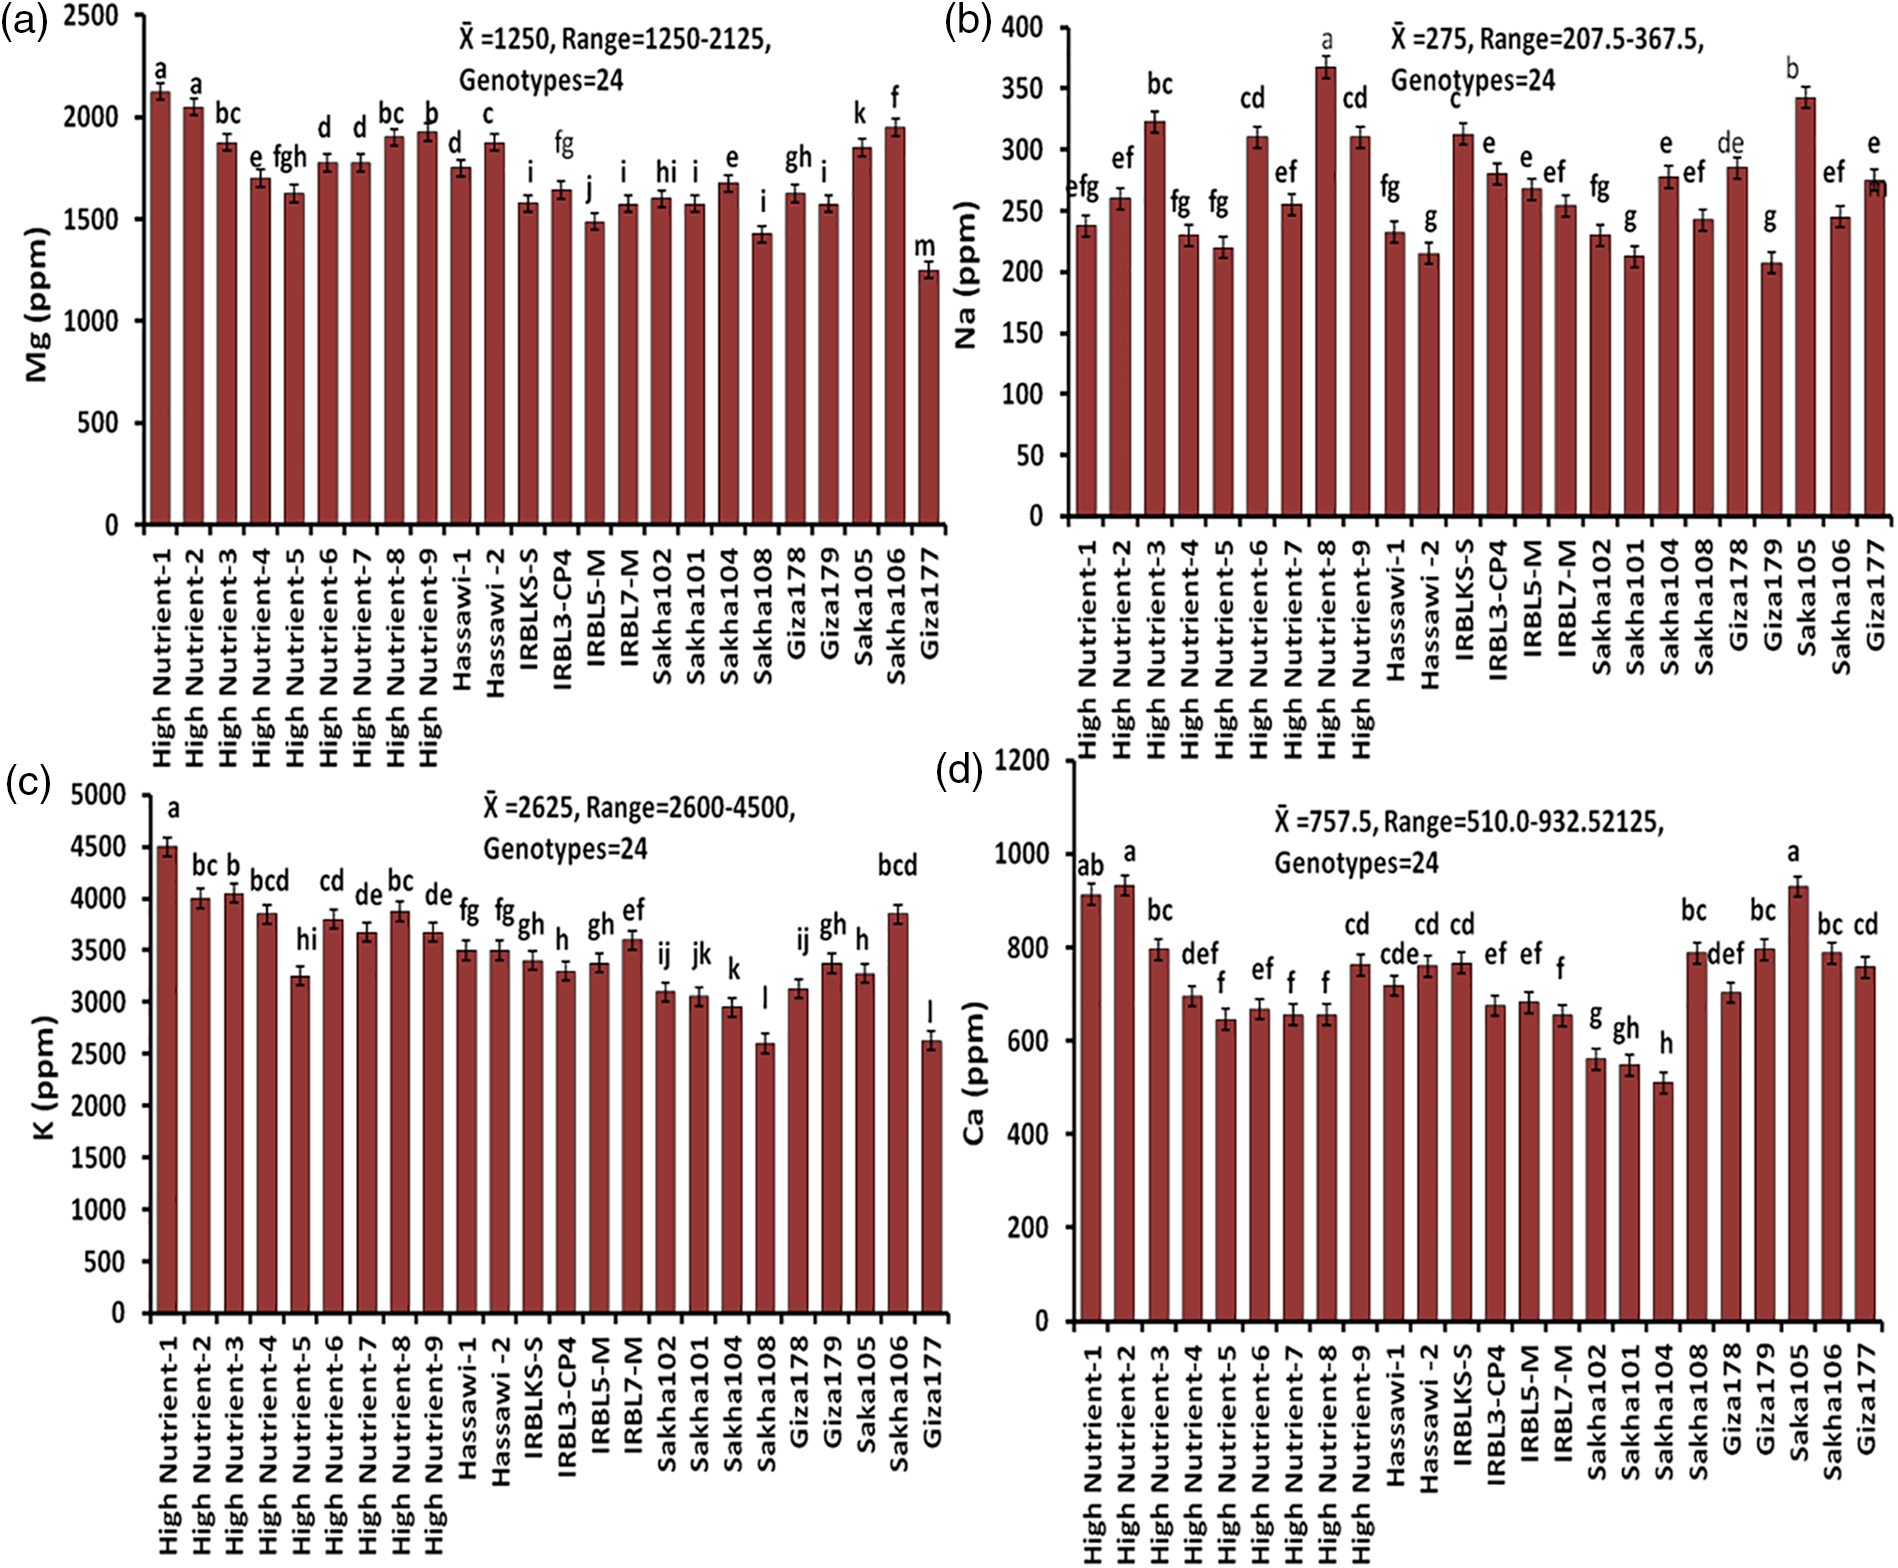
Figure 3: The concentrations of Mg (a), Na (b), K (c), and Ca (d) in milled rice among 24 rice genotypes. Data are represented as means of three replicates (±SD). Different letters within each bar indicate significant differences according to Duncan’s Multiple Range test at p < 0.05
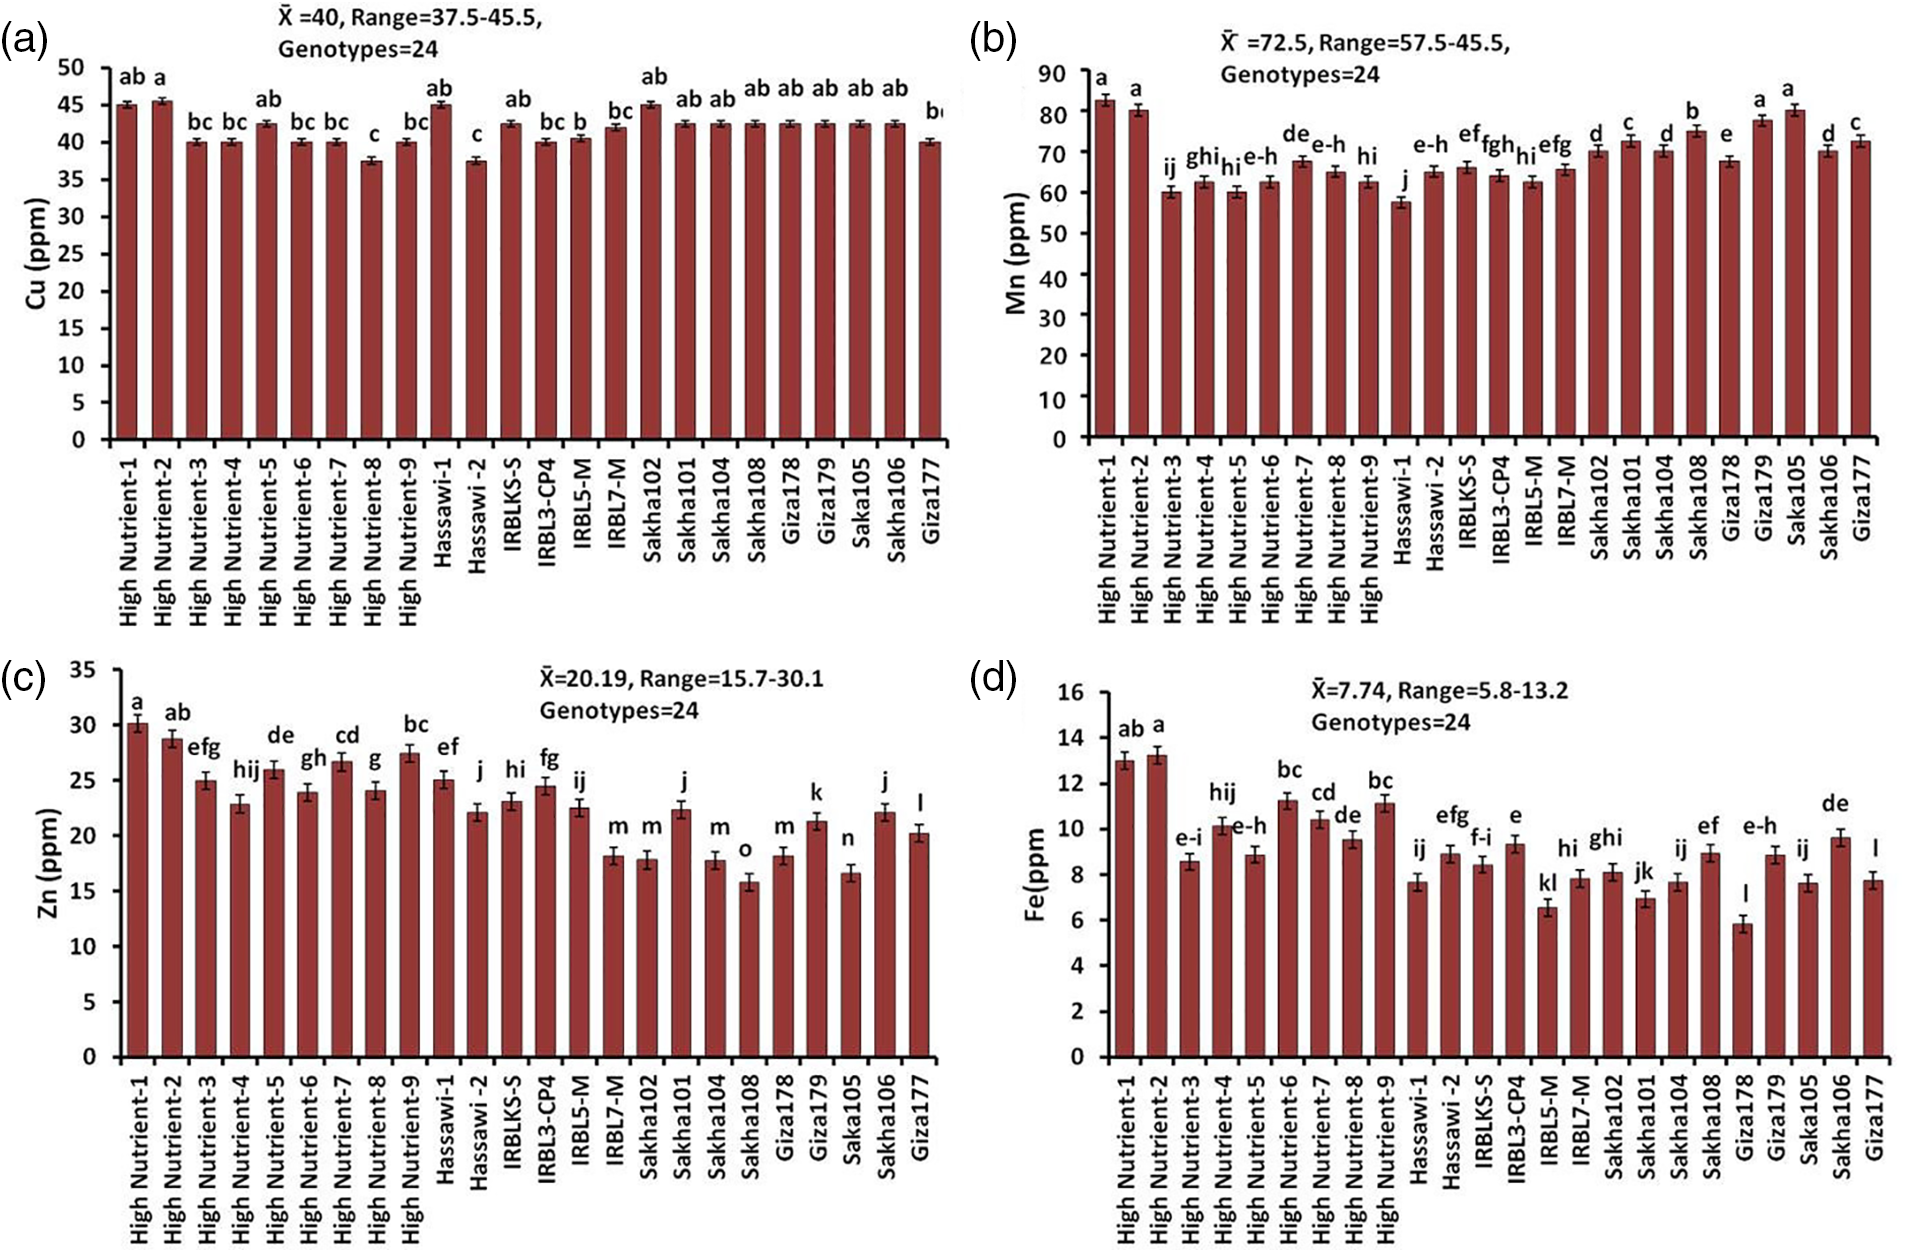
Figure 4: The concentrations of Cu (a), Mn (b), Zn (c), and Fe (d) in milled rice among 24 rice genotypes. Data are represented as means of three replicates (±SD). Different letters within each bar indicate significant differences according to Duncan’s multiple range test at p < 0.05
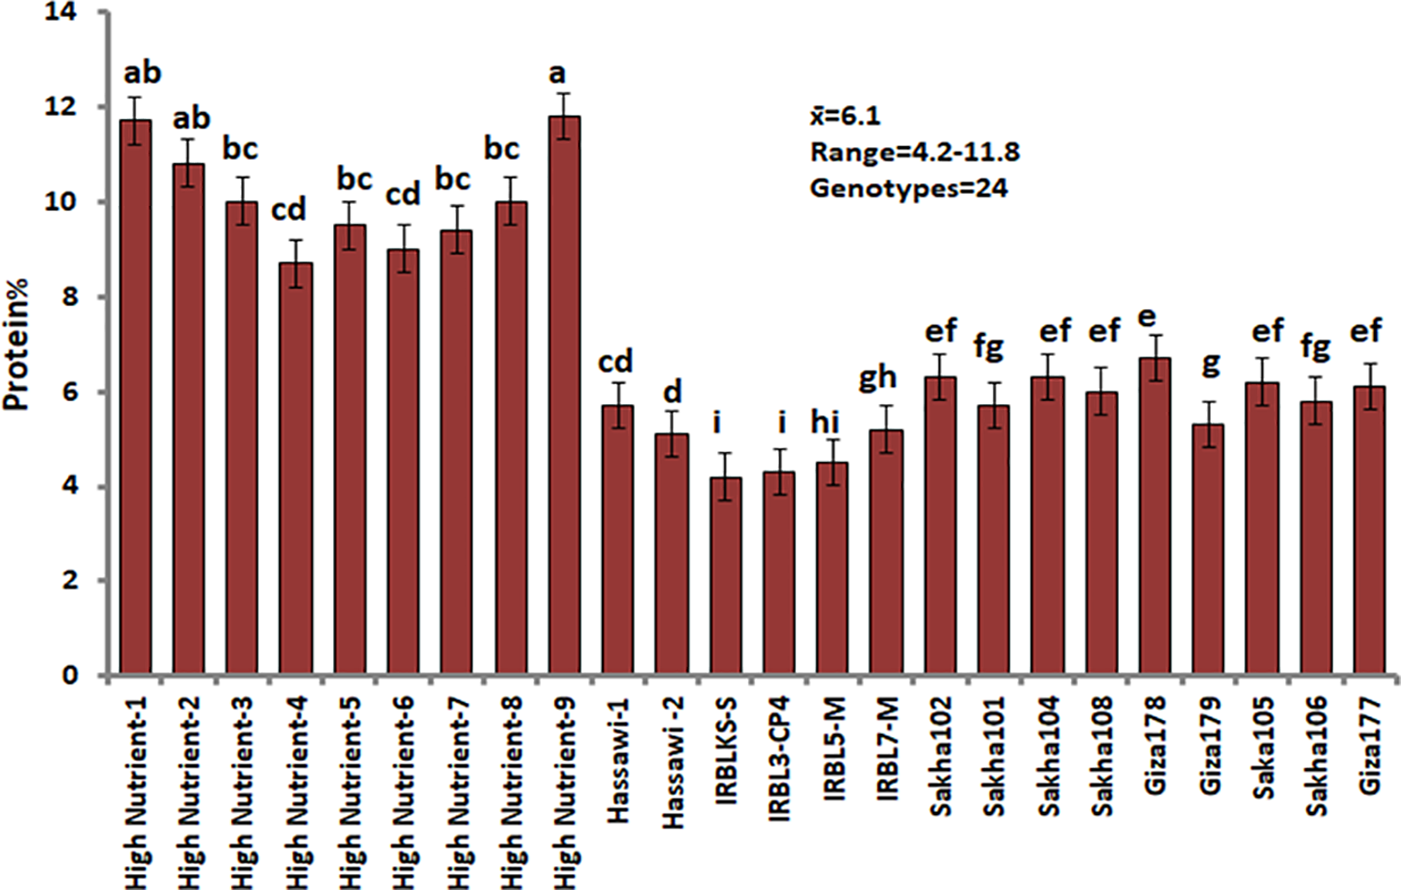
Figure 5: Protein concentrations in milled rice among 24 rice genotypes. Data are represented as means of three replicates (±SD). Different letters within each bar indicate significant differences according to Duncan’s multiple range test at p < 0.05
In Ca concentrations, the 24 rice genotypes ranged from 510 to 932.5 ppm, and the lowest value was found with the Sakha104 (510 ppm) variety, while the highest value was found with the HighNutrient-2 (932.5 ppm) variety, which indicated that the genotypes with higher Ca concentrations comprised the majority of the 24 rice genotypes under study (Fig. 3). On the other hand, for the elements Cu, Mn, Zn, and Fe, which belonged to microelements in milled rice, the means were 40, 72.5, 20.19, and 7.74 ppm, respectively (Fig. 4). As for the Cu element, most of the values were narrow, and the highest value was 45.5 ppm with the variety HighNutrient-2, while the lowest value was 27.5 ppm with HighNutrient-8. Furthermore, the 24 genotypes for Mn, Zn, and Fe concentrations are in a narrow range of 57.5–82.5, 15.7–30.1, and 5.8–13.2 ppm, respectively. But in any case, the results for the Mn element showed that ten rice genotypes had a high concentration of Mn, and the rest of the genotypes showed moderate concentration. While the Zn concentrations of 24 rice genotypes range from 15.7 to 30.1 ppm, the highest value was HighNutrient-1 (30.1 ppm), and the lowest value (15.7 ppm) was the Sakha108 variety (Fig. 4). As a result, it was possible to choose materials with abundant mineral nutrients because there was a discernible variation in the mineral element concentrations of the genotypes examined in this experiment. According to the Fe concentrations in Fig. 4, six rice genotypes were high in Fe, while the rest had a moderate value. However, there are five rice genotypes: HighNutrient-2 (13.246), HighNutrient-1 (12.978), HighNutrient-6 (11.122), HighNutrient-7 (10.410), and HighNutrient-4 (10.120 ppm).
3.6 Estimation of Protein Percentage
For protein concentration percentage, the result showed that the mean for 24 genotypes was 6.1 percentages, which ranged from 4.2 to 11.8. The results showed that 11 rice genotypes, HighNutrient-9, HighNutrient-1, HighNutrient-2, HighNutrient-3, HighNutrient-8, HighNutrient-5, HighNutrient-7, HighNutrient-6, HighNutrient-4, Hassawi-1, and Hassawi-2, gave 11.8, 11.7, 10.8, 10.0, 10.0, 9.5, 9.4, 9.0, 8.7, 8.7, and 8.1 percent, respectively (Fig. 5), while the rest genotypes gave low protein concentrations (Fig. 5). Therefore, varieties high in protein concentration can be utilized in breeding programs in order to develop varieties with high protein concentration, which is extremely important as a basic food for humans.
3.7 Correlation Analysis for Mineral Nutrient Study
Phenotypic correlation analysis for nine nutrient elements of Mg, Na, K, Ca, Cu, Mn, Zn, Fe, or protein percentage in milled rice of 24 rice genotypes (Fig. 6), The results showed that magnesium (Mg ppm) was highly significant and positively correlated with both potassium (K ppm) or protein, while it was positively and significantly correlated with zinc (Zn) and iron (Fe). Sodium (Na) was negatively correlated with copper (Cu), while potassium (K) had positive correlation with zinc (Zn), iron (Fe), and protein percentage. On the other hand, calcium (Ca) had positive correlation with manganese (Mn) and iron (Fe), while copper (Cu) had positive correlation with manganese (Mn). Zinc (Zn) element was correlated with iron (Fe) and protein percentage, and iron (Fe) was correlated with protein percentage (Fig. 6).
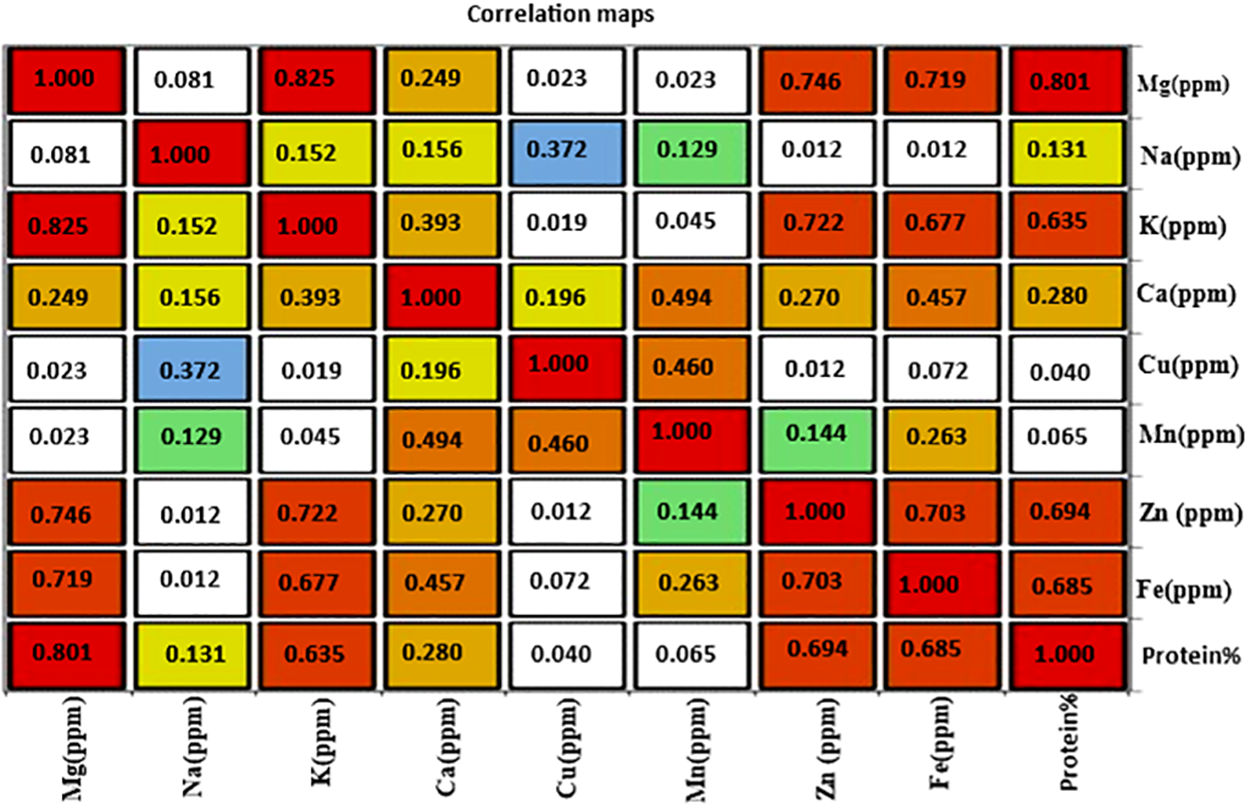
Figure 6: Pearson correlation correlations for 24 rice genotypes’ nine nutritional element attributes. The color a point in the heat map grid is assigned indicates the strength of a particular link between two qualities. Red indicates a positive association, whereas blue indicates a negative correlation
The clustering pattern of 24 rice genotypes was visualized by dendrogram analysis (Fig. 7). The compelling results based upon grain quality traits and nutritional elements were divided into two major groups. The genotype HighNutrient-1 was in one group alone due to its highest values in protein, magnesium (Mg), zinc (Zn), manganese (Mn), and potassium concentration. It was also the lowest in amylose concentration (13.77%) compared to all the varieties under study. Two subgroups were created from the second group: the first contained the genotypes of Hassawi-1 and Hassawi-2, while the second subgroup contained the genotypes (Fig. 7). Anyway, the genotypes Hassawi-1 and Hassawi-2 had the same values in Mg, Na, K, and protein concentration, as well as in amylose concentration, grain length, elongation percentage, or gelatinization temperature (Fig. 7). Also, these genotypes were produced by the same parents, cultivated in the same area, and belonged to Indica-Japonic type. Second subgroup was divided into two groups: IRBL3-CP4, IRBL5-M, IRBL7-M, IRBLKS-S, Giza178, and Giza179, which belonged to the Indica and Indica-Japonica types. These genotypes had low nutrient values and protein concentration. The last second subgroup included all the other genotypes, which were reached by nutritional elements and protein concentration except Sakha104 and Sakha106. Also, the results showed that these varieties were low in characteristics in hulling, milling, head rice, and amylose concentration percentages, except Sakha104 and Sakha106 (Fig. 7).
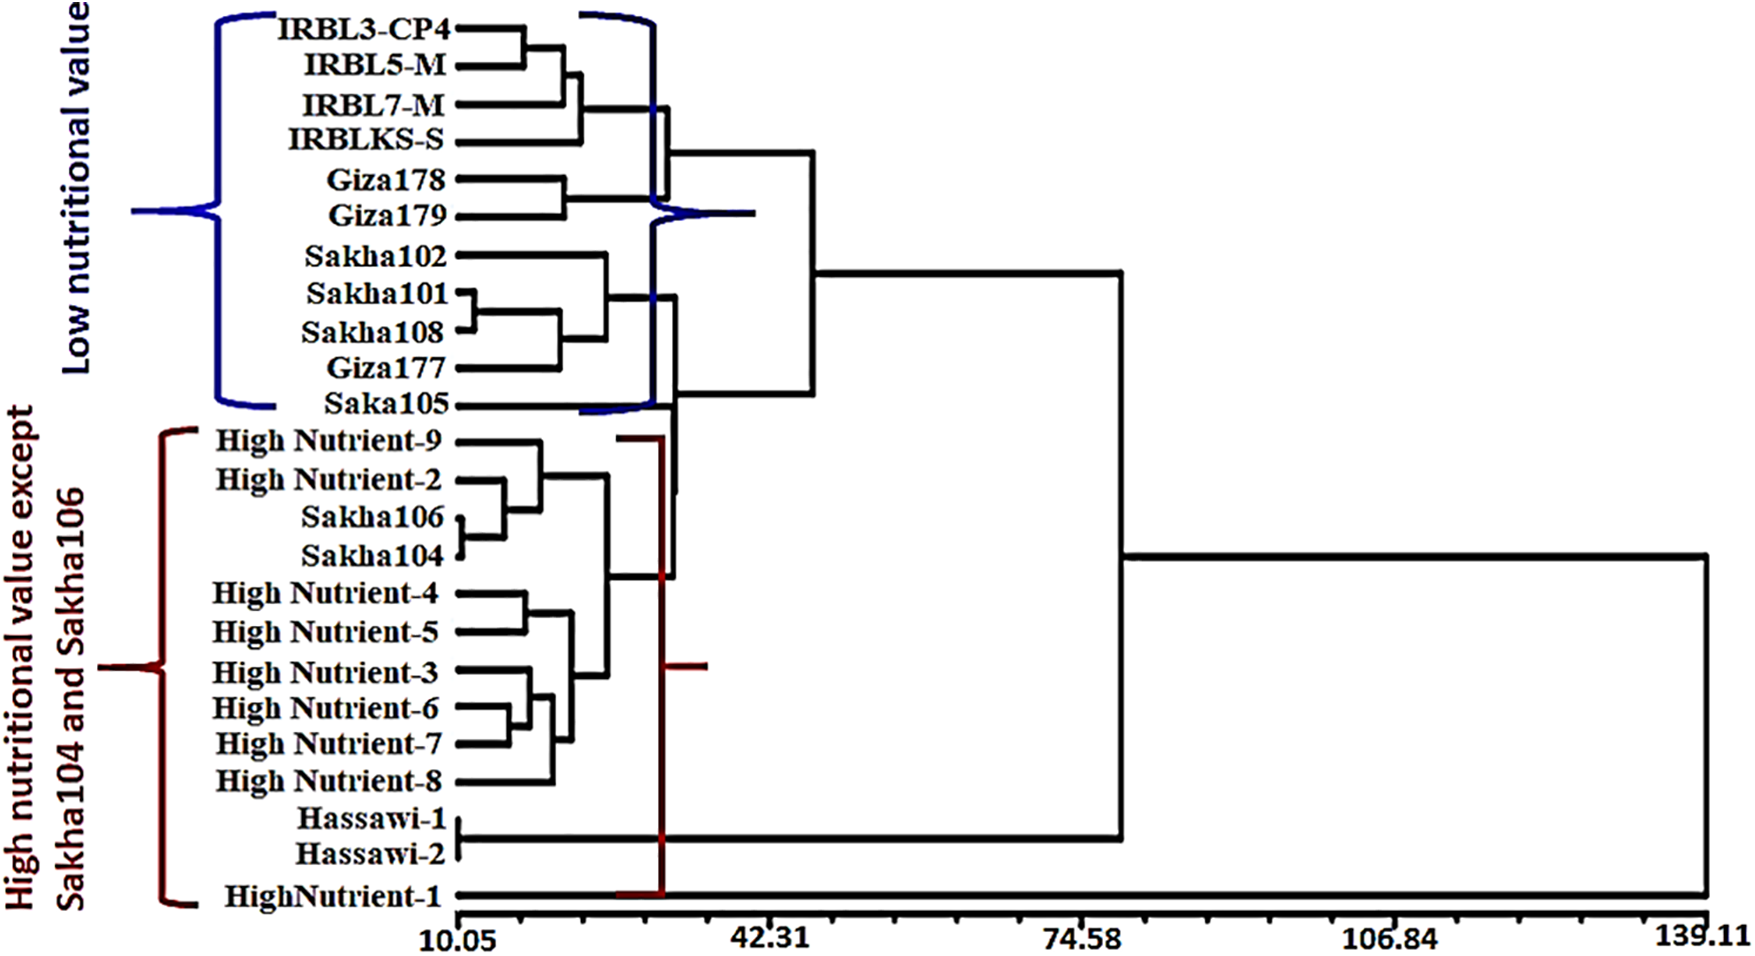
Figure 7: Clustering varieties, based on similarity of quantitative characteristics, produced two large groups
In recent years, the world has been suffering from a shortage of nutritional concentration in some crops, especially in countries that consume rice [45]. The decrease in nutrient and protein concentration in the food will cause the spread of diseases and increased mortality rates among children, especially in developing countries [46,47]. Therefore, developing varieties that contain abundant mineral nutrients in milled rice is one of the effective methods to solve the problem of mineral nutrient deficiency, which is one of the goals of breeding programs [48].
This study showed differences in nutrients and grain quality traits among the 24 rice varieties used. The Egyptian varieties were higher in grain quality characteristics, but were lower in the concentration of other nutrients compared to the colored varieties, while the rest of the varieties were low in these characteristics but were rich in the concentration of other nutritional elements.
For amylose concentration, all the varieties were low in amylose, except the varieties Hassawi-1 and Hassawi-2, which were high in amylose. However, significant positive correlations were found between the hulling, milling, head percentage and gelatinization traits, which suggest that these characteristics exist on one chromosome or are located in close locations on the chromosome. The results are in agreement with those of previous studies [47,49].
This study was useful for knowing the concentration of nutrients in Egyptian varieties. It also helps rice breeders to transfer these traits to other varieties through hybridization between them. Heritability (h2B) values were computed, indicating existence of both additive and non-additive genetic variances in inheritance of most features [43]. Traditional and modern breeding methods were used to develop new varieties high in protein and nutritional elements, like the golden rice variety [14,50], which had a high level of beta-carotene (vitamin A). Within 24 rice genotypes, eleven varieties, namely, HighNutrient-1, HighNutrient-2, HighNutrient-3, HighNutrient-4, HighNutrient-5, HighNutrient-6, HighNutrient-7, HighNutrient-8, HighNutrient-9, Hassawi-1, and Hassawi-2, had high nutritional elements and protein concentration [22,51,52]. In addition, these varieties were colored (Fig. 1) compared with the rest, which were low in nutritional elements, protein concentration, and non-colored [48]. Either conventional or contemporary biotechnology techniques could be employed to enhance nutritional concentration of rice by utilizing reach genotypes by protein and nutritional components [22].
Our results corroborate those of those who claimed that certain rice cultivars have good grain quality characteristics, specifically grain protein concentration [1,47]. On the other hand, magnesium (Mg) was highly significant and positively correlated with both potassium (K) or protein, while it was positively and significantly correlated with zinc (Zn) and iron (Fe). While, potassium (K) had positive correlation with zinc (Zn), iron (Fe), or protein percentage, calcium (Ca) had positive correlation with manganese (Mn) and iron (Fe), and copper (Cu) had positive correlation with manganese (Mn). Zinc (Zn) element was correlated with iron (Fe) and protein percentage, and iron (Fe) was correlated with protein percentage (Fig. 6). This positive and significant correlation between these elements is due to the possibility that these elements and could be inherited as linkage group or were located in chromosome one [53,54]. Cluster analysis showed that varieties rich in protein and nutrients were close together and in one group, while varieties low in protein and nutrients were present in a group [55,56]. Finally, colored rice, or dyed rice, is rich in important nutritional elements. The development of golden rice, rich in vitamin A, was the most important variety, which opened the way for the development of many other varieties rich in nutritional elements [57]. Therefore, work on developing colorful varieties is very important, and many countries are seeking to produce varieties rich in some disease-resistant elements and rich in iron [58].
This study showed genetic differences between varieties in quality traits and also in nutrients and elements. It was also shown that all colored varieties (HighNutrient-1, HighNutrient-2, HighNutrient-3, HighNutrient-4, HighNutrient-5, HighNutrient-6, HighNutrient-7, HighNutrient-8, HighNutrient-9, Hassawi-1 and Hassawi-2) contain high levels of protein, Mg, Na, K, Ca, Cu, Mn, Zn, and Fe, as well as a positive correlation between these elements. While the cluster analysis was divided into two major groups, the first one included almost all rich varieties together, and the second one included only the low varieties.
Acknowledgement: Authors extend their appreciation to Deanship of Scientific Research, Vice Presidency for Graduate Studies and Scientific Research, King Faisal University, Saudi Arabia for funding this research work (Grant A410).
Funding Statement: This research work was supported and funded by Deanship of Scientific Research, Vice Presidency for Graduate Studies and Scientific Research, King Faisal University, Saudi Arabia, grant number (Grant A410).
Author Contributions: The authors confirm contribution to the paper as follows: study conception and design: Adel A. Rezk; Mohamed M. El-Malky; data collection: Adel A. Rezk; Mohamed M. El-Malky; analysis and interpretation of results: Adel A. Rezk; Mohamed M. El-Malky; Heba I. Mohamed; Hossam S. El-Beltagi; draft manuscript preparation: Adel A. Rezk; Mohamed M. El-Malky; Heba I. Mohamed; Hossam S. El-Beltagi. All authors reviewed the results and approved the final version of the manuscript.
Availability of Data and Materials: All data presented in the manuscript.
Ethics Approval: Not applicable.
Conflicts of Interest: The authors declare that they have no conflicts of interest to report regarding the present study.
References
1. Zaghum MJ, Ali K, Teng S. Integrated genetic and omics approaches for the regulation of nutritional activities in rice (Oryza sativa L.). Agriculture. 2022;12(11):1757. doi:10.3390/agriculture12111757. [Google Scholar] [CrossRef]
2. Al-Mssallem MQ, Alqurashi RM. Nutrient components and antioxidant activity in Hassawi rice and Basmati rice varieties. Sci J King Faisal Univ Basic Appl Sci. 2021;22(1):54–7. doi:10.37575/b/agr/2265. [Google Scholar] [CrossRef]
3. Rezk AA, El-Malky MM, El-Beltagi HS, Al-Daej M, Attia KA. Conventional breeding and molecular markers for blast disease resistance inrice (Oryza sativa L.). Phyton-Int J Exp Bot. 2023;92(3):725–46. doi:10.32604/phyton.2023.024645. [Google Scholar] [CrossRef]
4. Lu Z, Fang Z, Liu W, Lu D, Wang X, Wang S, et al. Grain quality characteristics analysis and application on breeding of Yuenongsimiao, a high-yielding and disease-resistant rice variety. Sci Rep. 2023;13(2):6335. doi:10.1038/s41598-022-21030-9. [Google Scholar] [PubMed] [CrossRef]
5. Shelenga TV, Kerv YA, Perchuk IN, Solovyeva EA, Khlestkina EK, Loskutov GI, et al. The potential of small grains crops in enhancing biofortification breeding strategies for human health benefit. Agronomy. 2021;11(7):1420. doi:10.3390/agronomy11071420. [Google Scholar] [CrossRef]
6. Zhu J, Wang X, Li A, Wang R, Ni X, Hu J, et al. The main nutritional components in colored rice grains. LWT. 2023;191:115663. doi:10.1016/j.lwt.2023.115663. [Google Scholar] [CrossRef]
7. Menon M, Smith A, Fennell J. Essential nutrient element profiles in rice types: a risk-benefit assessment including inorganic arsenic. Brit J Nutr. 2021;128(5):888–99. doi:10.1017/S0007114521004025. [Google Scholar] [PubMed] [CrossRef]
8. El-Beltagi HS, Mohamed HI, Aldaej MI, Al-Khayri JM, Rezk AA, Al-Mssallem MQ, et al. Production and antioxidant activity of secondary metabolites in Hassawi rice (Oryza sativa L.) cell suspension under salicylic acid, yeast extract, and pectin elicitation. Vitro Cell Dev Biol. 2022;58:615–29. doi:10.1007/s11627-022-10264-x. [Google Scholar] [CrossRef]
9. Oyunga MA, Grant F, Okeyo DO, Ouedraogo H, Levin C, Low J. Prevalence and predictors of vitamin a deficiency among infants in western Kenya using a cross-sectional analysis. Afr J Food Agric Nutr Dev. 2016;16(1):10765–85. doi:10.18697/ajfand.73.16190. [Google Scholar] [CrossRef]
10. Kettenburg AJ, Hanspach J, Abson DJ, Fischer J. From disagreements to dialogue: unpacking the golden rice debate. Sustainab Sci. 2018;13(5):1469–82. doi:10.1007/s11625-018-0577-y. [Google Scholar] [PubMed] [CrossRef]
11. Damastuti E, Kurniawati S, Syahfitri Lestiani WYN, Santoso M. Determinations of minerals composition of rices in Java Island, Indonesia. J Nut Sci Vitaminol. 2020;66:S479–85. doi:10.3177/jnsv.66.S479. [Google Scholar] [PubMed] [CrossRef]
12. Mehmood S, Ud Din I, Ullah I, Mohamed HI, Basit A, Khan MN, et al. Agro-morphological and genetic diversity studies in rice (Oryza sativa L.) germplasm using microsatellite markers. Mol Biol Rep. 2021;48:7179–92. doi:10.1007/s11033-021-06710-5. [Google Scholar] [PubMed] [CrossRef]
13. Elkatry HO, El-Beltagi HS, Ahmed AR, Mohamed HI, Al-Otaibi HH, Ramadan K, et al. The potential use of Indian rice flour or husk in fortification of pan bread: assessing bread’s quality using sensory, physicochemical, and chemometric methods. Front Nutrit. 2023;10:1240527. doi:10.3389/fnut.2023.1240527. [Google Scholar] [PubMed] [CrossRef]
14. Stone GD, Glover D. Disembedding grain: golden rice, the green revolution, and heirloom seeds in the Philippines. Agric Hum Val. 2016;34(1):87–102. doi:10.1007/s10460-016-9696-1. [Google Scholar] [CrossRef]
15. Wirth J, Petry N, Tanumihardjo S, Rogers LM, McLean E, Greig A, et al. Vitamin a supplementation programs and country-level evidence of vitamin a deficiency. Nutrients. 2017;9:190. doi:10.3390/nu9030190. [Google Scholar] [PubMed] [CrossRef]
16. Maganti S, Swaminathan R, Parida A. Variation in iron and zinc content in traditional rice genotypes. Agric Res. 2020;9(1):316–28. doi:10.1007/s40003-019-00429-3. [Google Scholar] [CrossRef]
17. Roy SC, Sharma B. Assessment of genetic diversity in rice [Oryza sativa L.] germplasm based on agro-morphology traits and zinc-iron content for crop improvement. Physiol Mol Biol Plants. 2014;20(2):209–24. doi:10.1007/s12298-014-0221-y. [Google Scholar] [PubMed] [CrossRef]
18. Kumar A, Lal MK, Kar SS, Nayak L, Ngangkham U, Samantaray S, et al. Bioavailability of iron and zinc as affected by phytic acid content in rice grain. J Food Biochem. 2017;41(7):e12413. doi:10.1111/jfbc.12413. [Google Scholar] [CrossRef]
19. Abebe T, Alamerew S, Tulu L. Genetic variability, heritability and genetic advance for yield and its related traits in rainfed lowland rice (Oryza sativa L.) genotypes at fogera and pawe, ethiopia. Adv Crop Sci Tech. 2017;5(2):1–8. doi:10.4172/2329-8863.1000272. [Google Scholar] [CrossRef]
20. Da Silva CSC, Botelh FBS, Rodrigues CS, Mendes MP, De Moura AM, Net AR. Genetic and phenotypic parameters in the selection of upland rice genotypes. Am J Plant Sci. 2017;8:3450–9. doi:10.4236/ajps.2017.813232. [Google Scholar] [CrossRef]
21. Kamara N, Asante MD, Akromah R. Inheritance studies of aroma and yield attributes in rice (Oryza sativa L.) genotypes. Afr J Agric Res. 2018;12(50):3461–9. doi:10.5897/AJAR2017.12583. [Google Scholar] [CrossRef]
22. Mukhina ZHM, Tumanyan NG, Garkusha SV, Papulova EYU, Chukhir NP, Chukhir IN, et al. Improving coloured rice grain quality through accelerated breeding. SABRAO J Breed Gene. 2024;56(1):89–100. doi:10.54910/sabrao2024.56.1.8. [Google Scholar] [CrossRef]
23. Fentie D, Alemayehu G, Siddalingaiah M, Tadesse T. Genetic variability, heritability and correlation coefficient analysis for yield and yield component traits in upland rice (Oryza sativa L.). East Afr J Sci. 2014;8(2):147–54. [Google Scholar]
24. Rai SK, Suresh BG, Rai PK, Lavanya GR, Kumar R, Sandhya. Genetic variability, correlation and path coefficient studies for grain yield and other yield attributing traits in rice (Oryza sativa L.). Indian J Life Sci. 2014;2(4):229–34. [Google Scholar]
25. Kalita M, Saharia DD, Thakur K, Sonowal S, Goswami RK, Sarma MK, et al. Study of genetic diversity and drought-tolerance characteristics of few rice varieties using morphological and molecular markers. Int J Plant Soil Sci. 2024;36(1):38–53. doi:10.9734/ijpss/2024/v36i14327. [Google Scholar] [CrossRef]
26. Fahad M, Tariq L, Altaf MT, Shahnawaz M, Aslam M, Liaqat W, et al. In silico identification and characterization of rare cold inducible 2 (RCI2) gene family in cotton. Biochem Genet. 2024;12:1–24. doi:10.1007/s10528-023-10663-8. [Google Scholar] [PubMed] [CrossRef]
27. Rezk AA, Mohamed HI, El-Beltagi HS. Genetic variability and diversity analysis in Oryza sativa L. genotypes using quantitative traits and SSR markers. Saudi J Biol Sci. 2024;31(3):103944. doi:10.1016/j.sjbs.2024.103944. [Google Scholar] [PubMed] [CrossRef]
28. Shamim MZ, Sharma VK. Study of genetic diversity among different rice varieties using quantitative characters. Oryza. 2014;51(1):86–9. [Google Scholar]
29. Riyanto A, Susanti D, Sugiyono S, Hidayat P, Suprayogi S, Haryanto TA. Estimation of genetic parameters for rice length and shape of F2 population. AGRIVITA J Agric Sci. 2024;46(2):355–66. doi:10.17503/agrivita.v46i2.4086. [Google Scholar] [CrossRef]
30. Adair CR. The McGill miller method for determining the milled quality of small samples of rice. Rice J. 1952;55(2):21–3. [Google Scholar]
31. Khush GS, Paule CM, Dela-Cruze NM. Rice grain quality evaluation and improvement at IRRI. In: Workshop on Chemical Aspects of Rice Grain Quality; 1979; Manila, Philippines: IRRI. [Google Scholar]
32. Little R, Hilder G, Dawson E. Differential effect of dilute alkali on 25 varieties of milled white rice. Cereal Chem. 1958;35(2):111–26. [Google Scholar]
33. Juliano BO. A simplified assay for milled rice amylose Cereal. Sci Today. 1971;16(10):334–40. [Google Scholar]
34. Jones JB, Wolf JB, Mills HA. Plant analysis handbook: a practical sampling, preparation, analysis, and interpretation guide. Athens Ga: Micro-Macro Publishing; 1991. [Google Scholar]
35. Murphy J, Riley JP. A modified single-solution method for the determination of phosphorus in natural waters. Anal Chimica Acta. 1962;27:31–6. doi:10.1016/S0003-2670(00)88444-5. [Google Scholar] [CrossRef]
36. Le Clerg EL, Leonard WH, Clark AG. Field plot technique. Minnesota, USA: Burgess Publishing Co.; 1962. [Google Scholar]
37. Dudley JW, Moll RH. Interpretation and use of estimates of heritability and genetic variances in plant breeding. Crop Sci. 1969;9:257–62. doi:10.2135/cropsci1969.0011183X000900030001x. [Google Scholar] [CrossRef]
38. Wricke G, Weber WE. Quantitative genetics and selection in plant breeding. Berlin, Germany: De Gruyter; 1986. doi:10.1515/9783110837520. [Google Scholar] [CrossRef]
39. Prasad SR, Prakash R, Sharma CM, Haque MF. Genotypic and phenotypic variability in quantitative characters in oat. Indian J Agric Sci. 1981;51(7):480–2. [Google Scholar]
40. Allard RW. Principles of plant breeding. 2nd edNew York, USA: John Wiley and Sons; 1999. p. 254. [Google Scholar]
41. Sneath PH, Sokal RR. Numerical taxonomy: the principles and practice of numerical classification. 1st edSan Francisco: W. H. Freeman; 1973. [Google Scholar]
42. Rohlf FJ. NTSYS-pc: numerical taxonomy and multivariate analysis system version 2.1. Setauket, New York: Applied Biostatistics Inc.; 2000. [Google Scholar]
43. Roy SC, Shil P. Assessment of genetic heritability in rice breeding lines based on morphological traits and caryopsis ultrastructure sub. Sci Rep. 2020;10(1):7830. doi:10.1038/s41598-020-63976-8. [Google Scholar] [PubMed] [CrossRef]
44. Fatma AH, Abd El-Rahman SN. Comparative studies of some agronomic and grain quality traits for three new developed rice varieties. Menoufia J Plant Prod. 2021;6(6):315–26. doi:10.21608/MJPPF.2021.182262. [Google Scholar] [CrossRef]
45. Mohidem NA, Norhashila Hashim N, Rosnah Shamsudin R, Hasfalina Che Man HC. Rice for food security: revisiting its production, diversity, rice milling process and nutrient content. Agriculture. 2022;12:741. doi:10.3390/agriculture12060741. [Google Scholar] [CrossRef]
46. Zhao M, Lin Y, Chen H. Improving nutritional quality of rice for human health. Theor Appl Genet. 2020;133(5):1397–413. doi:10.1007/s00122-019-03530-x. [Google Scholar] [PubMed] [CrossRef]
47. Al-Daej MI. Genetic studies for grain quality traits and correlation analysis of mineral element contents on Al-Ahsa rice and some different varieties (Oryza sativa L.). Saudi J Biol Sci. 2021;29(3):1893–9. doi:10.1016/j.sjbs.2021.10.032. [Google Scholar] [PubMed] [CrossRef]
48. Jaksomsaka P, Rerkasemb B, Prom-U-Thai C. Variation in nutritional quality of pigmented rice varieties under different water regimes. Plant Prod Sci. 2021;24(2):244–55. doi:10.1080/1343943X.2020.1819164. [Google Scholar] [CrossRef]
49. Cruz M, Arbelaez JD, Loaiza K, Cuasquer J, Rosas J, Gratero E. Genetic and phenotypic characterization of rice grain quality traits to define research strategies for improving rice milling, appearance, and cooking qualities in Latin America and the Caribbean. Plant Genome. 2021;14:e20134. doi:10.1002/tpg2.20134. [Google Scholar] [PubMed] [CrossRef]
50. de Steur H, Stein AJ, Demont M. From golden rice to golden diets: how to turn its recent appr,oval into practice. Glob Food Secur. 2022;32:100596. doi:10.1016/j.gfs.2021.100596. [Google Scholar] [PubMed] [CrossRef]
51. Vici G, Perinelli DR, Camilletti D, Carotenuto F, Belli L, Valeria Polzonetti V. Nutritional properties of rice varieties commonly consumed in Italy and applicability in gluten free diet. Foods. 2021;10(6):1375. doi:10.3390/foods10061375. [Google Scholar] [PubMed] [CrossRef]
52. Alam M, Tan X, Zhang H, Lou G, Yang H, Zhou Y, et al. QTL mining and validation of grain nutritional quality characters in rice (Oryza sativa L.) using two introgression line populations. Agriculture. 2023;13(9):1725. doi:10.3390/agriculture13091725. [Google Scholar] [CrossRef]
53. Bollinedi H, Yadav AK, Vinod KK, Gopala Krishnan S, Bhowmick PK, Nagarajan M, et al. Genome-wide association study reveals novel marker-trait associations (MTAs) governing the localization of Fe and Zn in the rice grain. Front Genet. 2020;11:497543. doi:10.3389/fgene.2020.00213. [Google Scholar] [PubMed] [CrossRef]
54. Anandan A, Rajiv G, Eswaran R, Prakash M. Genotypic variation and relationships between quality traits and trace elements in traditional and improved rice (Oryza sativa L.) genotypes. J Food Sci. 2011;76(4):122–30. doi:10.1111/j.1750-3841.2011.02135.x. [Google Scholar] [PubMed] [CrossRef]
55. Shi S, Wang E, Li C, Zhou H, Cai M, Cao C, et al. Comprehensive evaluation of 17 qualities of 84 types of rice based on principal component analysis. Foods. 2021;10(11):2883. doi:10.3390/foods10112883. [Google Scholar] [PubMed] [CrossRef]
56. Adjah KL, Abe A, Adetimirin VO, Asante MD. Genetic variability, heritability and correlations for milling and grain appearance qualities in some accessions of rice (Oryza sativa L.). Physiol Mol Biol Plants. 2020;26(6):1309–17. doi:10.1007/s12298-020-00826-x. [Google Scholar] [PubMed] [CrossRef]
57. Napasintuwong O. Thailand’s colored rice standard and markets. FFTC Agricultural Policy Platform (FFTC-AP); 2021. Available from: https://ap.fftc.org.tw/article/1756. [Accessed 2021]. [Google Scholar]
58. Ahuja U, Ahuja SC, Chaudhary N, Thakrar R. Asian agri-history foundation. Red rices—past, present, and future; 2021. Available from: https://www.asianagrihistory.org/pdf/articles/Red-Rices-Uma-Ahuja.pdf. [Accessed 2021]. [Google Scholar]
Cite This Article
 Copyright © 2024 The Author(s). Published by Tech Science Press.
This work is licensed under a Creative Commons Attribution 4.0 International License , which permits unrestricted use, distribution, and reproduction in any medium, provided the original work is properly cited.
 Downloads
 Citation Tools