
 Submit a Paper
 Propose a Special lssue
 Open Access
ARTICLE

Integrative Analysis of Transcriptome and Phenolic Compounds Profile Provides Insights into the Quality of Soursop (Annona muricata L.) Fruit
1Unidad de Tecnología de Alimentos-Secretaría de Investigación y Posgrado, Universidad Autónoma de Nayarit. Ciudad de la Cultura SN, Tepic, 63000, Nayarit, México
2 Programa Académico de Biología, Unidad Académica de Agricultura, Universidad Autónoma de Nayarit, Km. 9. Carretera Tepic-Compostela, Xalisco, 63780, Nayarit, México
3 Estancias Posdoctorales-Consejo Nacional de Humanidades, Ciencias y Tecnologías, Coordinación de Apoyos a Becarios e Investigadores, Dirección de Posgrado, Ciudad de México, 03940, México
* Corresponding Author: Guillermo Berumen-Varela. Email:
(This article belongs to the Special Issue: Plant Secondary Metabolism and Functional Biology)
Phyton-International Journal of Experimental Botany 2024, 93(7), 1717-1732. https://doi.org/10.32604/phyton.2024.052216
Received 26 March 2024; Accepted 20 June 2024; Issue published 30 July 2024
 View Full Text
 Download PDF
Abstract
Soursop (Annona muricata L.) is a tropical fruit highly valued for its unique flavor, nutritional value, and health-promoting properties. The ripening process of soursop involves complex changes in gene expression and metabolite accumulation, which have been studied using various omics technologies. Transcriptome analysis has provided insights into the regulation of key genes involved in ripening, while metabolic compound analysis has revealed the presence of numerous bioactive compounds with potential health benefits. However, the integration of transcriptome and metabolite compound data has not been extensively explored in soursop. Therefore, in this paper, we present a comprehensive analysis of the transcriptome and phenolic compound profiles of soursop during ripening. The integration analysis showed that the genes and phenolic compounds were mainly involved in the starch and sucrose metabolism pathways during soursop ripening. Further, the phenolic compounds Kaempferol 3-Q-galactoside, Procyanidin C1, Procyanidin trimmer C1, and m-Coumaric, as well as the genes Ubiquitin-like protein 5 (UBL5_ARATH), ATP-dependent zinc metalloprotease FTSH8 (FTSH8_ORYSJ), Zinc transporter 4 (ZIP4_ARATH), Thioredoxin-like 3-1 (TRL31_ORYSJ), Mitogen-activated protein kinase YODA (YODA_ARATH), R-mandelonitrile lyase-like (MGL_ARATH), 26s protease regulatory subunit 6A homolog (PRS6_SOLLC), Cytochrome P450 72A13 (C7A13ARATH), Cytochrome P450 84A1 (C84A1_ARATH) and Homoserine O-trans-acetylase (MET2-ORYSJ) were correlated and differentially accumulated and expressed, respectively. Our study provides new insights into the molecular mechanisms underlying soursop ripening and may contribute to the development of strategies for improving the nutritional quality and shelf life of this important fruit.Keywords
Nomenclature
| ATG8B_ORYSJ | Autophagy-related protein 8B |
| C7A13ARATH | Cytochrome P450 72A13 |
| C84A1_ARATH | Cytochrome P450 84A1 |
| CIPK1_ARATH | CBL-interacting serine/threonine-protein kinase 1 |
| ERG1_PANGI | Squalene monooxygenase |
| FTSH8_ORYSJ | ATP-dependent zinc metalloprotease FTSH8 |
| GLAK1_ARATH | Glucuronokinase 1 |
| GLB3_ARATH | Two-on-two hemoglobin-3 |
| GSTUK_ARATH | Glutathione S-transferase U20 |
| MET2-ORYSJ | Homoserine O-trans-acetylase |
| METE2_ORYSJ | 5-methyltetrahydropteroyltriglutamate-homocysteine methyltransferase |
| MGL_ARATH | R-mandelonitrile lyase-like |
| PRS6A_SOLLC | 26s protease regulatory subunit 6A homolog |
| RGLG2_ARATH | E3 ubiquitin-protein ligase RGLG2 |
| RMA3_ARATH | E3 ubiquitin-protein ligase RMA3 |
| TRL31_ORYSJ | Thioredoxin-like 3-1 |
| UBL5ARATH | Ubiquitin-like protein 5 |
| YODA_ARATH | Mitogen-activated protein kinase YODA |
| ZIP4_ARATH | Zinc transporter 4 |
Soursop (Annona muricata L.) fruit is an important crop from the Annonaceae family, which is cultivated in tropical and subtropical countries, with Mexico being the top worldwide producer of this fruit [1,2]. Nevertheless, the soursop fruit is highly perishable due to quick softening caused by its deficient postharvest management, rapid metabolism as well as mechanical and pathogenic damage [3,4]. Fruit quality is developed during ripening, this process involves complex changes in gene expression and metabolite accumulation [5]. The main changes are related to color, taste (sugar and organic acid content), flavor and softening [5]. As soursop ripens, its metabolites and expressed genes change, which has been studied using various technologies.
Transcriptome analysis of soursop fruit under postharvest storage has provided insights into the regulation of key genes involved in the plant cell wall during ripening, finding more differentially expressed genes in the fruits stored at 15°C than those at 28°C [6]. On the other hand, this crop has received a lot of attention due to its medicinal properties attributed to the presence of bioactive compounds with biological activity [7,8]. In this context, phenolic compound (molecules with an aromatic ring containing hydroxyl groups) analysis by high-performance liquid chromatography (HPLC) from ripe soursop fruit has revealed the presence of 16 bioactive compounds with potential health benefits [9]. Likewise, our research group identified 68 phenolic compounds by Ultra-performance liquid chromatography (UPLC) Acquity UPLC™ H-Class (Waters, Manchester, UK) coupled to a mass spectrometer (MS QTof) during soursop ripening [10], developing a phenolic profile database (http://perseo.uan.mx/bioinformatica/phenolicsprofiledatabase, accessed 9 January 2024).
In the last years, the development of bioinformatics tools that simultaneously integrate or combine omics data has been raised to obtain important information that could not be gathered by a single omic [11]. Metabolomics combined with transcriptomics (RNA-seq) has been used to identify the biosynthesis pathways and key genes in several fruits such as grapes [12], watermelon [13], pear [14], and passion fruit [15]. One of the most used methods to integrate multi-omics datasets is multivariate analysis with the mixOmics package using R [16,17], which has been successfully applied in apple [18] and avocado [19]. However, such integrative approaches remain to be studied in soursop fruit.
A comprehensive study including transcriptome and phenolic compound data could be a powerful approach to understanding the molecular mechanisms underlying soursop metabolism during ripening. The data integration will provide valuable information on the genes and metabolites that activate at a specific stage of ripening, allowing us to identify biomarkers to detect the soursop quality, increasing the yield and the commercialization in foreign markets. This will benefit both the producers of this fruit and Mexico’s economy. Hence, the aim of this study was to integrate the transcriptomic and phenolic compound profiles during ripening to identify key metabolic pathways and regulatory networks involved in fruit quality.
We conducted individual analyses of two data sets from previous transcriptomics and phenolic compounds studies of soursop fruits “GUANAY-1” harvested in Venustiano Carranza, Nayarit, Mexico (21°32′2.77″ N, 104°58′39.73″ W). We used the metadata of the soursop transcriptome and semi-targeted metabolome during ripening obtained by our research group [6,10]. The samples used to integrate both data sets consisted of three biological replicates for day 0 and day 6 at 28°C, and two biological replicates for day 3. Each individual represented a sample; thus, the integration of data was performed on 8 samples.
2.2 Differential Expression and Gene Ontology (GO) Enrichment Analysis
The differential expression analysis was performed from an RSEM gene-level count matrix using the DESeq2 package in Rstudio [20]. Three pairwise comparisons (day 0 vs. day 3, day 0 vs. day 6, and day 3 vs. day 6) were performed. The threshold to identify significantly differentially expressed genes (DEG) was set as p.adjusted < 0.05 and Log2 Fold Change (LogFC) > 2. Genes with unique annotation using a BlastP identity >70% were used in subsequent analyses. GO enrichment analysis (biological process) was performed using the BinGO tool from the Cytoscape program following the protocol developed by [21]. The GO-enriched genes associated with phenolic compound pathways were selected and used for further analysis. Finally, we annotated the Entrez gene ID based on the GO term from the Arabidopsis thaliana database (org.At.tair.db package) for the joint-pathway analysis.
2.3 Differentially Accumulated Phenolic Compounds
Data acquisition was performed with the UNIFI Scientific Information System as previously reported by [10]. The response of all the peaks of the samples on each day was normalized with log10 and automatic scaled and then a univariate analysis per each pairwise comparison to identify the metabolites differentially accumulated was performed with MetaboAnalyst 5.0 [22]. Phenolic compounds with p-value < 0.05 and LogFC > 2.0 were considered as differentially accumulated.
2.4 Pathway Integration Analysis
Pathway analysis was performed using the significant DEG and the differential accumulated phenolic compounds. This analysis was carried out with the MetaboAnalyst 5.0 utilizing the module Joint Pathway Analysis (the options were the hypergeometric test, topology degree, and combining both queries), choosing Arabidopsis thaliana as an organism and then plotted in Rstudio.
mixOmics package in R [17] was used to explore the relationship between the DEG and metabolites by two multivariate strategies: sparse Partial Least Square (sPLS) and Canonical Correlation Analysis (CCA). In both analyses, the data were preprocessed by normalizing the data using the swap function in R.
The data integration using sPLS is based on the relationship between the predictor variable (X) and the response variable (Y) of two matrix datasets. In this regard, we build the sPLS model using the spls function with the regression mode to obtain the model object that contains the sPLS coefficients. Then, we cross-validate by 5-fold the metrics of the model by using the perf function to determine the optimal sparsity level (keepX and keepY) and the number of latent variables (ncomp). Based on that information, the new approximation was set with ncomp = 2 and then plotted in a correlation circle, heatmap with hierarchical clustering and network graph (cut-off = 0.5) to illustrate the relationship between the genes and metabolites by each comparison.
This is an unsupervised approach that is focused on maximizing the correlation between two datasets (X) and (Y). In this context, a correlation analysis between the datasets was performed and then plotted using the imgCor function. After this, the tune.rcc function was performed to calculate the cross-validation parameters (lambda 1 and lambda 2). Then, within the best lambdas 1 and 2 values, the approximation was carried out through the rcc function.
3.1 Enrichment of KEGG Pathways of DEG and Accumulated Metabolites
We identify 474, 372, and 39 DEG with unique annotation (BlastP identity > 70%) between the pairwise comparisons D0 vs. D3, D0 vs. D6, and D3 vs. D6, respectively. Based on the GO enrichment analysis, we selected 109, 29, and 24 DEG in the order of each pairwise comparison previously mentioned. On the other hand, the number of differentially accumulated metabolites was 43, 42, and 34 between the pairwise comparisons D0 vs. D3, D0 vs. D6, and D3 vs. D6, respectively. Based on this data, the integration KEGG pathways results showed that starch and sucrose metabolism followed by amino sugar and nucleotide sugar metabolism were the most significantly enriched pathways in the D3 and D6 compared with D0 (Fig. 1A,B). Conversely, in the comparison between D3 vs. D6, the biosynthesis of isoquinoline alkaloid and fatty acid were the most significant enriched pathways (Fig. 1C).
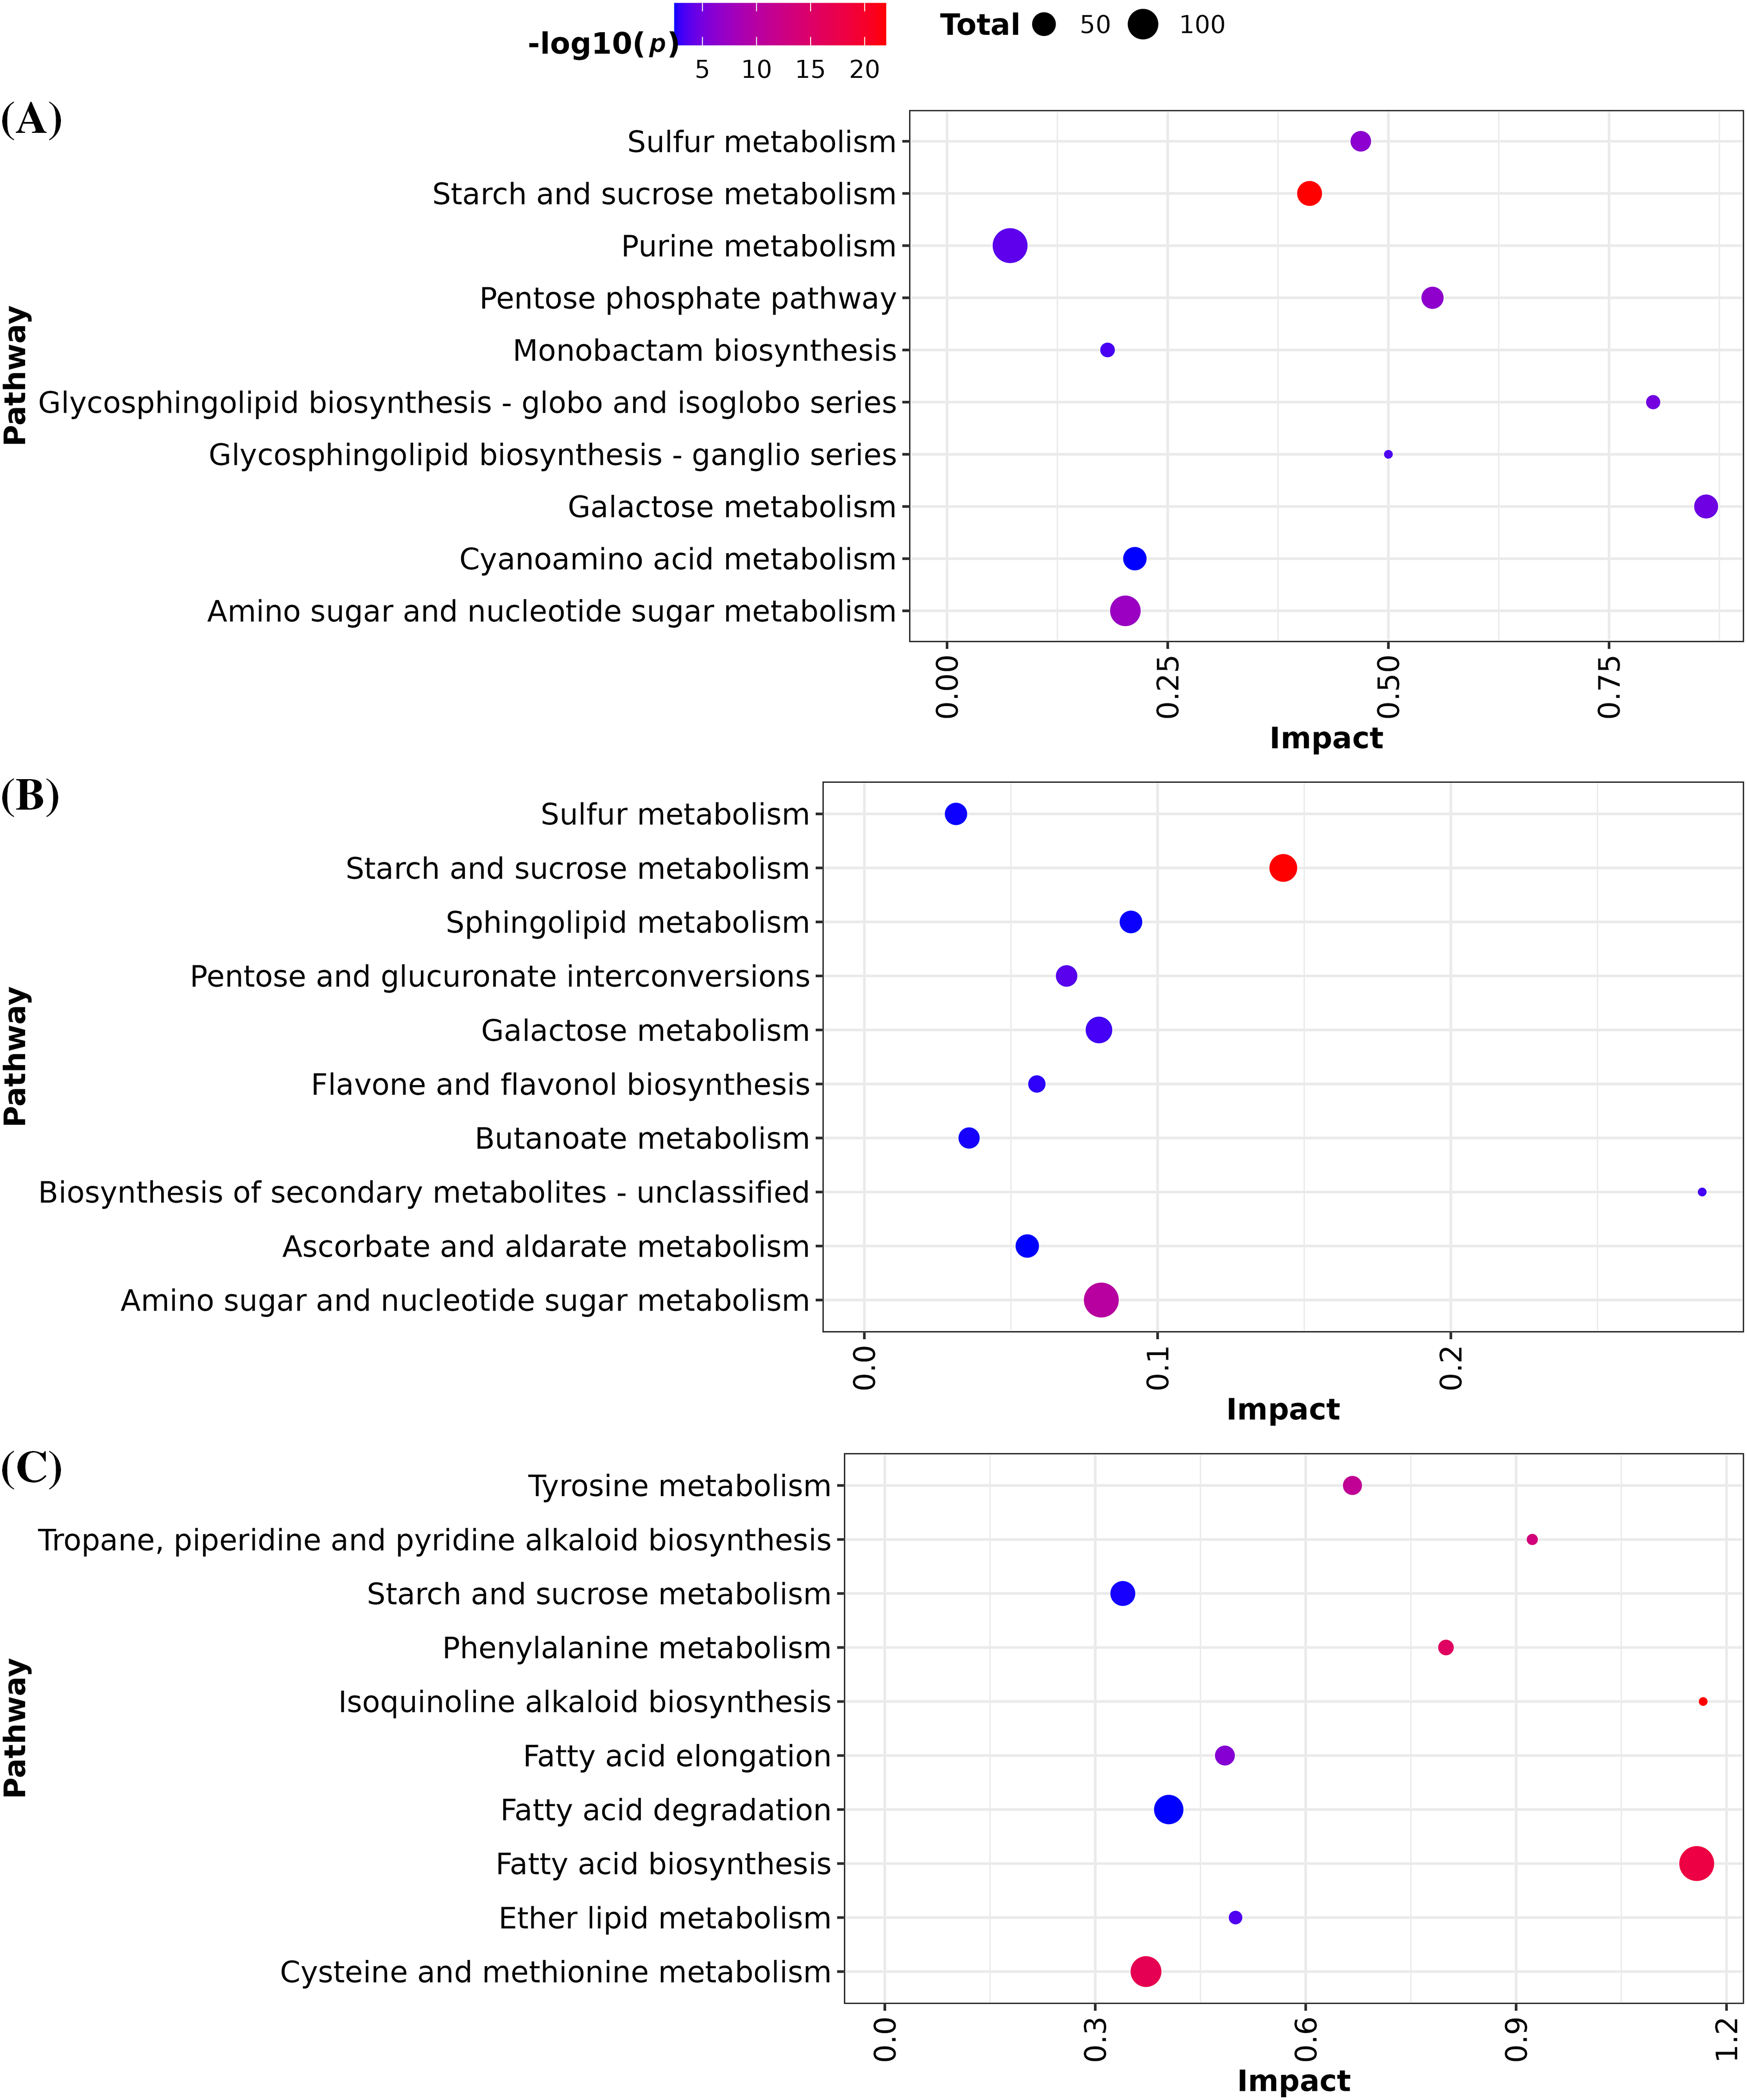
Figure 1: Pathway integration of DEG and differentially accumulated metabolites. The size of the circle represents the number of hits involved in a pathway. The color represents the p-value. (A) D0 vs. D3 (B) D0 vs. D6 and (C) D3 vs. D6.
The variables from both datasets are presented on components 1 and 2 (Figs. 2 and 3). In the case of the comparison between D0 vs. D3, we identified a correlation between the UBL5_ARATH (Ubiquitin-like protein 5) gene and the Kaempferol 3-Q-galactoside and dihydrocaffeic acid compounds (Fig. 2A). On the other hand, according to the heatmap (Fig. 2B) and network analysis (Fig. 3), several correlations were identified, clustering in three groups. The FTSH8_ORYSJ (ATP-dependent zinc metalloprotease FTSH8) gene expression is highly correlated with the Gallic acid-4-O-glucoside and protocatechuic acid 4-O-glucoside (Fig. 3). Notably, there is a strong correlation between the Procyanidin trimer C1 and the ZIP4_ARATH (Zinc transporter 4), GLB3_ARATH (Two-on-two hemoglobin-3), TRL31_ORYSJ (Thioredoxin-like 3-1) among others as shown in Figs. 2B and 3.
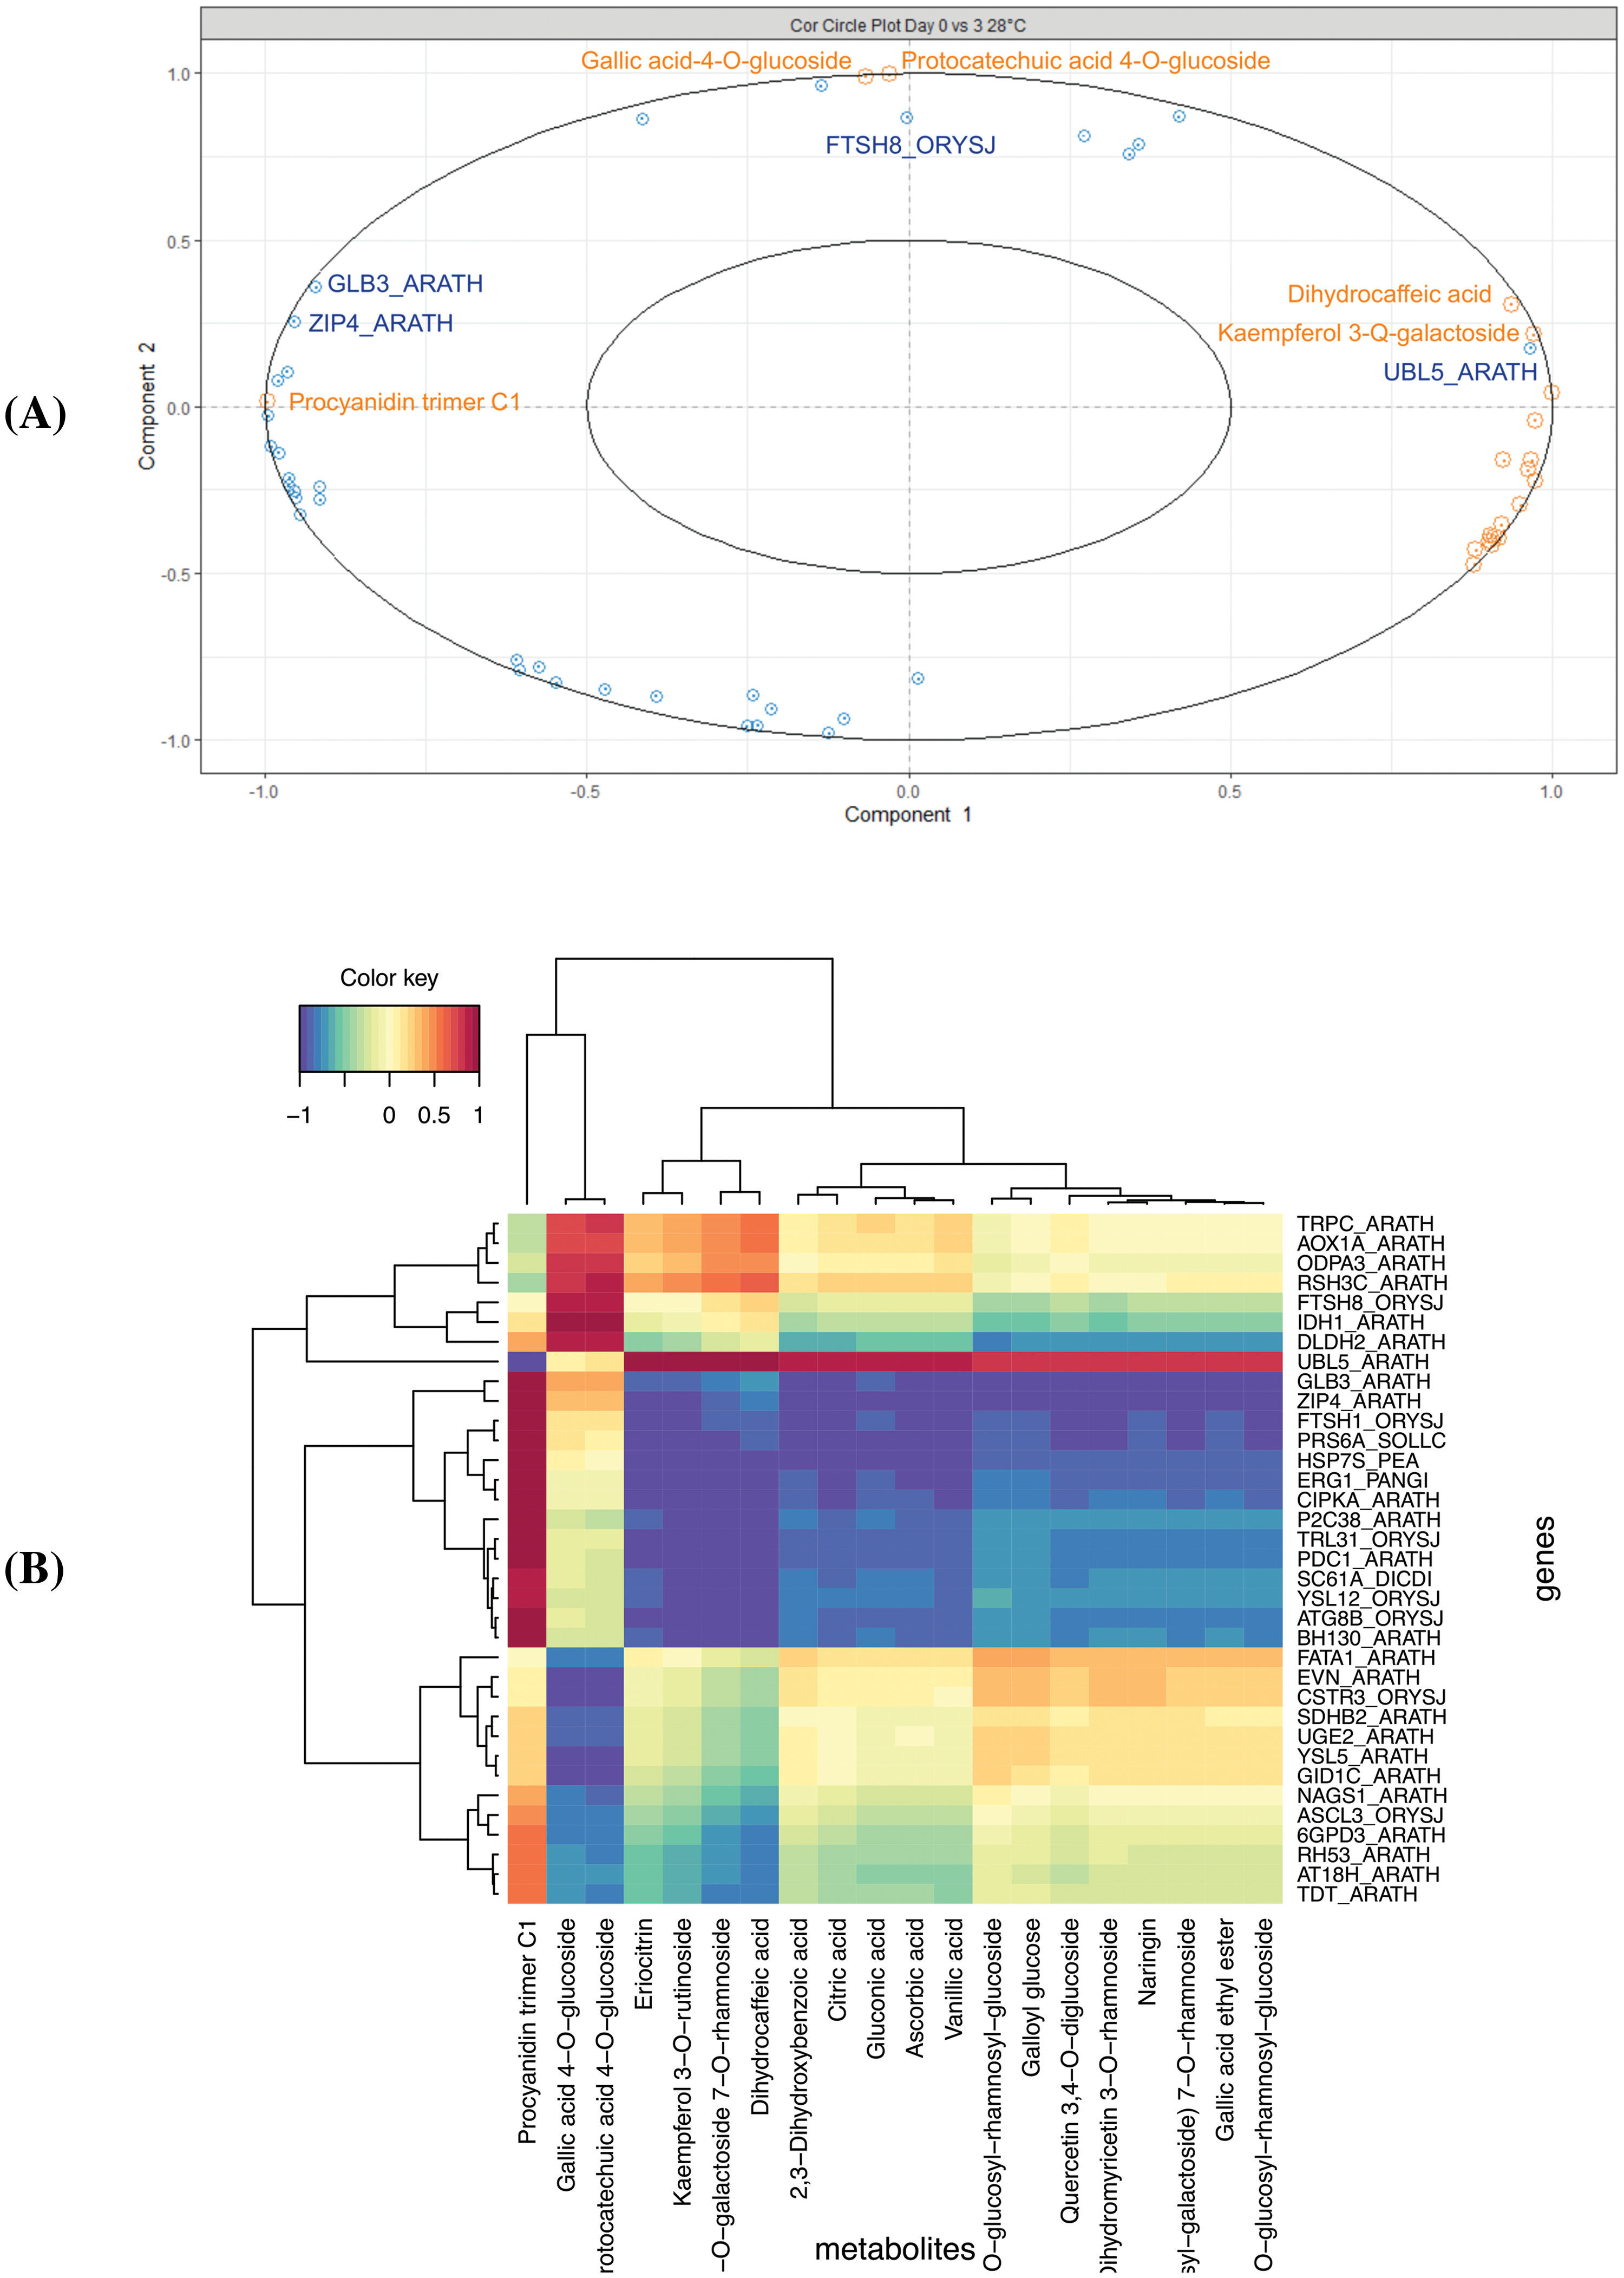
Figure 2: Integration data of DEG and metabolites in the D0 vs. D3 comparison. (A) The correlation circle plot represents the DEG (blue) and metabolites (orange) associated with components one and two (x and y axis), and (B) Heatmap with a hierarchical clustering analysis of the DEG (rows) and the metabolites (columns). Each cell color from red to blue (1 to −1) represents the value of the dataset integration
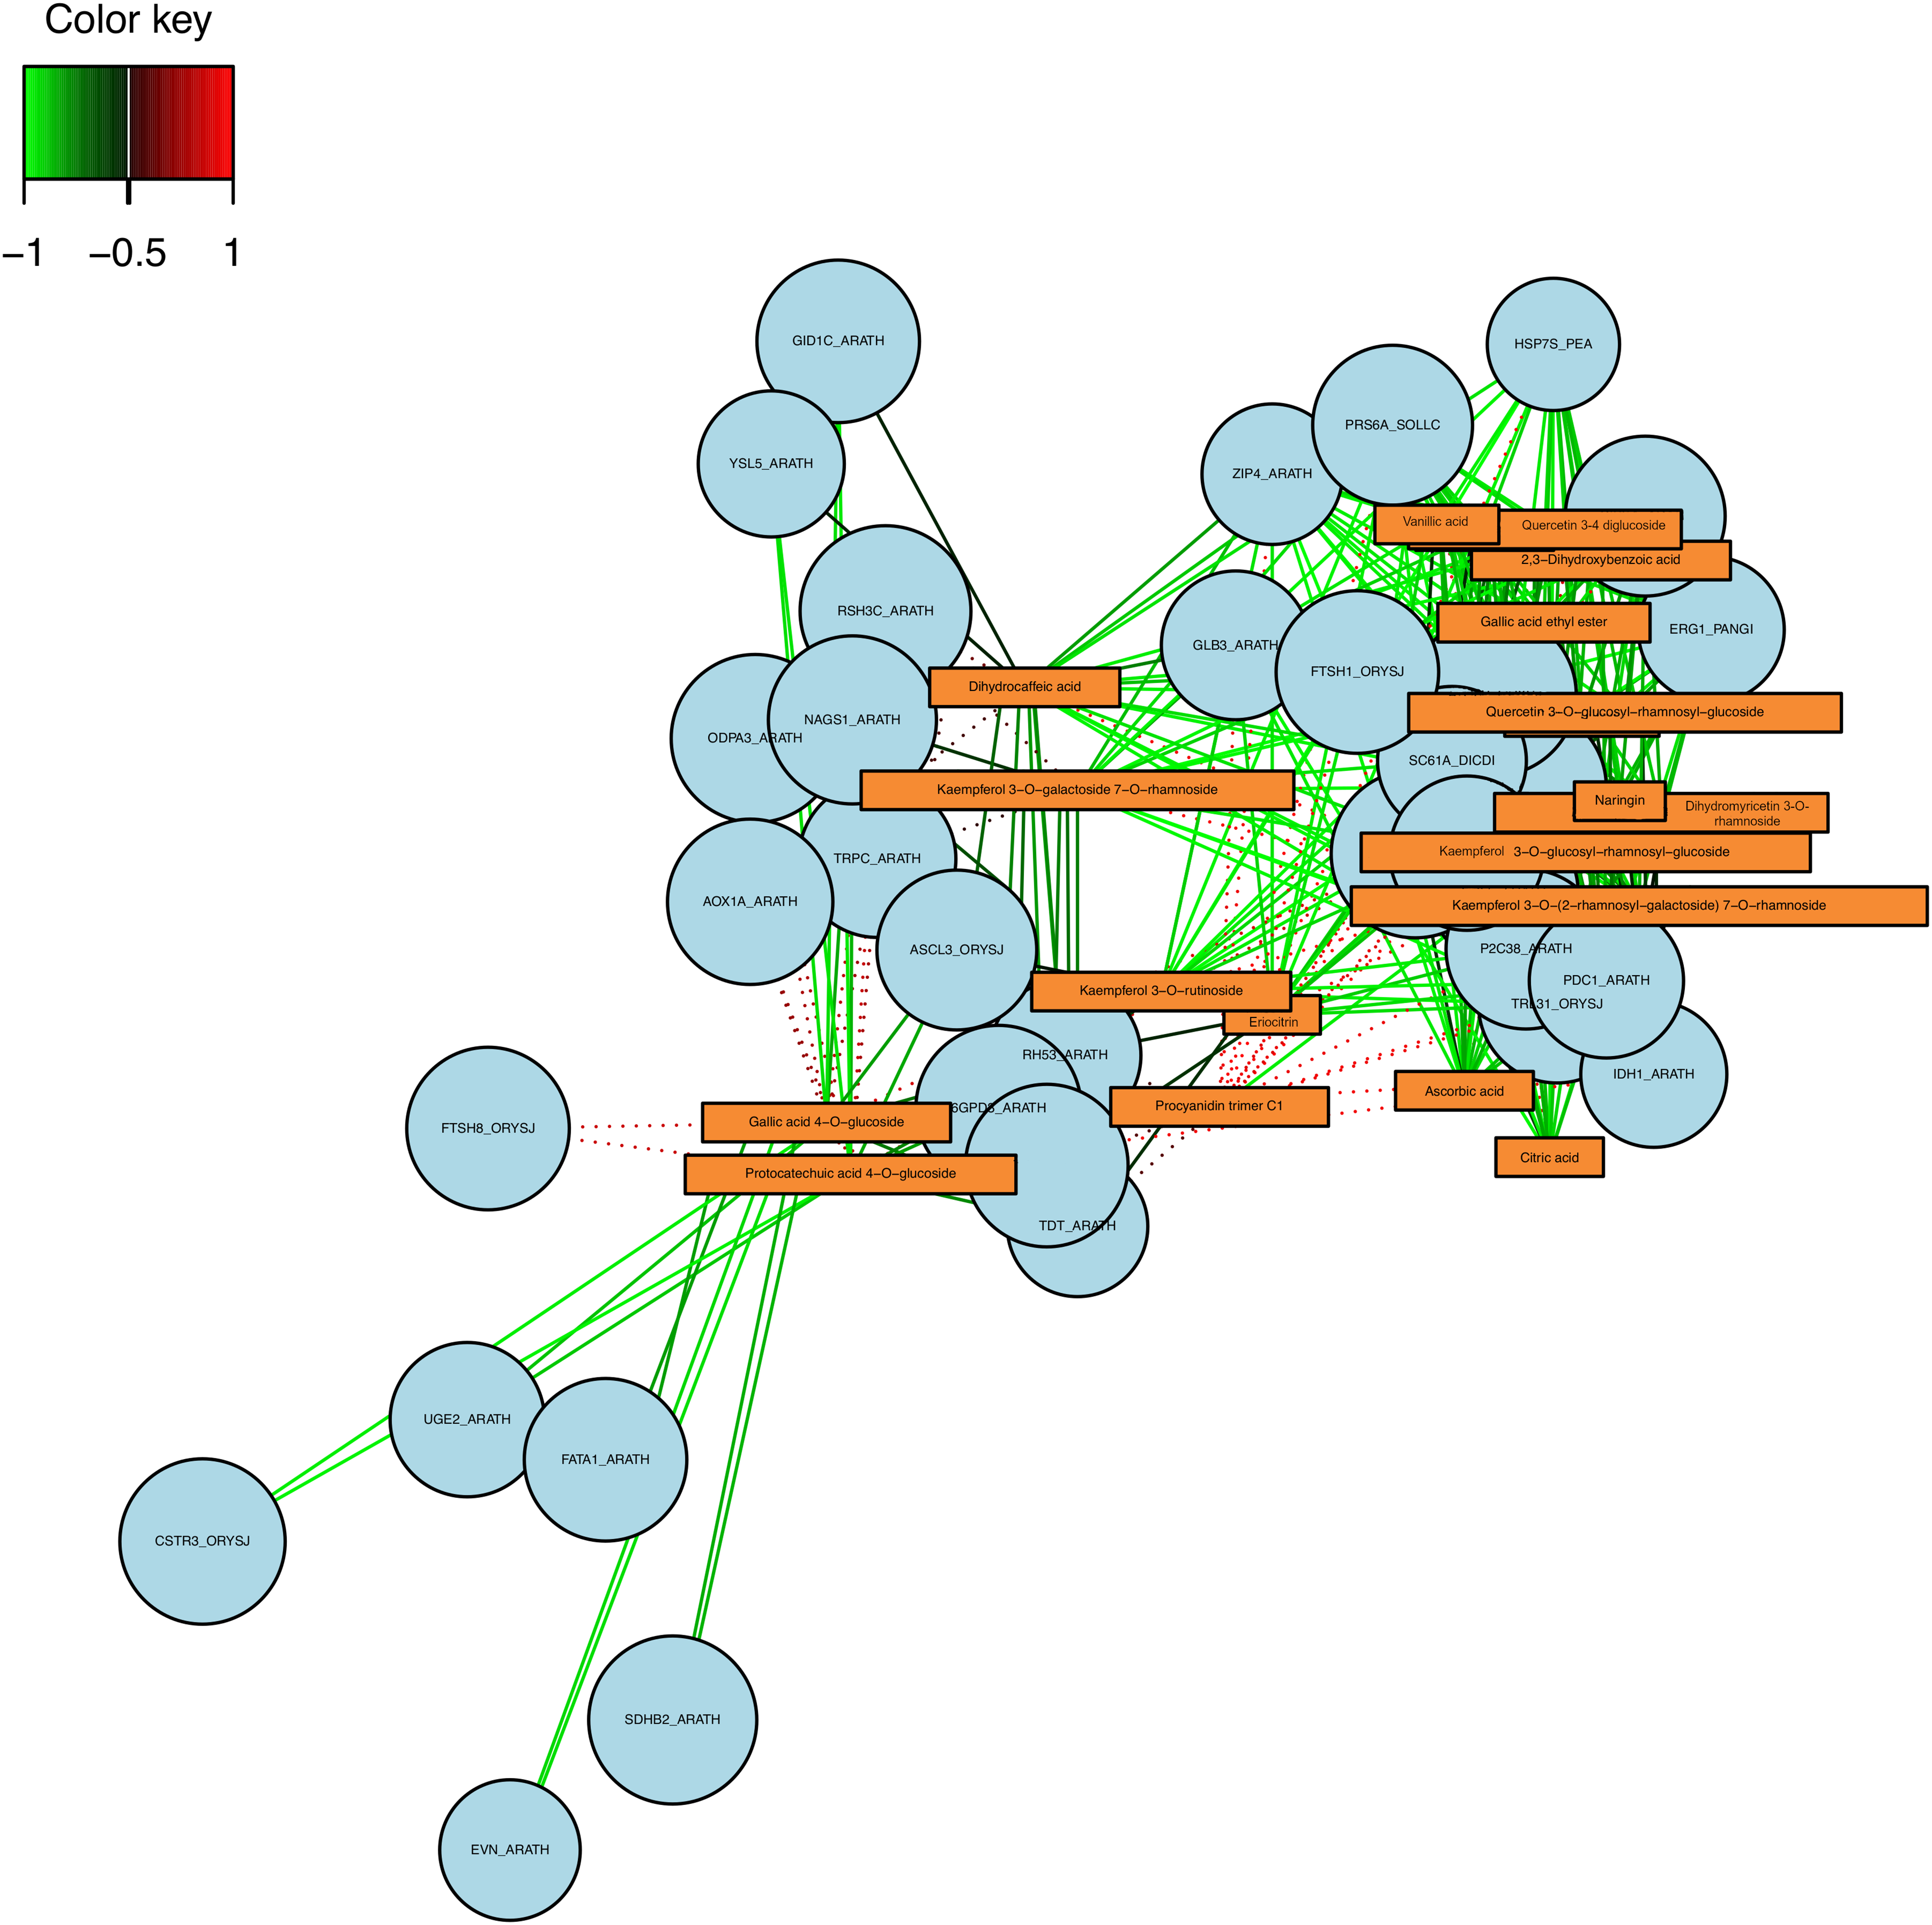
Figure 3: Network analysis between the DEG (circles) and metabolites (rectangle) in the D0 vs. D3 comparison, the color of the lines represents a negative correlation (green) or positive correlation (red)
On the other hand, the D0 vs. D6 comparison showed few correlations between the metabolites and the genes (Figs. 4 and 5). The correlation circle showed no association between metabolites and genes (Fig. 4A). On the other hand, the heatmap analysis showed a correlation between the Procyanidin trimer C1 and the ATG8B_ORYSJ (Autophagy-related protein 8B), MGL_ARATH (R-mandelonitrile lyase-like), YODA_ARATH and PRS6A_SOLLC (26s protease regulatory subunit 6A homolog) genes (Fig. 4B). Indeed, the network analysis showed a negative correlation between the Catechin Kaempferol 3-O-galactoside 7-O-rhamnoside with genes such as ERG1_PANGI (Squalene monooxygenase), CIPK1_ARATH (CBL-interacting serine/threonine-protein kinase 1), RMA3_ARATH (E3 ubiquitin-protein ligase RMA3), among others (Fig. 5). Interestingly, Procyanidin trimer C1 presented a correlation with the YODA_ARATH (Mitogen-activated protein kinase YODA) gene (Figs. 4A and 5).
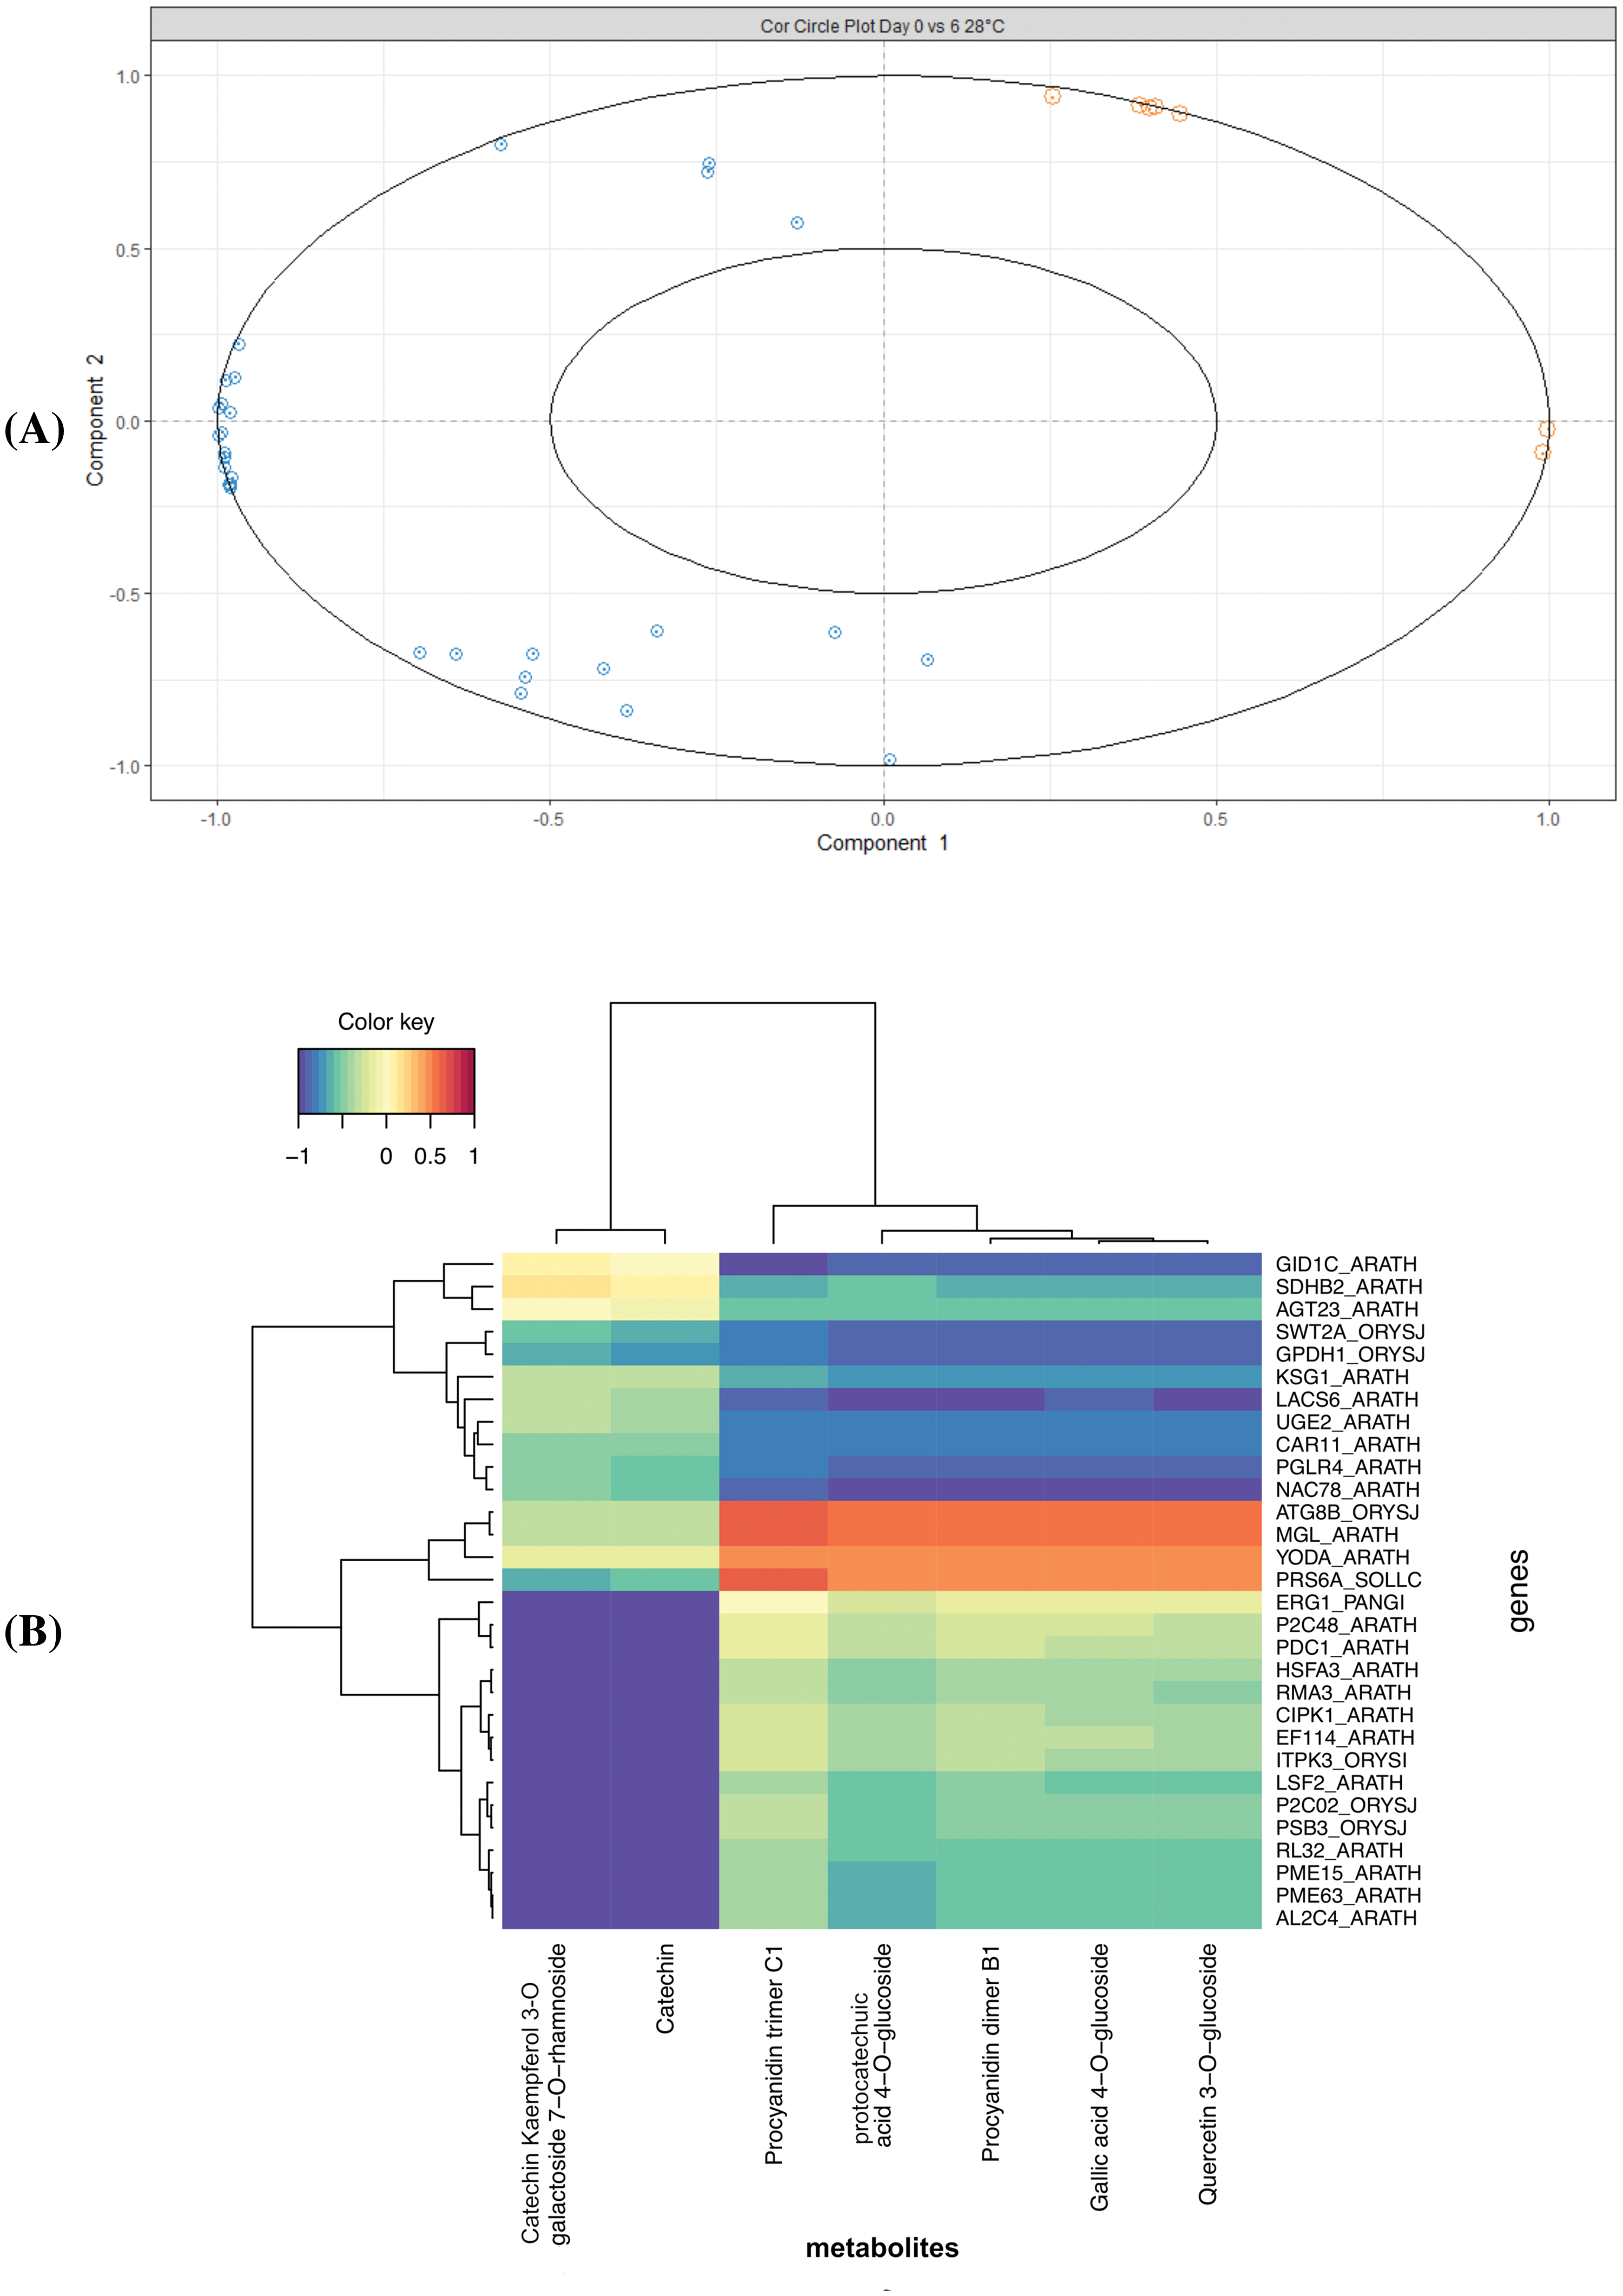
Figure 4: Integration data of DEG and metabolites in the D0 vs. D6 comparison. (A) The correlation circle plot represents the DEG (blue) and metabolites (orange) associated with components one and two (x and y axis), and (B) Heatmap with a hierarchical clustering analysis of the DEG (rows) and the metabolites (columns). Each cell color from red to blue (1 to −1) represents the value of the dataset integration
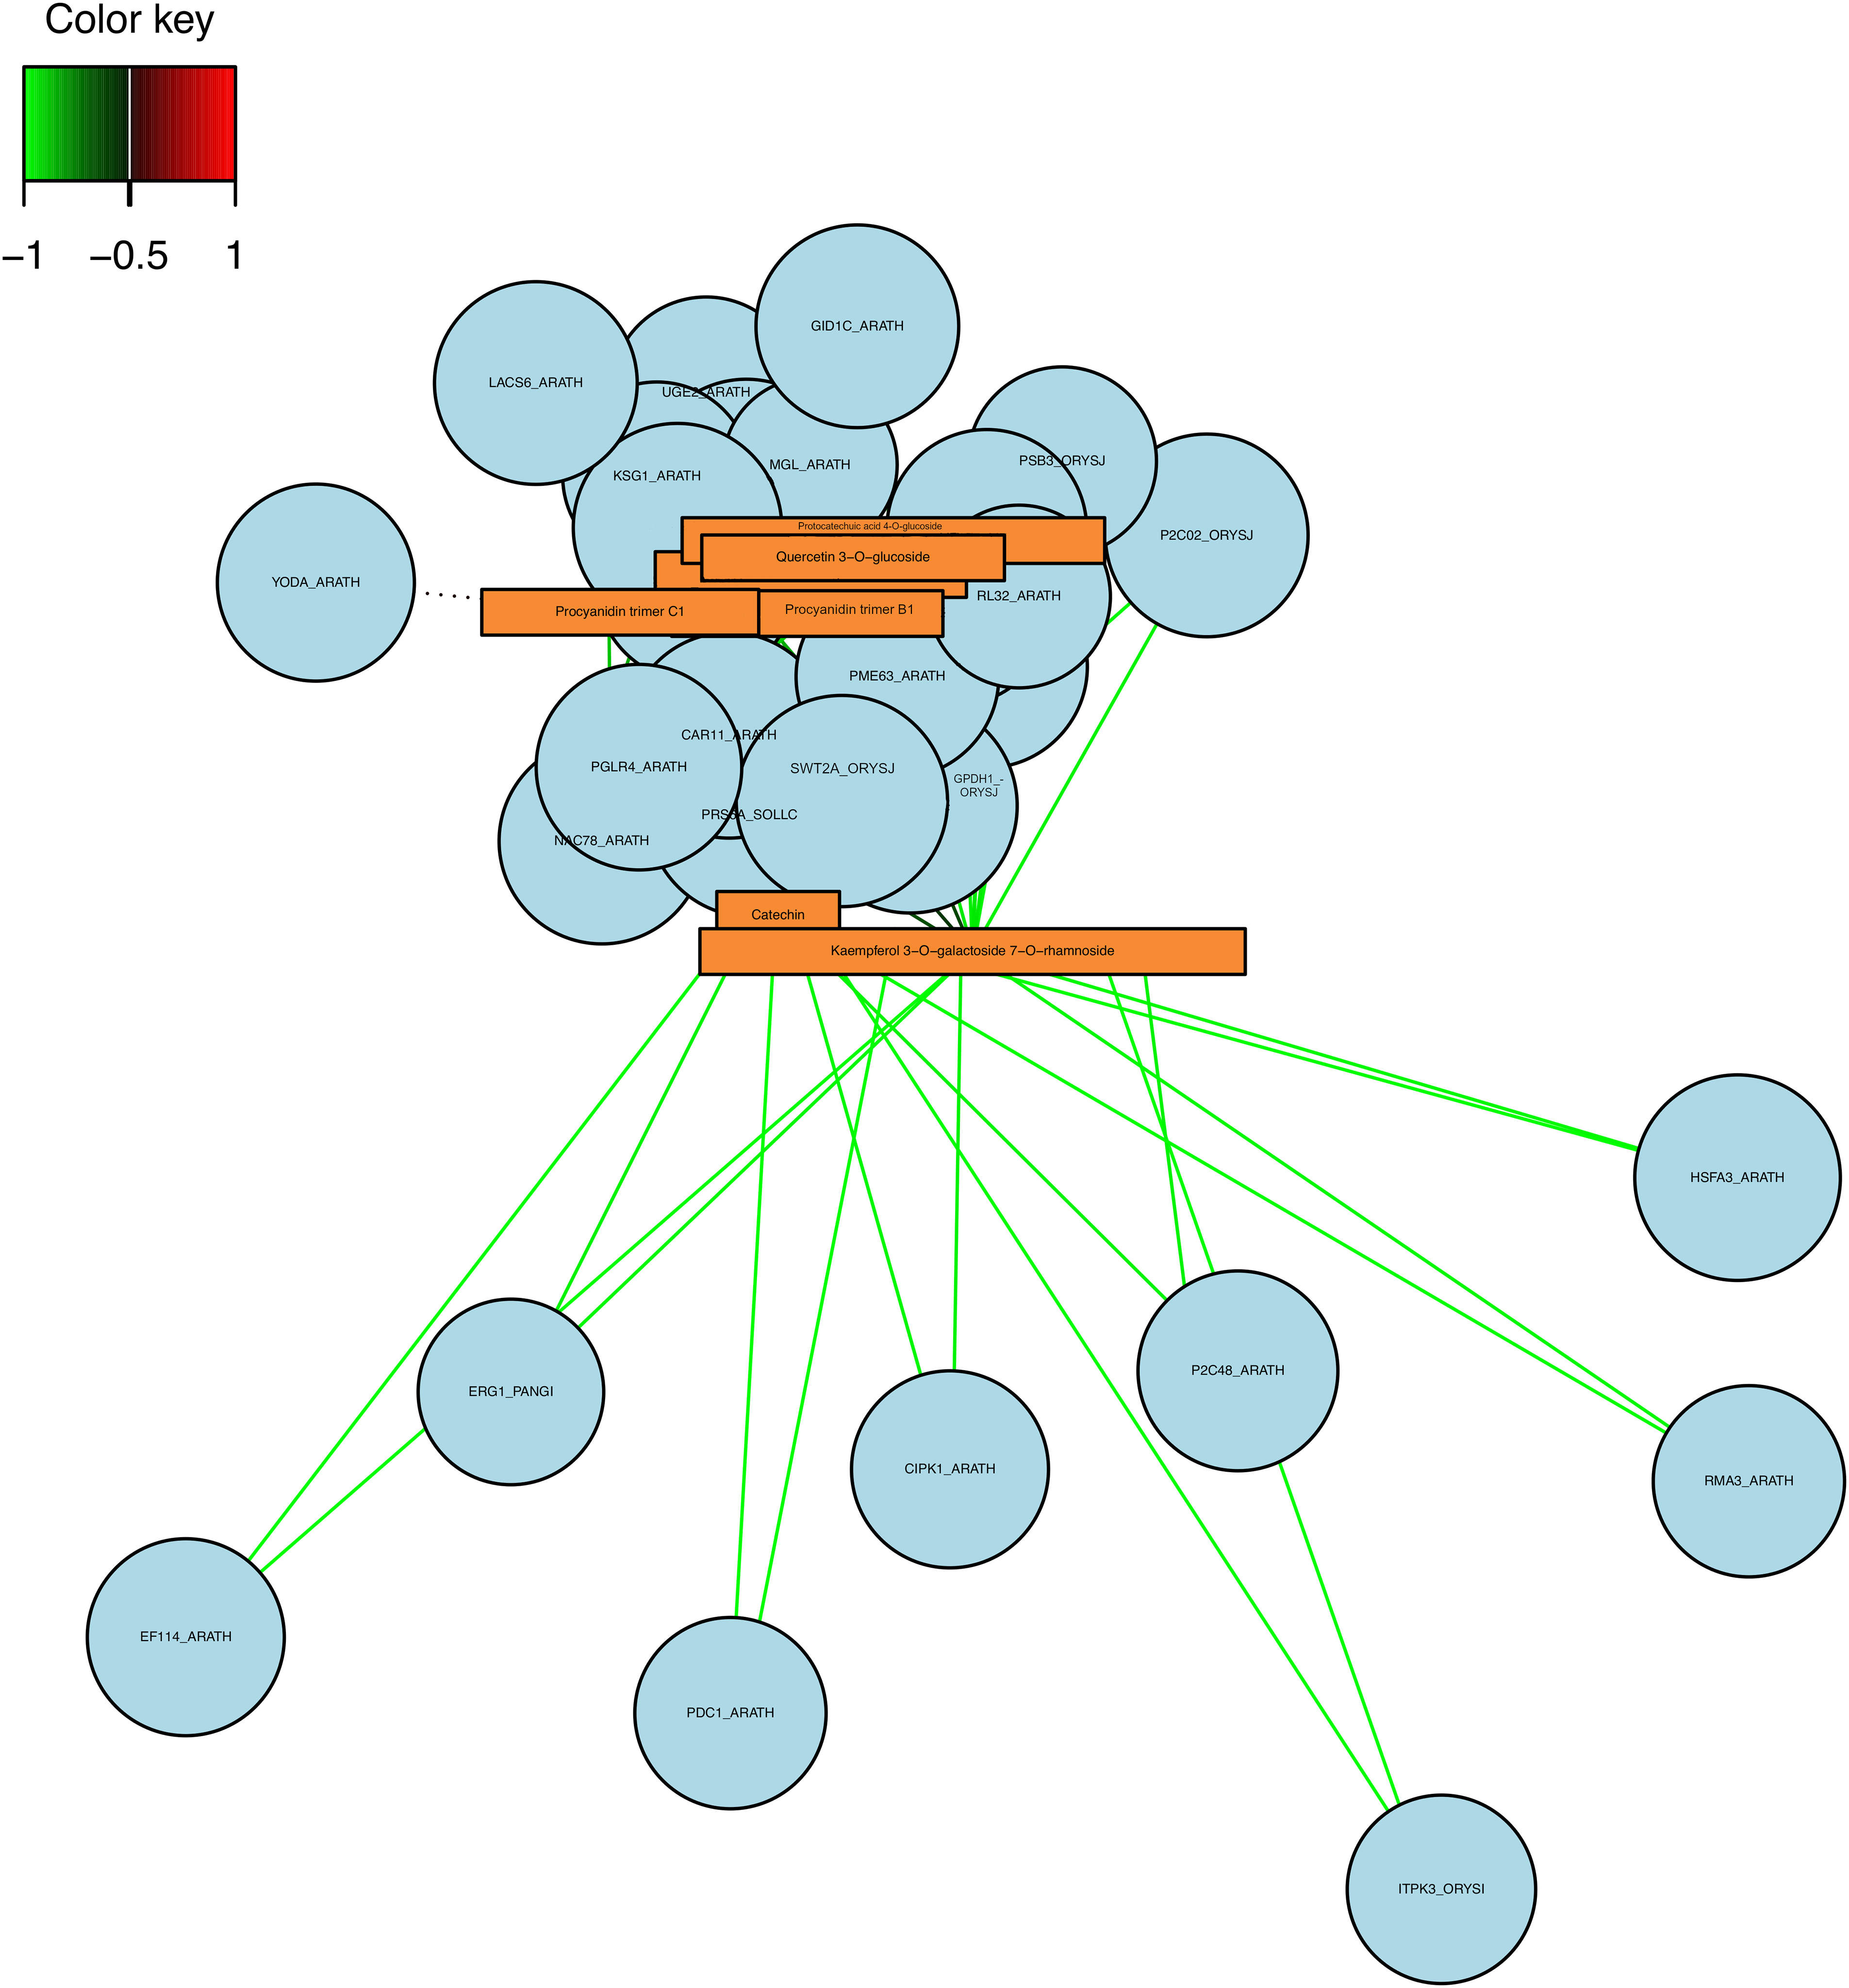
Figure 5: Network analysis between the DEG (circles) and metabolites (rectangle) in the D0 vs. D6 comparison, the color of the lines represents a negative correlation (green) or positive correlation (red)
Finally, on the comparison between the D3 and D6, several metabolites and genes were correlated (Figs. 6 and 7). In this context, correlation circle plot displayed that Ascorbic acid, caffeic acid 4-O-glucoside, o-Coumaric acid, and p-Coumaroyl glucose are highly correlated with the RGLG2_ARATH (E3 ubiquitin-protein ligase RGLG2), C7A13ARATH (Cytochrome P450 72A13), GLAK1_ARATH (Glucuronokinase 1), GSTUK_ARATH (Glutathione S-transferase U20), among others (Fig. 6A). Based on the heatmap, the data were grouped in three (Fig. 6B), identifying the m-Coumaric acid as an independent group and correlated with more than seven genes, presenting the highest correlation with those found in the network analysis (Figs. 6B and 7). Moreover, a complex network was formed between the metabolites and genes differentially expressed. Interestingly, the m-Coumaric acid is correlated with METE2_ORYSJ (5-methyltetrahydropteroyltriglutamate-homocysteine methyltransferase 2) and negatively with the C84A1_ARATH (Cytochrome P450 84A1) (Fig. 7).
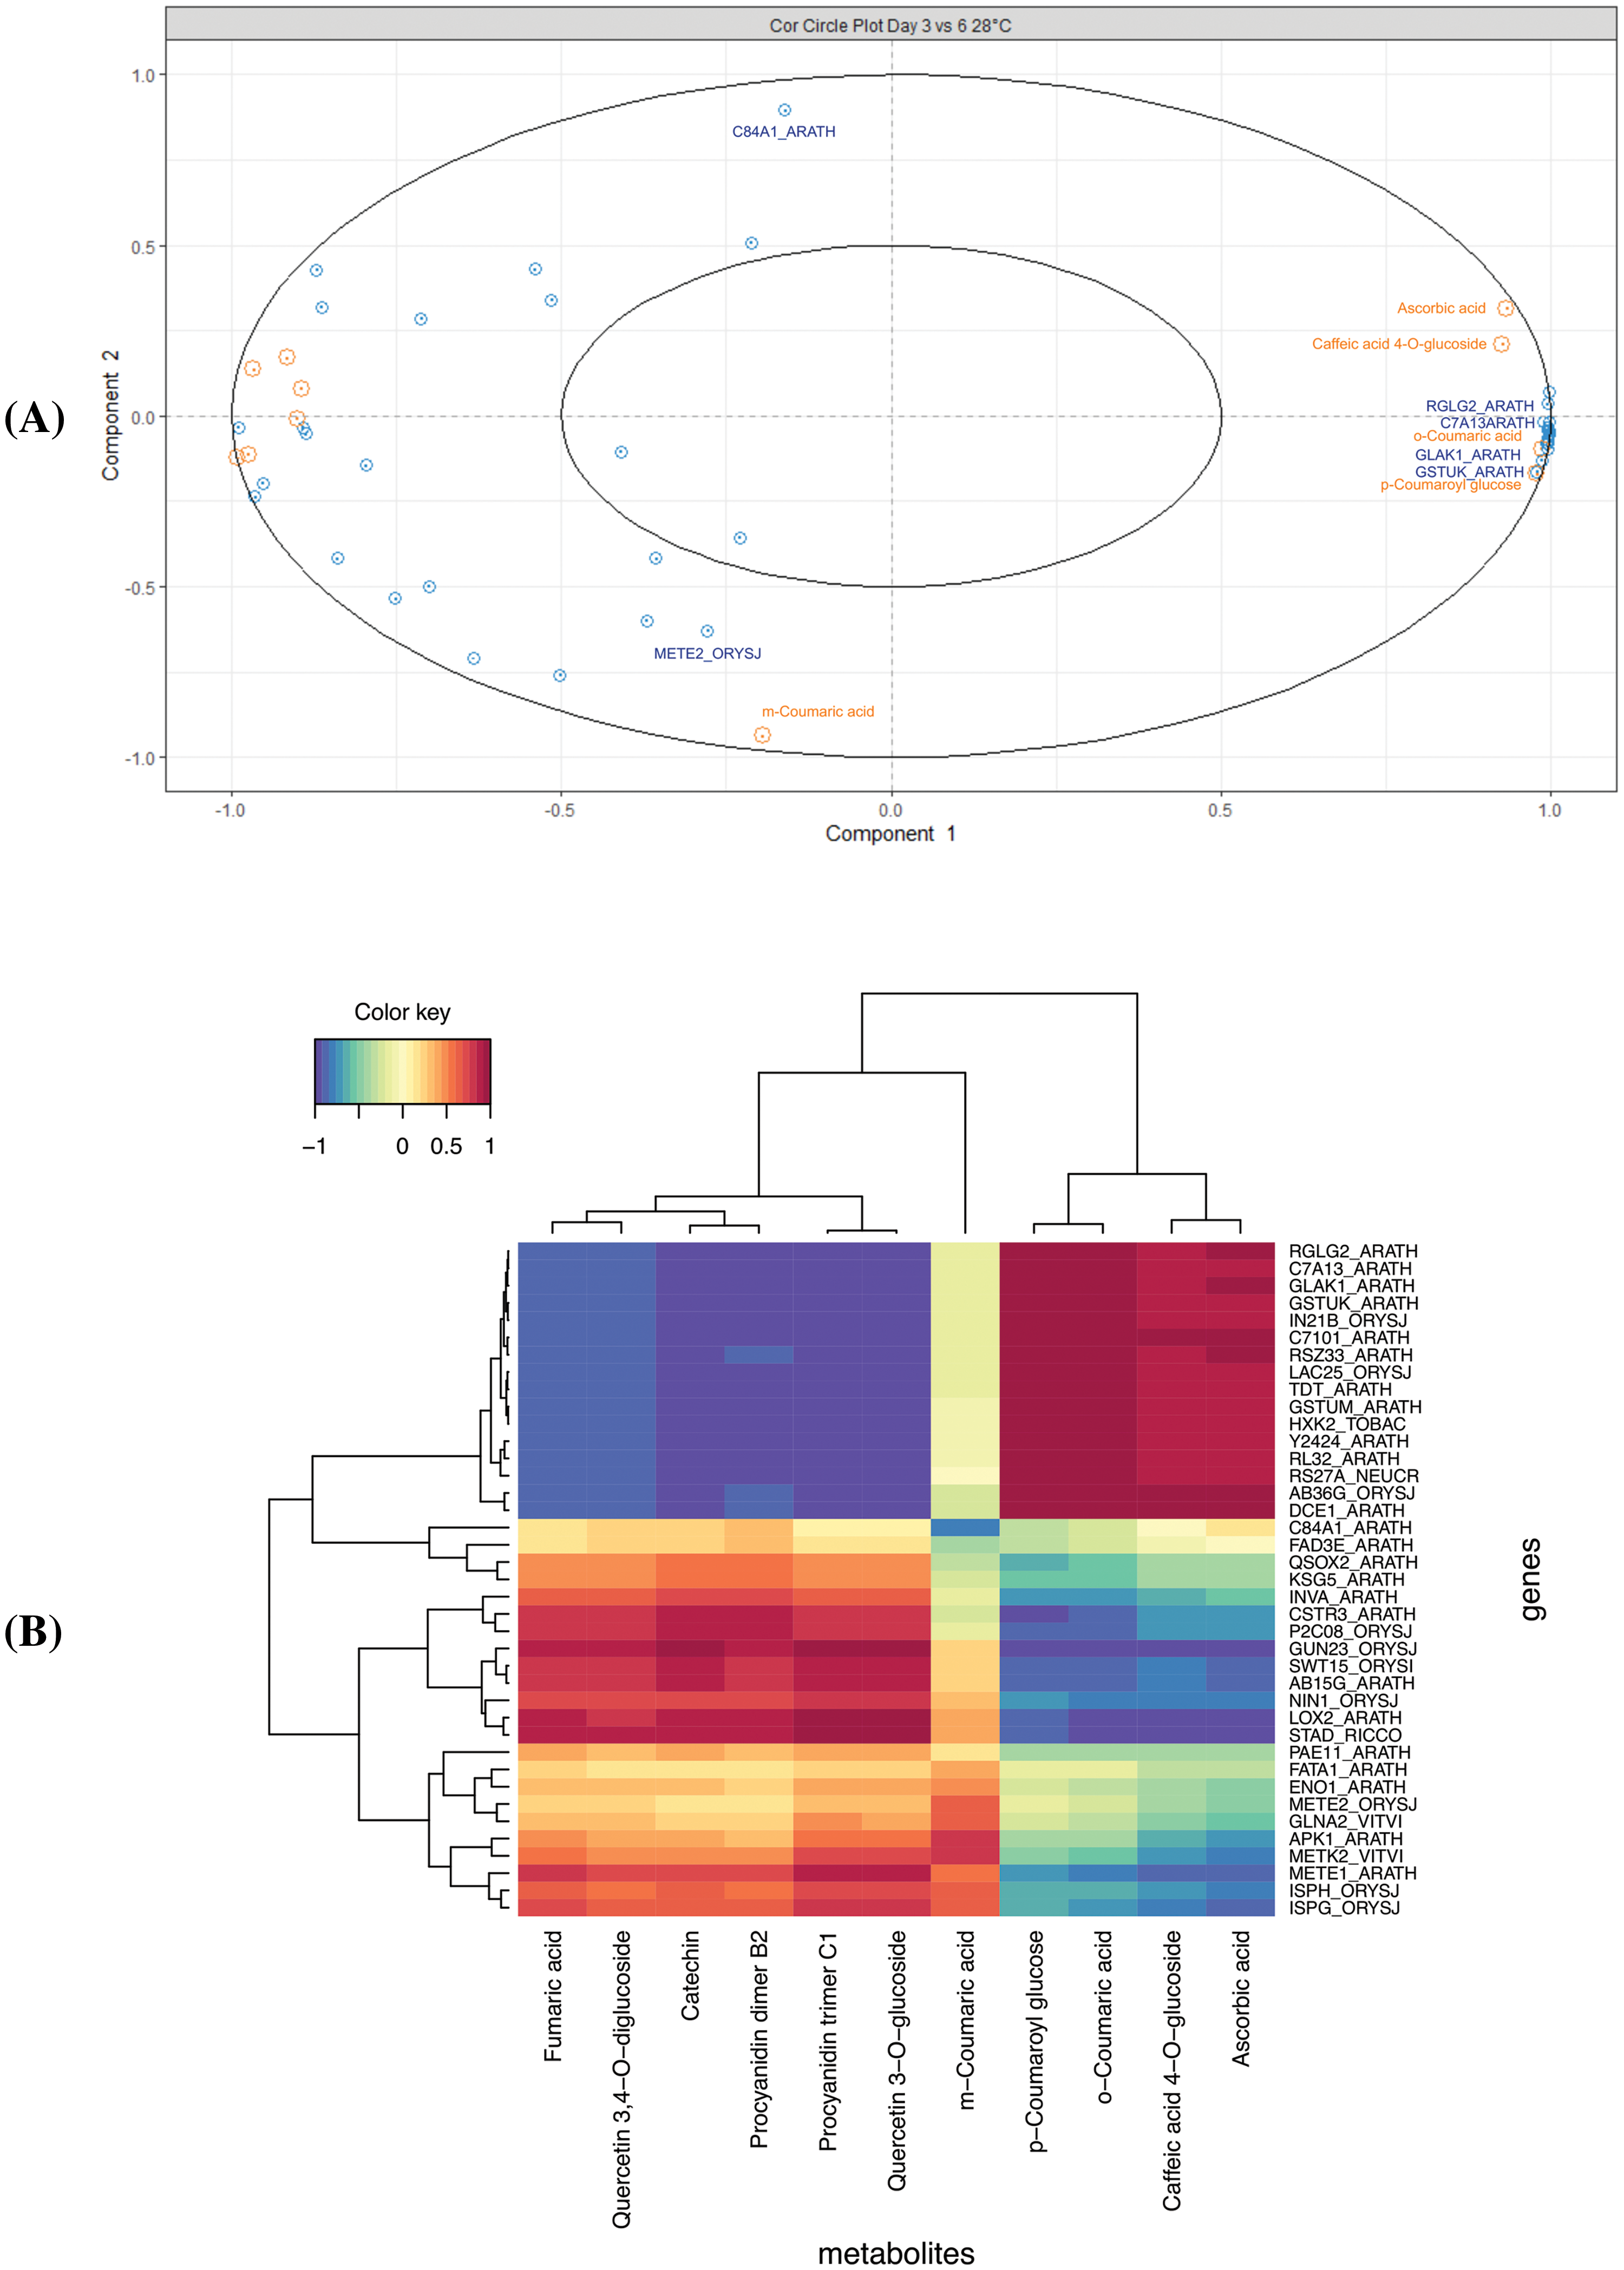
Figure 6: Integration data of DEG and metabolites in the D3 vs. D6 comparison. (A) The correlation circle plot represents the DEG (blue) and metabolites (orange) associated with components one and two (x and y axis), and (B) Heatmap with a hierarchical clustering analysis of the DEG (rows) and the metabolites (columns). Each cell color from red to blue (1 to −1) represents the value of the dataset integration
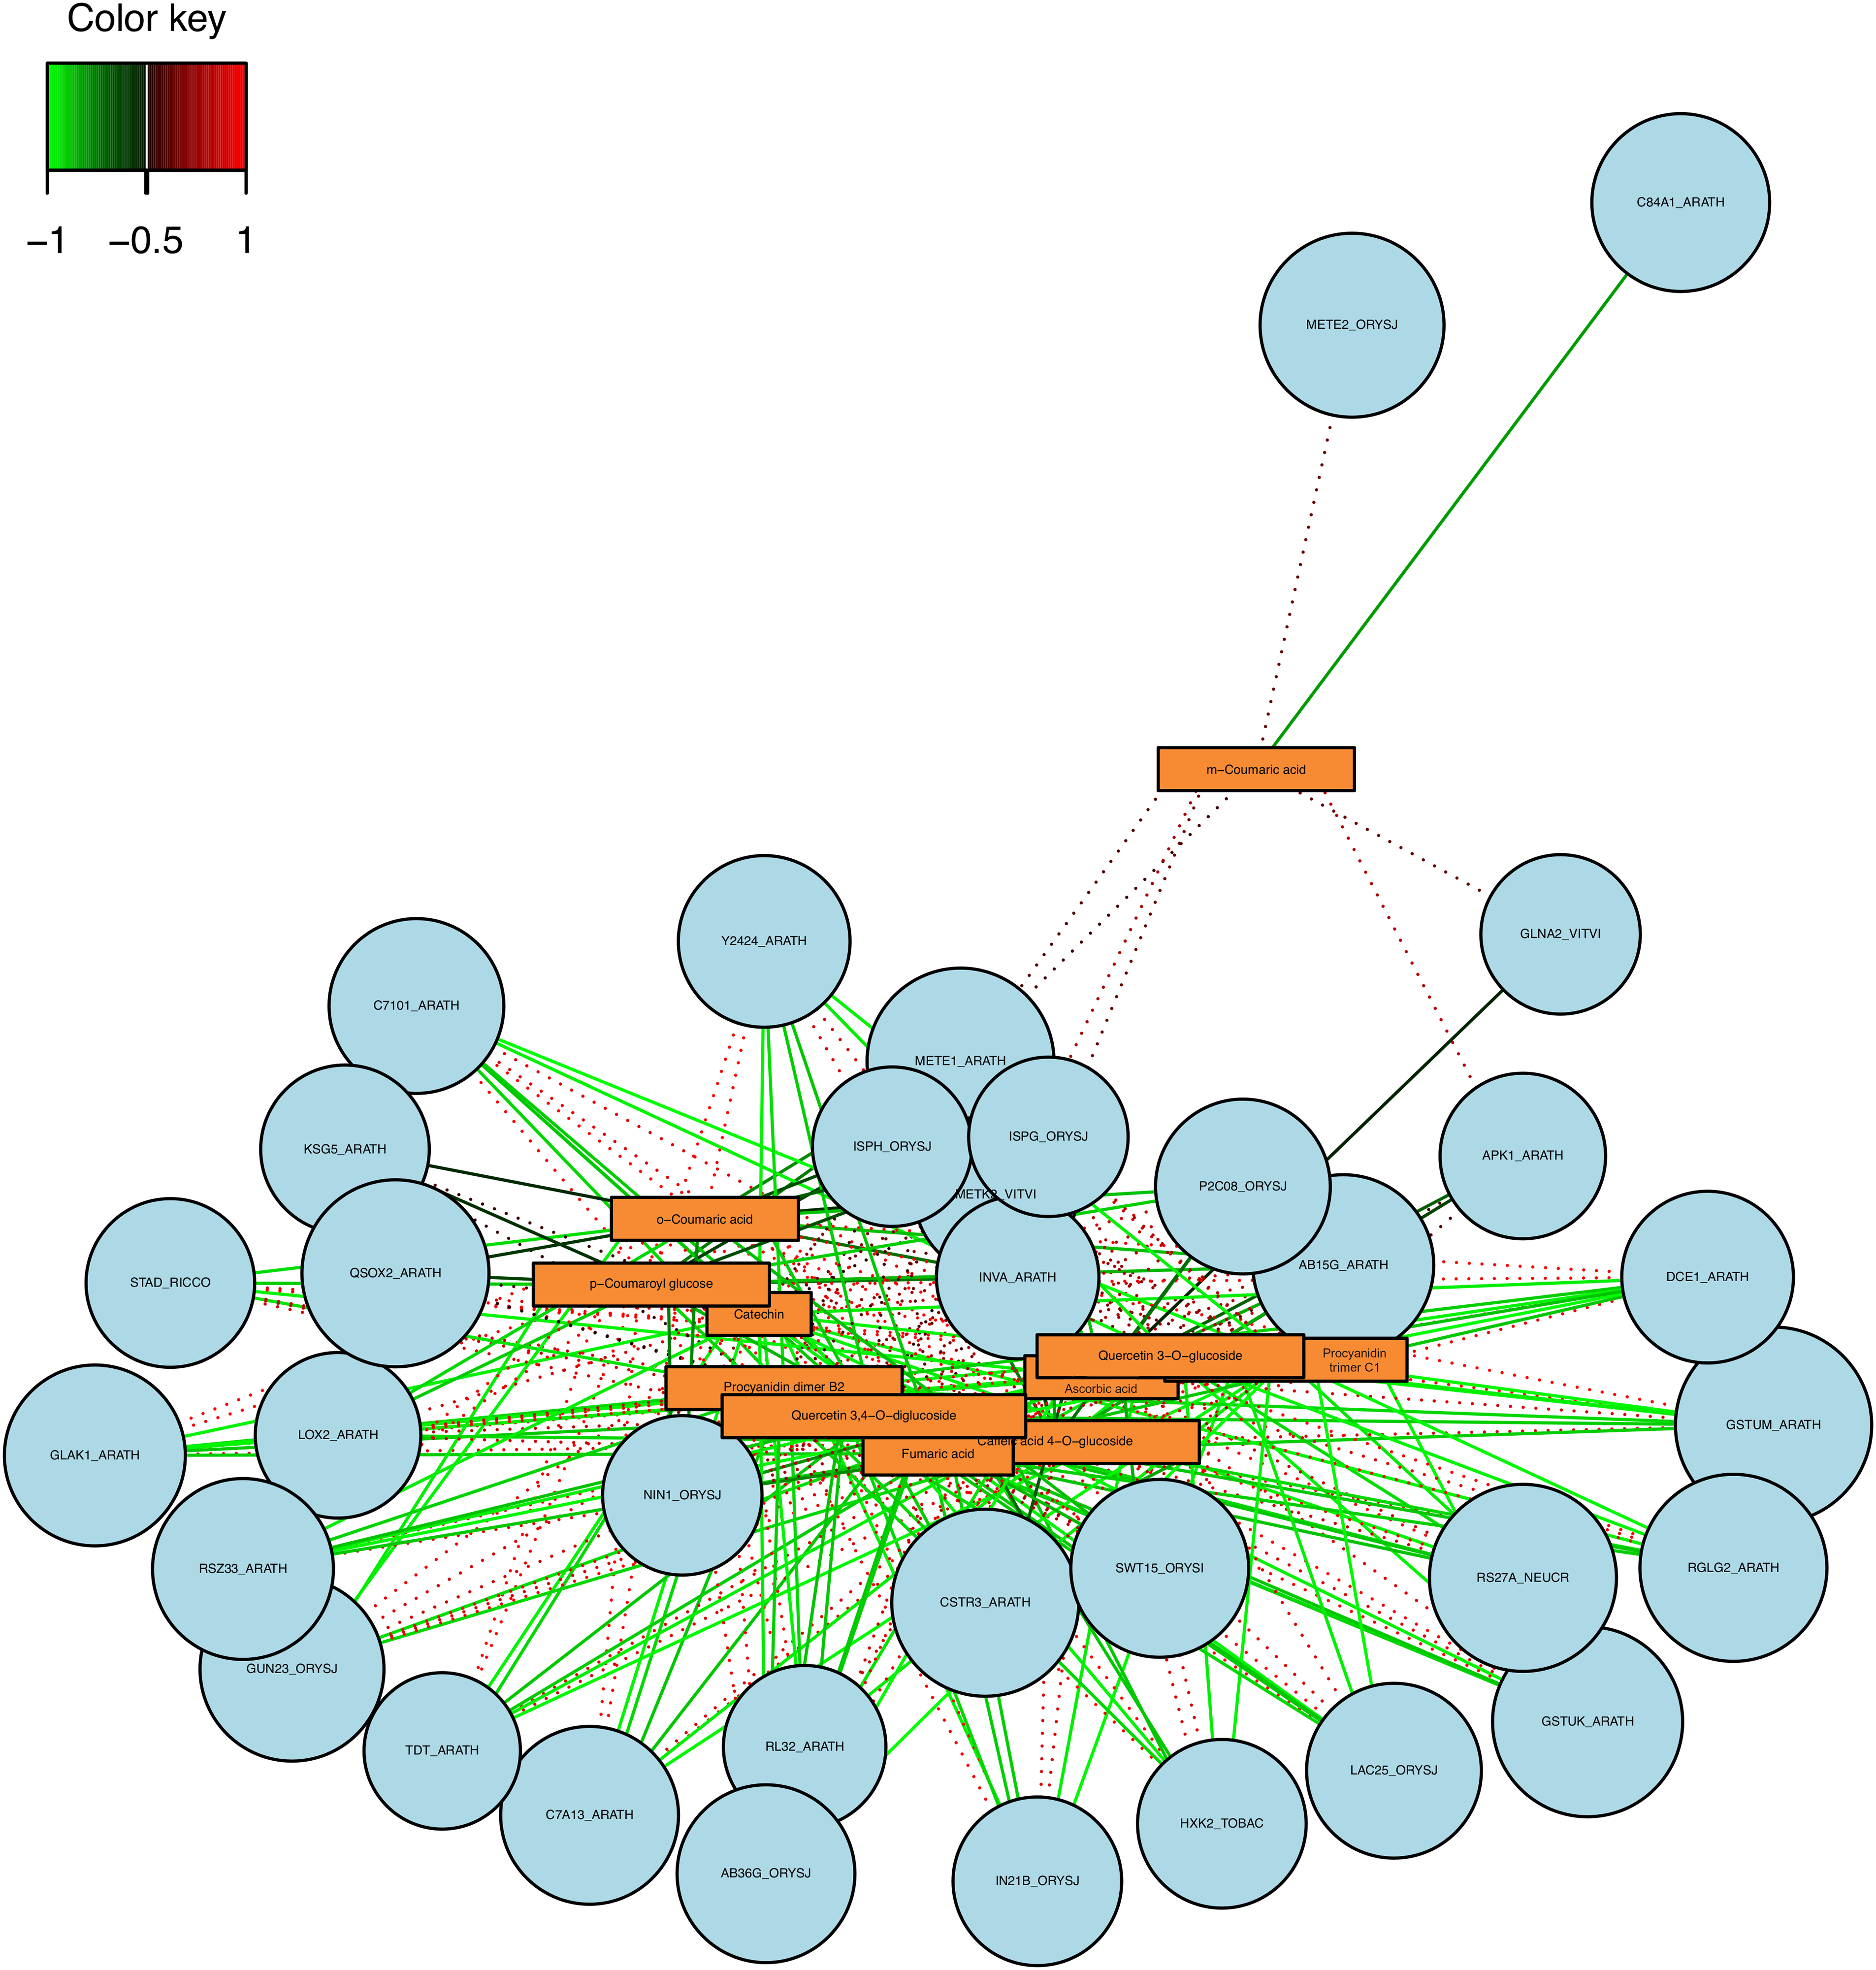
Figure 7: Network analysis between the DEG (circles) and metabolites (rectangle) in the D3 vs. D6 comparison, the color of the lines represents a negative correlation (green) or positive correlation (red)
The metabolite data features are largely positively correlated with one another as well as the genes, while the correlations between the two datasets are mostly negatively correlated (Fig. 8). Then, we performed cross-validation and selected lambda 1 and lambda 2, showing low and dispersed values (data not shown). Taking together all the results, the model-based result was not optimal for this study.
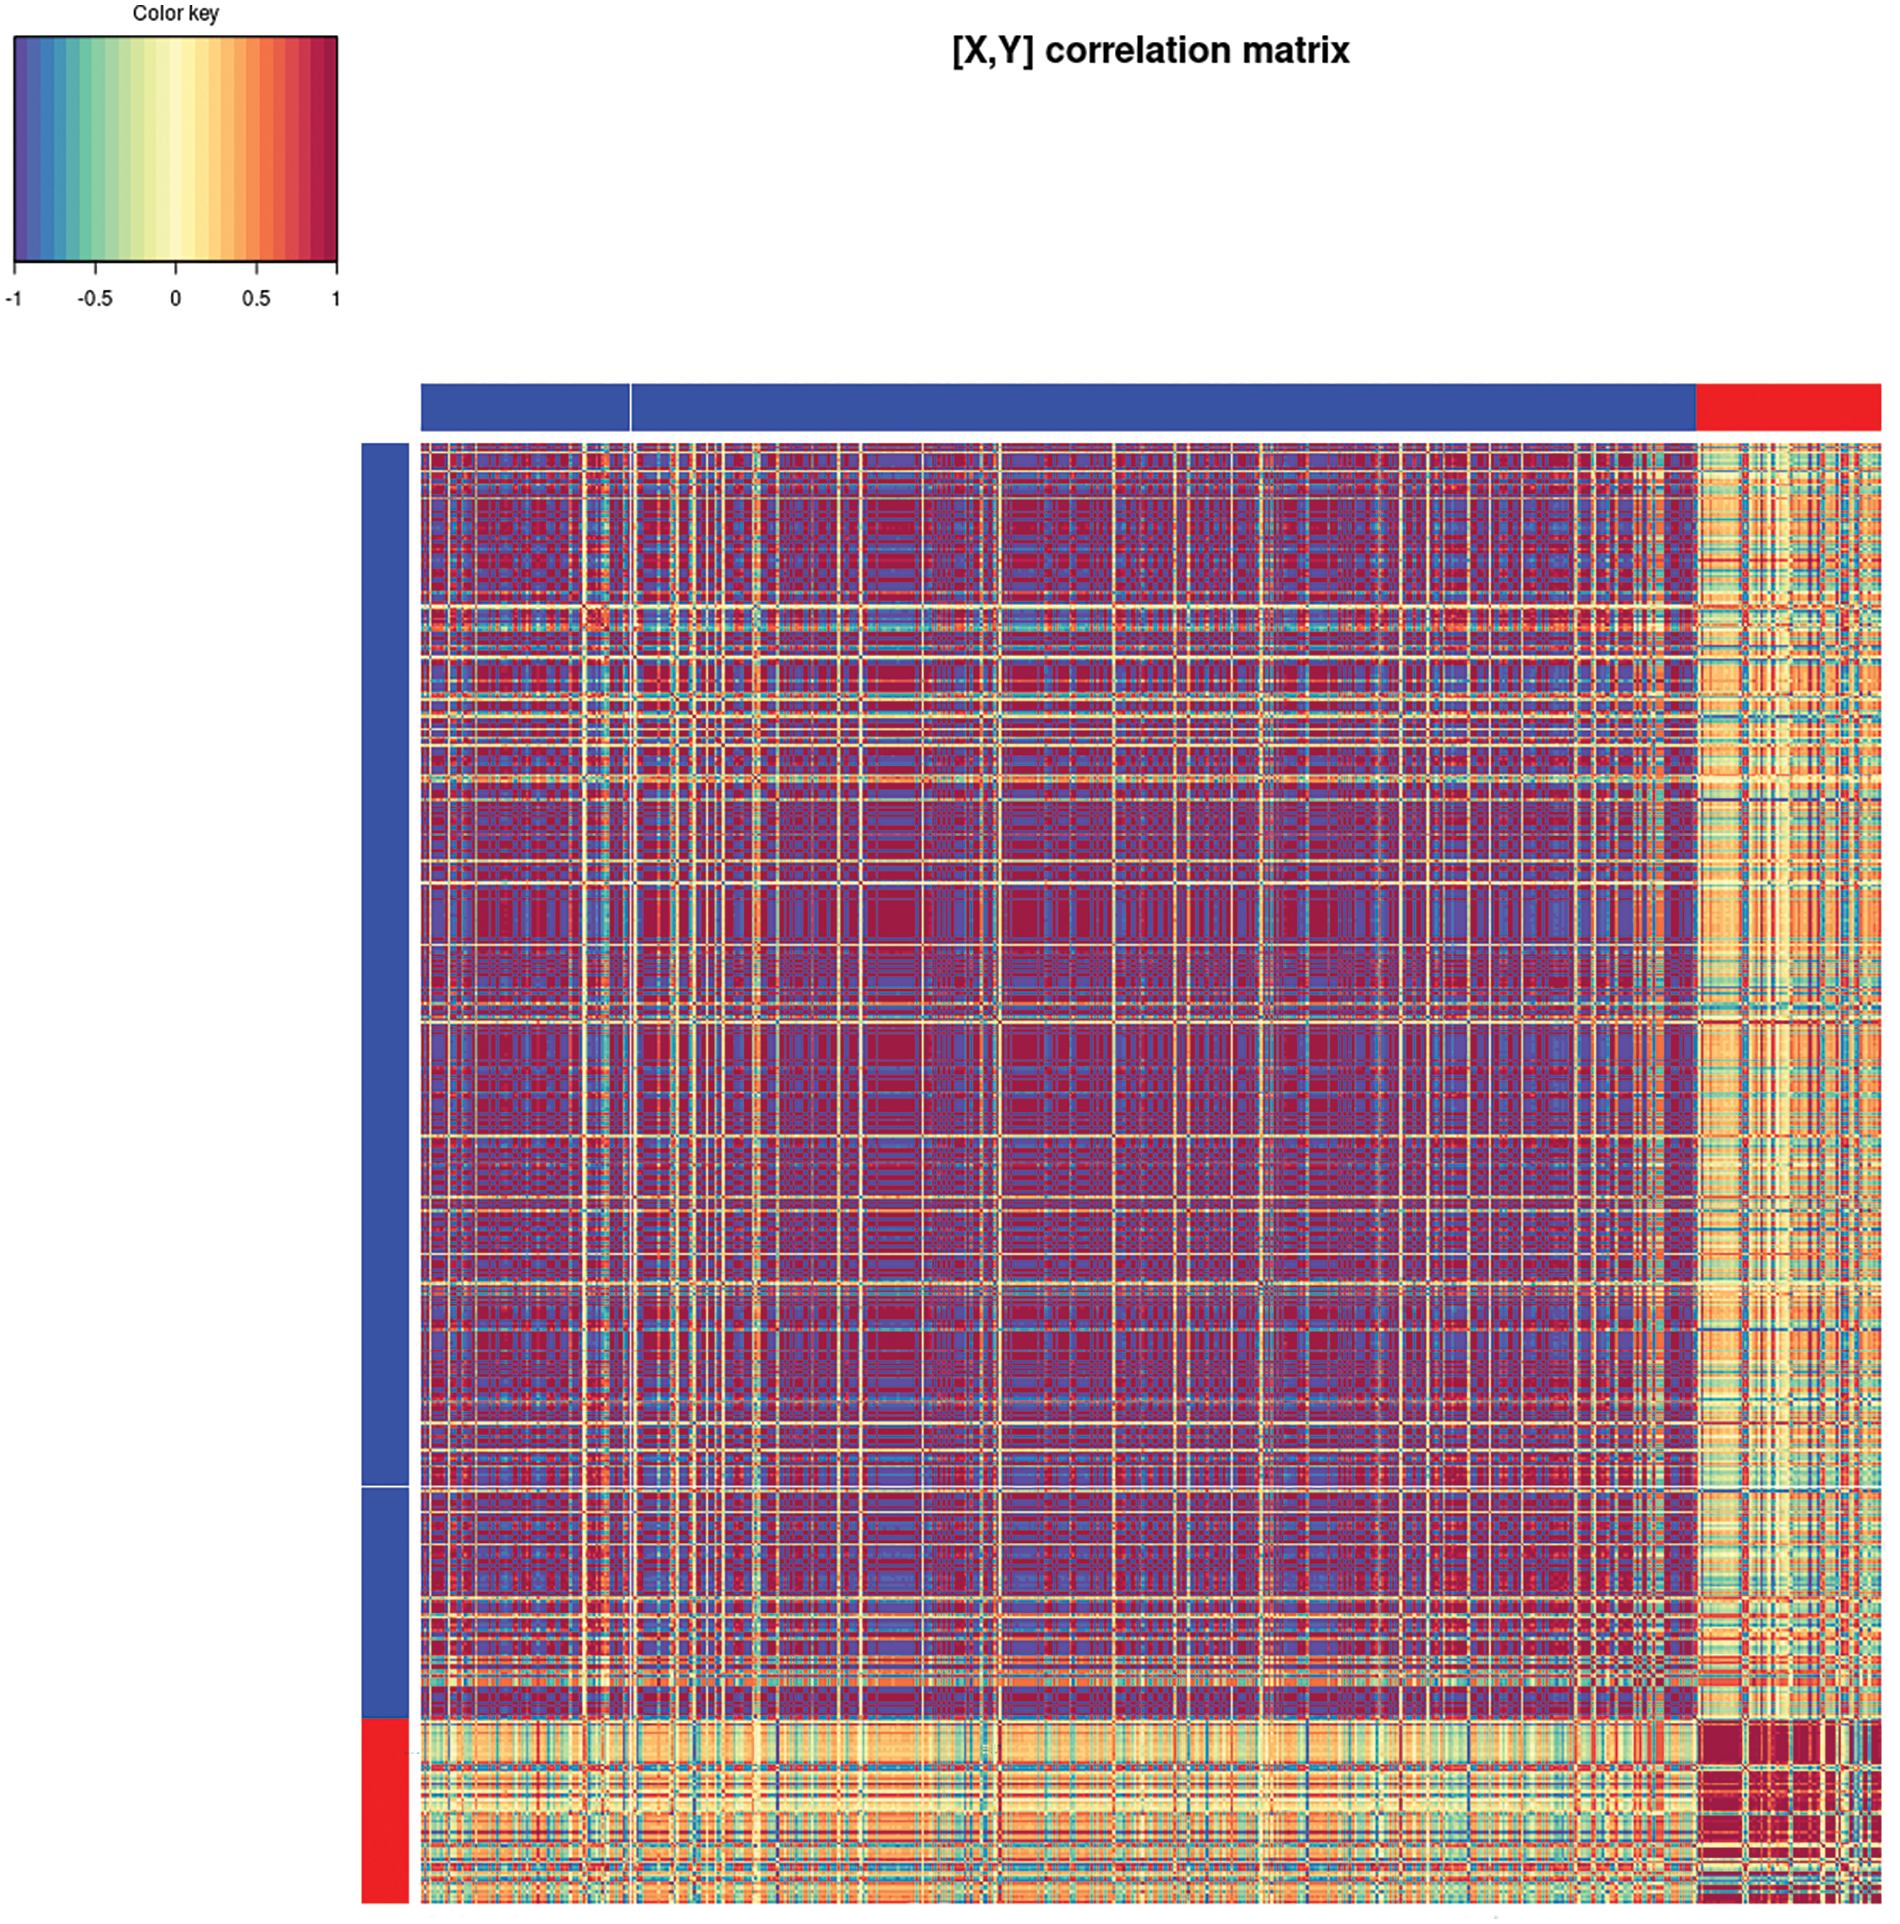
Figure 8: Cross-correlation matrix between the gene and metabolite datasets during soursop ripening. The color key represents the positive (red) or negative (blue) correlation between genes and metabolites
The integration of data by using multivariate statistics have emerged as an important approach to identifying association within two or more type of biomolecules [23]. Genes and metabolites with the same pattern are usually associated with similar biological processes [23]. Therefore, we integrated the transcriptome and metabolite datasets by using a join-pathway and multidimensional statistics approach to identify the function during fruit ripening. The results derived from the multi-data analysis across days of storage showed a correlation-based association in the starch and sucrose metabolism and sugar metabolism from the D0 (physiological maturity) to D3 (ripe) and D6 (onset of senescence).
Sugars are important for fruit quality due to their influence on taste and flavor, two important parameters for consumer acceptance [24]. Moreover, the starch-to-sucrose conversion is also involved in other quality attributes such as color change, accumulation of soluble sugars, and change in volatile compounds [25]. Transcriptome analysis identified the same enriched pathway in soursop fruits stored at 28°C between the different days of storage analyzed [6]. Indeed, the starch content impact the firmness because as the granules break down into sugars, the intercellular gaps expand, causing the fruit to soften [26,27]. Taking all this into account, the soursop fruit ripens quickly leading to quick softening, reaching the senescence in less than 10 d, which is why the starch-to-sucrose pathway is highly associated with this fruit from mature to ripe. Furthermore, the alkaloid pathway was enriched from ripe to the onset of senescence. Alkaloids have been identified in the pulp and peel of soursop fruits at ripe [28]. Based on this information, we can suggest that as the fruit ripens, different pathways are triggers, which are directly associated with the stage of development, and ripening is a key stage for the presence of bioactive compounds in soursop fruits.
On the other hand, several genes and metabolites were correlated among the stages of soursop ripening between D0 and D3. Kaempferol is a flavonoid antioxidant that has been identified in plants and regulates lipid and glucose metabolism [29], which was correlated with the UBL5_ARATH, a gene that participates in growth and plant development as well as in response to auxin [30]. Probably, these association is related to the development of fruit, as the fruit start to ripen, the sucrose pathways are triggered, as well as the UBL5_ARATH and the Kaempferol 3-Q-galactoside and dihydrocaffeic acid compounds. Indeed, the network and heatmap analysis showed a high association between metabolites with genes related to zinc, which is an essential micronutrient that is involved in plant growth in development [31]. Moreover, the metabolite Procyanidin C1 was associated with thioredoxin, which is a small protein involved in cellular redox processes and chilling tolerance in banana fruits [32]. This metabolite and gene are both located in the plasma membrane of the cell, suggesting that the interaction of these has the ability to modulate the membrane structure in soursop fruits.
In the case of the D0 vs. D6 comparison, only the Procyanidin trimmer C1 showed a positive correlation with the plant development, such as the YODA_ARATH, related with the root development and auxin regulation [33], MGL_ARATH involved in the seed development [34], which is associated with the biosynthesis and signal transduction of ripening-related hormones, pigment metabolism, and texture change [35]. A possible explanation of this is that hormones, specifically the auxins, play a key role during fruit development, their biosynthesis decreases across ripening and directly impacts the ethylene production, which coincides with the climacteric peak of soursop fruit that is on day 6 of storage [4]. Lastly, the C7A13ARATH and C84A1_ARATH genes coding for the Cytochrome P450, which are involved in alkaloid biosynthesis [36], were enriched metabolic pathway from ripe to the onset of senescence. Furthermore, the cysteine and methionine metabolism were also significantly enriched, indicating an association with the MET2-ORYSJ gene, which is involved in methionine formation, an intermediary for the ethylene biosynthesis [37]. These results coincide with the climacteric peak of soursop fruits in the day 6 of storage [4]. Therefore, these results suggests that MET2-ORYSJ gene regulate the methionine biosynthesis and thus, the ethylene production. Network-driven approach by integrating metabolites and DEG datasets showed that m-Coumaric is correlated with METE2_ORYSJ and C84A1_ARATH, suggesting that this compound is regulated by the expression of these genes during ripening from mature to ripe.
The findings of this study may be valuable in maintaining the quality and safety of soursop fruits by monitoring a gene or metabolite, helping to verify the stage of ripening. This will benefit the producers export their fruit to international markers. Additionally, this information can be used to guide in the formulation of functional products to satisfy market demands and consumer preferences. It can also be used to design crops with certain features that directly address nutritional requirements.
The sPLS method was the most accurate way to integrate the data from transcriptome (RNA-Seq) and the phenolic compounds of soursop fruits during ripening. The main enriched metabolic pathways were starch and sucrose metabolism, isoquinoline alkaloid biosynthesis, fatty acid biosynthesis as well as cysteine and methionine metabolism. Network analysis revealed the correlation between phenol compounds and genes involved in fruit quality such as Kaempferol 3-Q-galactoside, Procyanidin C1, Procyanidin trimmer C1, and m-Coumaric, among others as well as UBL5_ARATH, FTSH8_ORYSJ, ZIP4_ARATH, TRL31_ORYSJ, YODA_ARATH, MGL_ARATH, PRS6_SOLLC, C7A13ARATH, C84A1_ARATH and MET2-ORYSJ genes, among others.
Acknowledgement: The authors thank to Consejo Nacional de Humanidades, Ciencias y Tecnologías (CONAHCYT) for the postdoctoral fellowship granted to V.A.O.J.
Funding Statement: This project has received funding from CONAHCYT by the grant Ciencia Básica y/o Ciencia de Frontera Modalidad Paradigmas y Controversias de la Ciencia, Grant Number 319996: “Análisis integral de datos transcriptómicos y metabolómicos asociados a la calidad de los frutos de guanábana (Annona muricata L.) durante almacenamiento poscosecha”.
Author Contributions: The authors confirm contribution to the paper as follows: Yolotzin Apatzingán Palomino-Hermosillo: data curation, formal analysis, writing—original draft; Ángel Elpidio Díaz-Jasso: data acquisition, validation; Rosendo Balois-Morales: data curation, validation; Verónica Alhelí Ochoa-Jiménez: methodology, validation, writing—review and editing; Pedro Ulises Bautista-Rosales: data acquisition, methodology, resources; Guillermo Berumen-Varela: conceptualization, data analysis, funding acquisition, writing—review and editing. All authors reviewed the results and approved the final version of the manuscript.
Availability of Data and Materials: The data of this manuscript is available upon request.
Ethics Approval: Not applicable.
Conflicts of Interest: The authors declare that they have no conflicts of interest to report regarding the present study.
References
1. Anaya-Dyck JM, Hernández-Oñate MÁ, Tafolla-Arellano JC, Báez-Sañudo R, Gutiérrez-Martínez P, Tiznado-Hernández ME. La cadena productiva de guanábana: una opción para el desarrollo económico en compostela, Nayarit. Estud Soc Rev. 2021;31(57):2–40 (In Spanish). doi:10.24836/es.v31i57.1048. [Google Scholar] [CrossRef]
2. Hernández-Fuentes LM, Montalvo-González E, García-Magaña MDL, Anaya-Esparza LM, Nolasco González Y, Villagrán Z, et al. Current situation and perspectives of fruit annonaceae in Mexico: biological and agronomic importance and bioactive properties. Plants. 2021;11(1):7. doi:10.3390/plants11010007. [Google Scholar] [PubMed] [CrossRef]
3. Berumen-Varela G, Hernández-Oñate MA, Tiznado-Hernández ME. Utilization of biotechnological tools in soursop (Annona muricata L.). Sci Hortic. 2019;245:269–73. doi:10.1016/j.scienta.2018.10.028. [Google Scholar] [CrossRef]
4. Márquez Cardoso CJ, Villacorta Lozano V, Yepes Betancur DP, Ciro Velásquez HJ, Cartagena Valenzuela JR. Physiological and physico-chemical characterization of the soursop fruit (Annona muricata L. cv. Elita). Rev Fac Nal Agr Medellín. 2012;65(1):6477–86. [Google Scholar]
5. Osorio S, Scossa F, Fernie A. Molecular regulation of fruit ripening. Front Plant Sci. 2013;4:198. [Google Scholar] [PubMed]
6. Palomino-Hermosillo YA, Berumen-Varela G, Ochoa-Jiménez VA, Balois-Morales R, Jiménez-Zurita JO, Bautista-Rosales PU, et al. Transcriptome analysis of soursop (Annona muricata L.) fruit under postharvest storage identifies genes families involved in ripening. Plants. 2022;11(14):1798. doi:10.3390/plants11141798. [Google Scholar] [PubMed] [CrossRef]
7. Coria-Téllez AV, Montalvo-Gónzalez E, Yahia EM, Obledo-Vázquez EN. Annona muricata: a comprehensive review on its traditional medicinal uses, phytochemicals, pharmacological activities, mechanisms of action and toxicity. Arab J Chem. 2018;11(5):662–91. doi:10.1016/j.arabjc.2016.01.004. [Google Scholar] [CrossRef]
8. Mutakin M, Fauziati R, Fadhilah FN, Zuhrotun A, Amalia R, Hadisaputri YE. Pharmacological activities of soursop (Annona muricata Lin.). Molecules. 2022;27(4):1201. doi:10.3390/molecules27041201. [Google Scholar] [PubMed] [CrossRef]
9. Jimenez VM, Gruschwitz M, Schweiggert RM, Carle R, Esquivel P. Identification of phenolic compounds in soursop (Annona muricata) pulp by high-performance liquid chromatography with diode array and electrospray ionization mass spectrometric detection. Food Res Int. 2014;65:42–6. doi:10.1016/j.foodres.2014.05.051. [Google Scholar] [CrossRef]
10. Ochoa-Jiménez VA, Berumen-Varela G, Pérez-Ramírez IF, Balois-Morales R, Rubio-Melgarejo A, Bautista-Rosales PU. Metabolomics approach for phenolic compounds profiling of soursop (Annona muricata L.) fruit during postharvest storage. Metabolomics. 2024 Feb 25;20(2):26. doi:10.1007/s11306-024-02093-3. [Google Scholar] [PubMed] [CrossRef]
11. Cervantes-Gracia K, Chahwan R, Husi H. Integrative OMICS data-driven procedure using a derivatized meta-analysis approach. Front Genet. 2022;13:1–17. [Google Scholar]
12. Fortes AM, Agudelo-Romero P, Silva MS, Ali K, Sousa L, Maltese F, et al. Transcript and metabolite analysis in Trincadeira cultivar reveals novel information regarding the dynamics of grape ripening. BMC Plant Biol. 2011;11:1–35. [Google Scholar]
13. Umer MJ, Bin Safdar L, Gebremeskel H, Zhao S, Yuan P, Zhu H, et al. Identification of key gene networks controlling organic acid and sugar metabolism during watermelon fruit development by integrating metabolic phenotypes and gene expression profiles. Hortic Res. 2020;7(1):193. doi:10.1038/s41438-020-00416-8. [Google Scholar] [PubMed] [CrossRef]
14. Zhang Z, Tian C, Zhang Y, Li C, Li X, Yu Q, et al. Transcriptomic and metabolomic analysis provides insights into anthocyanin and procyanidin accumulation in pear. BMC Plant Biol. 2020;20(1):1–14. [Google Scholar]
15. Xin M, Li C, He X, Li L, Yi P, Tang Y, et al. Integrated metabolomic and transcriptomic analyses of quality components and associated molecular regulation mechanisms during passion fruit ripening. Postharvest Biol Technol. 2021;180:111601. doi:10.1016/j.postharvbio.2021.111601. [Google Scholar] [CrossRef]
16. Lê Cao KA, Welham ZM. Multivariate data integration using R: methods and applications with the mixOmics package. New York: Chapman and Hall/CRC Press; 2021. [Google Scholar]
17. Rohart F, Gautier Bît, Singh A, Lê Cao KA. mixOmics: an R package for ‘omics feature selection and multiple data integration. PLoS Comput Biol. 2017;13(11):e1005752. doi:10.1371/journal.pcbi.1005752. [Google Scholar] [PubMed] [CrossRef]
18. Favre L, Hunter DA, O’Donoghue EM, Erridge ZA, Napier NJ, Somerfield SD, et al. Integrated multi-omic analysis of fruit maturity identifies biomarkers with drastic abundance shifts spanning the harvest period in ‘Royal Gala’apple. Postharvest Biol Technol. 2022;193:112059. doi:10.1016/j.postharvbio.2022.112059. [Google Scholar] [CrossRef]
19. Núñez-Lillo G, Ponce E, Arancibia-Guerra C, Carpentier S, Carrasco-Pancorbo A, Olmo-García L, et al. A multiomics integrative analysis of color de-synchronization with softening of ‘Hass’ avocado fruit: a first insight into a complex physiological disorder. Food Chem. 2023;408:135215. doi:10.1016/j.foodchem.2022.135215. [Google Scholar] [PubMed] [CrossRef]
20. Love M, Anders S, Huber W. Differential analysis of count data-the DESeq2 package. Genome Biol. 2014;15(550):10–1186. [Google Scholar]
21. Duarte GT, Volkova PY, Geras’kin SA. A pipeline for non-model organisms for de novo transcriptome assembly, annotation, and gene ontology analysis using open tools: case study with Scots pine. Bio Protoc. 2021;11(3):e3912. [Google Scholar] [PubMed]
22. Pang Z, Chong J, Zhou G, de Lima Morais DA, Chang L, Barrette M, et al. MetaboAnalyst 5.0: narrowing the gap between raw spectra and functional insights. Nucleic Acids Res. 2021;49(W1):W388–96. doi:10.1093/nar/gkab382. [Google Scholar] [PubMed] [CrossRef]
23. Rai M, Rai A, Mori T, Nakabayashi R, Yamamoto M, Nakamura M, et al. Gene-metabolite network analysis revealed tissue-specific accumulation of therapeutic metabolites in Mallotus japonicus. Int J Mol Sci. 2021;22(16):8835. doi:10.3390/ijms22168835. [Google Scholar] [PubMed] [CrossRef]
24. Durán-Soria S, Pott DM, Osorio S, Vallarino JG. Sugar signaling during fruit ripening. Front Plant Sci. 2020;11:564917. doi:10.3389/fpls.2020.564917. [Google Scholar] [PubMed] [CrossRef]
25. Cordenunsi-Lysenko BR, Nascimento JRO, Castro-Alves VC, Purgatto E, Fabi JP, Peroni-Okyta FHG. The starch is (not) just another brick in the wall: the primary metabolism of sugars during banana ripening. Front Plant Sci. 2019;10:391. doi:10.3389/fpls.2019.00391. [Google Scholar] [PubMed] [CrossRef]
26. Wang H, Wang J, Mujumdar AS, Jin X, Liu ZL, Zhang Y, et al. Effects of postharvest ripening on physicochemical properties, microstructure, cell wall polysaccharides contents (pectin, hemicellulose, cellulose) and nanostructure of kiwifruit (Actinidia deliciosa). Food Hydrocol. 2021;118:106808. doi:10.1016/j.foodhyd.2021.106808. [Google Scholar] [CrossRef]
27. Yu J, Tseng Y, Pham K, Liu M, Beckles DM. Starch and sugars as determinants of postharvest shelf life and quality: some new and surprising roles. Curr Opin Biotechnol. 2022;78:102844. doi:10.1016/j.copbio.2022.102844. [Google Scholar] [PubMed] [CrossRef]
28. Aguilar-Hernández G, Zepeda-Vallejo LG, de García-Magaña MDL, Vivar-Vera MDLÁ, Pérez-Larios A, Girón-Pérez MI, et al. Extraction of alkaloids using ultrasound from pulp and by-products of soursop fruit (Annona muricata L.). Appl Sci. 2020;10(14):4869. doi:10.3390/app10144869. [Google Scholar] [CrossRef]
29. Silva dos Santos J, Goncalves Cirino JP, de Oliveira Carvalho P, Ortega MM. The pharmacological action of kaempferol in central nervous system diseases: a review. Front Pharmacol. 2021;11:565700. doi:10.3389/fphar.2020.565700. [Google Scholar] [PubMed] [CrossRef]
30. Watanabe E, Mano S, Nishimura M, Yamada K. AtUBL5 regulates growth and development through pre-mRNA splicing in Arabidopsis thaliana. PLoS One. 2019;14(11):e0224795. doi:10.1371/journal.pone.0224795. [Google Scholar] [PubMed] [CrossRef]
31. Tan L, Qu M, Zhu Y, Peng C, Wang J, Gao D, et al. ZINC TRANSPORTER5 and ZINC TRANSPORTER9 function synergistically in zinc/cadmium uptake. Plant Physiol. 2020;183(3):1235–49. doi:10.1104/pp.19.01569. [Google Scholar] [PubMed] [CrossRef]
32. Wu F, Li Q, Yan H, Zhang D, Jiang G, Jiang Y, et al. Characteristics of three thioredoxin genes and their role in chilling tolerance of harvested banana fruit. Int J Mol Sci. 2016;17(9):1526. doi:10.3390/ijms17091526. [Google Scholar] [PubMed] [CrossRef]
33. Smékalová V, Luptovčiak I, Komis G, Šamajová O, Ovečka M, Doskočilová A, et al. Involvement of YODA and mitogen activated protein kinase 6 in Arabidopsis post-embryogenic root development through auxin up-regulation and cell division plane orientation. New Phytol. 2014;203(4):1175–93. doi:10.1111/nph.2014.203.issue-4. [Google Scholar] [CrossRef]
34. Canton M, Drincovich MF, Lara MV, Vizzotto G, Walker RP, Famiani F, et al. Metabolism of stone fruits: reciprocal contribution between primary metabolism and cell wall. Front Plant Sci. 2020;11:1054. doi:10.3389/fpls.2020.01054. [Google Scholar] [PubMed] [CrossRef]
35. Jia W, Liu G, Zhang P, Li H, Peng Z, Wang Y, et al. The ubiquitin-26S proteasome pathway and its role in the ripening of fleshy fruits. Int J Mol Sci. 2023;24(3):2750. doi:10.3390/ijms24032750. [Google Scholar] [PubMed] [CrossRef]
36. Nguyen TD, Dang TTT. Cytochrome P450 enzymes as key drivers of alkaloid chemical diversification in plants. Front Plant Sci. 2021;12:682181. doi:10.3389/fpls.2021.682181. [Google Scholar] [PubMed] [CrossRef]
37. Ravanel S, Block MA, Rippert P, Jabrin S, Curien G, Rébeillé F, et al. Methionine metabolism in plants: chloroplasts are autonomous for de novo methionine synthesis and can import S-adenosylmethionine from the cytosol. J Biol Chem. 2004;279(21):22548–57. doi:10.1074/jbc.M313250200. [Google Scholar] [PubMed] [CrossRef]
Cite This Article
 Copyright © 2024 The Author(s). Published by Tech Science Press.
This work is licensed under a Creative Commons Attribution 4.0 International License , which permits unrestricted use, distribution, and reproduction in any medium, provided the original work is properly cited.
 Downloads
 Citation Tools