
 Submit a Paper
 Propose a Special lssue
 Open Access
ARTICLE

Metabolomic Analysis of the Anthocyanins Associated with Different Colors of Cymbidium goeringii in Guizhou, China
1 College of Pharmacy, Guizhou University of Traditional Chines Medicine, Guiyang, 550025, China
2 Research Institute of Juglans Regia, Guizhou Academy of Forestry, Guiyang, 550005, China
3 Guizhou Liping Rocky Desertification Ecosystem National Observation and Research Station, Qiandongnan Prefecture, 556200, China
* Corresponding Authors: Yuxue Zhao. Email: ; Yueyun Wang. Email:
(This article belongs to the Special Issue: Plant Secondary Metabolism and Functional Biology)
Phyton-International Journal of Experimental Botany 2024, 93(7), 1455-1466. https://doi.org/10.32604/phyton.2024.051652
Received 12 March 2024; Accepted 06 May 2024; Issue published 30 July 2024
 View Full Text
 Download PDF
Abstract
Cymbidium goeringii is an economically important ornamental plant, and flower color is one of the main features of C. goeringii that contributes to its high economic value. To clarify the molecular mechanisms underlying the role of anthocyanins in mediating differences in color among varieties, liquid chromatography–tandem mass spectrometry was used to perform anthocyanin-targeted metabolomics of seven C. goeringii varieties, including ‘Jin Qian Yuan’ (JQY), ‘Jin Xiu Qian Yuan’ (JXQY), ‘Miao Jiang Su Die’ (MJSD), ‘Qian Ming Su’ (QMS), ‘Shi Chan’ (SC), and ‘Yang Ming Su’ (YMS), as well as the C. goeringii. We detected 64 anthocyanins, including cyanidins, delphinidins, malvidins, pelargonidins, peonidins, petunidins, procyanidins, and flavonoids. We identified six shared differentially accumulated metabolites (DAMs), including cyanidin-3-O-rutinoside, delphinidin-3-O-sophoroside, pelargonidin-3-O-rutinoside, peonidin-3-O-(6-O-malonyl-beta-D-glucoside), peonidin-3-O-sophoroside, and chalcone. Most DAMs were enriched in the anthocyanin biosynthesis pathway. Kyoto Encyclopedia of Genes and Genomes pathway analysis revealed that the differentially expressed metabolites were significantly enriched in the anthocyanin biosynthesis pathway. Analysis of the content of differentially expressed metabolites indicated that peonidin-3-O-(6-O-malonyl-beta-D-glucoside) was the key metabolite underlying color differences among C. goeringii varieties. Procyanidin B2, pelargonidin-3-O-galactoside, and naringenin might also affect the color formation of JQY and QMS, SC, and MJSD, respectively. The results of this study shed light on the metabolic mechanism underlying flower color differences in C. goeringii at the molecular level. Our findings will aid future studies of the mechanism of flower color regulation in C. goeringii and have implications for the breeding of new varieties.Keywords
Supplementary Material
Supplementary Material FileCymbidium goeringii is a perennial herb in the family Orchidaceae with diverse flowers, a faint fragrance, a tall and straight appearance, and high ornamental and medicinal value [1–3]. C. goeringii was first cultivated in China from the 6th to 10th century BC, and records of orchids are present in ancient works, such as The Book of Songs [4]. Whole herbs and roots of C. goeringii can be used as medicine, and C. goeringii is still used as medicine in Zhejiang, Jiangxi, and other provinces in China. C. goeringii can be used to moisten the lungs and relieve cough; it also has anti-inflammatory and dehumidifying effects, promotes circulation, prevents blood stasis, regulates Qi and the central nervous system, facilitates the removal of Ascaris, and enhances eyesight [5–7].
The color of flowers is determined by several factors, and the content of different pigments (e.g., flavonoids, carotenoids, and alkaloids) is the most important factor affecting flower color formation [8]. Anthocyanins are important secondary metabolites in plants because of their antioxidant activity and various health-promoting functions [9]. Anthocyanins are major contributors to diversity in plant color. Anthocyanins are diverse and can be classified into different types depending on whether they contain hydrogen-based, hydroxyl, and methoxy groups. Anthocyanins also vary in their substituents, including cyanidins, delphinidins, malvidins, pelargonidins, peonidins, and petunidins. Delphinidins are purple or blue, malvidins and petunidins are blue or red, pelargonidins are orange, and cyanidins and peonidins are orange-red [10,11]. Thus, these compounds can confer plants with pink to blue-purple colors [12]. Previous studies have shown that orchids are mainly yellow-green, and varieties can have pure or complex colors, such as red, pink, yellow, purple, brown, azure green, and white [13]; The color variation in orchids is primarily influenced by a range of pigments, including anthocyanins, a subgroup of flavonoids, as well as carotenoids and chlorophyll [14,15]. Among these pigments, anthocyanins are particularly significant due to their role in producing a variety of colors including reds, blues, and purples.
C. goeringii are important economic flowers with high ornamental value and application prospects. Research on C. goeringii both outside and within China has mainly focused on the analysis of germplasm resources, cultivation and planting technologies, and reproductive technologies, but the mechanism underlying the color formation of C. goeringii flowers has not been elucidated, which limits the use of genetic engineering for breeding and for the improvement of germplasm resources. Here, seven C. goeringii varieties, ‘Jin Qian Yuan’, ‘Jin Xiu Qian Yuan’, ‘Miao Jiang Su Die’, ‘Qian Ming Su Xin’, ‘Shi Chan’, and ‘Yang Ming Su’, were used in analyses; the common variety ‘PT11’ was used as the control. Color-forming substances underlying color differences were characterized; differences in anthocyanin metabolites and metabolic pathways in C. goeringii varieties with different colors were determined, and the possible causes of color differences between varieties were explored. The results of this study provide valuable information for future studies of the molecular regulation of flower color in C. goeringii varieties.
Plant materials were collected from the orchid germplasm collection garden of Guizhou Academy of Forestry Sciences, including one common variety of C. goeringii (PT11) and six C. goeringii varieties with special flower colors (‘Jin Qian Yuan’, ‘Jin Xiu Qian Yuan’, ‘Miao Jiang Su Die’, ‘Qian Ming Su’, ‘Shi Chan’, and ‘Yang Ming Su’). The seven varieties of C. goeringii all had healthy flowers and experienced the same light, soil nutrient, and moisture conditions during the peak flowering stage (Fig. 1). Petals (5 g) were collected from each variety, placed in tin foil, and quick-frozen in liquid nitrogen; three replicate samples were collected. These samples were stored in a refrigerator at −80°C for targeted metabolomics analysis.
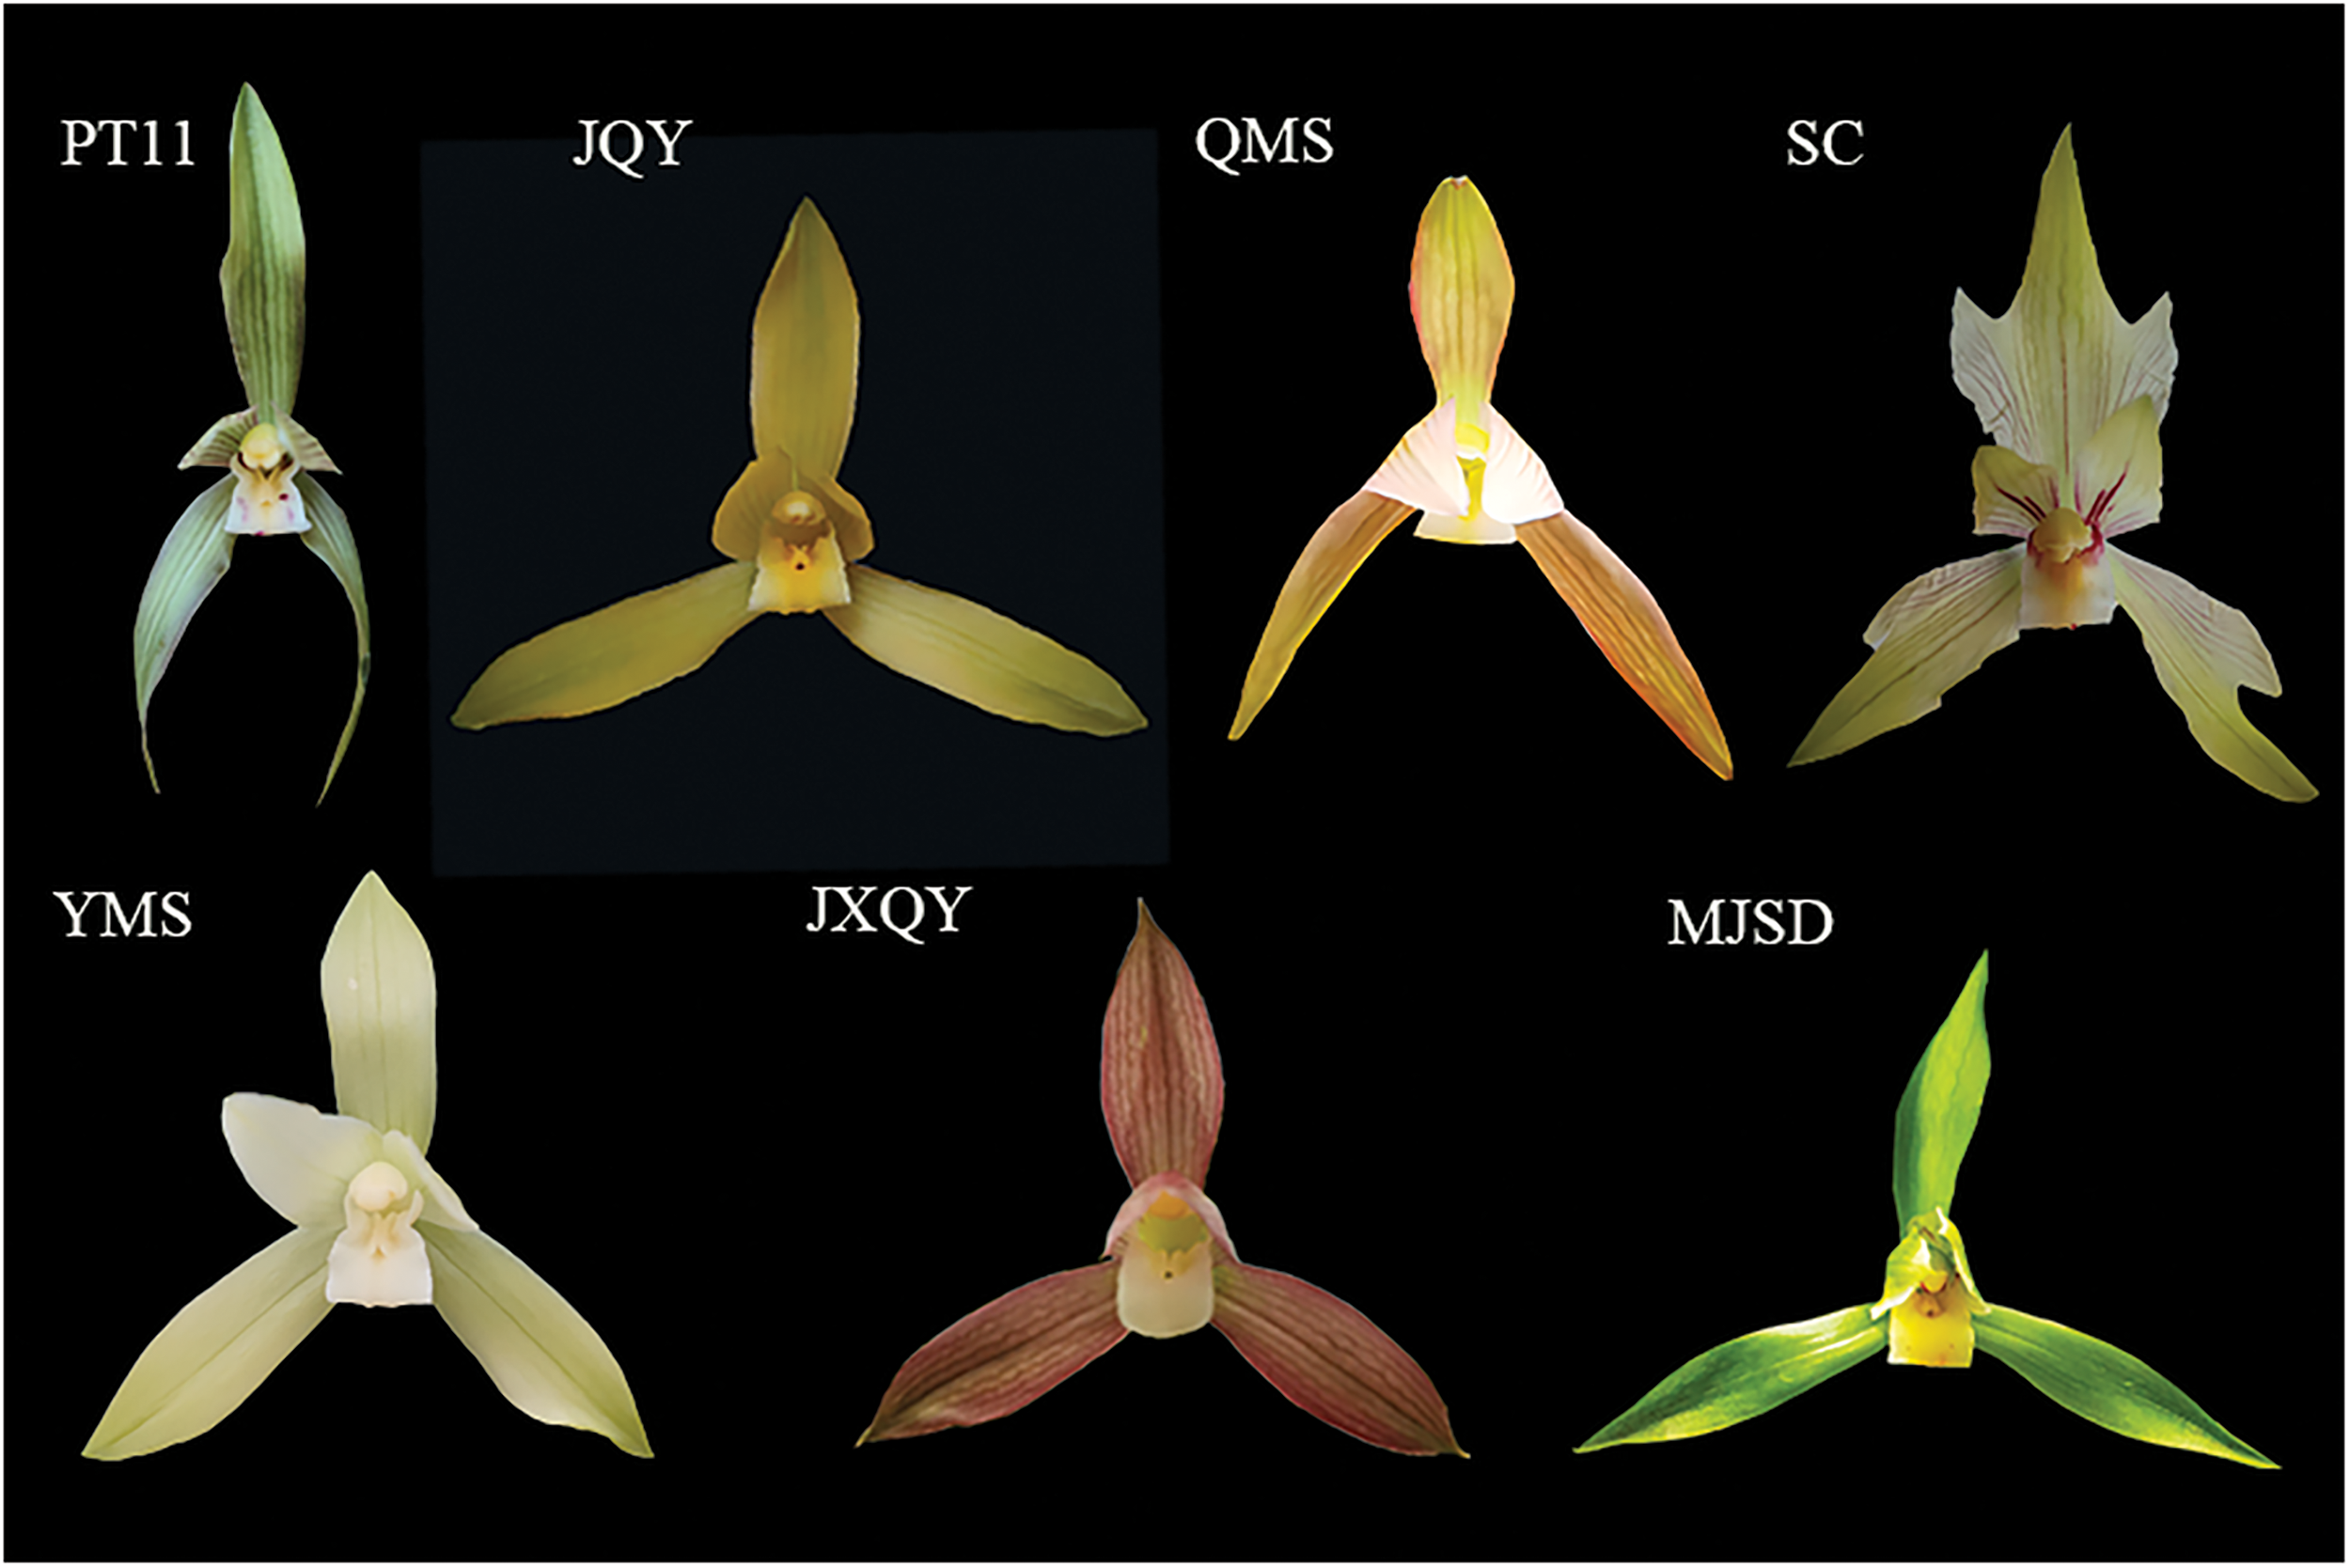
Figure 1: Phenotypes of seven Cymbidium goeringii cultivars (JQY indicates ‘Jin Qian Yuan’, PT11 indicates the common C. goeringii variety, MJSD indicates ‘Miao Jiang Su Die’, SC indicates ‘Shi Chan’, YMS indicates ‘Yang Ming Su’, QMS indicates ‘Qian Ming Su’, and JXQY indicates ‘Jin Xiu Qian Yuan’)
2.2 Sample Preparation and Metabolite Extraction
After vacuum freeze-drying, samples were ground (30 Hz, 1.5 min) into powder, and 50 g of powder was dissolved in 0.5 mL of extract (50% methanol aqueous solution containing 0.1% hydrochloric acid). The extract was then vortexed for 5 min, subjected to ultrasound treatment for 5 min, and centrifuged for 3 min (12,000 r/min, 4°C); the supernatant was then collected. The above procedure was performed a total of two times. The supernatant was pooled, and the samples were filtered through a 0.22 μm microporous membrane and stored in an injection bottle for subsequent analysis.
2.3 Anthocyanin Content Determination
Anthocyanins were extracted following the method of Ferrars et al. [16]. Ultra-performance liquid chromatography (UPLC) and tandem mass spectrometry (MS/MS) were used to identify metabolites. UPLC was performed using an ACQUITY BEH C18 1.7 μm, 2.1 mm × 100 mm column. Mobile phase A was ultrapure water (0.1% formic acid), and mobile phase B was methanol (0.1% formic acid). The elution gradient was as follows: 0 min/5% B; an increase to 50% of B from 0 to 6 min; an increase to 95% B from 6 to 12 min, which was maintained for 2 min; and a decrease to 5% B at 14 min, which was left to reach equilibrium for 2 min. The flow rate was 0.35 mL/min; the column temperature was 40°C; and the size of the sample was 2 μL. Mass spectrometry was performed using an electrospray ionization (ESI) temperature of 550°C; the mass spectrometry voltage was 5500 V in positive ion mode, and the curtain gas was 35 psi. In the Q-Trap 6500+ instrument, each ion pair was scanned using the optimal declustering potential and collision energy.
The metware database (MWDB) based on standard substances was built to qualitatively analyze the mass spectrometry data. Quantitative analysis was conducted using triple quadrupole mass spectrometry and multiple reaction monitoring analysis. The area of each chromatographic peak indicated the relative content of the corresponding substance, and these values were used in subsequent calculations with the linear equation. Qualitative and quantitative results of all samples were obtained using MultiQuant 3.0.3 software. Hierarchical cluster analysis (HCA) and principal component analysis (PCA) were performed on the accumulated metabolites in the different samples using R software (https://www.r-project.org/, accessed on 10/04/2024). The fold change and p-values were calculated, and differentially accumulated metabolites (DAMs) were those with p-values ≤ 0.5. The DAMs were mapped to the Kyoto Encyclopedia of Genes and Genomes database for subsequent analysis. The metabolite content in the sample (μg/g) was calculated using the following formula: metabolite content = c × V/1000000/m. In the formula, the concentration (ng/mL) is obtained by substituting the integral peak area into the standard curve; V is the volume of the solution used for extraction (μL); and m is the weight of the sample (g).
3.1 Analysis of Petal Color Traits of Cymbidium goeringii
PT11 petals were lackluster green, and the labial petals were white with a few red spots; JQY petals were lackluster yellow; QMS petals were bright yellow; SC petals had red filaments on the labial petals, and the other petals were light yellow-white; YMS petals were milky white; JXQY petals were red, and the labial petals were light; and MJSD petals were bright green, and the labial petals were yellow.
3.2 Qualitative Analysis of Anthocyanin Metabolites
Targeted metabolomics was performed on seven C. goeringii flower samples. A total of 108 anthocyanin metabolites were identified, and the content of 64 metabolites was significantly above the detection threshold, including ten peonidins, nine cyanidins, seven malvidins, eight pelargonidins, ten petunidins, seven delphinidins, four procyanidines, and nine flavonoids (see supplementary materials).
PCA was conducted on the anthocyanin metabolites of seven C. goeringii samples (Fig. 2). The PCA yielded two principal components. The first principal component (PC1) explained 33.7% of the variance in the data, and the second principal component (PC2) explained 20.45% of the variance in the data; the cumulative variation explained by PC1 and PC2 was 54.15%. The principal component 1 distinguished QMS, SC, JXQY, PT11 from YMS, JQY, and MJSD, and the principal component 2 distinguished QMS, SC, and JQY from the other samples of C. goeringii. Metabolite groups were clearly separated in the PCA plot, and the repeatability within groups was high; these findings indicate that these data could be used in subsequent analyses of DAMs. The HCA (Fig. 3) revealed that the seven C. goeringii samples comprised two groups. PT11 was clustered with JXQY, and the metabolites of PT11 and JXQY were similar to those of QMS. MQSD and YMS were clustered, and JQY and SC were clustered, as the metabolites of these varieties were more similar to each other than to the other samples.
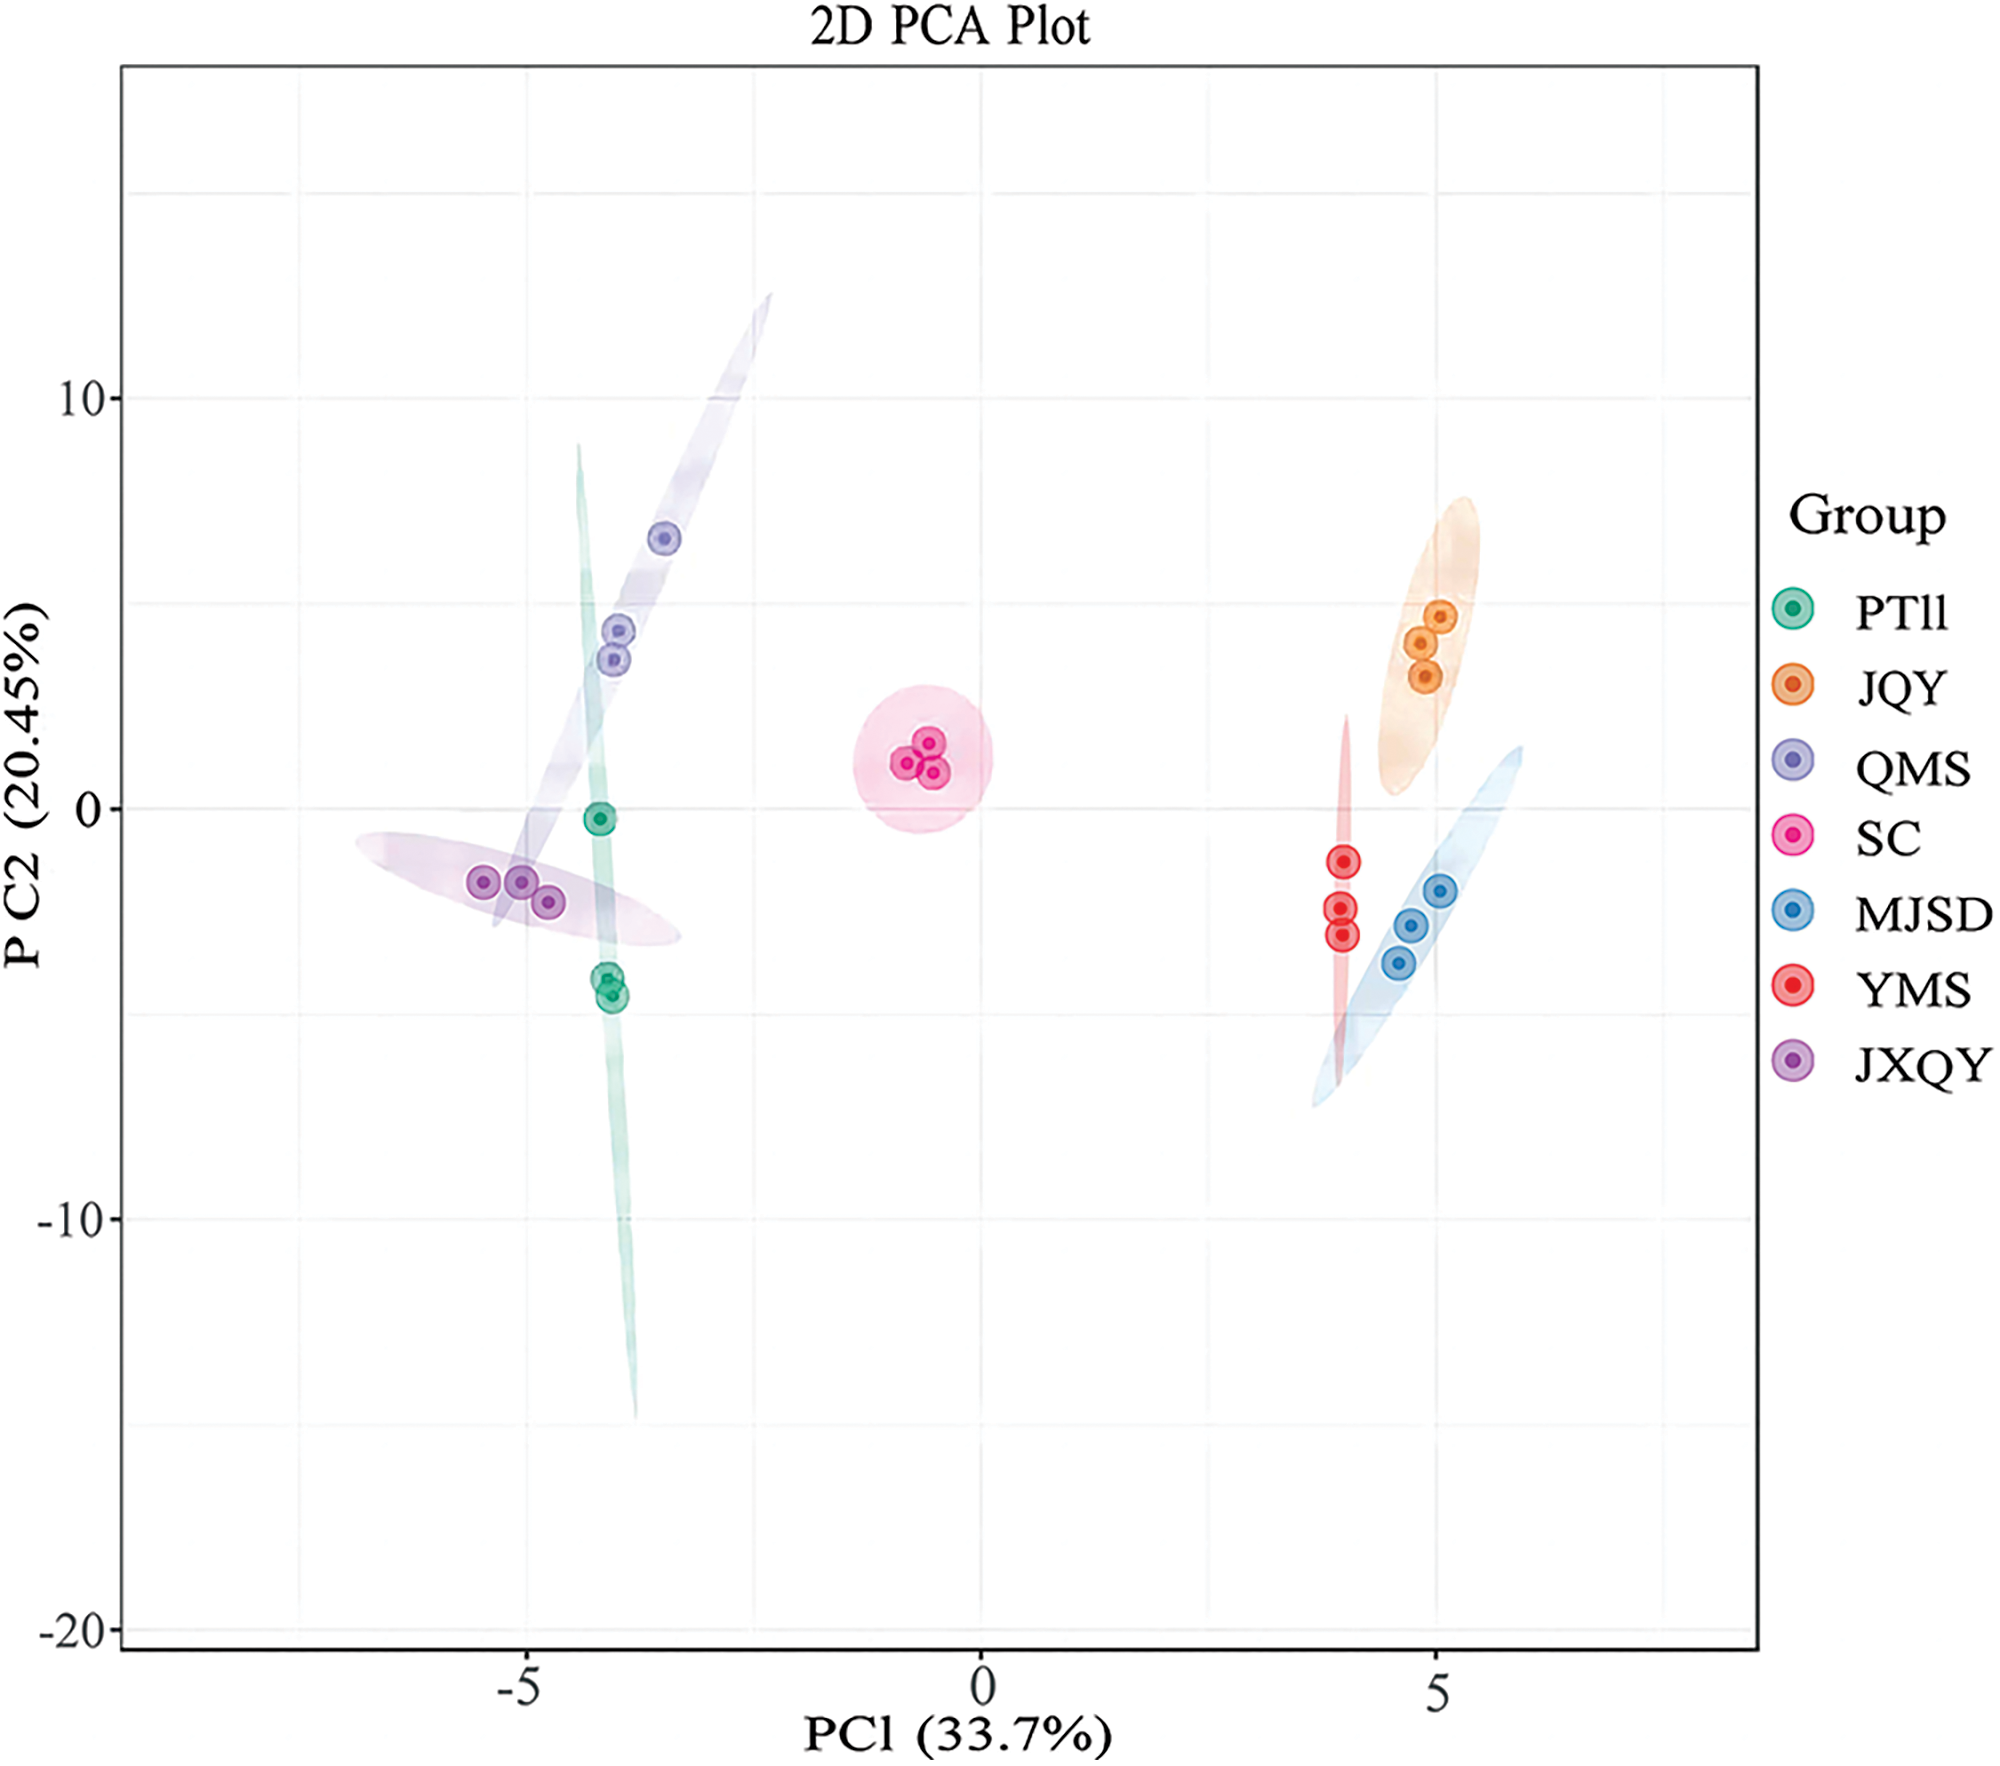
Figure 2: PCA plot of anthocyanin metabolites
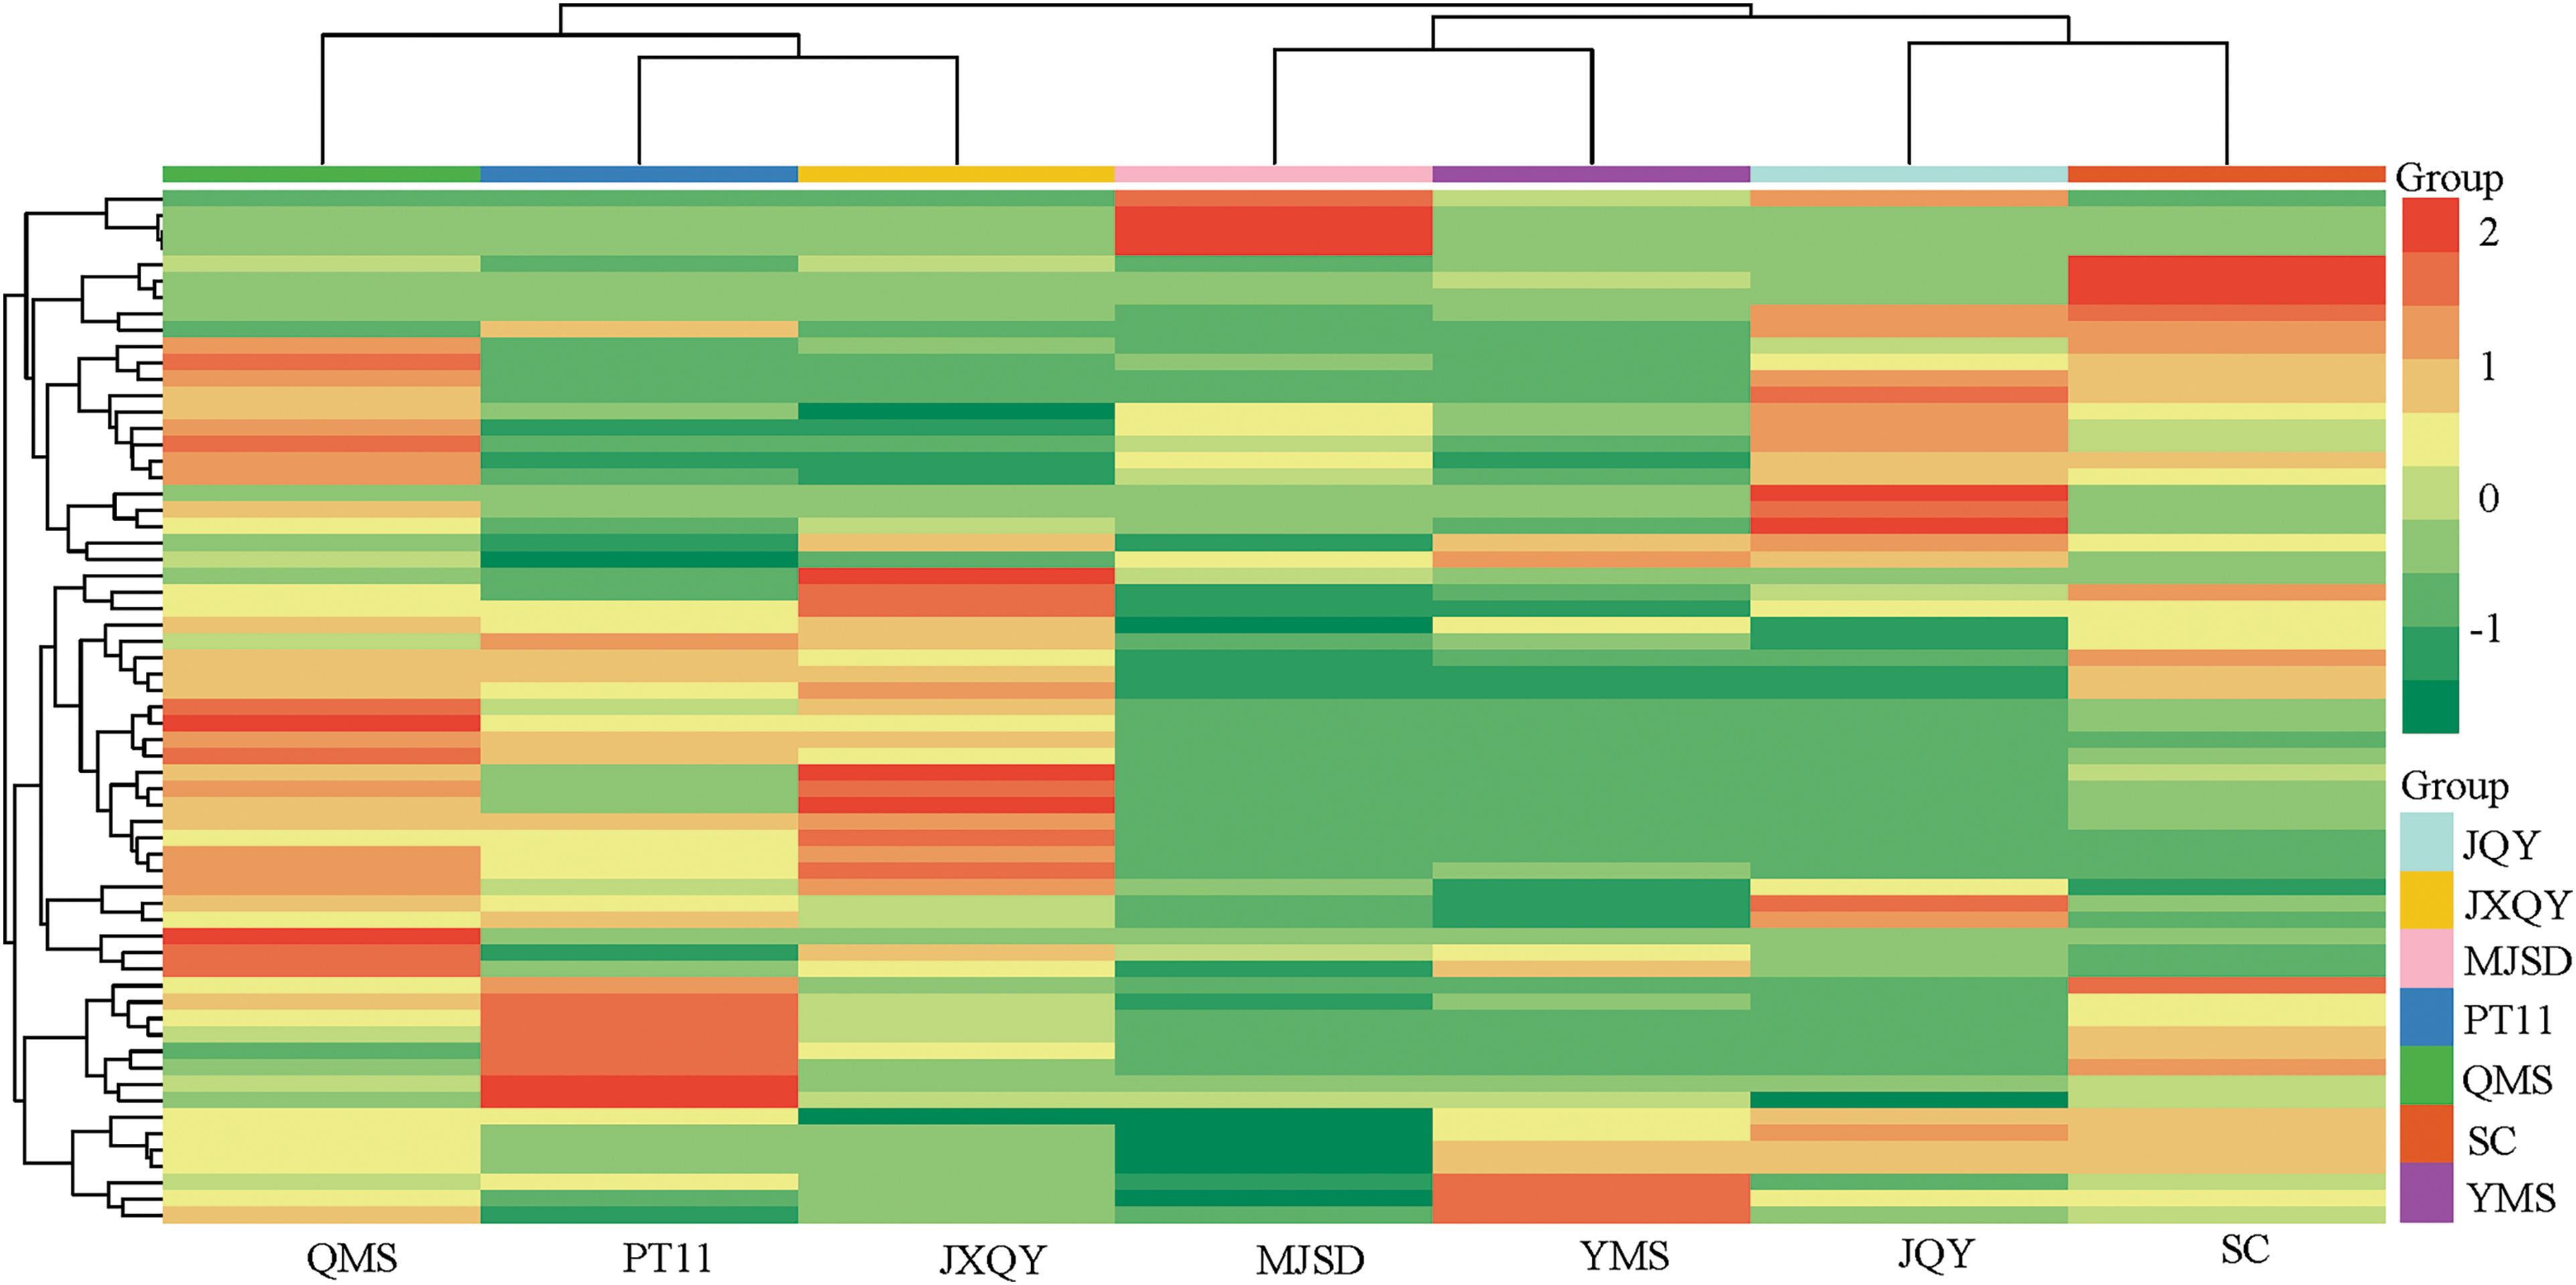
Figure 3: Results of an HCA of anthocyanin metabolites
Anthocyanin DAMs were identified using the p-value ≤ 0.5 as a criterion, and the fold change indicates the relative accumulation of metabolites among samples. A total of 47 DAMs (19 up-regulated/28 down-regulated) were identified in the JQY_vs_PT11 comparison group, 20 DAMs (10 up-regulated/10 down-regulated) were identified in the JXQY_vs_PT11 comparison group, 46 DAMs (8 up-regulated/38 down-regulated) were identified in the MJSD_vs_PT11 comparison group, 31 DAMs (22 up-regulated/9 down-regulated) were identified in the QMS_vs_ PT11 comparison group, 27 DAMs (13 up-regulated/14 down-regulated) were identified in the SC_vs_PT11 comparison group, and 38 DAMs (10 up-regulated/28 down-regulated) were identified in the YMS_vs_PT11 comparison group. Six shared DAMs were identified via pairwise comparisons among groups (Fig. 4): cyanidin-3-O-rutinoside, delphinidin-3-O-sophoroside, pelargonidin-3-O-rutinoside, peonidin-3-O-(6-O-malonyl-beta-D-glucoside), peonidin-3-O-sophoroside, and chalcone.
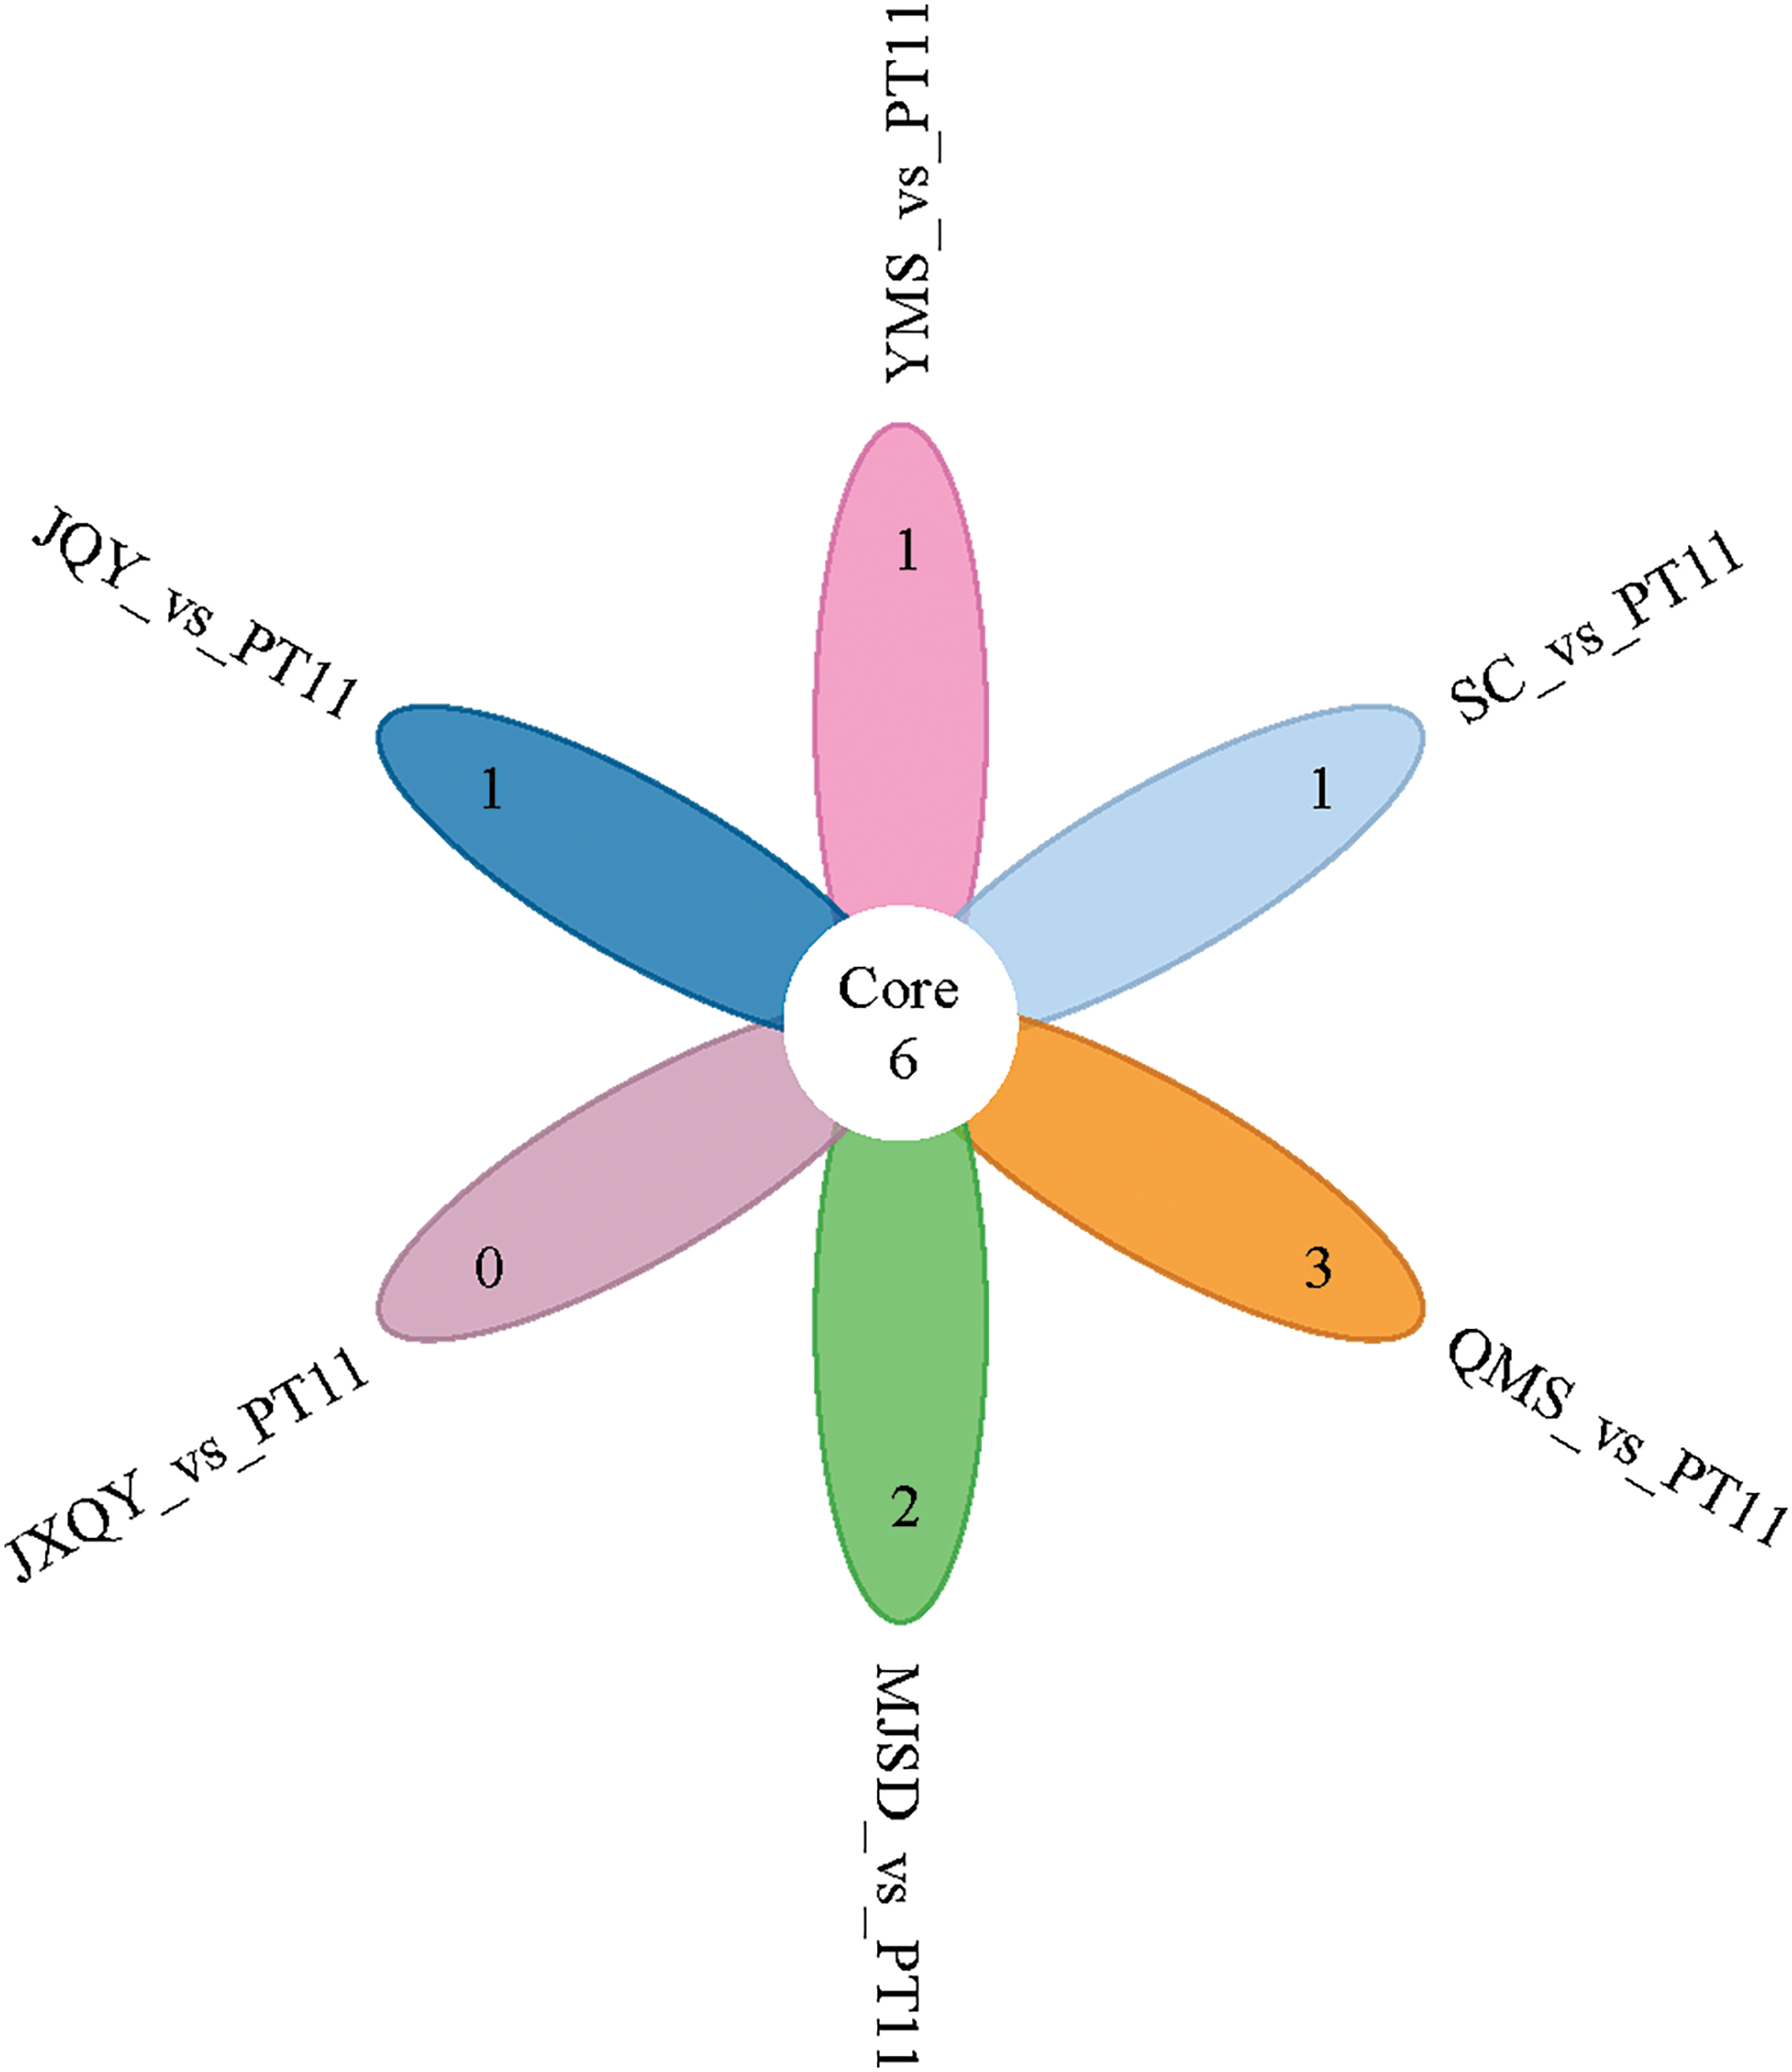
Figure 4: Venn diagram of DAMs
Comparisons of the fold change in metabolites among groups were made, and a bar chart of the 20 metabolites with the highest fold change was constructed. The most significantly up-regulated metabolite in the JQY_vs_PT11 comparison group was procyanidin B2, and the most significantly down-regulated metabolite was peonidin-3-O-rutinoside (Fig. 5); the most significantly up-regulated and down-regulated metabolite in the JXQY_vs_PT11 comparison group was peonidin-3,5-O-diglucoside and pelargonidin-3-O-rutinoside, respectively. The most significantly up-regulated and down-regulated metabolite in the MJSD_vs_PT11 comparison group was naringenin and cyanidin-3-O-glucoside, respectively. The most significantly up-regulated and down-regulated metabolites in the QMS_vs_PT11 comparison group were procyanidin B2 and pelargonidin-3-O-glucoside, respectively. The most significantly up-regulated and down-regulated metabolite in the SC_vs_PT11 comparison group was pelargonidin-3-O-galactoside and peonidin-3-O-sambubioside, respectively. The most significantly up-regulated and down-regulated metabolite in the YMS_vs_PT11 comparison group was delphinidin-3-O-(6-O-malonyl-beta-D-glucoside) and cyanidin-3-O-rutinoside, respectively.
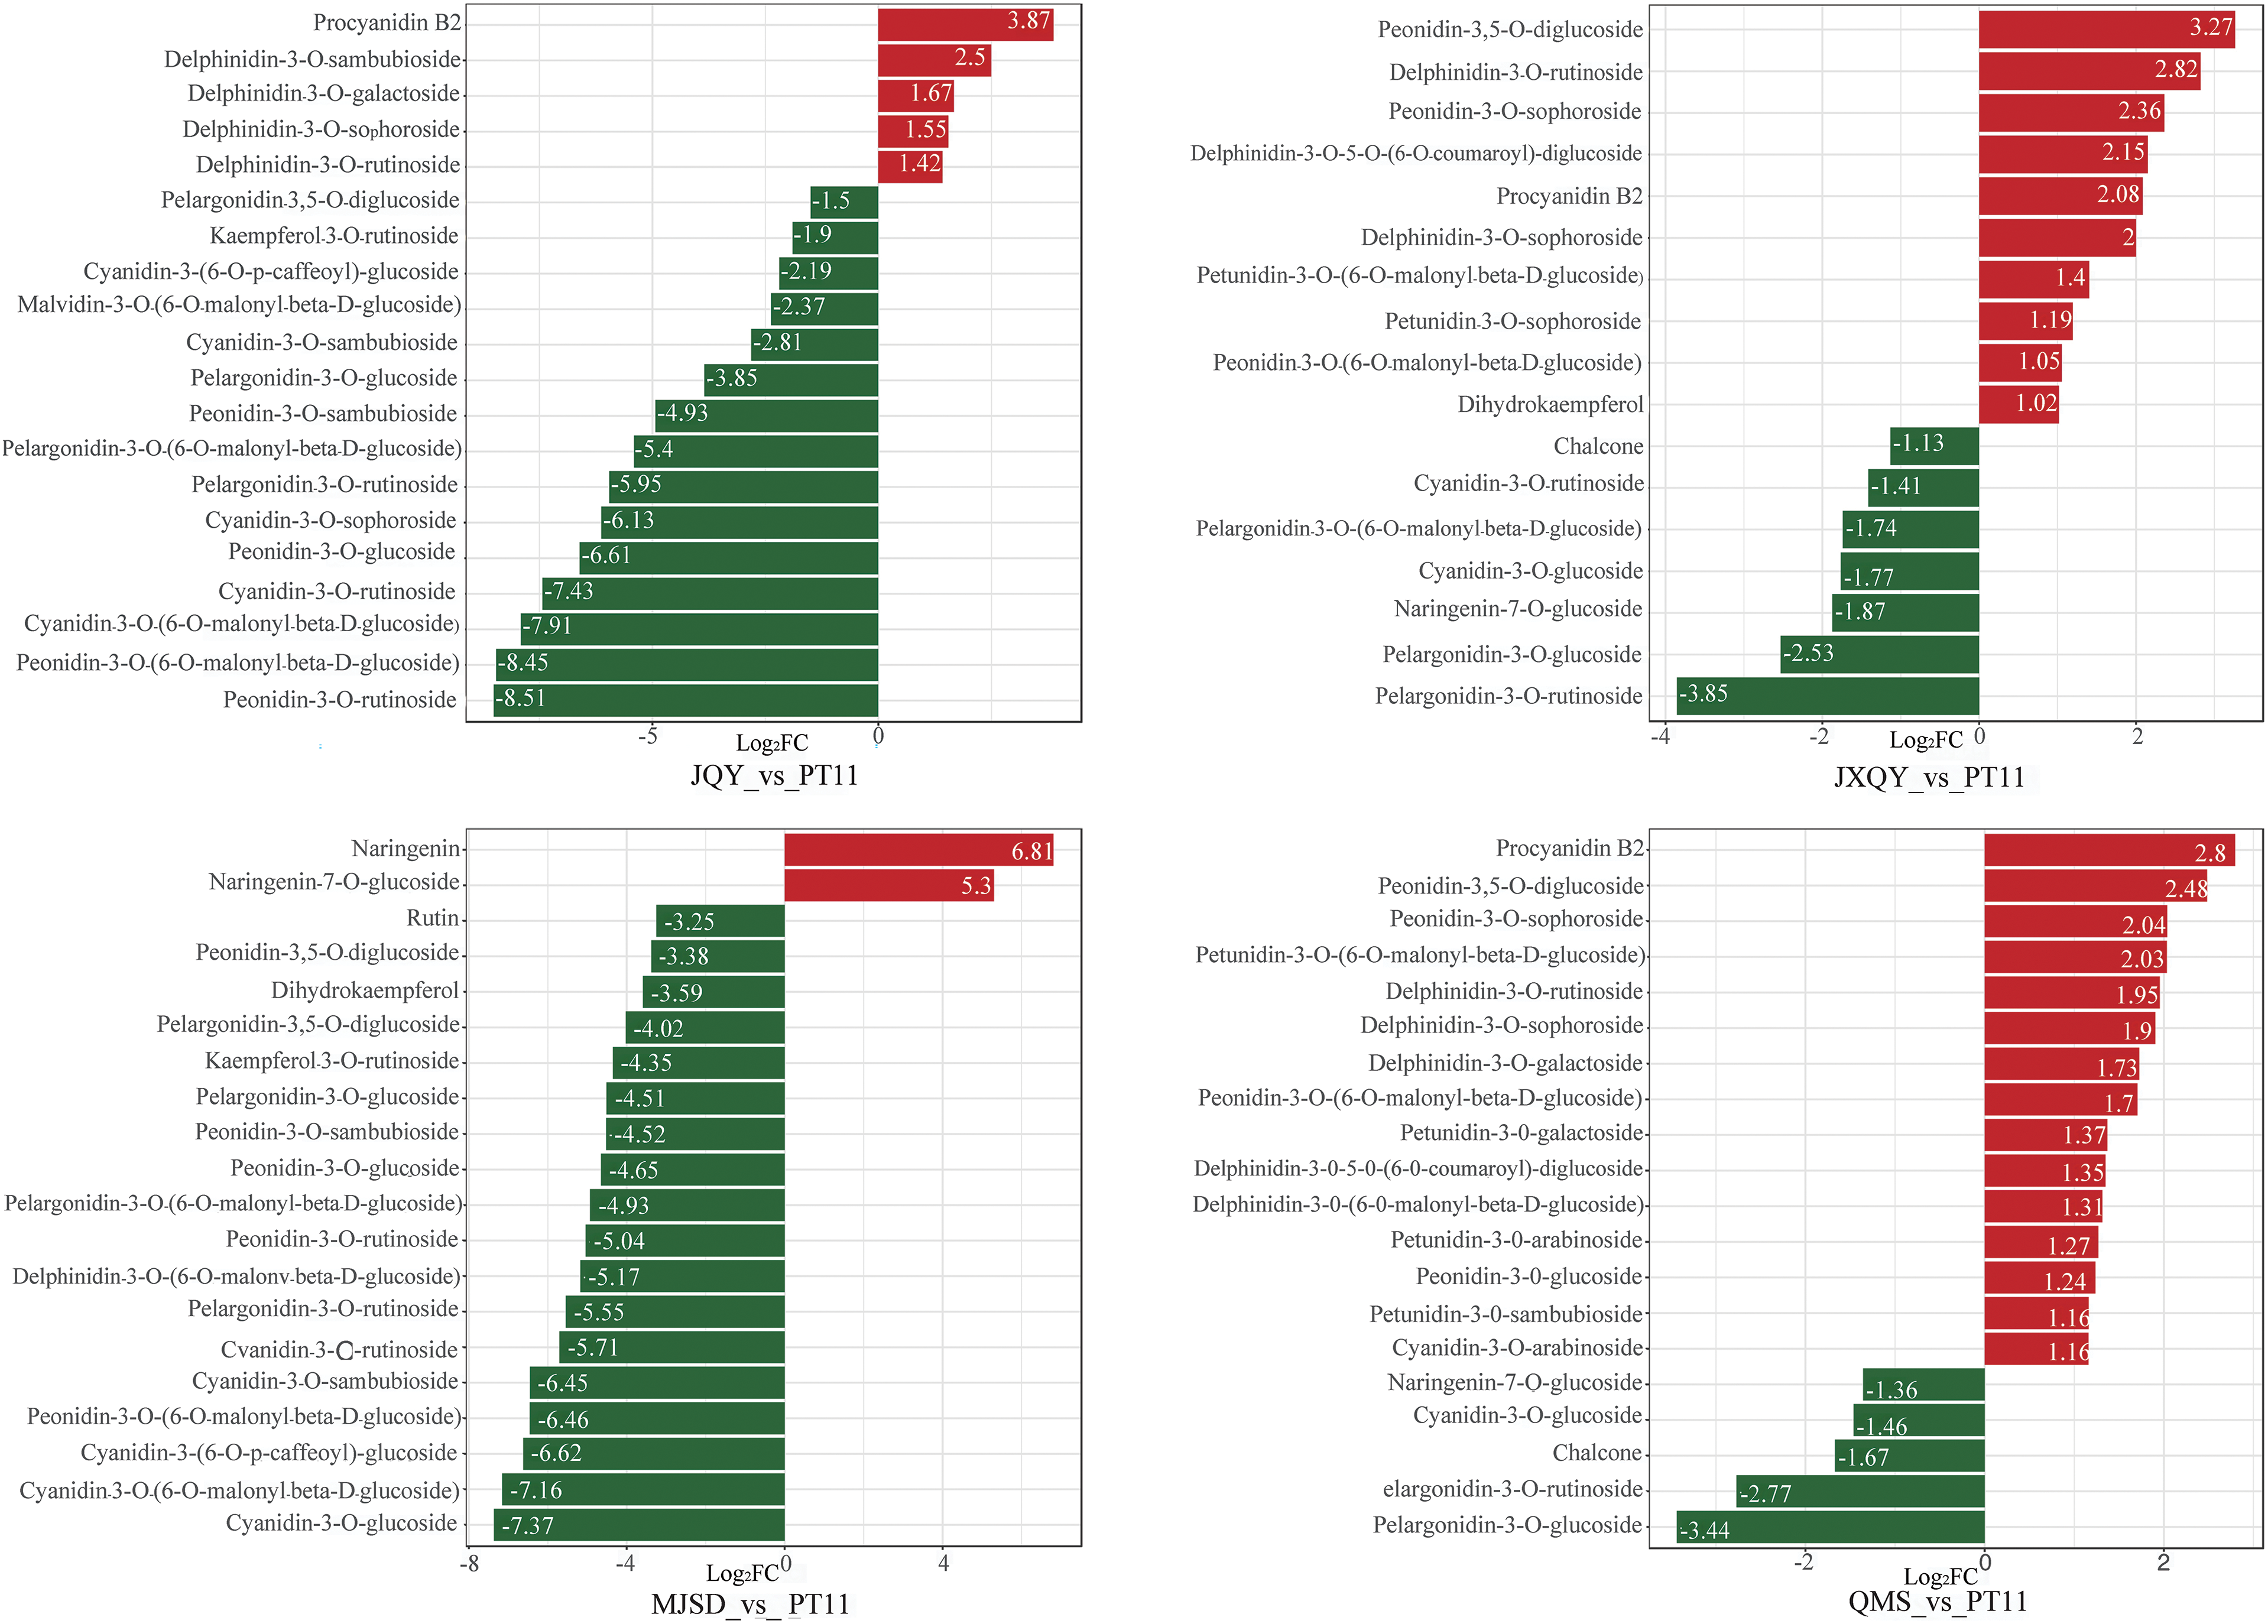
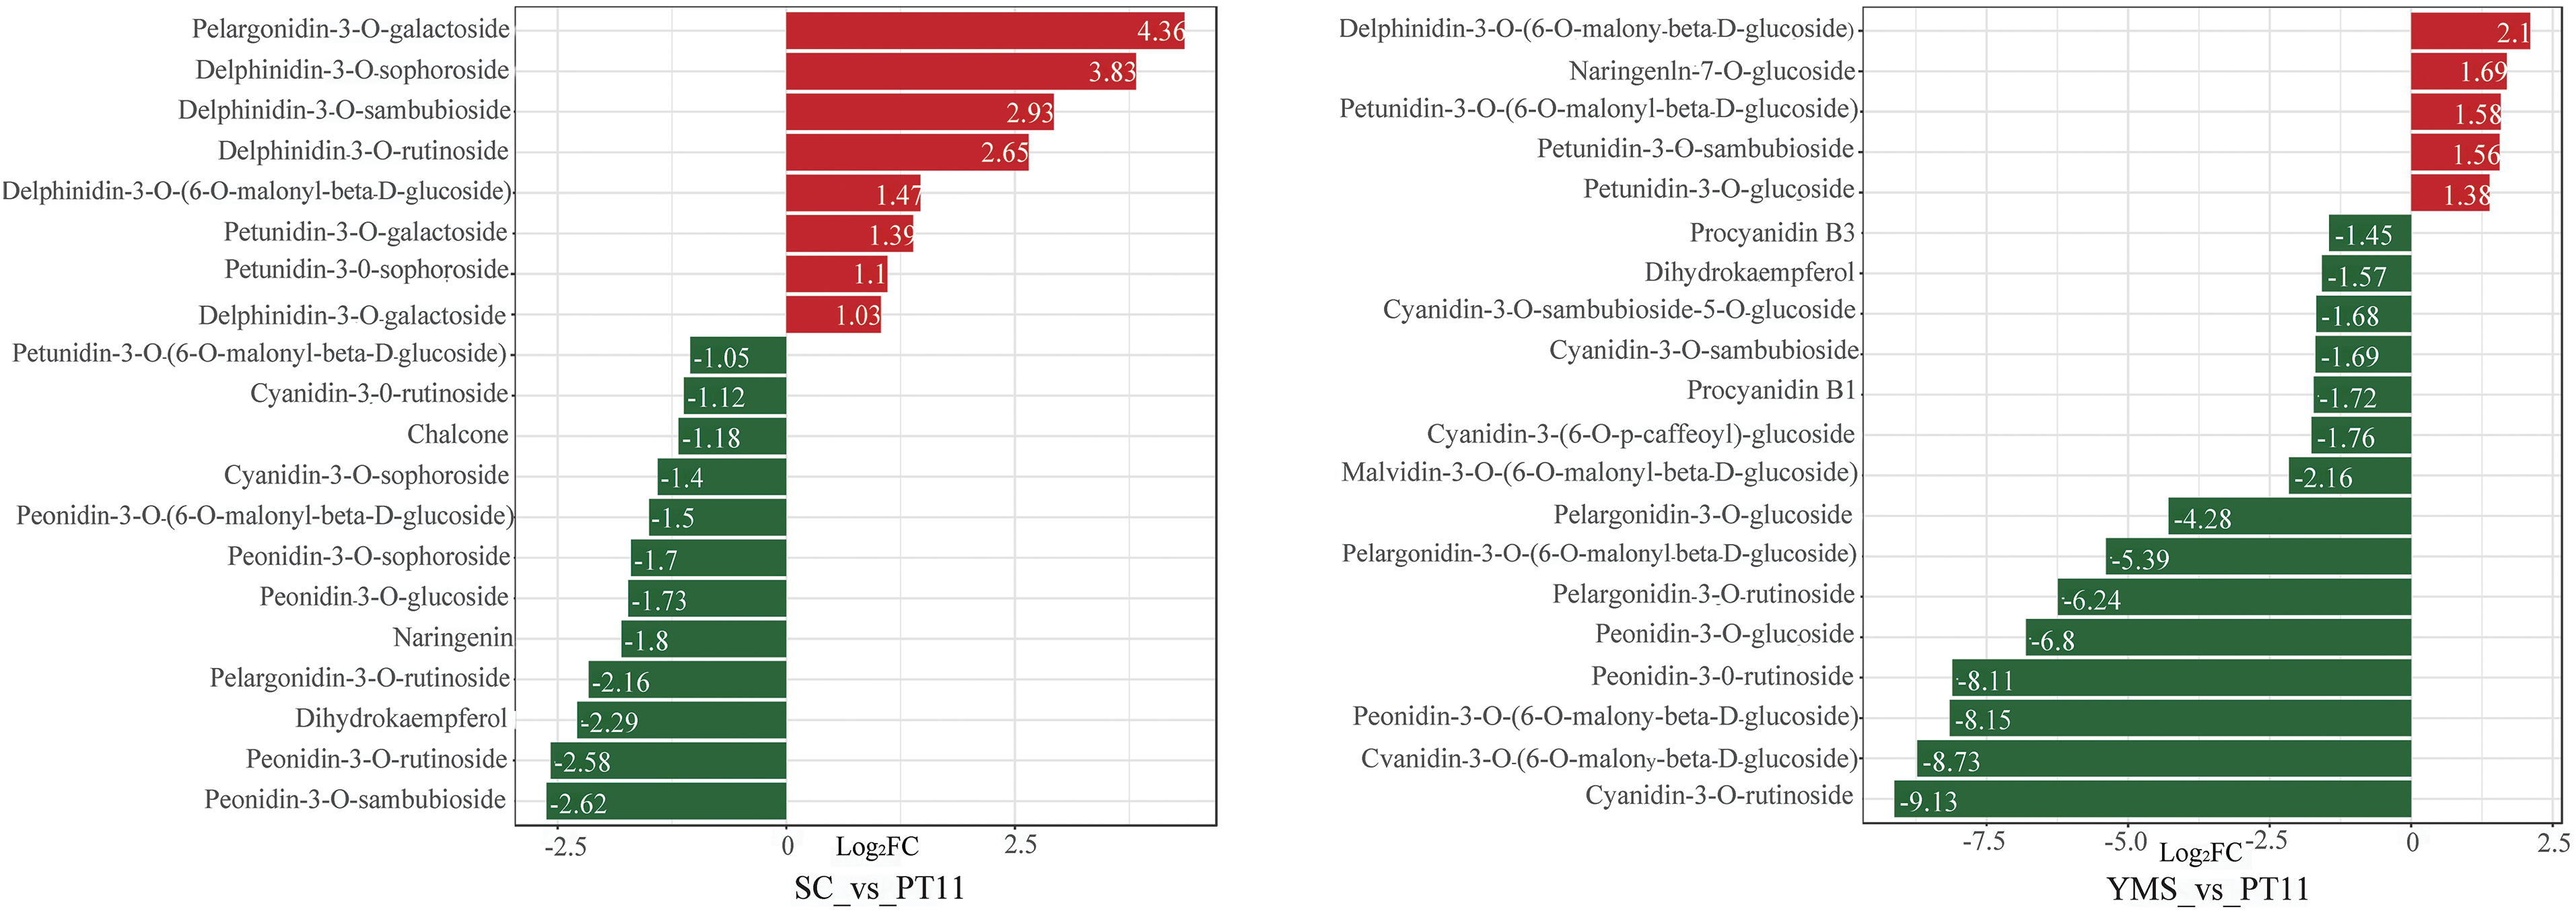
Figure 5: Bar chart of DAMs (Red indicates up-regulated metabolites, and green indicates down-regulated metabolites)
According to the content of differential metabolites (Fig. 6) and the multiples of metabolite differences in each group, in the six groups, paeoniflorin may be the important different metabolites of PT11, QMS, JXQY, SC, MJSD, YMS and JQY in forming different colors, and paeoniflorin-3-O-(6-O-malonic-β-D-glucoside) is the key influencing substance. Proanthocyanidin B2 was the most significantly up-regulated in the JQY_vs_PT11 and QMS_vs_PT11 comparison groups, which indicates that it might the key metabolite underlying changes in the color of JQY and QMS. Pelargonidin-3-O-galactoside was significantly up-regulated in the SC_vs_PT11 comparison group, and no significant change in this metabolite was observed in the other comparison groups, suggesting that it might be an important metabolite for mediating differences in the color of these two varieties and other varieties. Naringenin was the most significantly up-regulated in the MJSD_vs_PT11, and it was down-regulated in other groups, with the exception of YMS_vs_PT11; this indicates that it might be an important substance underlying the differences in flower color between MJSD and other varieties.
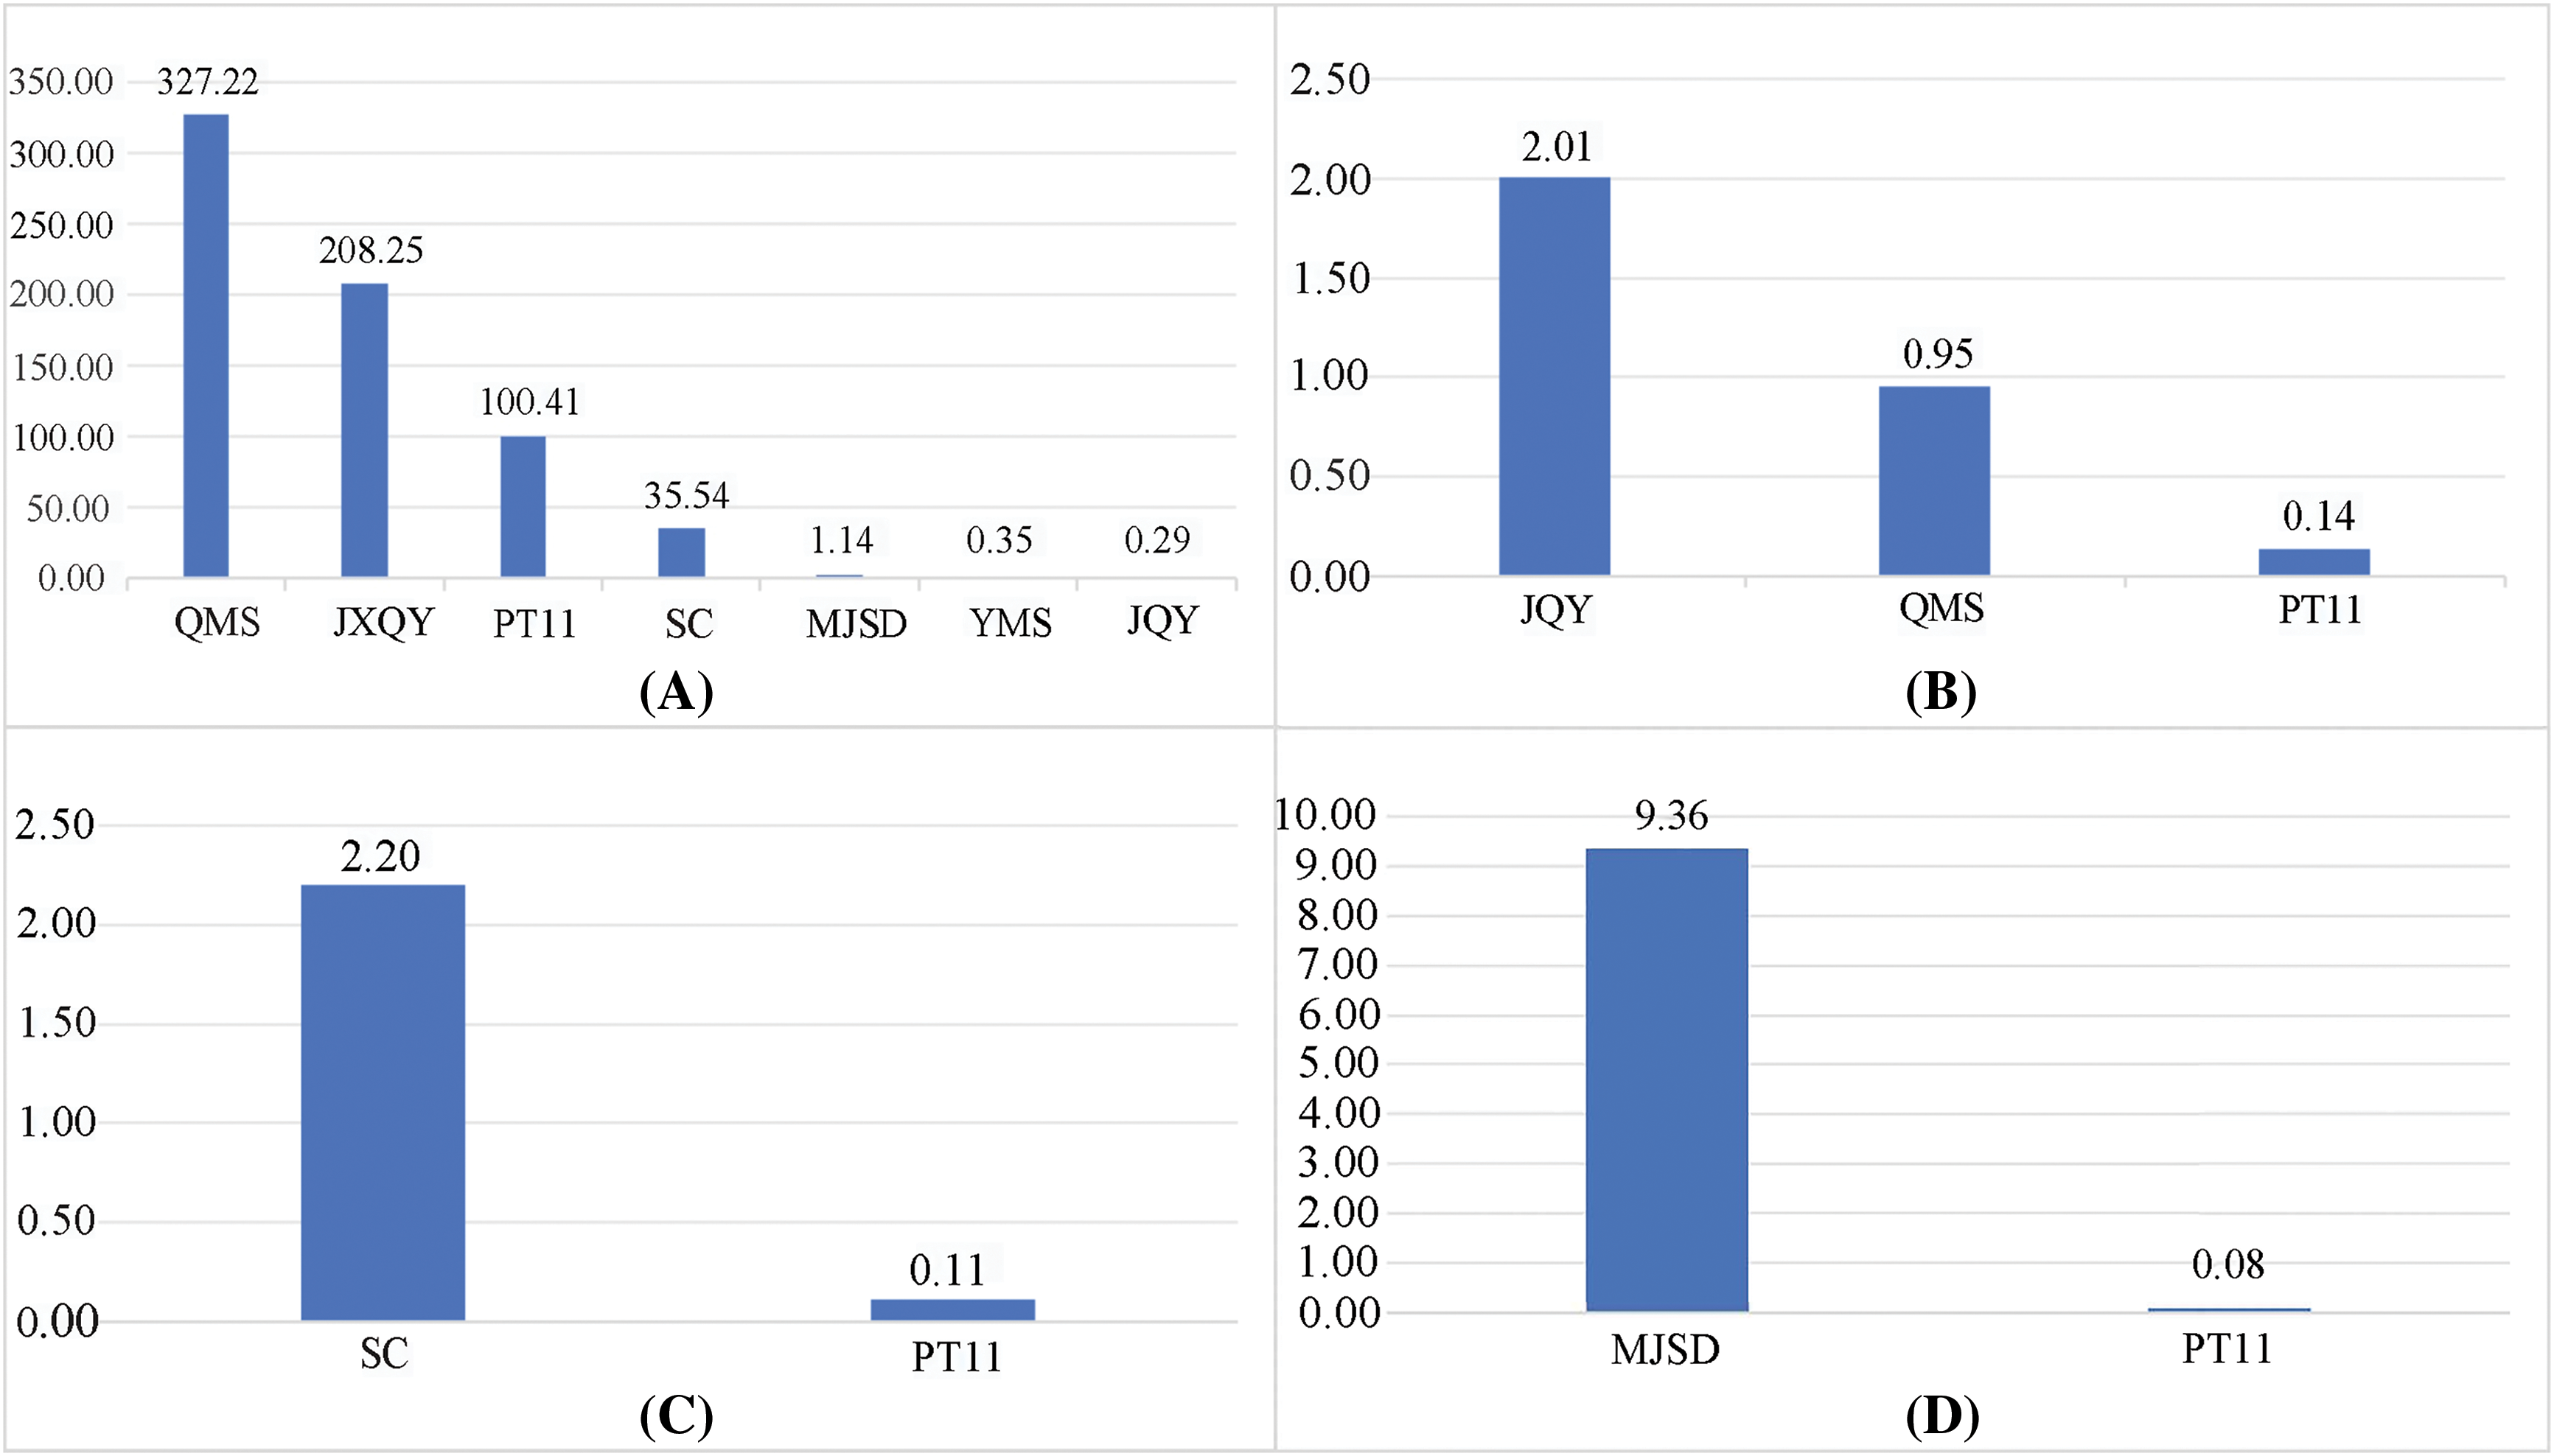
Figure 6: Map of differential metabolite content (“A” represents the content of peonidin-3-O-(6-O-malonyl-beta-D-glucoside) in the sample; similarly, “B” represents procyanidin B2, “C” represents pelargonidin-3-O-galactoside, and “D” represents naringenin)
3.5 Analysis of Metabolic Pathways
KEGG pathway analysis was conducted to characterize the functions of the DAMs. The selected DAMs were mapped to the database, and a pathway map was made (Fig. 7). 64 DAMs were annotated to 5 metabolic pathways, including flavonoid biosynthesis, anthocyanin biosynthesis, biosynthesis of secondary metabolites, metabolic pathways, flavone and flavonol biosynthesis, etc. Twenty differentially expressed metabolites were significantly enriched in the anthocyanin biosynthesis pathway in JQY/PT11 (accounting for 76.92%), and 10, 21, 11, 9, and 16 DAMs were significantly enriched in the anthocyanin biosynthesis pathway in JXQY/PT11, MJSD/PT11, QMS/PT11, SC/PT11, and YMS/PT11, respectively (accounting for 83.33%, 77.78%, 84.62%, 64.29%, and 84.21%). The synthesis of anthocyanins was significantly up-regulated in SC, YMS, and JXQY, which suggests that anthocyanins play an important role in determining flower color in C. goeringii (Fig. 5).
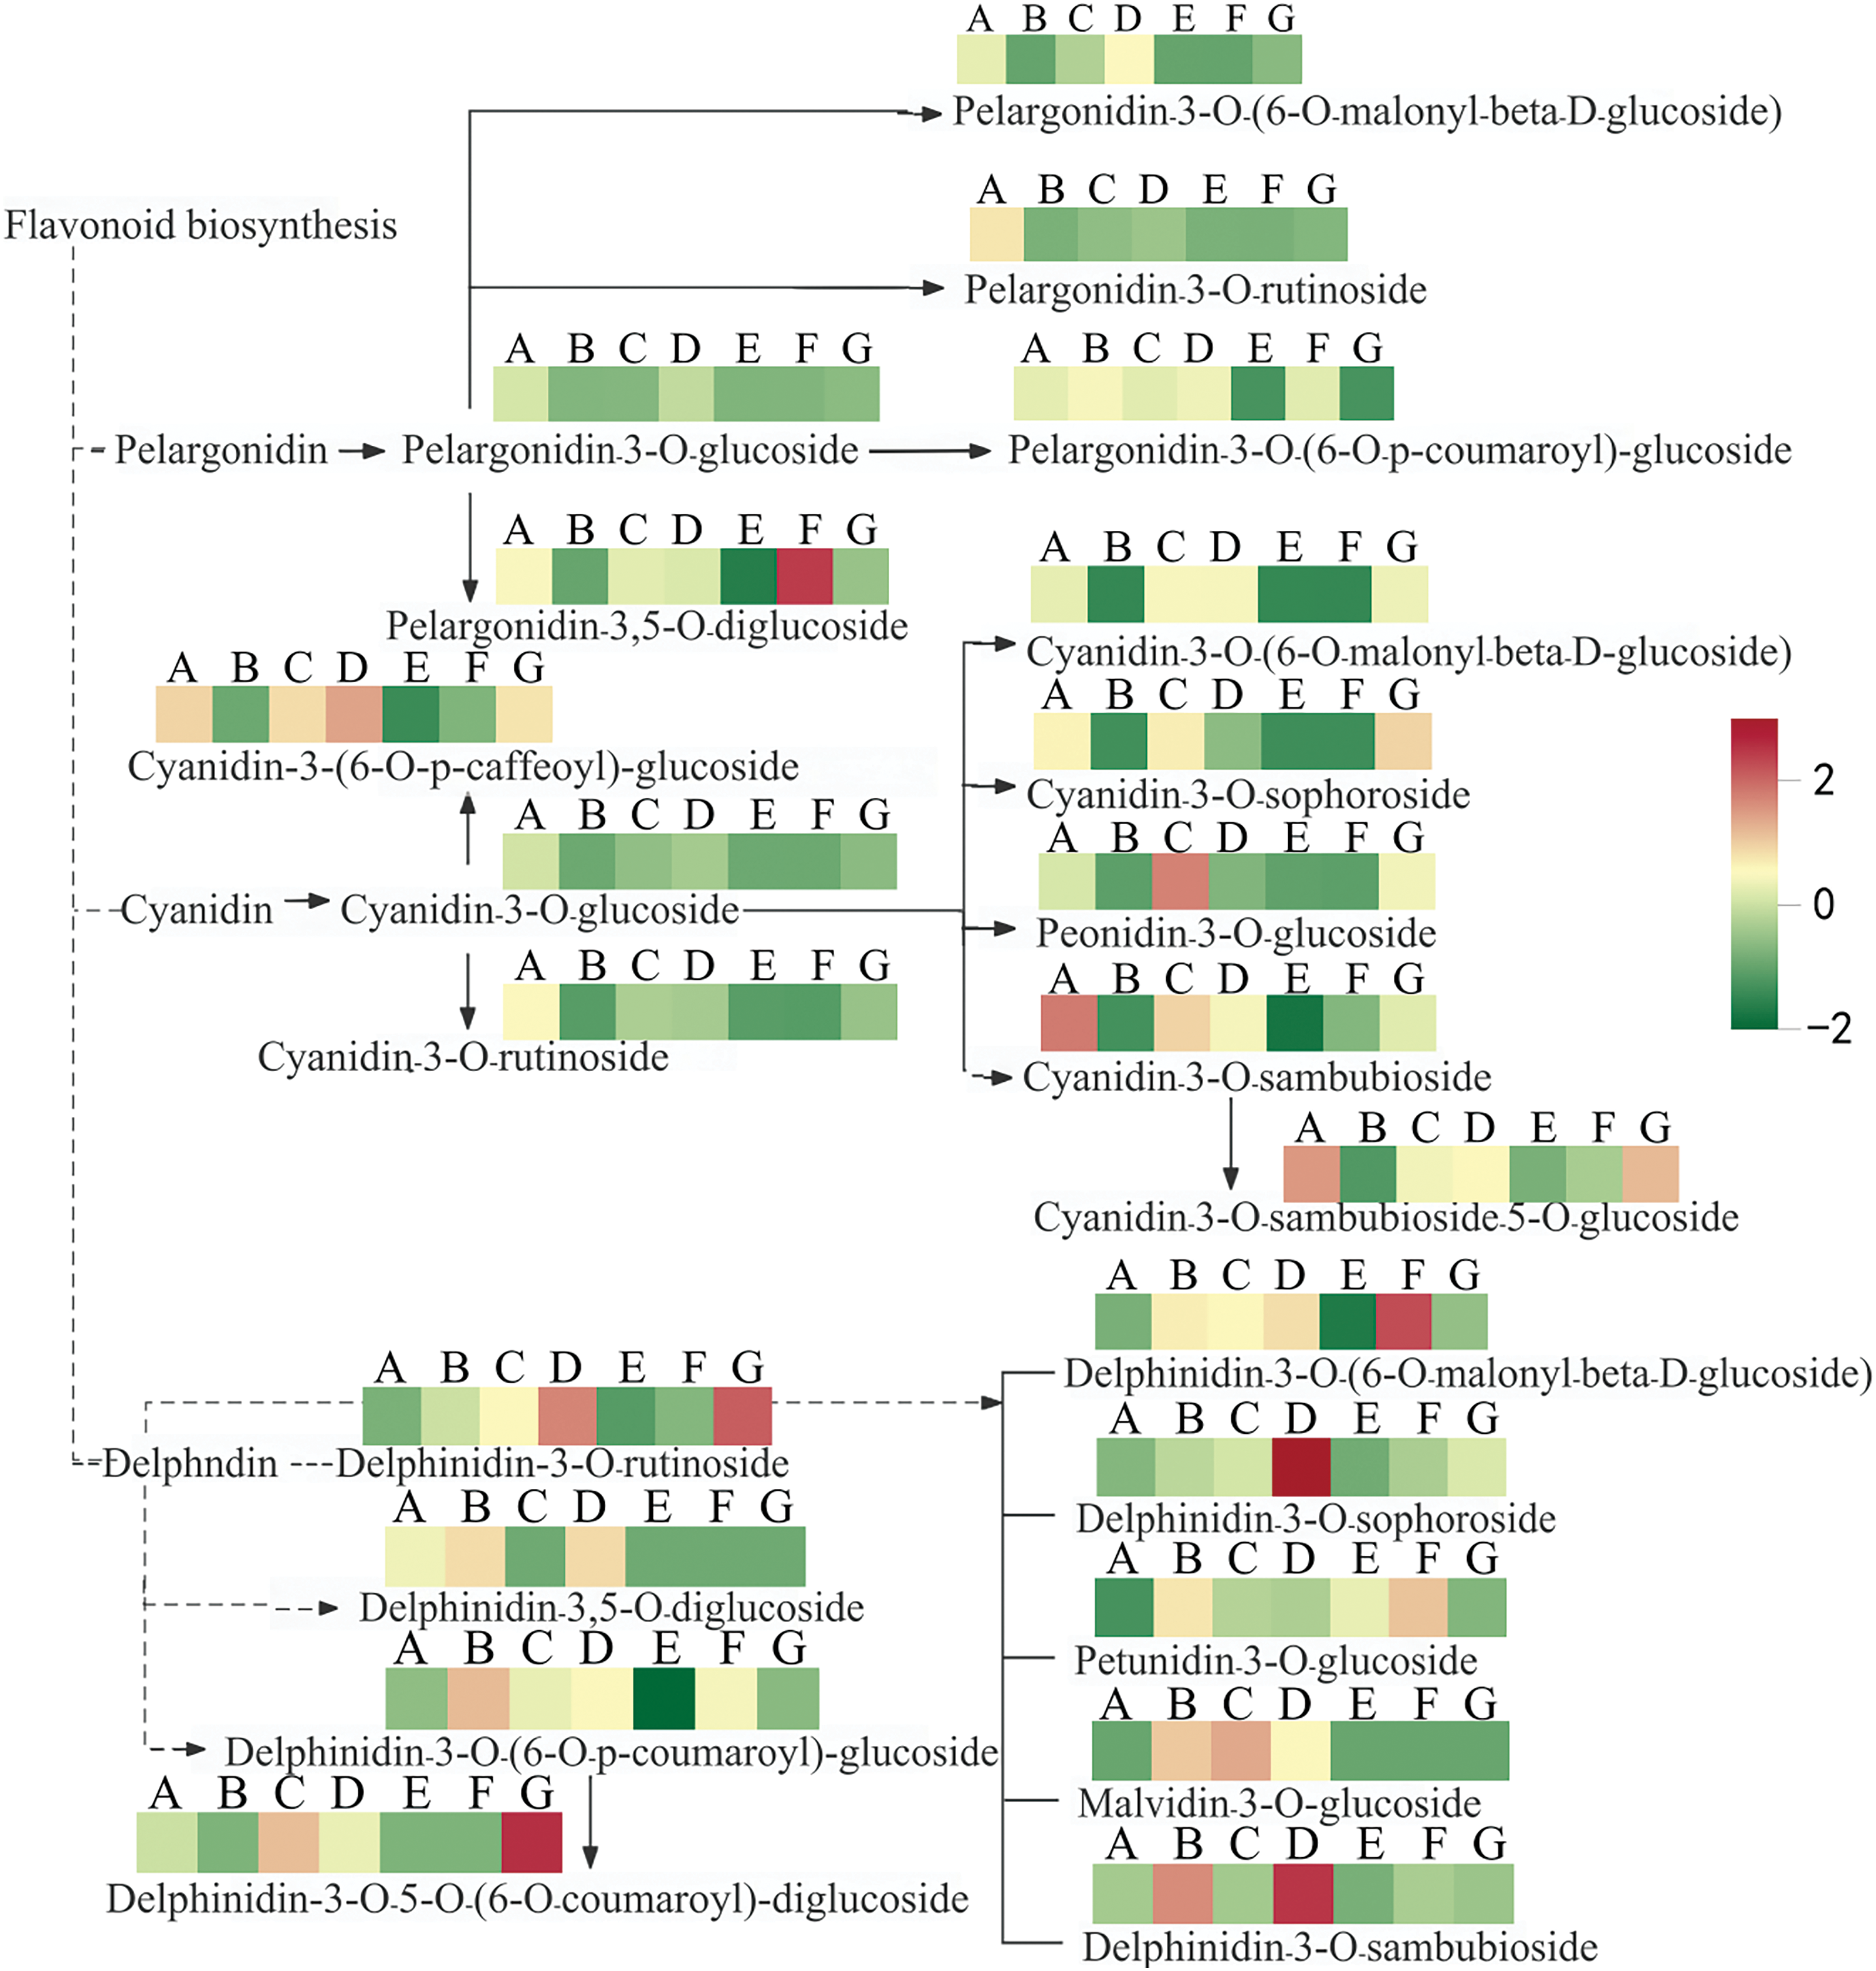
Figure 7: Pathway diagram of anthocyanin biosynthesis in C. goeringii (A is PT11, B is JQY, C is QMS, D is SC, E is MJSD, F is YMS, and G is JXQY)
A total of 64 anthocyanins were detected in the seven C. goeringii varieties, and 54, 49, 56, 56, 46, 44, and 51 metabolites were detected in PT11, JQY, QMS, SC, MJSD, YMS, and JXQY, respectively. The rutin content was highest in PT11, JQY, QMS, SC, MJSD, and YMS; the kaempferol-3-O-rutinoside content was highest in JXQY, and this was consistent with the results of previous studies in Carthamus tinctorius and varieties with white flowers [17]. This suggests that the high content of kaempferol-3-O-rutinoside in the petal is one of the factors causing the white-red color.
To identify the metabolites associated with orchid color formation, We identified six key metabolites using the p-value ≤ 0.05 criterion, including two peonidins, one cyanidin, one delphinidin, one pelargonidin, and one flavonoid. Peonidin further formed the derivative peonidin-3-O-(6-O-malonyl-beta-D-glucoside) through methyltransferase; this substance was significantly changed in each group, and its metabolite content in QMS and JXQY was significantly higher than that in other groups, which may indicate that the formation of bright yellow in QMS and red in JXQY was more affected by paeoniflorin-3-O-(6-O-malonic-β-D-glucoside); while the content of paeoniflorin-3-O-(6-O-malonic-β-D-glucoside) was significantly lower in SC, MJSD, YMS and JQY, resulting in the change of light yellow, dark yellow, light green and dark green in color, which may also mean the importance of paeoniflorin-3-O-(6-O-malonic-β-D-glucoside) in the color change of C. goeringii. Wu et al.’s [18] study on the mechanism underlying flower color formation in Prunus mume and Kong et al.’s [19] study of differences in the flower color of Cymbidium hybrids revealed that peonidin were significantly up-regulated in varieties with different flower colors, which indicates that peonidin are important metabolites involved in anthocyanin synthesis; this also confirms the results of the metabolomics analysis in this study. In this study, the procyanidin B2 in JQY and QMS, the pelargonidin-3-O-galactoside in SC, and the naringenin in MJSD showed the most significant up-regulation. Compared with PT11, the petal color of JQY and QMS showed yellow color, and the color of QMS was brighter than that of JQY; there were obvious red stripes in the middle of SC petals, while PT11 petals did not show any red change; MJSD petals showed green color that was obviously different from PT11. According to the difference in metabolite content, we concluded that procyanidin B2 was closely related to the formation of green and yellow color of C. goeringii petals, and the content of metabolites had a great impact on the depth of yellow color; the content of pelargonidin-3-O-galactoside in SC was significantly higher than that of PT11, which may be related to the expression of red stripe in SC petals; MJSD showed obvious bright green color, and the naringenin showed the most significant up-regulation in the comparison with PT11, which was obviously different from the down-regulation of other groups. Therefore, naringenin may be the reason why MJSD showed extremely bright green color, and the higher the content of naringenin, the brighter the color. Zhong et al. [20] showed that the degree of peel browning in Litchi chinensis changed with the content of proanthocyanidin, suggesting that proanthocyanidin affects variation in flower color. Liu et al. [21] showed that pelargonidin mainly resulted in red coloration. We found that SC petals were red, and pelargonidin-3-O-galactoside was significantly up-regulated, which is consistent with the findings of previous studies. Cao et al. [22] found that naringenin was significantly accumulated in purple leaves of Cymbidium ensifolium compared with leaves of other colors; this might explain changes in the color of MJSD caused by the significant up-regulation of naringenin in this study. Anthocyanidin synthase (ANS) is the most important enzyme involved in the synthesis of anthocyanins. Thus, the deletion, mutation, down-regulation, or up-regulation of ANS can alter the color of plant tissues and organs. ANS catalyzes the conversion of colorless anthocyanins into anthocyanin glycosides, which are the most important enzymes involved in anthocyanin synthesis [23]. Although the gene encoding this enzyme has been successfully isolated from plants such as Cymbidium ensifolium [13] and Paphiopedilum micranthum [24], and the expression of this gene has been shown to have a major effect on flower color in these plants, whether this gene is present in C. goeringii varieties and has similar effects remains unclear. The pigment regulation mechanisms and structural genes among different species are specific, and there are mutual influence and competition between pathways. In order to explore the correlation between anthocyanins and downstream structural genes in C. goeringii, further exploration at the molecular level is still needed in the follow-up of this study.
Previous studies have shown that the anthocyanin biosynthesis pathway plays a key role in plant color formation, and analysis of the structural genes and transcription factors involved in anthocyanin synthesis is a major focus of current research [25]. In our study, five key metabolic pathways were enriched according to KEGG pathway analysis, and two metabolic pathways, the anthocyanin biosynthesis pathway and secondary metabolite biosynthesis pathway, were relatively enriched. Several metabolites were significantly enriched in the anthocyanin biosynthesis pathway, suggesting that this pathway might play a key role in regulating the color of C. goeringii flowers. Zhang et al. [26] previously found that changes in the flavonoid biosynthesis pathway were the most significant as Anacardium occidentale flowers changed from white to red; changes in the flavonoid biosynthesis pathway were most significant, and the content of anthocyanin metabolites such as delphinidin 3-O-glucoside and peonidin-3-O-glucoside was also significantly increased in the flowering stage. Similarly, the determination of pigment types and content in two flowers and colors of Ilex verticillata also found that the content of pelargonidin-3-O-glucoside related to the anthocyanin biosynthesis pathway was significantly increased in Ilex verticillata ‘winter red’, which was the main metabolite determining the color of Ilex verticillata ‘winter red’ [27]. The above conclusions indicate that the anthocyanin synthesis pathway plays a key role in determining the color of plant tissues. This study preliminarily explored the metabolic differences of anthocyanin in the C. goeringii color, and made some preliminary exploration at the metabolic level, but did not measure other typical pigments such as flavonoids, so the specific molecular mechanism affecting the color of C. goeringii is not clear. In the future research, it is necessary to further study the coloration mechanism of C. goeringii by using multi-omics.
In this study, a targeted metabolomics analysis method based on liquid chromatography-mass spectrometry was used to analyze the metabolome of 7 different varieties of C. goeringii and 64 anthocyanin substances were detected. Among them, peonidin-3-O-(6-O-malonyl-beta-D-glucoside) changed significantly in each comparison group, and the content of QMS and JXQY was significantly higher than that of other C. goeringii, which may be the reason why they presented bright yellow and red colors. Through the metabolic pathway enrichment analysis, it was found that peonidin and other anthocyanin substances were enriched in the anthocyanin biosynthesis pathway, which indicated that paeoniflorin-3-O-(6-O-malonic-β-D-glucoside) may be the key metabolite of different C. goeringii coloring. In addition, the inconsistent yellow shade of JQY and QMS petals may be affected by the content of procyanidin B2; pelargonidin-3-O-galactoside may be the factor that shows red lines in SC petals, which was not reflected in PT11; naringenin affects the formation of bright green in MJSD, and its content may also be the key factor for the shade of green. In summary, paeoniflorin-3-O-(6-O-malonic-β-D-glucoside), procyanidin B2, pelargonidin-3-O-galactoside, and naringenin may be the metabolites that change the color of some varieties of C. goeringii or between varieties. We identified six shared DAMs, and the functions of these DAMs were clarified in the KEGG analysis. The association between patterns of metabolite accumulation with differences in flower color was determined; the mechanism underlying the color formation of C. goeringii varieties was also clarified. Overall, our findings will aid future studies of the regulation of flower color in C. goeringii at the molecular level, as well as the breeding of new C. goeringii varieties.
Acknowledgement: We thank Na Hou for providing linguistic assistance during the preparation of this manuscript.
Funding Statement: This work was supported by the Study on Resource Collection and New Variety Breeding of the Guizhou Mountainous Characteristic Flower C. goeringii (QianKeHe [2022] General 107) and the Key Laboratory of National Forestry and Grassland Administration on Biodiversity Conservation in Karst Mountainous Areas of Southwestern China, Guizhou Academy of Forestry.
Author Contributions: Conceptualization: Yuxue Zhao, Yueyun Wang; Data Curation: Ai Rao; Formal Analysis: Lianwen Shen, Shengqun Chen, Xia Jiang; Writing-Original Draft: Dongbo Wu, Shuang Qu. All authors reviewed the results and approved the final version of the manuscript.
Availability of Data and Materials: The data that support the findings of this study are available from the corresponding authors, Yuxue Zhao and Yueyun Wang, upon reasonable request.
Ethics Approval: Not applicable.
Conflicts of Interest: The authors declare that they have no conflicts of interest to report regarding the present study.
Supplementary Materials: The supplementary material is available online at https://doi.org/10.32604/phyton.2024.051652.
References
1. Liu L, Ye J, Li P, Tu P. Chemical constituents from tubers of Cremastra appendiculata. China J Chin Mater Med. 2014;39(2):250–3 (In Chinese). [Google Scholar]
2. Xue Z, Li S, Wang SJ, Wang YH, Yang YC, Shi JG, et al. Mono-, Bi-, and triphenanthrenes from the tubers of Cremastra appendiculata. J Nat Prod. 2006;69(6):907–13. doi:10.1021/np060087n. [Google Scholar] [PubMed] [CrossRef]
3. Li YY, Zou J, Wang XB, Zhou Q. Wild orchid resources and their protection in Guizhou. J Jiangsu for Sci & Technol. 2012;39(5):55–7 (In Chinese). [Google Scholar]
4. Ling XQ. Study on flowering regulation and technique optimization of tissue culture of Chinese Orchid (Master’s Thesis). University of Zhejiang: Hangzhou, China; 2016. [Google Scholar]
5. Gong XY, Zhao JF, Wang JS, Zhu YR. Resources of wild Orchidaceae medicinal plants in Jinhua area of Zhejiang province. Chin Wild Plant Resources. 2023;42(5):99–105 (In Chinese). [Google Scholar]
6. Hu HQ, Yu ZP, Wang GB, Liu XY. Resources of Orchidaceae medicinal plants in Jiangxi Province. Chin J Exp Tradit Med Formulae. 2019;25(21):148–54 (In Chinese). [Google Scholar]
7. Ran JC, Yu R, Liu J, Lu CW. The ethnic medicinal orchid plants and its protected strategy in Maolan nature reserve. J Guizhou Norm Univ. 2012;30(1):1–5 (In Chinese). [Google Scholar]
8. Li X, Duan JJ, Luo XN, Zhang YL. Formation mechanism of different tree peony flower colors by anatomy and biochemistry. J Northeast For Univ. 2019;47(3):38–43+67 (In Chinese). [Google Scholar]
9. He J, Giusti MM. Anthocyanins: natural colorants with health-promoting properties. Annu Rev Food Sci Technol. 2010;1(1):163–87. doi:10.1146/food.2010.1.issue-1. [Google Scholar] [CrossRef]
10. Zhou H. Mechanisms underlying the regulation of anthocyanin coloration and proanthocyanidin synthesis in peach (Master’s Thesis). University of Chinese Academy of Sciences: Beijing, China; 2015. [Google Scholar]
11. Wang XT. Transcriptional and metabolic analysis of anthocyanin synthesis regulated by blue light in postharvest purple sweet pepper (Master’s Thesis). Shandong Agricuitural University: Taian, China; 2022. [Google Scholar]
12. Peng JQ, Dong XJ, Xue C, Liu ZM. Exploring the molecular mechanism of blue flower color formation in Hydrangea macrophylla cv. “forever summer”. Front Plant Sci. 2021;12:585665. doi:10.3389/fpls.2021.585665. [Google Scholar] [PubMed] [CrossRef]
13. Li WJ, Feng J, Jia WQ, Shen YB. Molecular regulation mechansim of floral color formation in Cymbidium ensifolium. Acta Bot Boreali-Occident Sin. 2018;38(24):615–23. [Google Scholar]
14. Hew CS, Yong JWH. The physiology of tropical orchids in relation to the industry. Singapore: World Scientific; 2004. [Google Scholar]
15. Ding L. Relative expression and the analysis of key genes associated with the formation of floral color and scent in phalaenopsis type dendrobium (Master’s Thesis). University of Hainan: Haikou, China; 2016. [Google Scholar]
16. Ferrars RMD, Czank C, Saha S, Needs PW, Zhang QZ, Raheem KS, et al. Methods for isolating, identifying, and quantifying anthocyanin metabolites in clinical samples. Anal Chem. 2014;86(20):10052–8. doi:10.1021/ac500565a. [Google Scholar] [PubMed] [CrossRef]
17. Yu D, Chen YS, Hu SQ, Zhang H. Determination of total flavonoids and kaempferol-3-O-rutinoside in Safflower produced in Sichuan and Safflower vatiety named white flower. West China J Pharm Sci. 2010;25(26):751–3 (In Chinese). [Google Scholar]
18. Wu SH, Zhu HH, Zhang JW, Bao MZ. Determination and analysis of flavonoids metabolites in different colors cultivars and blooming stages of prunus mume. Chin Agric Sci. 2023;56(9):1760–74 (In Chinese). [Google Scholar]
19. Kong L, Lin RY, Fan RH, Lin B. Flavonoids component analysis in Cymbidium hybrid petals and its effects on flower coloration. Acta Bot Boreali-Occident Sin. 2022;42(10):1711–9. [Google Scholar]
20. Zhong RH, Wei JB, Liu B, Luo HH. Metabolite and transcriptome profiles of proanthocyanidin biosynthesis in the development of Litchi fruit. Int J Mol Sci. 2022;24(1):532. doi:10.3390/ijms24010532. [Google Scholar] [PubMed] [CrossRef]
21. Liu HM, Liu ZJ, Wu Y, Zheng LM. Regulatory mechanisms of anthocyanin biosynthesis in apple and pear. Int J Mol Sci. 2021;22(16):8441. doi:10.3390/ijms22168441. [Google Scholar] [PubMed] [CrossRef]
22. Cao H, Li H, Chen X, Zhang YY. Insight into the molecular mechanisms of leaf coloration in Cymbidium ensifolium. Front Genet. 2022;13:923082. doi:10.3389/fgene.2022.923082. [Google Scholar] [PubMed] [CrossRef]
23. Bai JJ. Analysis of metabolome reveals the mechanism of color formation in pepper fruit (Capsicum annuum L.) (Master’s Thesis). Shanxi Agricultural University: Taiyuan, China; 2022. [Google Scholar]
24. Deng XY. The ecological function and genetic basis of floral color in Paphiopedilum micranthum (Master’s Thesis). Guizhou Normal University: Guiyang, China; 2023. [Google Scholar]
25. Wu XX, Zhang AD, Zhu ZW, Yao J. Research on plants anthocyanin biosynthesis metabolic pathway and its regulator factors. Acta Agriculturae Shanghai. 2018;34(4):127–32 (In Chinese). [Google Scholar]
26. Zhang ZR, Huang WJ, Zhao L, Xiao LY. Integrated metabolome and transcriptome reveals the mechanism of the flower coloration in cashew Anacardium occidentale. Sci Hortic. 2024;324(7):112617. [Google Scholar]
27. Li F, Zhou P, Huang J, Zhang M. Fruit color and its coloring mechanism of two Ilex verticillata cultivars. J Zhejiang for Sci Technol. 2023;43(4):34–41 (In Chinese). [Google Scholar]
Cite This Article
 Copyright © 2024 The Author(s). Published by Tech Science Press.
This work is licensed under a Creative Commons Attribution 4.0 International License , which permits unrestricted use, distribution, and reproduction in any medium, provided the original work is properly cited.
 Downloads
 Citation Tools