
 Submit a Paper
 Propose a Special lssue
 Open Access
ARTICLE

YOLO-CRD: A Lightweight Model for the Detection of Rice Diseases in Natural Environments
1 Tianjin Key Laboratory of Intelligent Breeding of Major Crops, Tianjin Agricultural University, Tianjin, 300392, China
2 College of Computer and Information Engineering, Tianjin Agricultural University, Tianjin, 300392, China
* Corresponding Author: Tonghai Liu. Email:
Phyton-International Journal of Experimental Botany 2024, 93(6), 1275-1296. https://doi.org/10.32604/phyton.2024.052397
Received 01 April 2024; Accepted 16 May 2024; Issue published 27 June 2024
 View Full Text
 Download PDF
Abstract
Rice diseases can adversely affect both the yield and quality of rice crops, leading to the increased use of pesticides and environmental pollution. Accurate detection of rice diseases in natural environments is crucial for both operational efficiency and quality assurance. Deep learning-based disease identification technologies have shown promise in automatically discerning disease types. However, effectively extracting early disease features in natural environments remains a challenging problem. To address this issue, this study proposes the YOLO-CRD method. This research selected images of common rice diseases, primarily bakanae disease, bacterial brown spot, leaf rice fever, and dry tip nematode disease, from Tianjin Xiaozhan. The proposed YOLO-CRD model enhanced the YOLOv5s network architecture with a Convolutional Channel Attention Module, Spatial Pyramid Pooling Cross-Stage Partial Channel module, and Ghost module. The former module improves attention across image channels and spatial dimensions, the middle module enhances model generalization, and the latter module reduces model size. To validate the feasibility and robustness of this method, the detection model achieved the following metrics on the test set: mean average precision of 90.2%, accuracy of 90.4%, F1-score of 88.0, and GFLOPS of 18.4. for the specific diseases, the mean average precision scores were 85.8% for bakanae disease, 93.5% for bacterial brown spot, 94% for leaf rice fever, and 87.4% for dry tip nematode disease. Case studies and comparative analyses verified the effectiveness and superiority of the proposed method. These research findings can be applied to rice disease detection, laying the groundwork for the development of automated rice disease detection equipment.Keywords
Rice is a primary staple food and a universally beloved crop globally [1]. As per the Food and Agriculture Organization, an estimated 222 million individuals across the planet will experience severe food insecurity by the conclusion of 2022, and approximately one out of every five will face challenges in obtaining an adequate food supply for their sustenance [2]. Rice production must increase by more than 40% by 2030 to meet the world’s growing demand for food [3]. However, crop production has many challenges, such as natural disasters, water shortages, and diseases [4]. Escalating global trade and changing climate conditions have made plant pests and diseases a more substantial menace to food security than ever before, contributing to the loss of 20% to 40% of the world’s total food production [5]. In tropical Asia, the yield loss caused by rice pests is 25%–43% [6]. The leading solution for plant diseases is the application of pesticides [6]. Nearly 4 million tons of pesticides are used every year, with 90% being taken up in the surrounding environment through sprays, roll-offs, and rain, resulting in only a tiny amount of pesticides reaching the target organisms [7]. Off-target losses lead to environmental pollution of mainly water and land [8]. The presence of these pollutants in the ecosystem endangers the survival of other organisms [9]. Therefore, reducing the use of pesticides in agriculture is essential for sustainable global development. Rice is an essential food crop, and the identification of early diseases of rice leaves can reduce the use of harmful pesticides.
At present, bakanae disease, bacterial brownspot, leaf rice fever, and dry tip nematode disease are the more common rice diseases. They occur throughout the rice reproductive period and have significant impacts on the yield and quality of rice. In severe cases, they lead to significant reductions in rice yield, which have enormous impacts on growers. Early identification of rice diseases in the field is a critical step in managing the detection and spread of rice diseases [10]. Early pest identification currently relies mainly on human observations of disease symptoms, and essential disease treatments are based on climate characteristics and a priori knowledge. In contrast, the diagnosis and treatment of low-frequency pest diseases rely on expert knowledge and literature reviews. The above methods require experience and education to make judgments. The accuracy of identification relies mainly on the experience of plant pathologists or farmers. However, during the rice reproductive period, the same disease may manifest different disease symptoms, making its identification challenging, and there are also different diseases that share characteristic and symptoms [11]. Additionally, the large rice cultivation area, an expert workforce shortage [12], farmers lacking experience, and other human factors add to the difficulty in preventing and controlling rice pests and diseases. Rice pests and diseases have complex and variable symptoms, and the lack of farm managers treatment plans and preventive measures for new symptomatic diseases are also factors that negatively impact rice disease prevention and control [13].
Advancements in science and technology have prompted researchers to employ deep-learning techniques in the identification of rice diseases. Zhou et al. [14] proposed a residual distillation transformer architecture, achieving an F1-score of 0.89 and an accuracy rate of 92%. Sudhesh et al. [15] introduced a dynamic pattern decomposition technique that relied on attention-driven preprocessing. They investigated four rice diseases, achieving an impressive classification accuracy of 94.33%. Kumar et al. [16] examined the RDTNet module designed for the extraction of distinct characteristics related to rice diseases. RDTNet is composed of two core modules: the initial module focuses on capturing features at three different scales from local binary mode, grayscale, and directional gradient histogram images. Stephen et al. [17] improved the feature selection process by using self-attention mechanisms in ResNet18 and ResNet34 architectures, resulting in a better accuracy for the model compared to ResNet50. While this algorithm can be applied to identify diseases in other crops, models trained on laboratory environmental data struggle to perform well in practical applications. Tepdang et al. [18] proposed a method for classifying and estimating the severity of diseases on rice leaf images. The method first identifies candidate boundaries of rice leaves and then recognizes rice diseases based on features such as color, shape, and area ratio. Lu et al. [19] proposed an ACNN-TL model based on a convolutional neural network (CNN) structure combined with Atrous convolution and transfer learning. Compared with standard convolution, Atrous convolution increases the receptive field size in feature extraction, enriching the extracted feature details. Abasi et al. [20] specifically designed a CNN model for rice images that has the advantages of low loss and minimal overfitting compared with other models. Yuan et al. [21] proposed a rice disease phenotype identification framework utilizing transfer learning on a cloud platform and SENet with an attention mechanism. Bijoy et al. [22] proposed a lightweight deep CNN architecture and an enhanced dataset. Based on this network, a comprehensive crop health monitoring system, including a user-friendly website and an Android application, has been developed.
Target detection technology can identify multiple diseases at the same time. There are two main types of network models in target detection: one-stage and two-stage. The most representative two-stage detector, is the faster R-CNN. Wang et al. [23] used two-stage segmentation to study the extent of cucumber disease. First the DeepLabV3+ network was used to segment the background of the images and then U-Net was used to segment the leaves to obtain the disease spots. Li et al. [24] used Faster-RCNN to detect rice diseases with 87.2% accuracy. Eguskiza Garcia et al. [25] used the Siamese network to identify 17 diseases in 5 crops. The one-stage detectors include You Only Look Once (YOLO) and SSD. YOLO, functioning as a one-stage model, streamlines the network architecture and reduces computational expenses by unifying the tasks of detection, classification, and localization into a single regression problem. YOLO applications in agriculture are being studied. Nan et al. [26] proposed a YOLOv3-based dragon fruit detection model for complex environments. Zheng et al. [27] proposed a YOLOv4-based tomato detection model. Deng et al. [28] proposed a YOLOWeeds model to detect multiple weeds in cotton production. Zhao et al. [29] proposed a YOLO-GP model to detect grape bunches and their picking points. Kiratiratanapruk et al. [30] used YOLOv3 to identify six rice diseases and obtained a mean average precision (mAP) of 79.19%. Tian et al. [31] performed apple anthracnose data enhancement and then optimized the YOLOv3 model using a densely connected neural network. Cui et al. [32] developed a rice disease image classification network utilizing the Rice Leaf Plaque net as the underlying network and integrating the YOLOv3 object detection network model. They optimized the feature extraction process, providing a new approach for rice disease identification and lesion detection. Jia et al. [33] proposed a rice disease and pest recognition model based on the improved YOLOv7 algorithm. Experimental results demonstrated an accuracy of 92.3% and a mAP of 93.7%. Thus, using YOLO in agriculture is feasible. However, some studies were conducted using publicly available datasets, such as Plant Village, AI Challenger 2018, LifeCLEF, and Malayakew. Mohanty et al. [34] trained a model using a publicly available dataset collected under laboratory conditions and found that the model did not work well in a real-world environment. Data collected under natural conditions provide more features than open datasets, and most models cannot extract useful features from the complex background [35]. In addition, rice, as a grass-like plant, presents highly detailed images, and the difference between foreground and background is relatively small [10], which makes recognition more difficult. Additionally, among rice diseases, there is limited research on bakanae. In the context of rice cultivation, timely disease detection minimizes the adverse effects on rice yield and quality, as well as reducing the necessity for pesticide use.
To address the issues of most studies using open data and there being limited studies on bakanae disease, a rice disease detection model was proposed to improve the accuracy of rice disease detection and provide technical support for disease detection. Here are the main contributions of YOLO-CRD:
1. C3 Convolutional Channel Attention Module (CBAM) design as the backbone improved the model’s ability to extract texture and color from images, resulting in the model obtaining better features.
2. The Spatial Pyramid Pooling Cross-Stage Partial Channel (SPPCSPC) module enhanced the model’s receptive field and feature expression capability by employing multi-scale spatial pyramid pooling and convolution operations.
3. A dataset analysis revealed that using use GhostNet reduced the model’s size.
2.1 Introduction to the Xiaozhan Rice
Xiaozhan was the main variety studied. Tianjin Xiaozhan rice is a famous high-quality rice in China, which is produced in Xiaozhan Town, Jinnan District, Tianjin. Xiaozhan rice has several subtypes, including Jingyuan 89 and Jingyuan U99. The experimental data was collected from small-station rice Jingyuan 89 and Jingyuan U99. The primary studies included bakanae, bacterial brown spot, leaf rice fever, and dry tip nematode disease. The main target is the nodulation and gestation stages of small-station rice.
The experiment was conducted at the Tianjin Quality Agricultural Products Development Demonstration Center from July to August 2022. The center is located at 119.47°E longitude and 31.89°N latitude, and it experiences a continental monsoon climate with an average annual temperature of 11.2°C. The image acquisition area is shown in Figs. 1 and 2. The image acquisition period was from July 15 to August 15, 2022, and the primary data collected were rice plucking and gestation diseases. The device used for image acquisition was a smartphone. The resolution of the captured images was 3024 × 4032 pixels. Images were labeled in accordance with the guidance of authoritative experts. In total, 3357 valid data were collated, including 408 for bakanae disease, 1075 for leaf rice fever, 856 for dry tip nematode, and 1018 for the bacterial brownspot. The leaves of disease-infected plants had darkened and yellowed leaf colors and curled and folded leaves compared with healthy leaves; These differences formed the bases for distinguishing between diseased and healthy. Most of the diseased leaf images collected showed early disease symptoms, because the early signs were more apparent. The complicated background made identification difficult. The main images of the collected data are shown in Fig. 3.
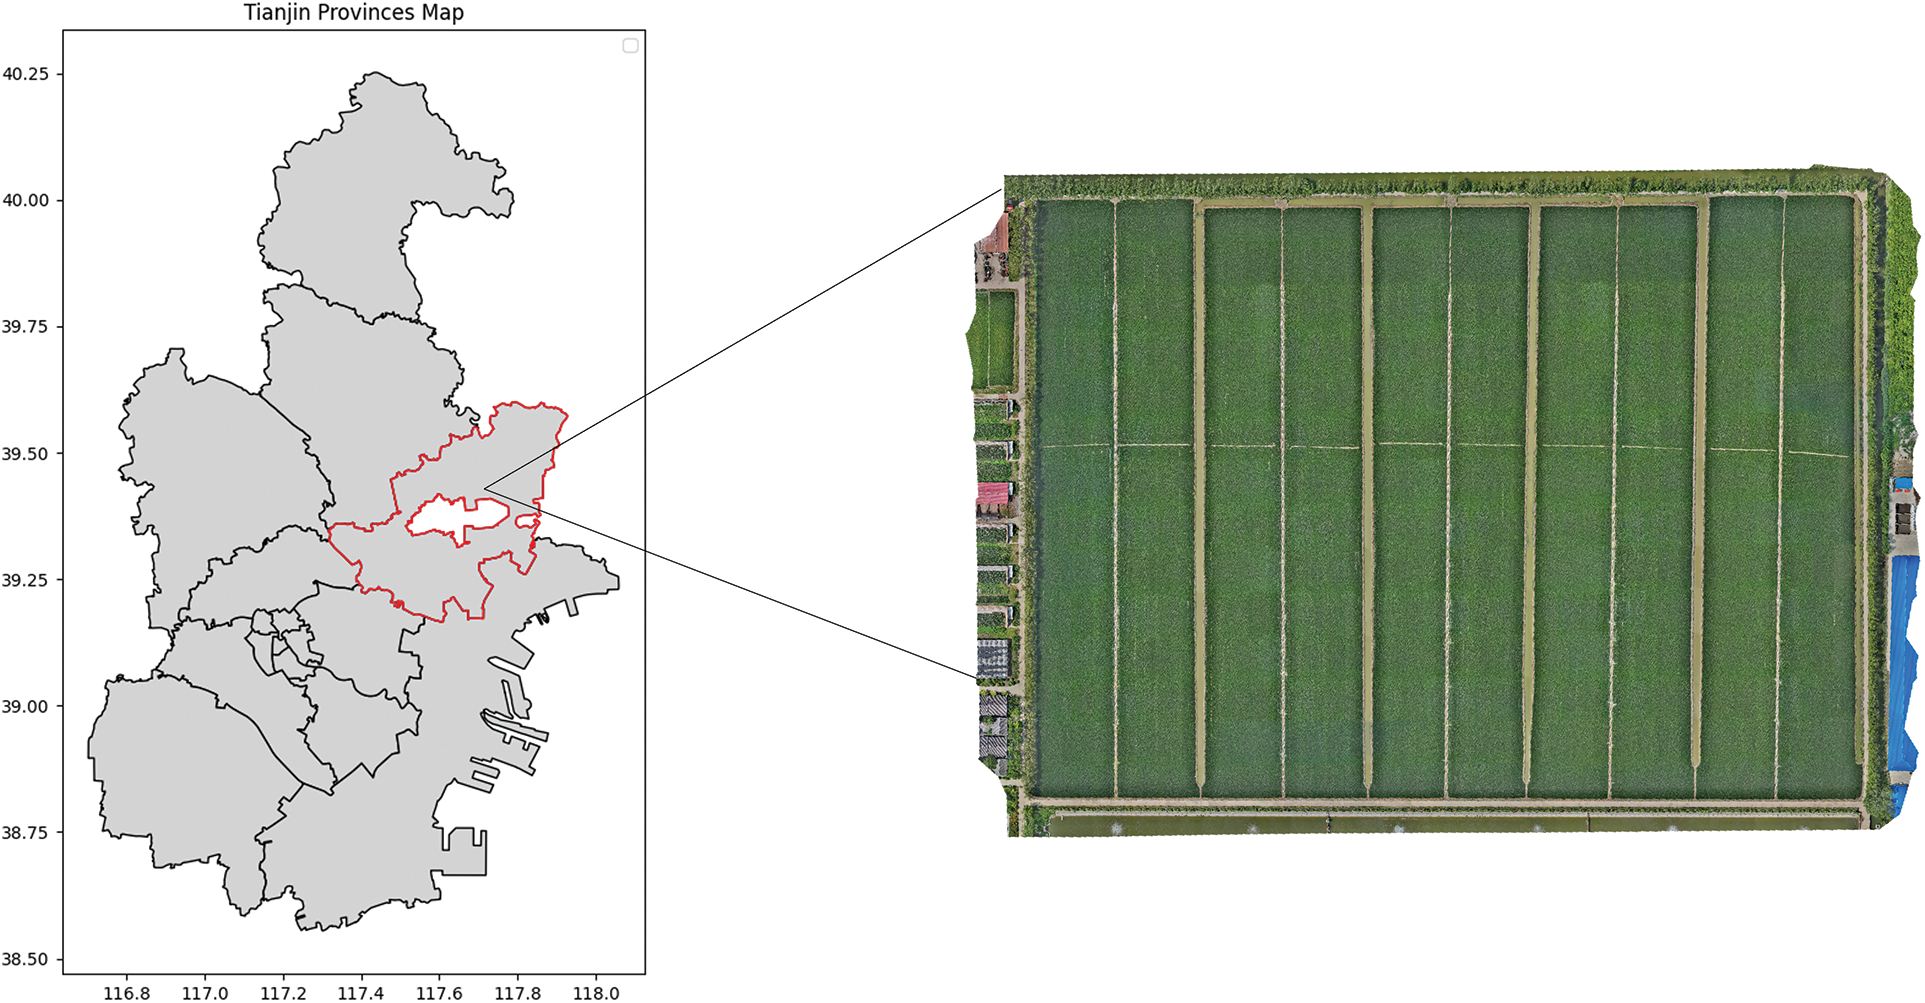
Figure 1: Experimental area diagram
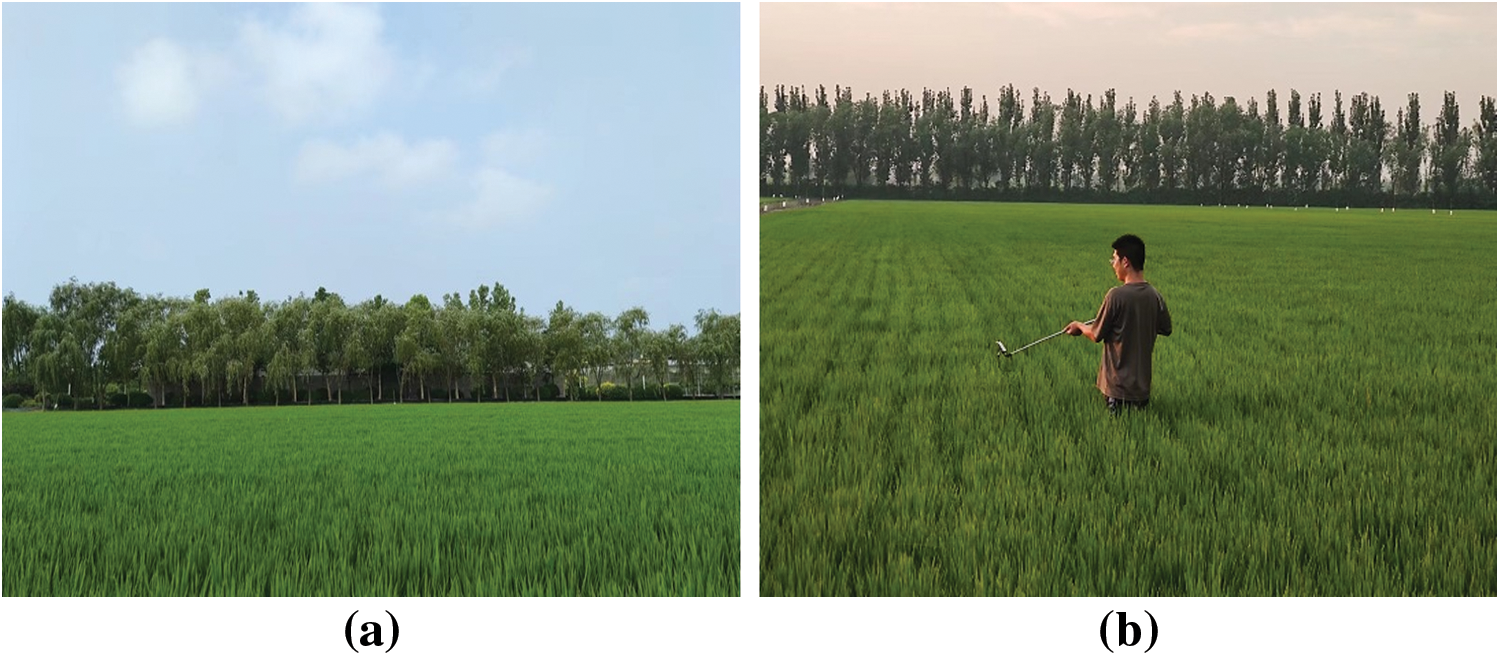
Figure 2: The image acquisition area, (a) real view of rice field, (b) on-site collection
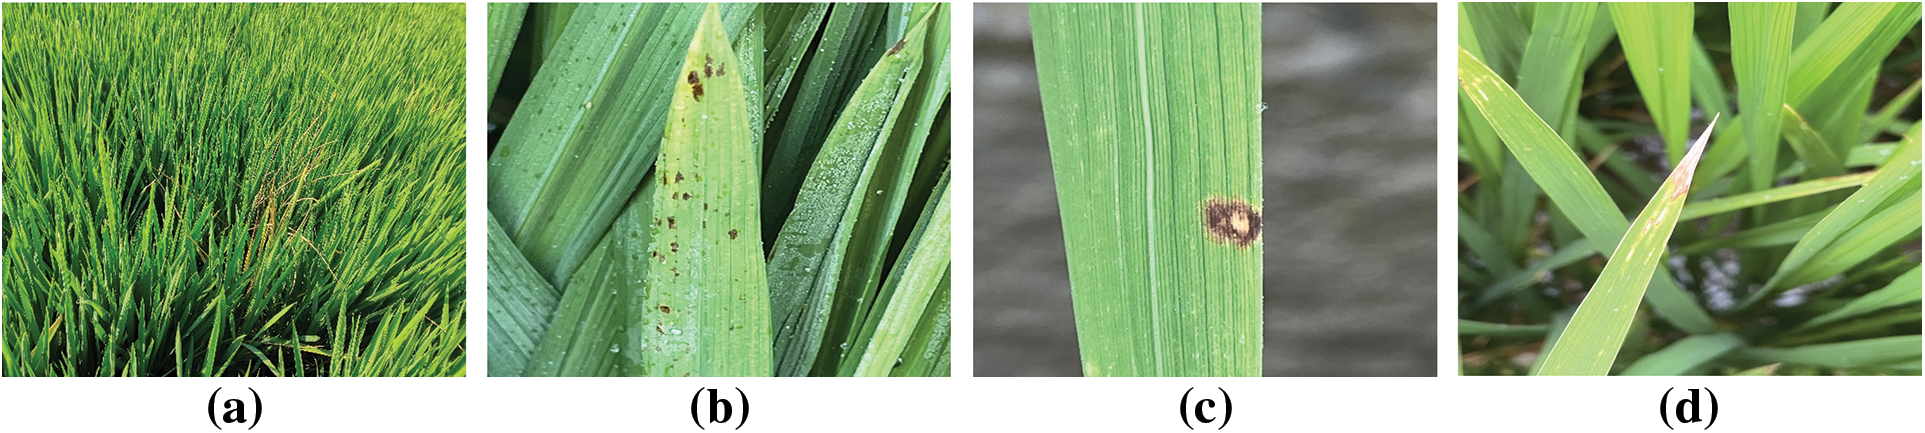
Figure 3: Some of the collected datasets, (a) bakanae disease, (b) bacterial brownspot, (c) leaf rice fever, (d) dry tip nematode disease
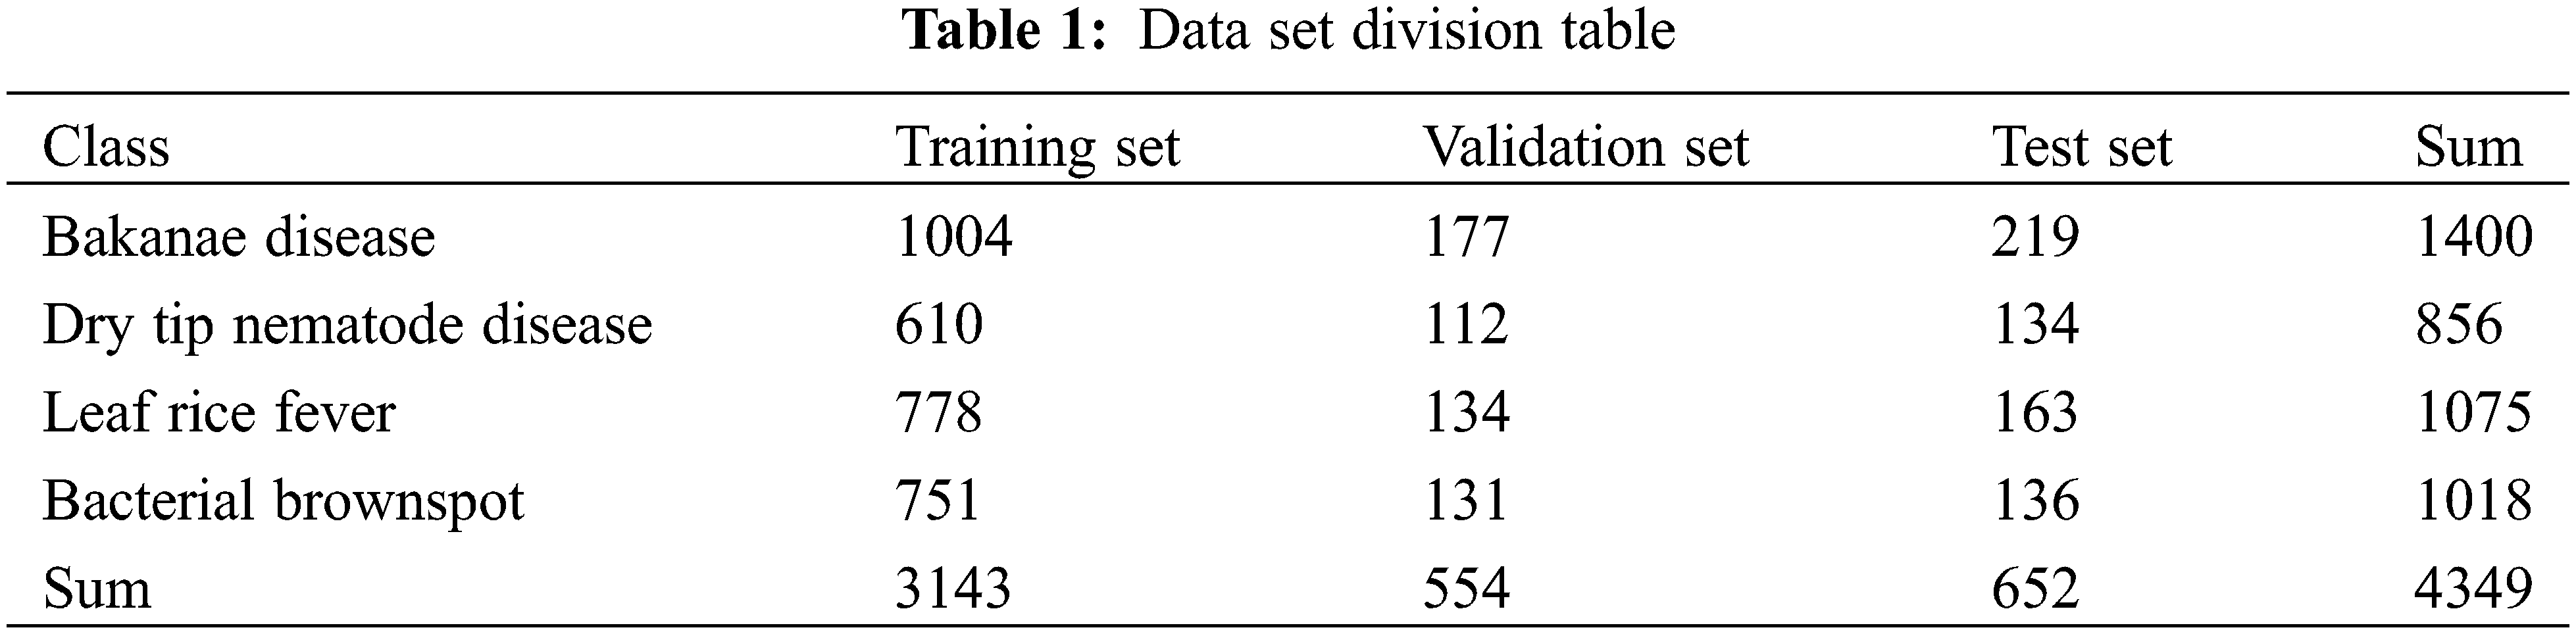
Owing to time, equipment, and locational limitations, the acquired rice disease dataset was small. Hence, it was imperative to enlarge the dataset to enhance the variety of training samples, mitigate model overfitting, and enhance the model’s generalization capacity. The data were expanded by adjusting the images, including zooming in and out, flipping horizontally and vertically, adjusting brightness, panning, adding noise, and rotating, as shown in Fig. 4. The noise increase mimicked lower-resolution camera images, but no other modifications were made to the images. The dataset was divided into a training set (train), a validation set (val), and a test set (test), where (train + val): test = 8.5:1.5 and train:val = 8.5:1.5. The dataset sizes for training, validation, and testing were 3143, 554, and 652, respectively, as shown in Table 1.
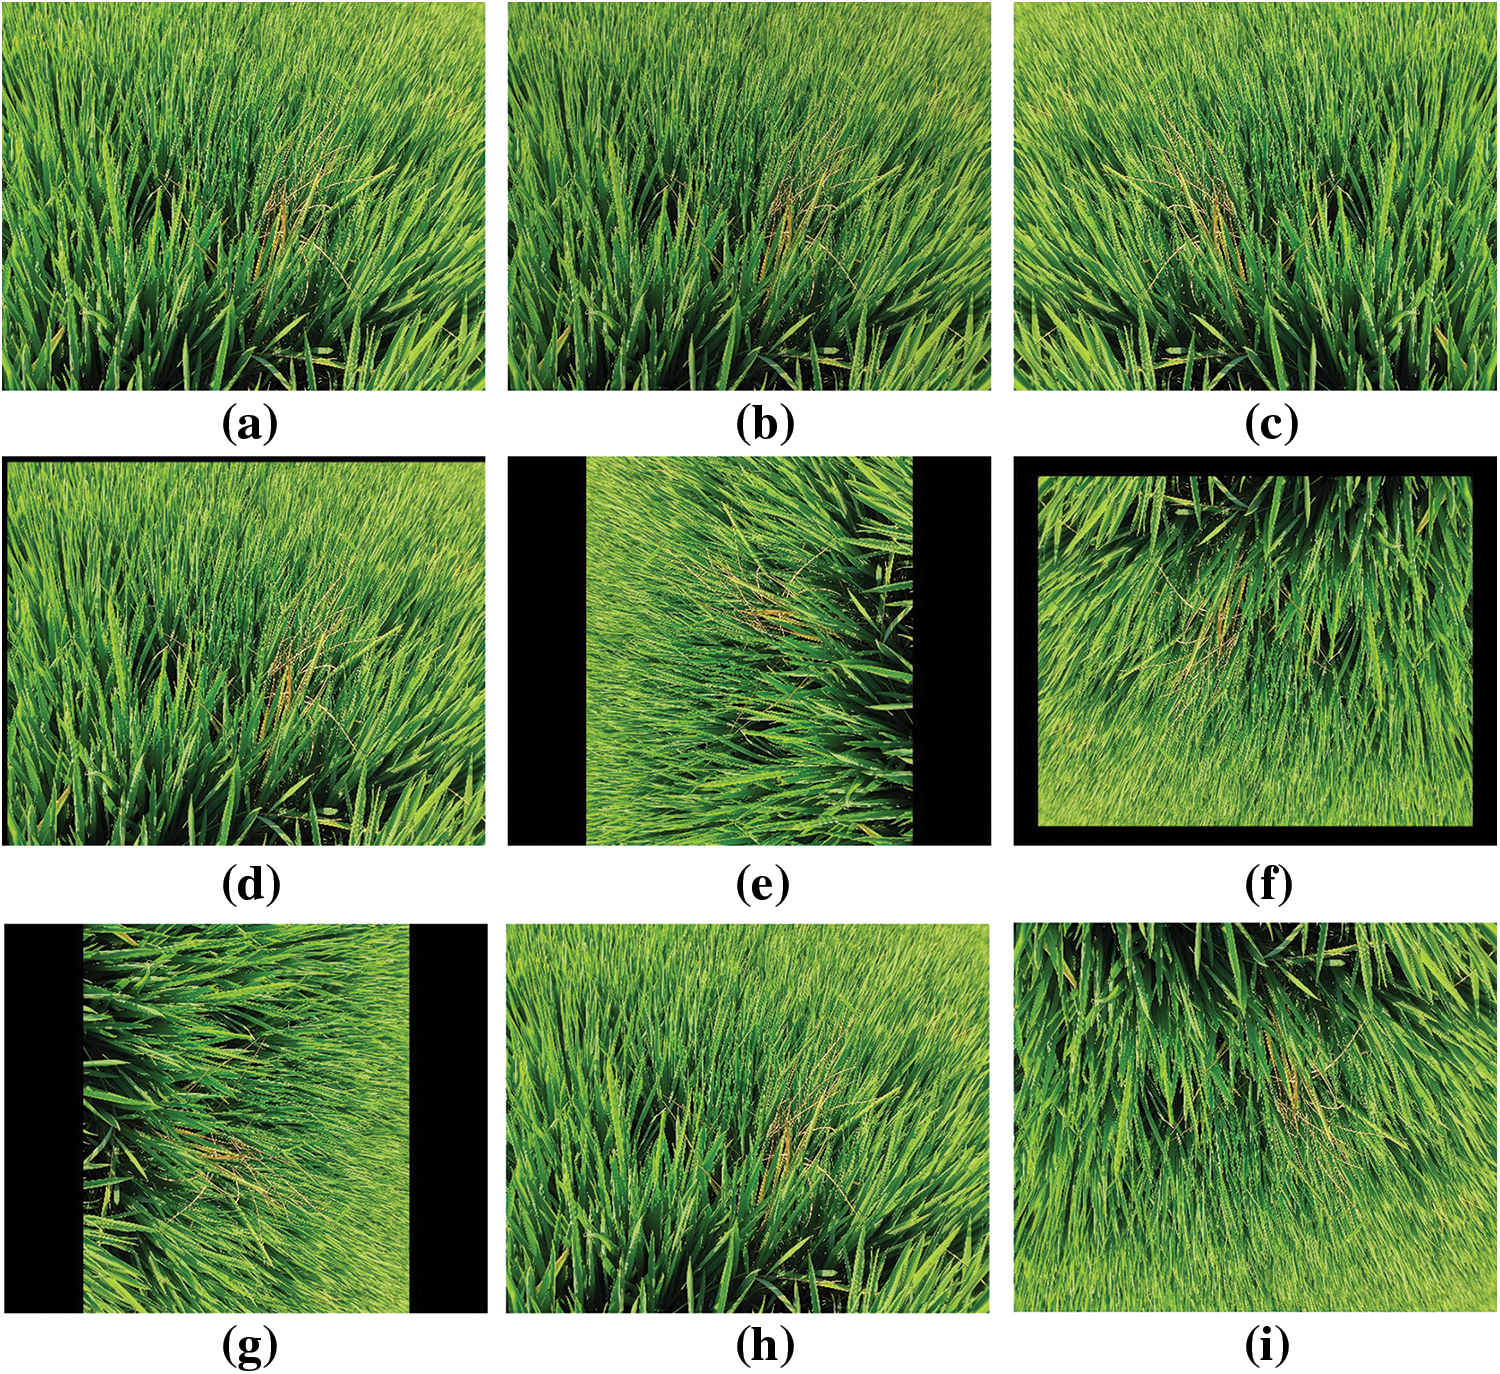
Figure 4: Data enhancement section demo, (a) Original image, (b) Darken, (c) Flip horizontally, (d) Move, (e) Flip 90 degrees, (f) Flip 180 degrees, (g) Flip 270 degrees, (h) Enlarge, (i) Flip vertically
The structure of the YOLO algorithm consists of four parts: input, backbone, neck, and prediction. Each part is integrated into the YOLO network to predict each bounding box’s features of the target region in the image. Here YOLO divided the inputted rice disease image into N × N grids. If the center of the rice disease fell within a grid, then grid was responsible for detecting the rice disease image. Each grid unit predicted bounding boxes and their confidence scores. If no disease appeared in the grid, then the confidence score should be 0. Each restricted grid contained five predictions: x, y, w, h, and confidence level. The (x, y) coordinates represented the center of the grid’s boundaries. Width (w) and height (h) represented the predicted overall width and height of the rice disease image, respectively. Each grid could also predict the likelihood of classification, which depended on the grid unit containing the target. Regardless of the grid size, a set of category probabilities was based on predictions made for each grid [36]. When the grid unit contained part of the true data box, then the value of Pr (object) was 1; otherwise, it was 0. The structure of YOLOv5 is shown in Fig. 5.
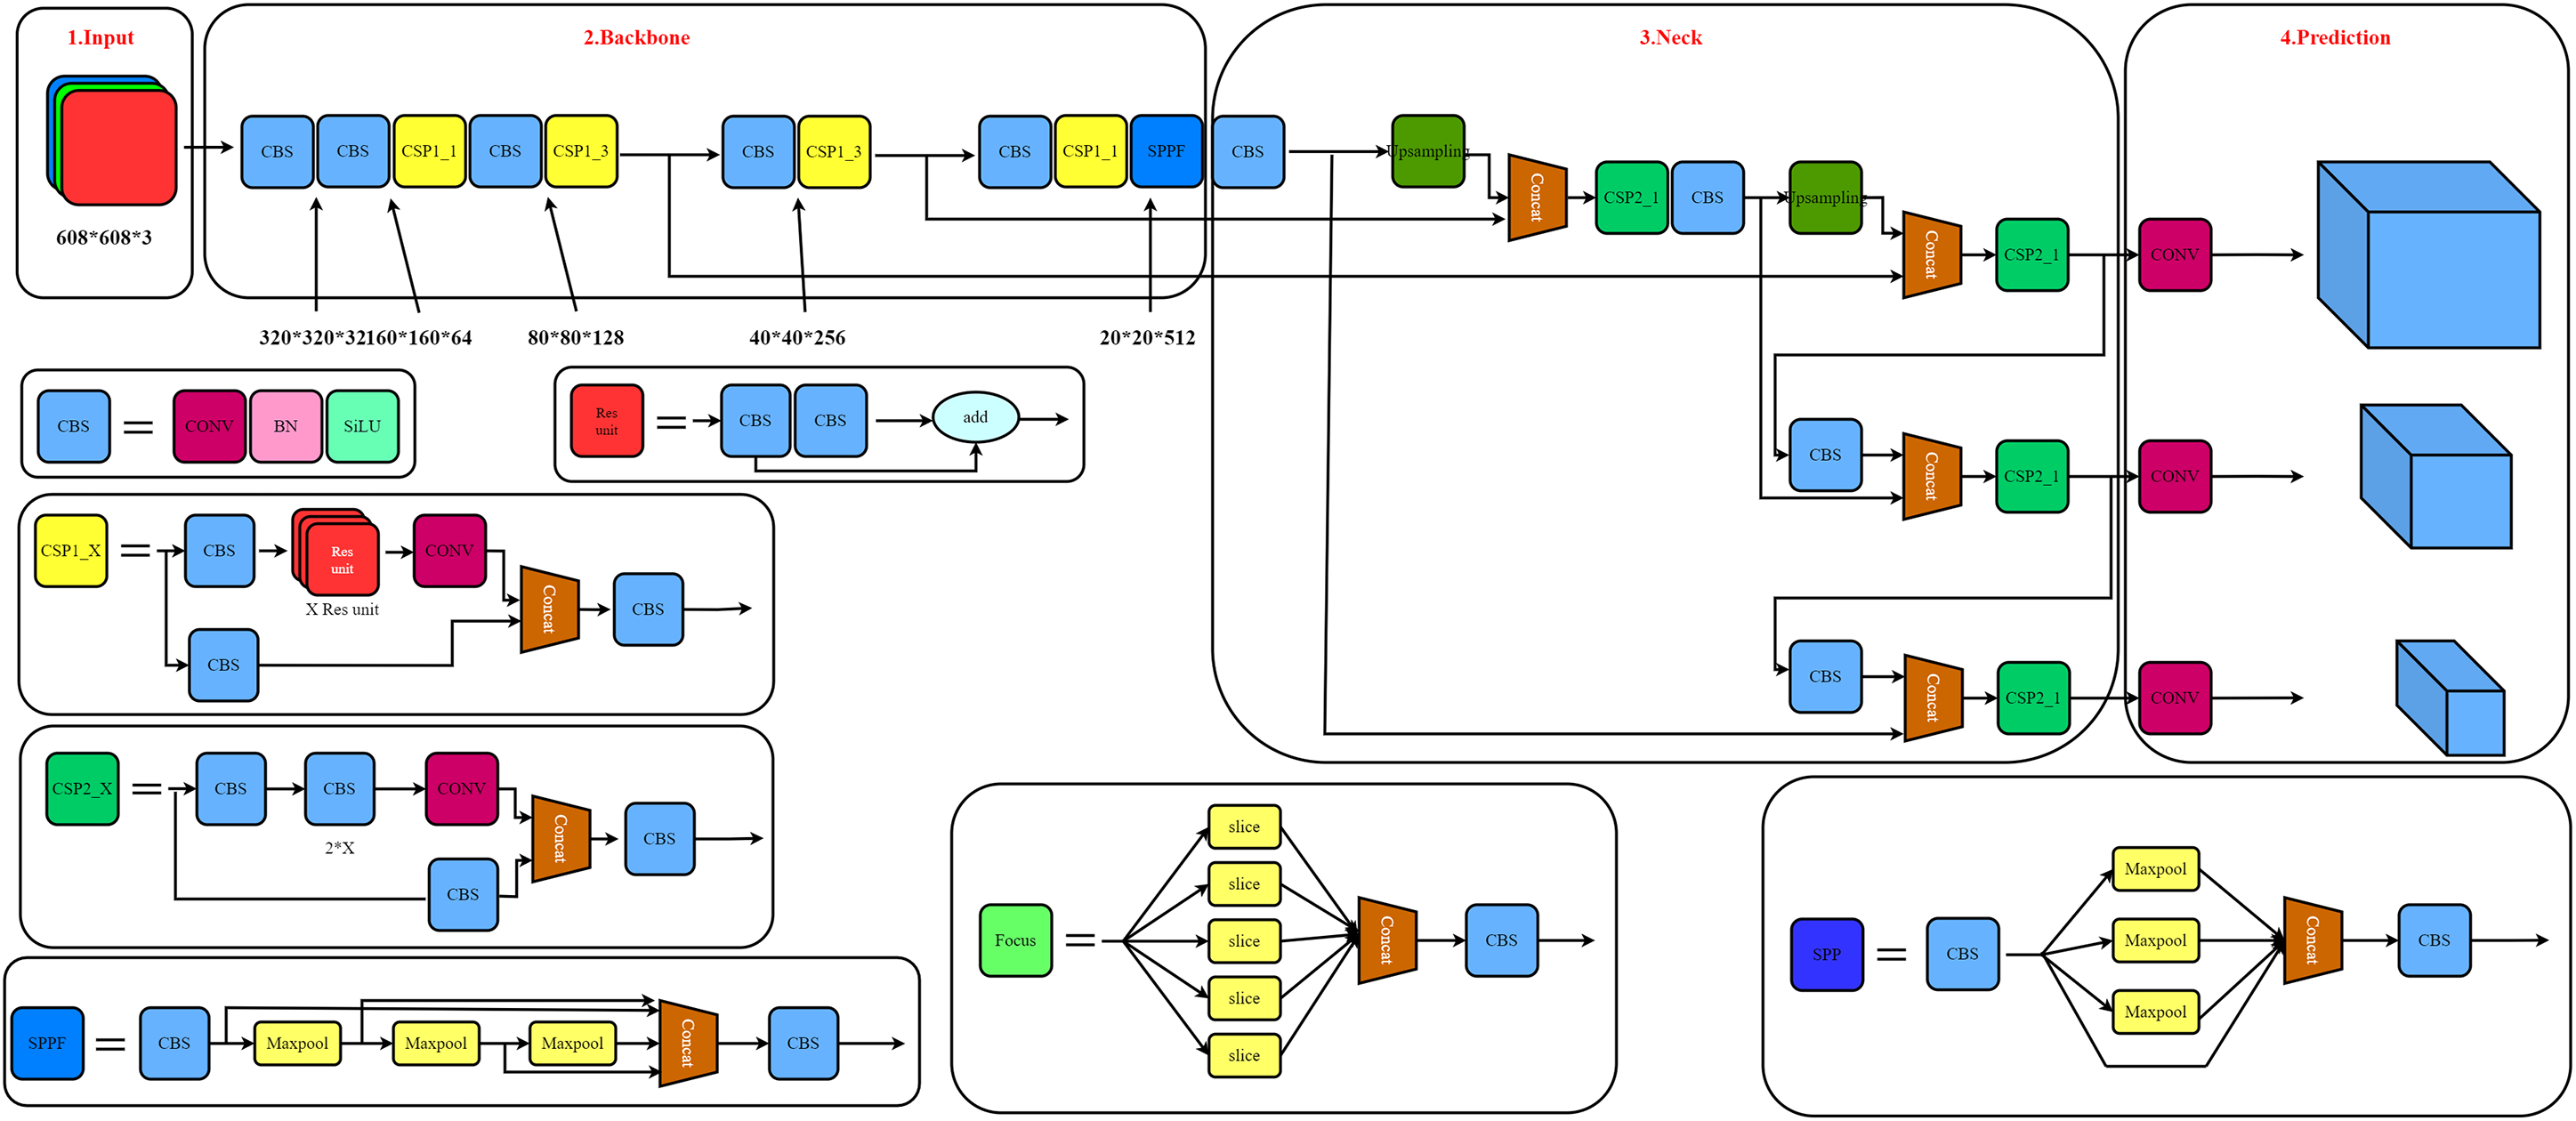
Figure 5: Structure of the YOLOv5 model
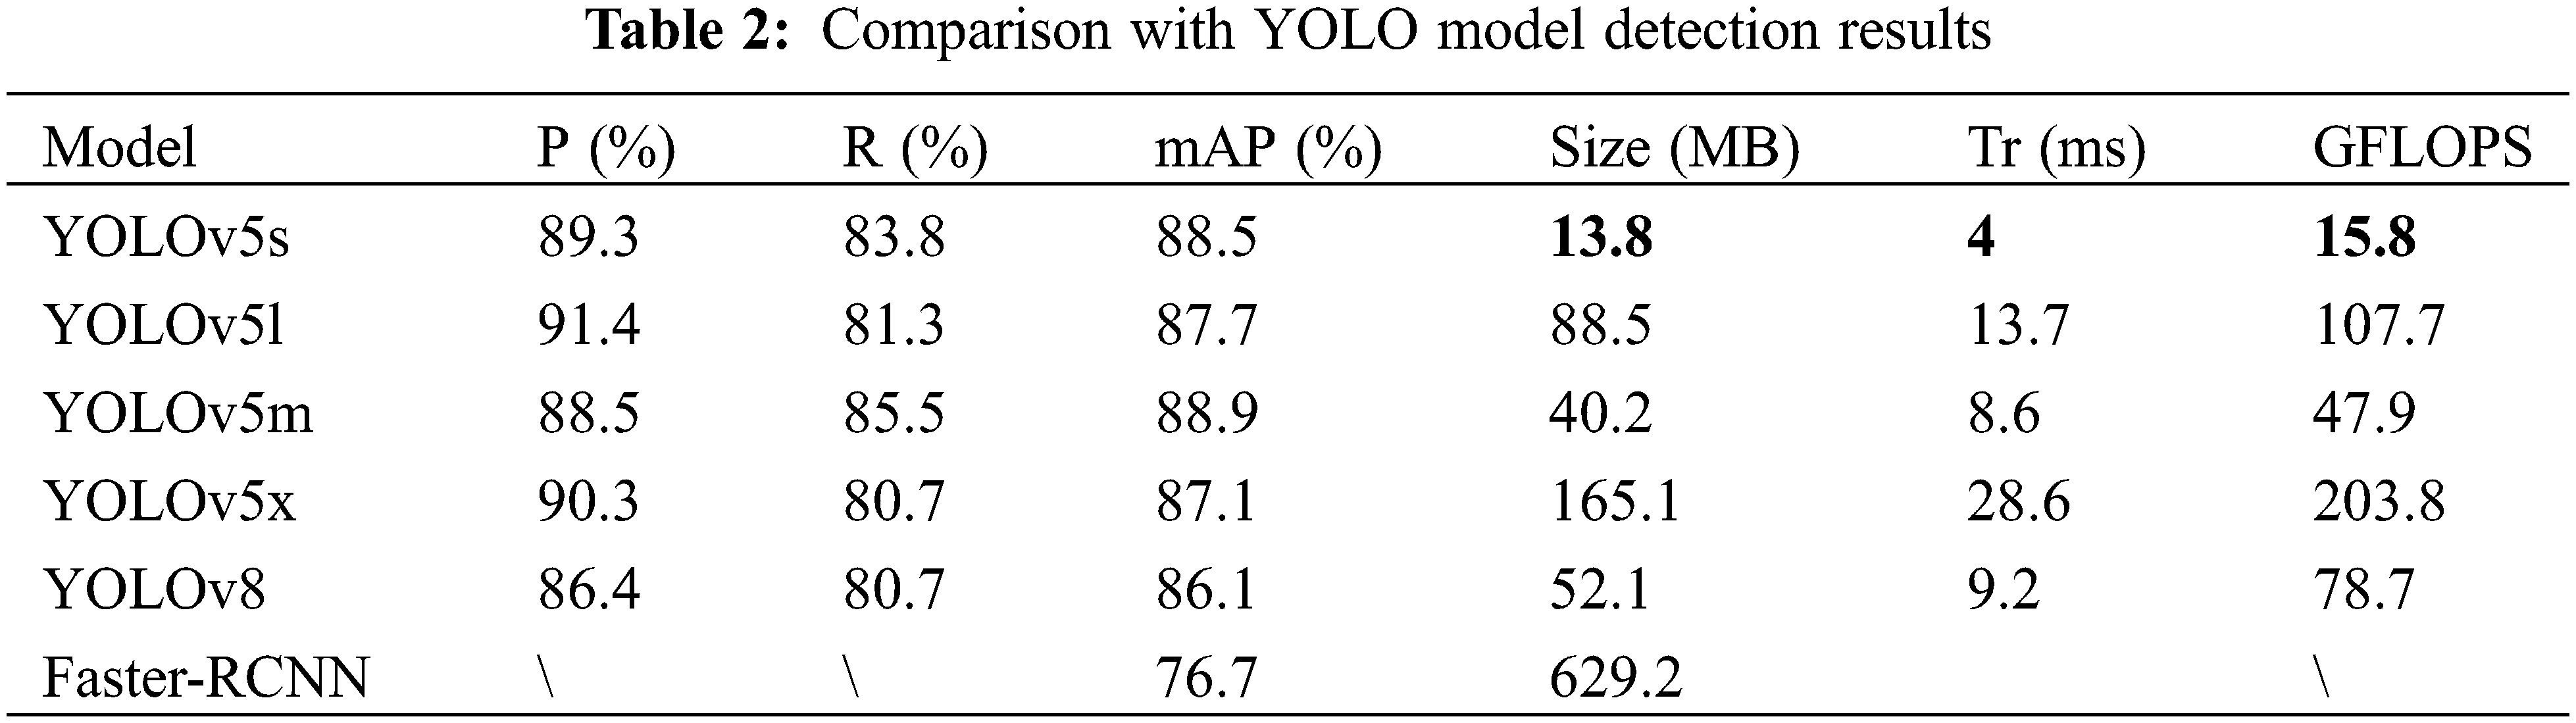
First, as shown in Table 2, it was inferred that YOLOv8 and Faster-RCNN have lower accuracy levels in rice disease recognition compared with YOLOv5. Therefore, YOLOv8 and Faster-RCNN were not chosen for this study. Second, Table 2 contains the comparison results among the four standard YOLOv5 models using this dataset. The primary aims of this research were to achieve efficient and rapid identification of rice diseases and pests. As shown in Table 2, YOLOv5 exhibited the highest efficiency and negligible model weight, making it suitable for embedded devices. Thus, YOLOv5s was selected as the base model for this study.
2.3.1 Convolutional Block Attention Module (CBAM)
The CBAM module’s [37] schematic diagram is depicted in Fig. 6. The CBAM module primarily consisted of two key components: the Channel Attention Module (CAM) and the Spatial Attention Module (SAM). The main purpose of the CAM module was to explore the correlations among different channels, thereby assigning appropriate weights to each channel in the rice feature map, which enabled the more critical channels to receive greater attention. The specific calculation is detailed in the following Eq. (1) as illustrated in Fig. 7:
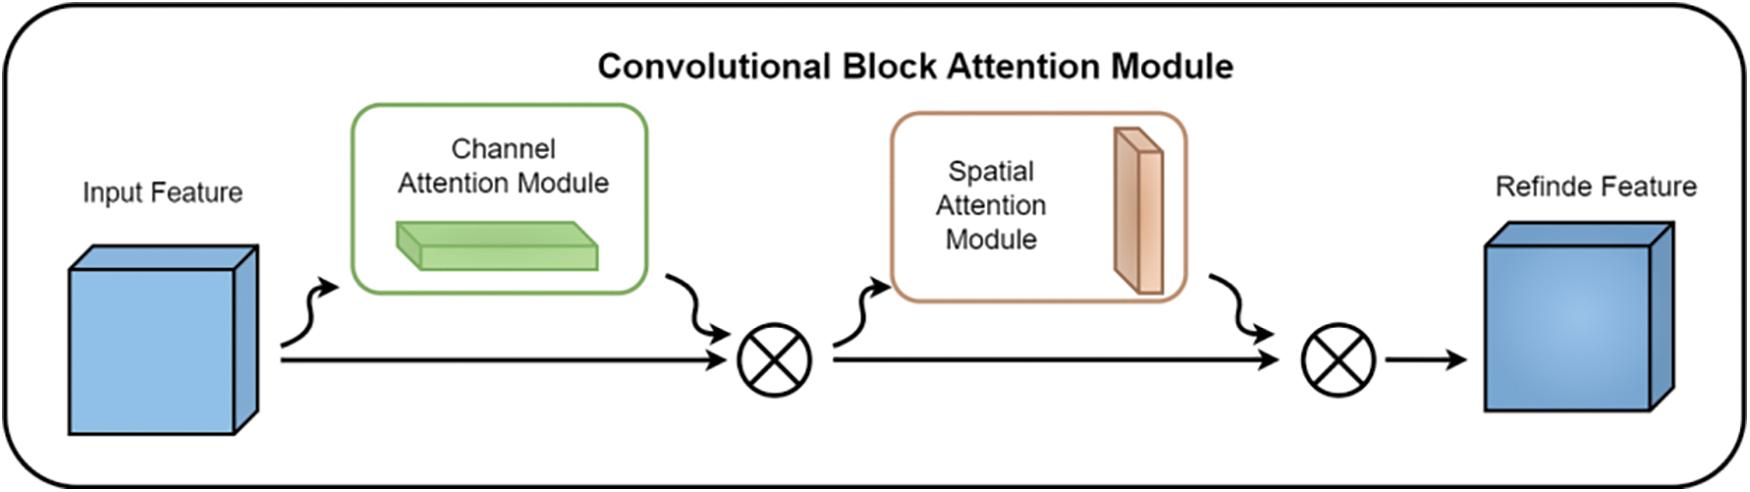
Figure 6: Schematic diagram of CBAM module
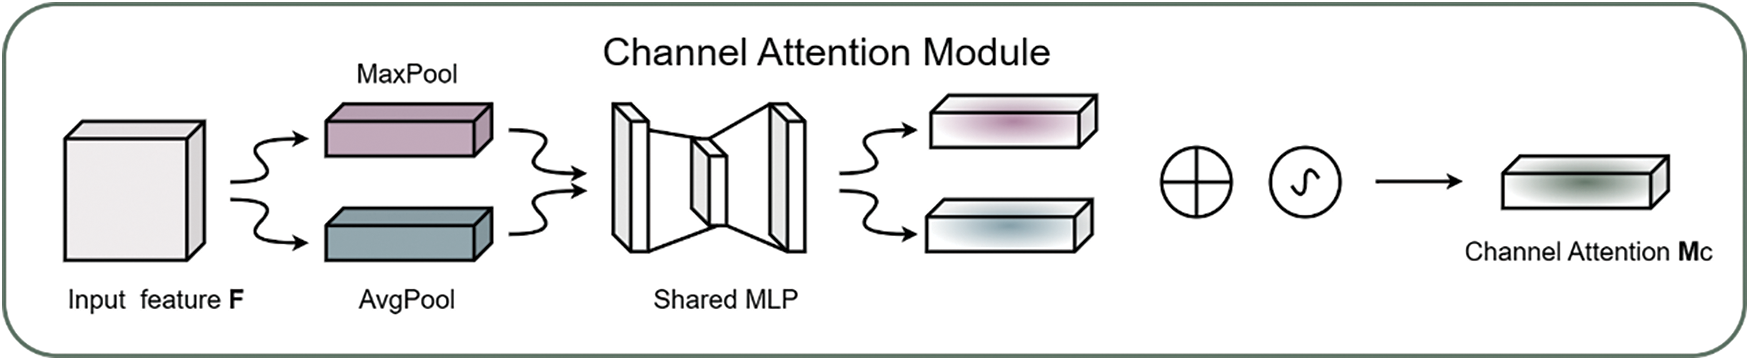
Figure 7: Schematic diagram of CAM module in CBAM
The rice feature map
The goal of the SAM module was to focus on the spatial positions of the rice feature map, thereby adjusting weights in the spatial dimension to enhance the model’s attention to specific regions. The specific calculation is as follows detailed in Eq. (2) as illustrated in Fig. 8.
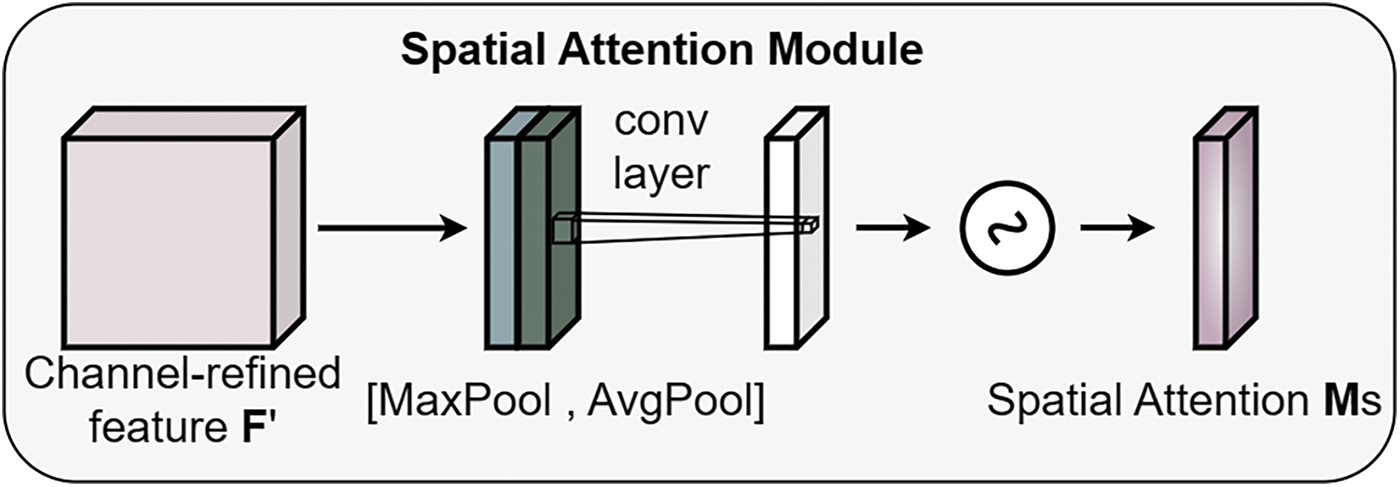
Figure 8: SAM module structure diagram
The rice feature map
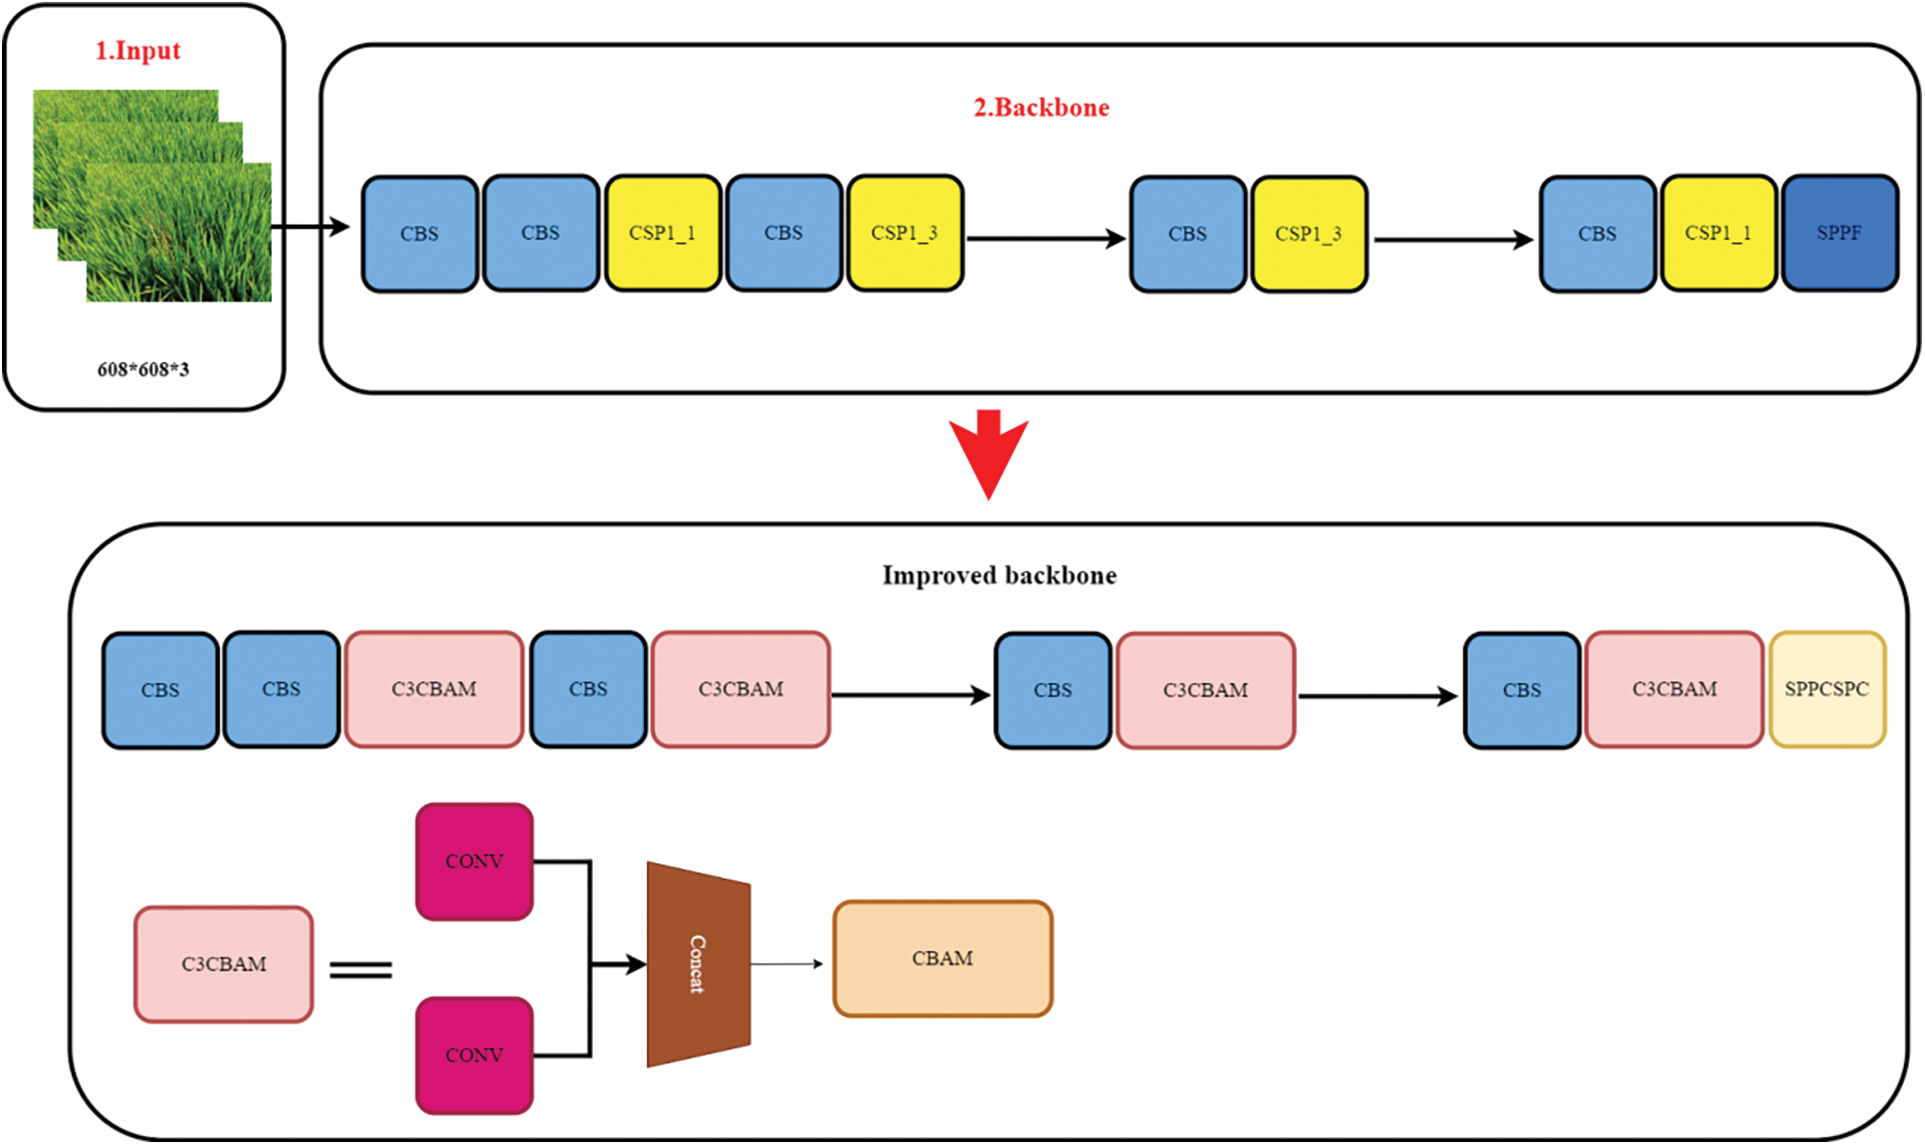
Figure 9: Improved backbone network
2.3.2 Spatial Pyramid Pooling and Connected Spatial Pyramid Convolution (SPPCSPC)
The original model’s SPPF module was substituted with the SPPCSPC module. The SPPCSPC module is a structure used in YOLOv7 that had the main purpose of increasing the receptive field. The structure is shown in Fig. 10. The function of SPP is to increase the receptive field, which allows that the algorithm to adapt to different image resolutions, and it is uses maximum pooling to obtain different receptive fields. SPPCSPC uses four different scales of maximum pooling with four receptive fields to distinguish between large and small targets. The CSP module first divided the features into two parts, one of which was for conventional processing, whereas the other part was for SPP structure processing. Finally, these are merged, which allows the amount of computation to be reduced by half, which increased the speed and accuracy.
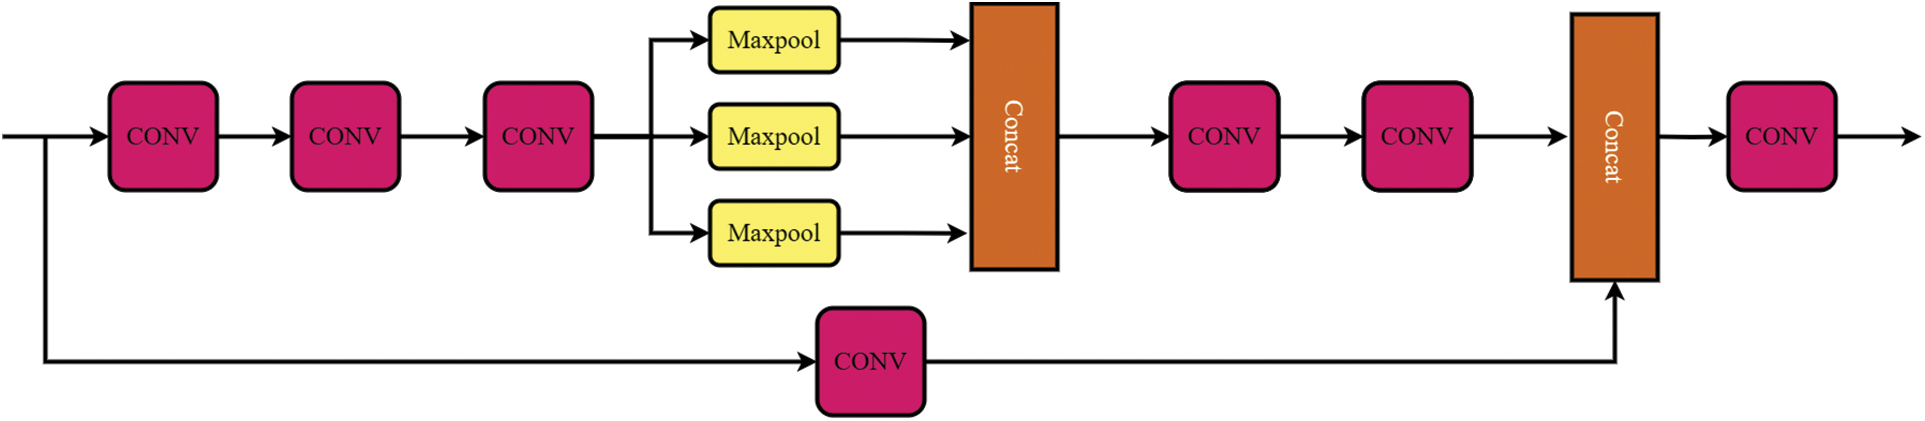
Figure 10: Schematic diagram of the SPPCSPC module
The addition of the Ghost module [38] in the prediction stage mainly reduced the model size and improved the model accuracy. The Ghost module had three main steps: regular convolution, Ghost generation, and feature map stitching, as shown in Fig. 11.
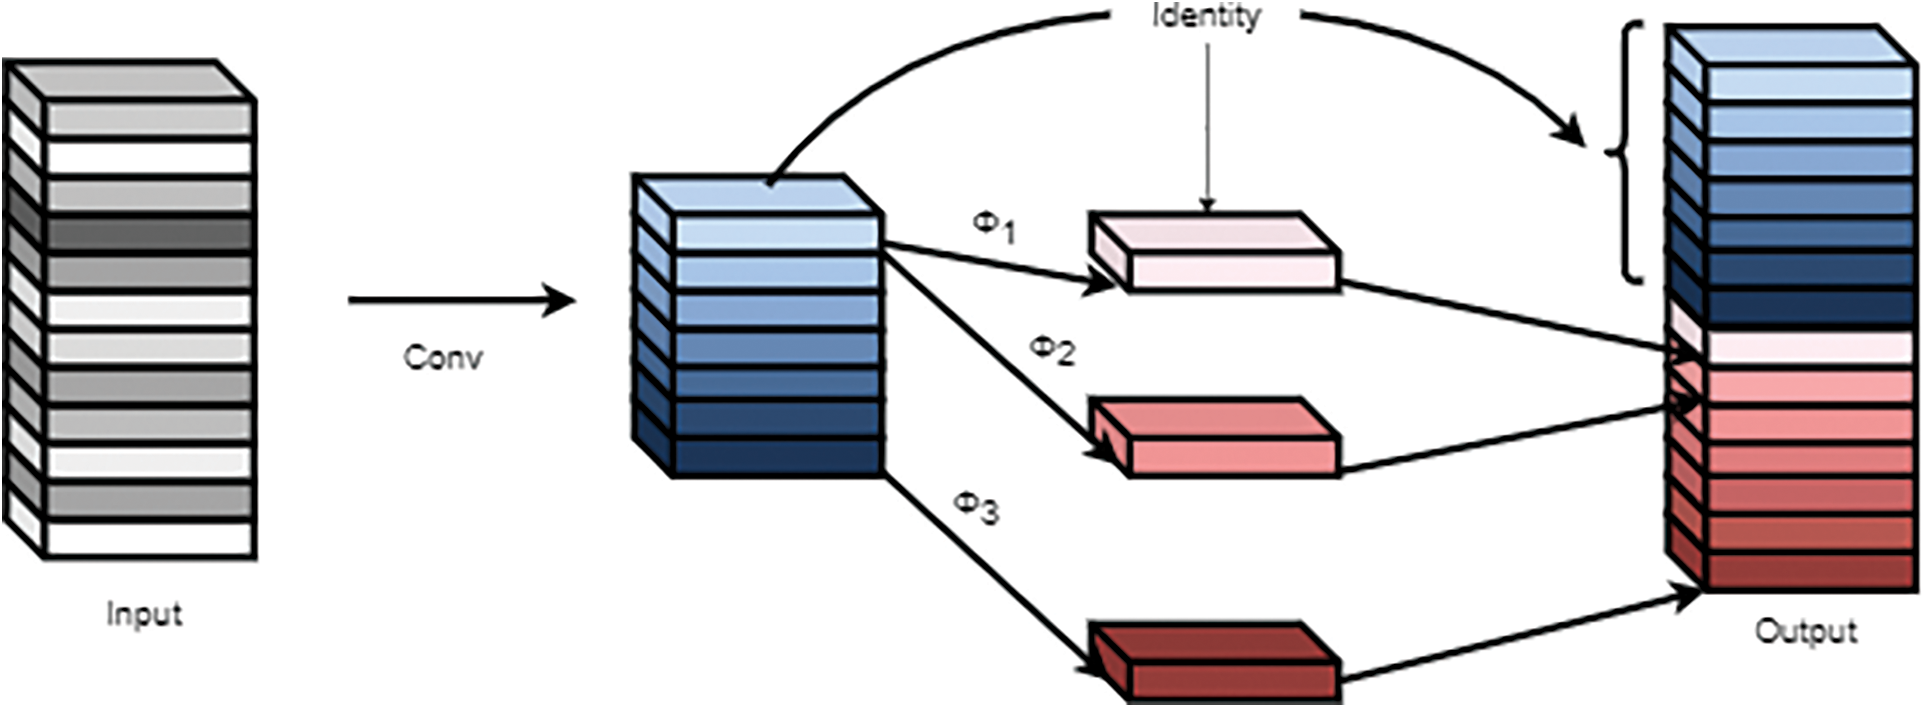
Figure 11: Ghost module
In the first step, assuming the input feature was
In the second step, each channel of the rice feature maps
An analysis of the images revealed that the diseases were primarily concentrated in the centers of the images. As shown in Fig. 12, the disease labeling was mainly concentrated at small targets, and medium-sized conditions were less present. Therefore, C3Ghost replaced the C3 module in the prediction medium section. GhostConv replaced the Conv module and reduced the training footprint, as shown in Fig. 13.
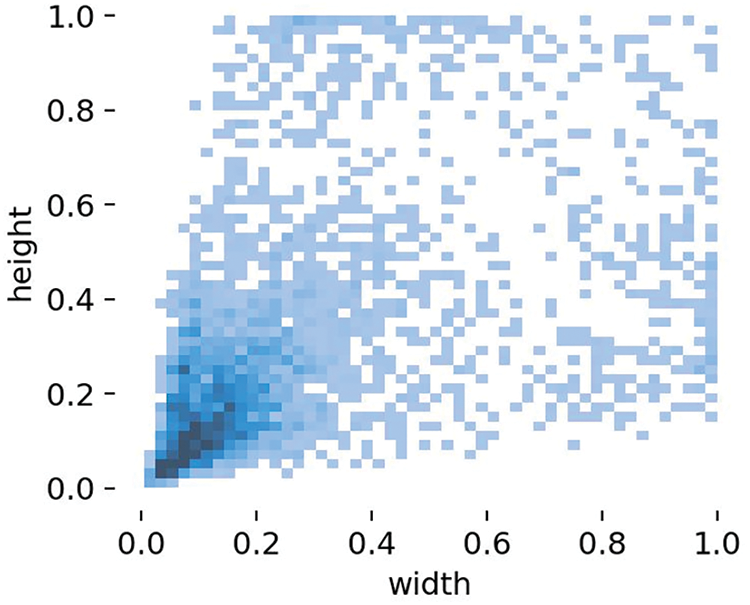
Figure 12: Distribution of data in the dataset
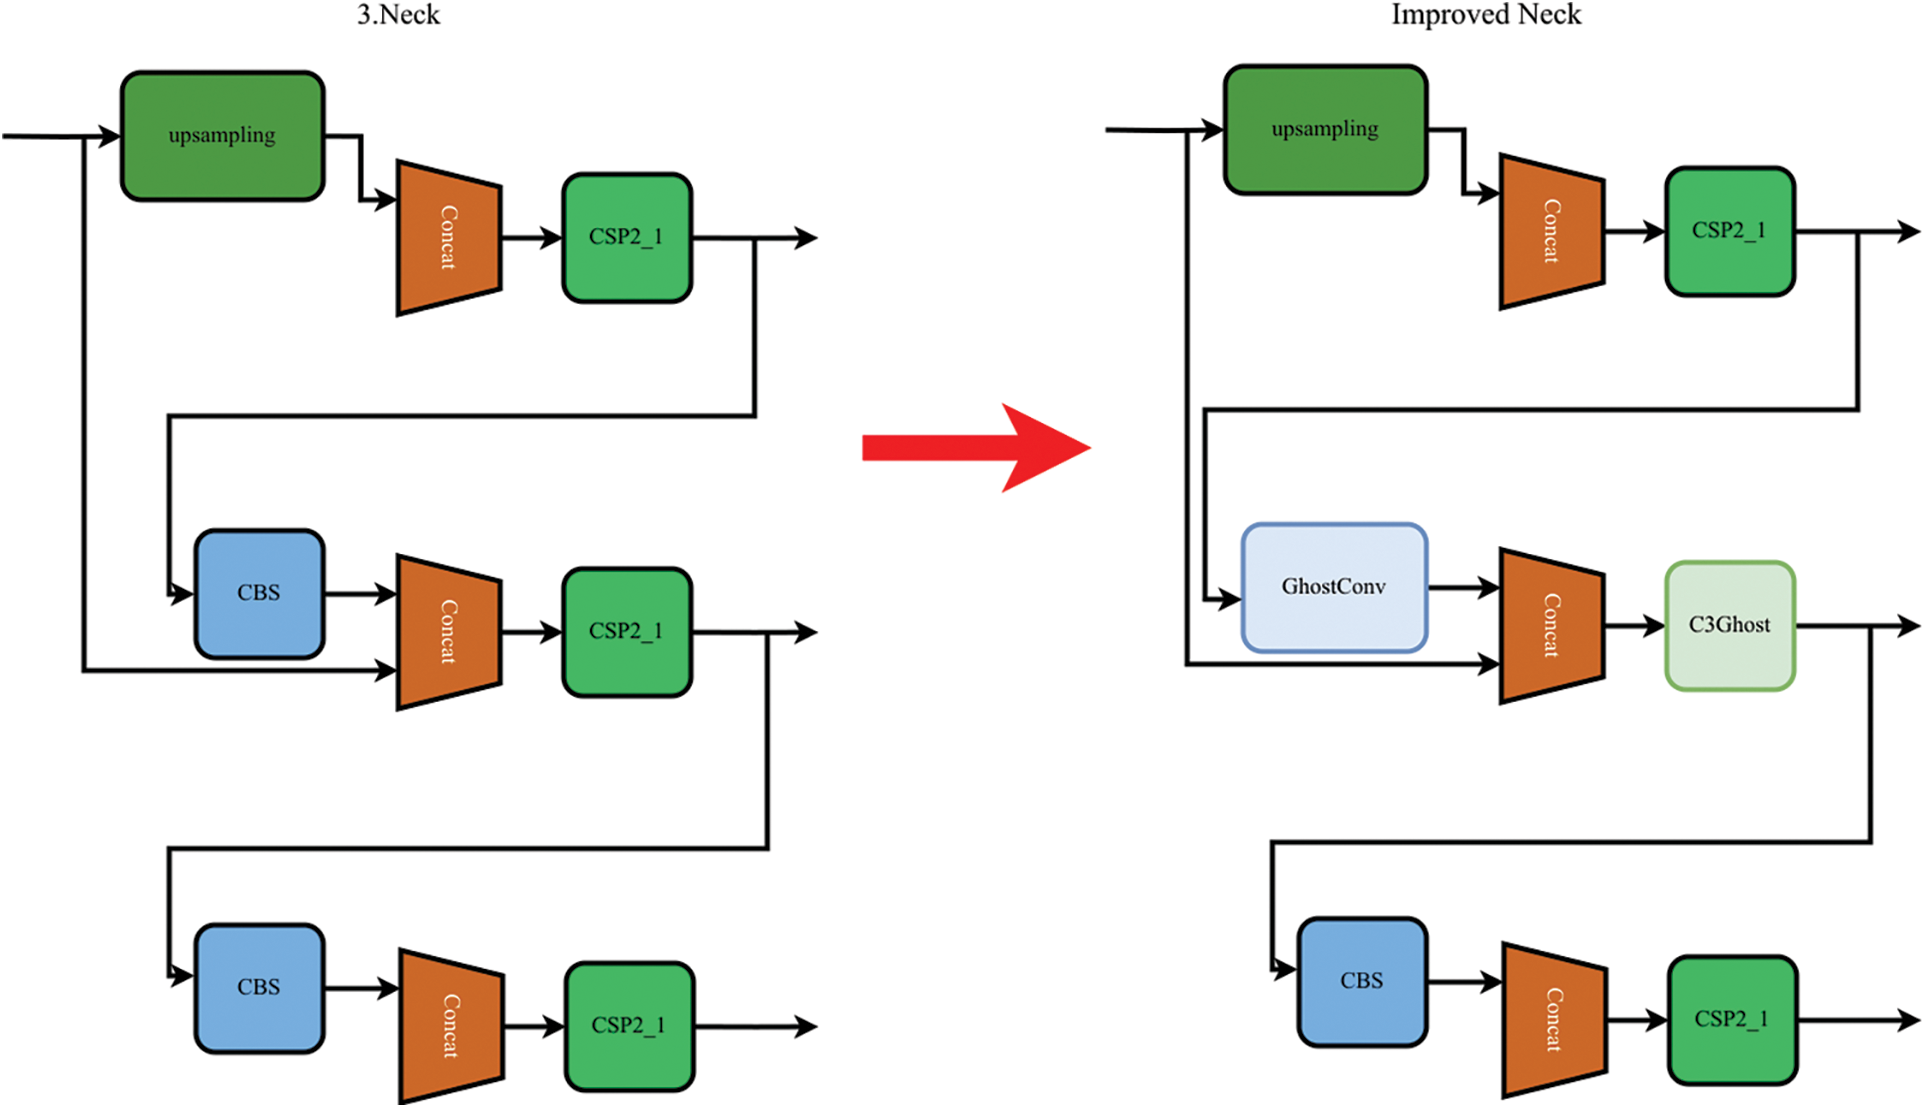
Figure 13: Improved Neck network
To improve the accuracy and speed of disease detection, the C3CBAM module was added, and YOLO adjusted the focus on both ward and non-ward areas to improve the accuracy of the model. The SPPCSPC module was added to improve the receptive field of disease identification, and the Ghost module was added to reduce the size of the model. The final model structure is shown in Fig. 14.
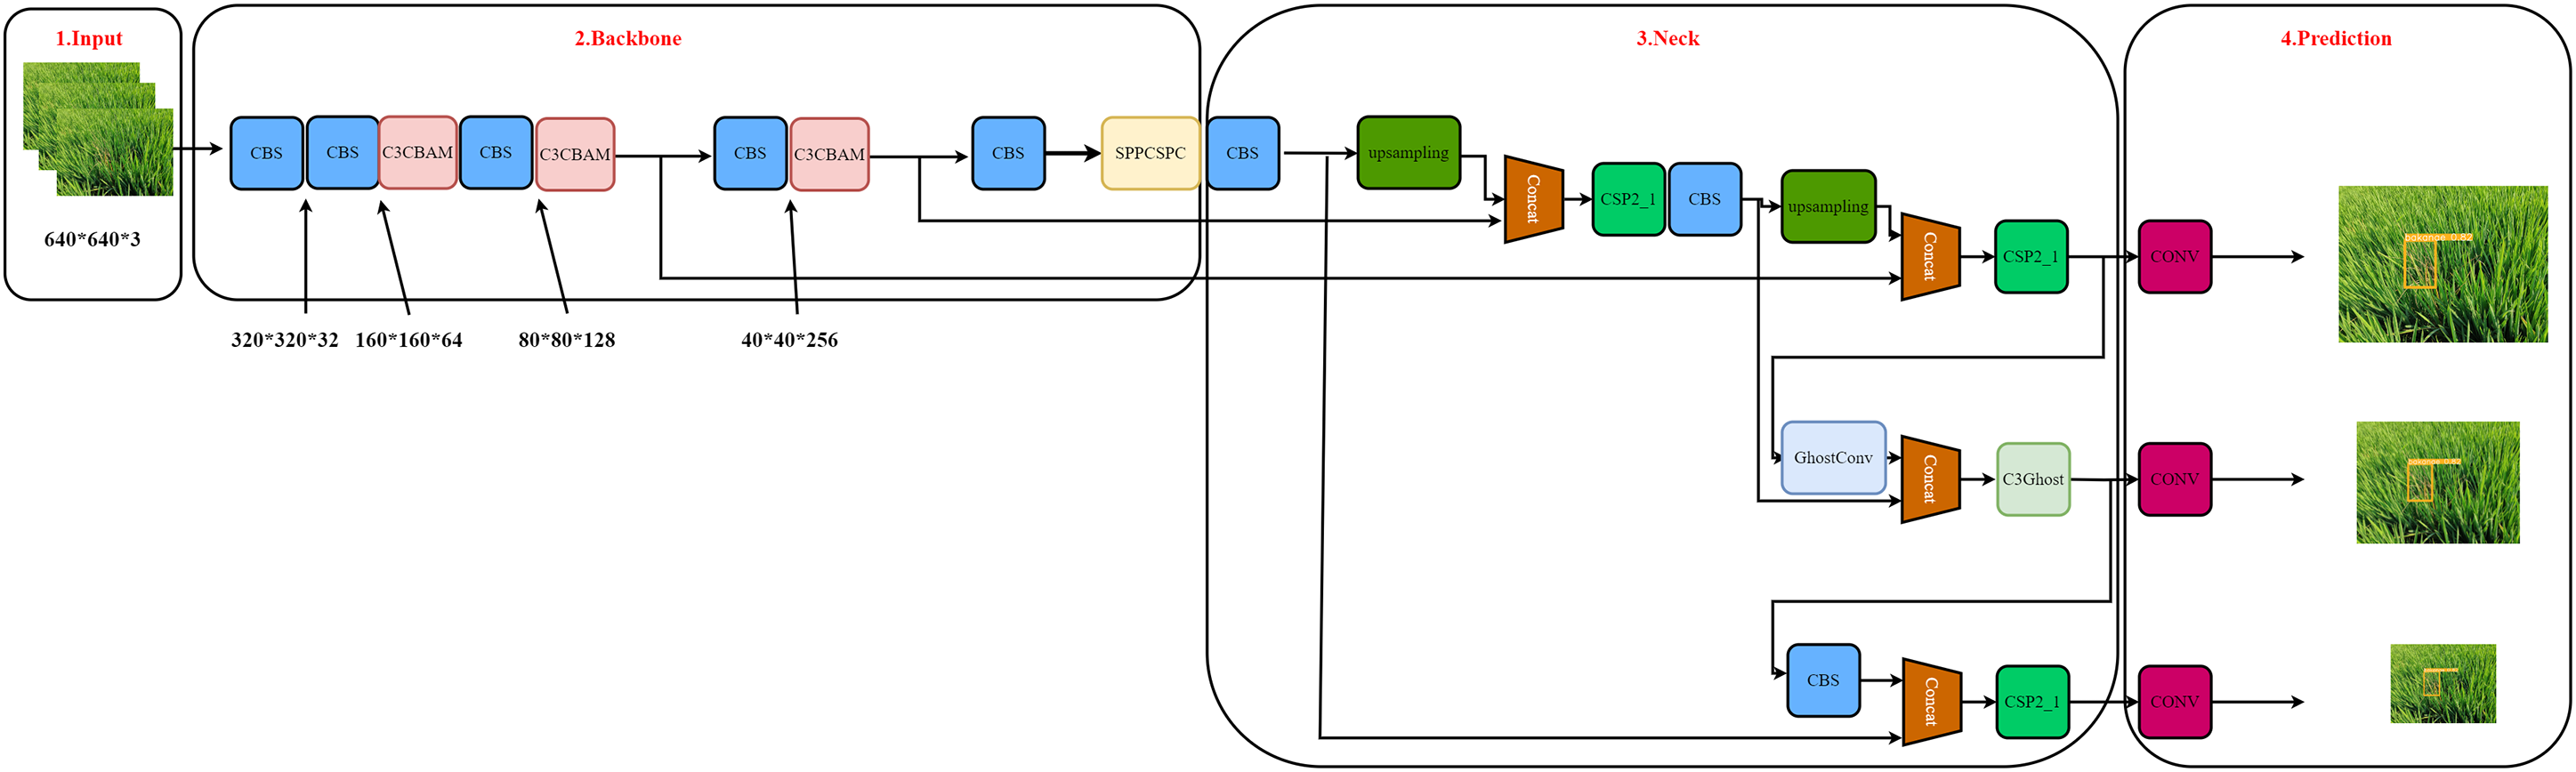
Figure 14: YOLOv5 and its improved technology schematic
To assess the enhanced YOLOv5 architecture based on detection results, we utilized the following evaluation metrics: Precision (P), Recall (R), F1-score (F1), mAP, detection time (tr) and model size, which were calculated using the following equations:
where TP represents the number of accurately predicted true samples, FN represents the number of accurately predicted false samples, and FP represents the number of false samples predicted to be true. P represents the correct number of all the rice diseases. R represents the number of correct predictions of disease.
Here,
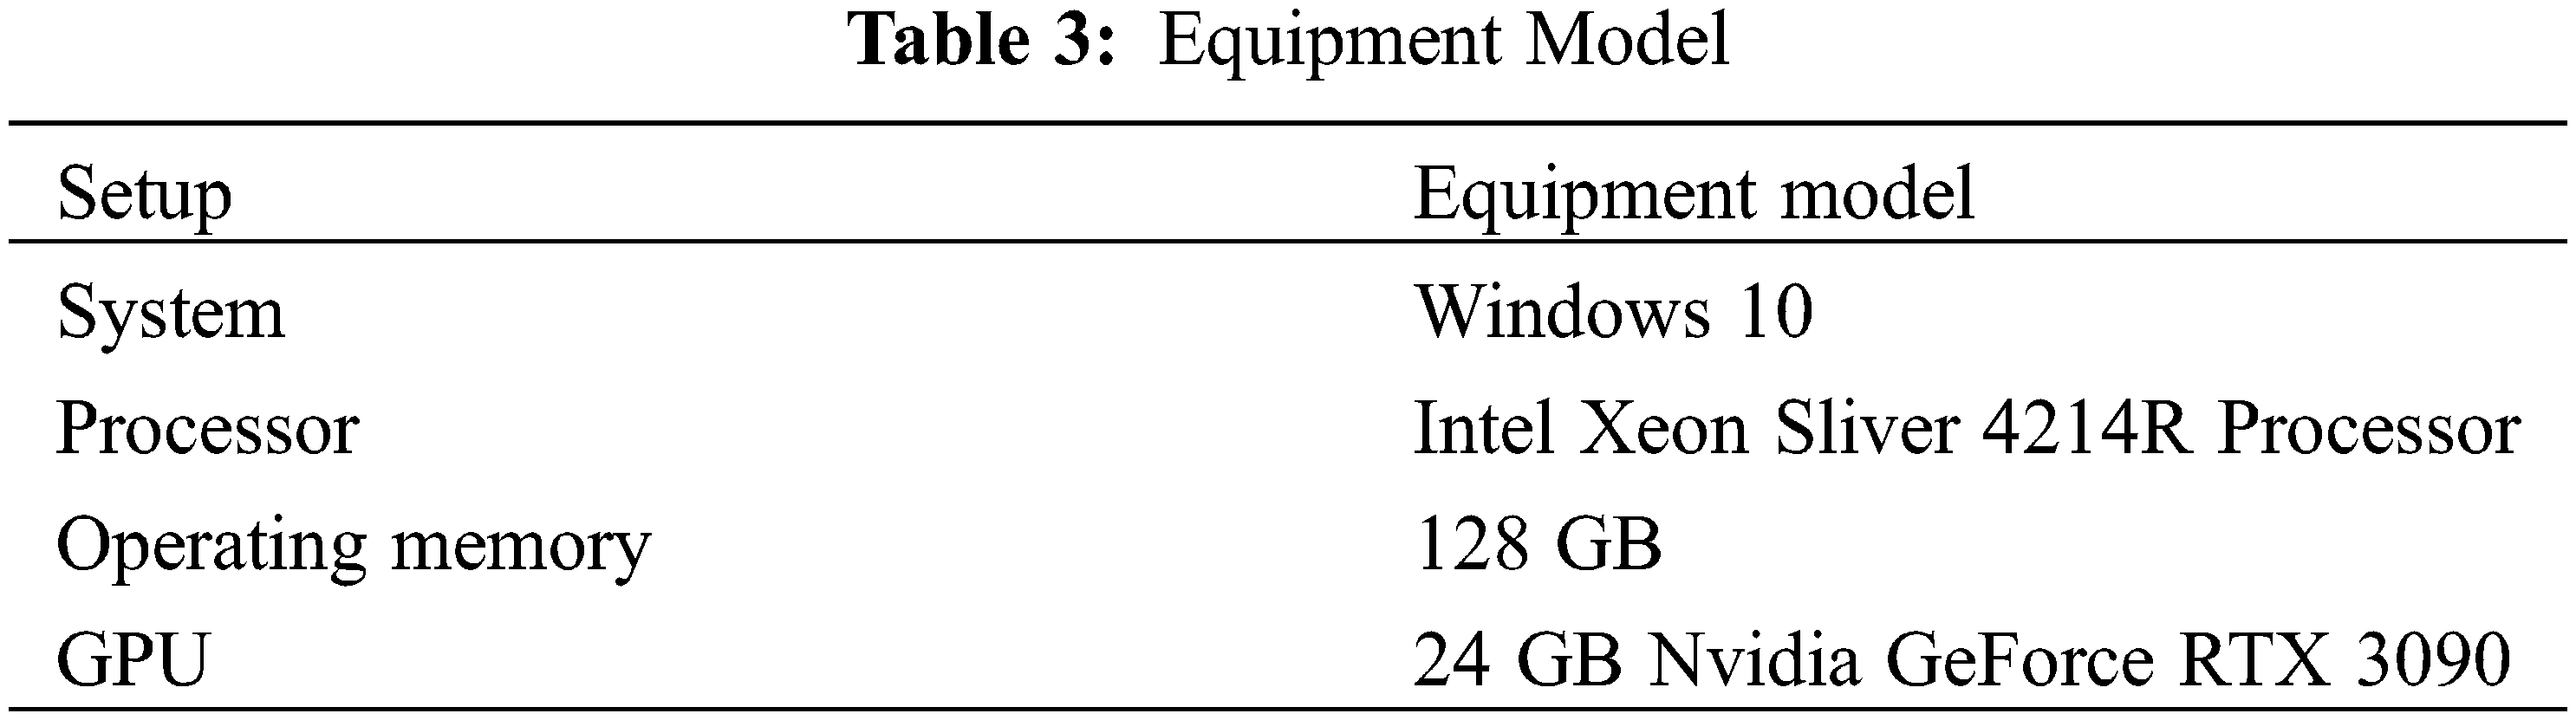
The server configuration is shown in Table 3, and all the experiments were run on this device. The YOLO-CRD network underwent fine-tuning using datasets and transfer learning techniques to create a rice disease detection model. The model’s configuration parameters were initialized through pre-training on the VOC image dataset. All the input images were standardized to dimensions of 640 × 640 pixels. A batch size of 32 and an initial learning rate of 0.01 were used. The model was trained for 200 iterations to attain the optimal performance. Following the determination of training parameters, the model was trained accordingly.
3.1 Performance of YOLO-CRD Model
The performance of the YOLO-CRD network was evaluated on a custom dataset, and the detection outcomes are presented in Table 4 and Figs. 15 and 16. As shown in Table 4, brown spot and rice fever mAP values were high compared with those of bakanae and dry apical leaf nematode. In practice, the two latter diseases’ symptoms are difficult to distinguish from the environment. Bakanae exhibits characteristics of yellowing leaves, but in practice, yellowing leaves are mixed with healthy leaves, which also cause shading, resulting in the main characteristics being more difficult to learn. Dry tip nematode disease is more widely distributed and causes more severe shading. The average results produced P, R, mAP, and F1-scores of 90.4%, 85.4%, 90.2%, and 88, respectively. The model achieved an average detection time of 7.2 ms, with a model weight size of 24.4 MB. The accuracy–recall curve and the loss curves are shown in Fig. 12. The model maintained an excellent real-time detection performance of different rice diseases. Thus YOLO-CRD can adapt to the complex natural environment, allowing it to efficiently detect early rice diseases early.
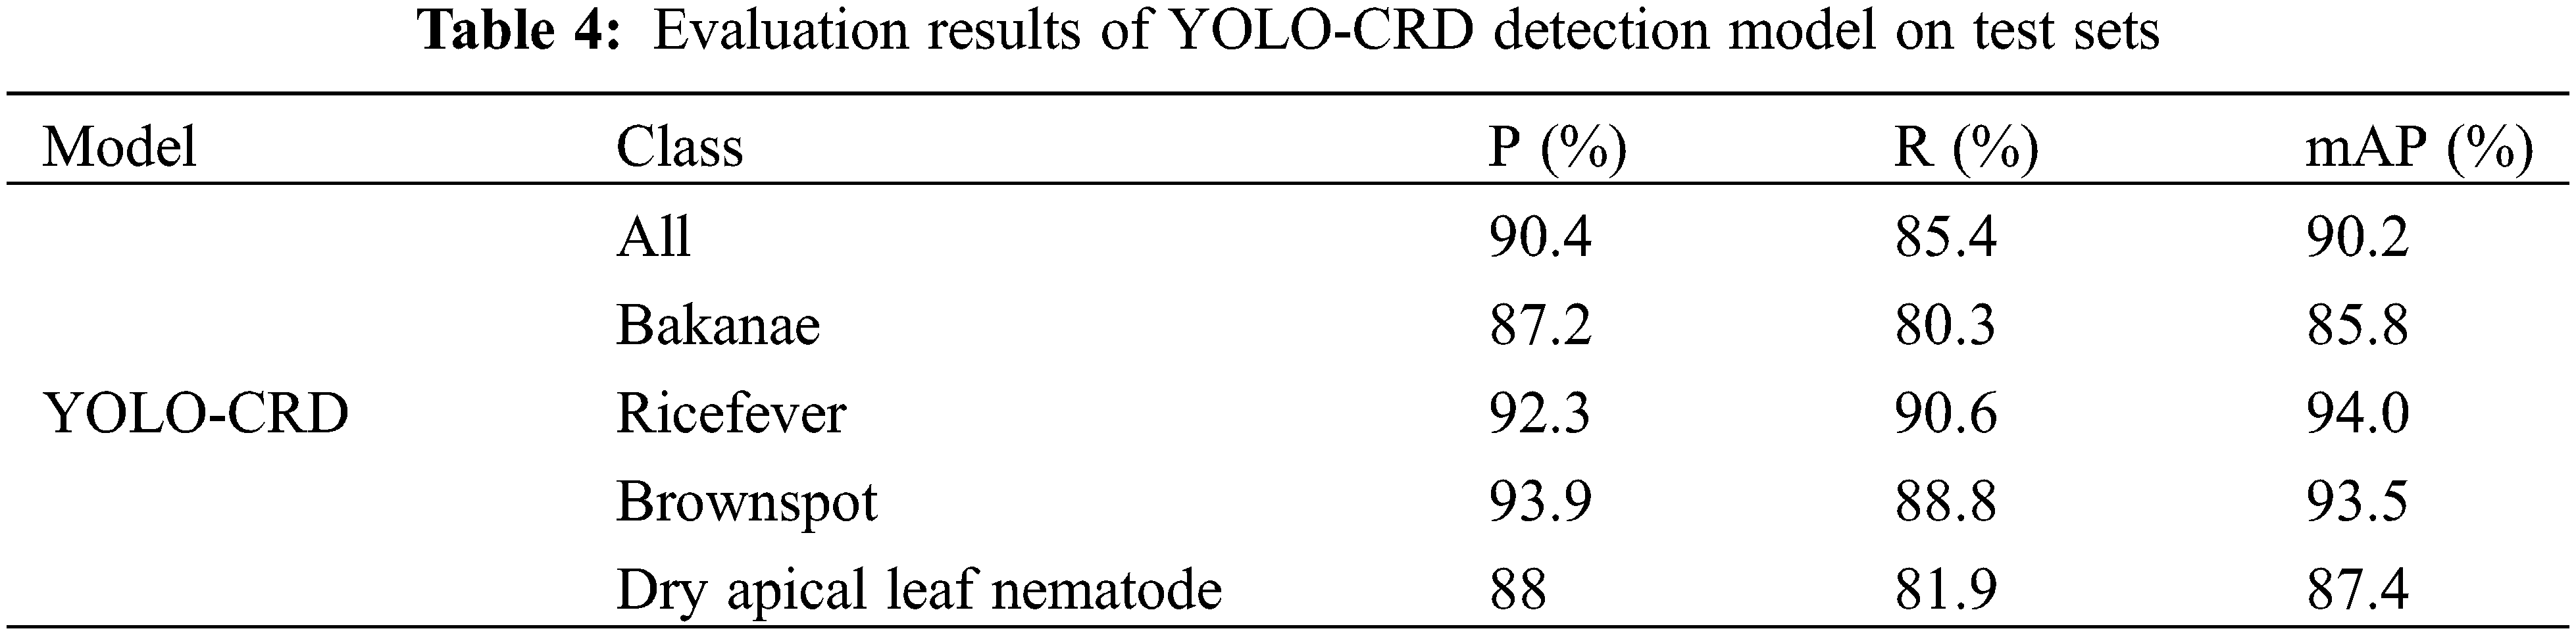
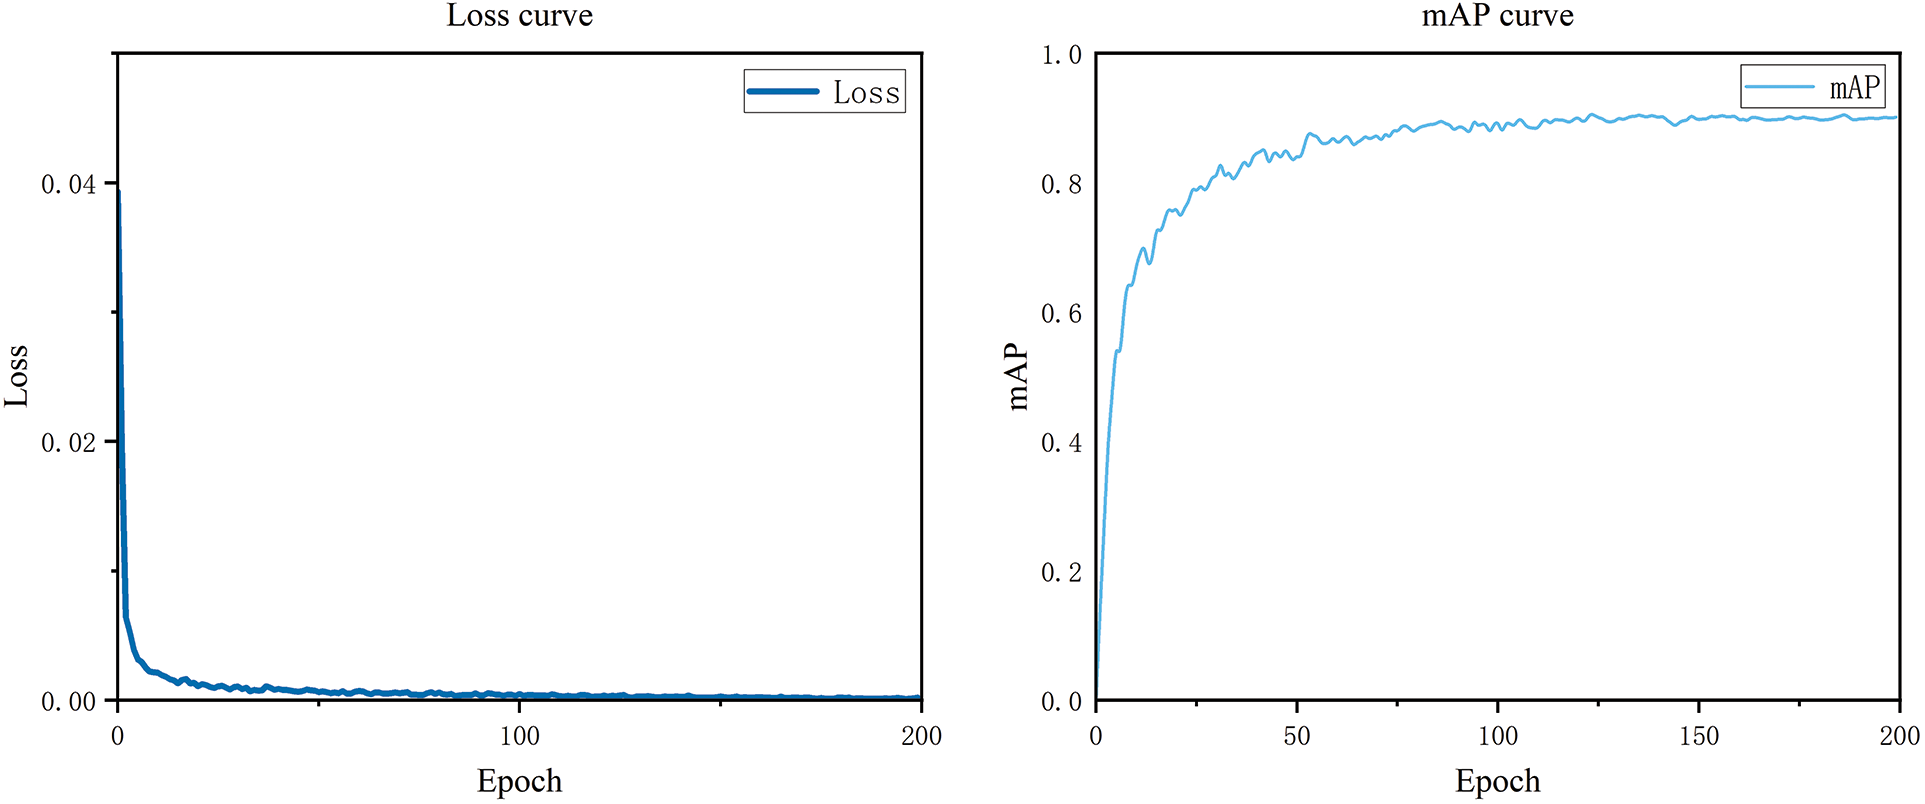
Figure 15: Loss curve and mAP curve of YOLO-CRD model
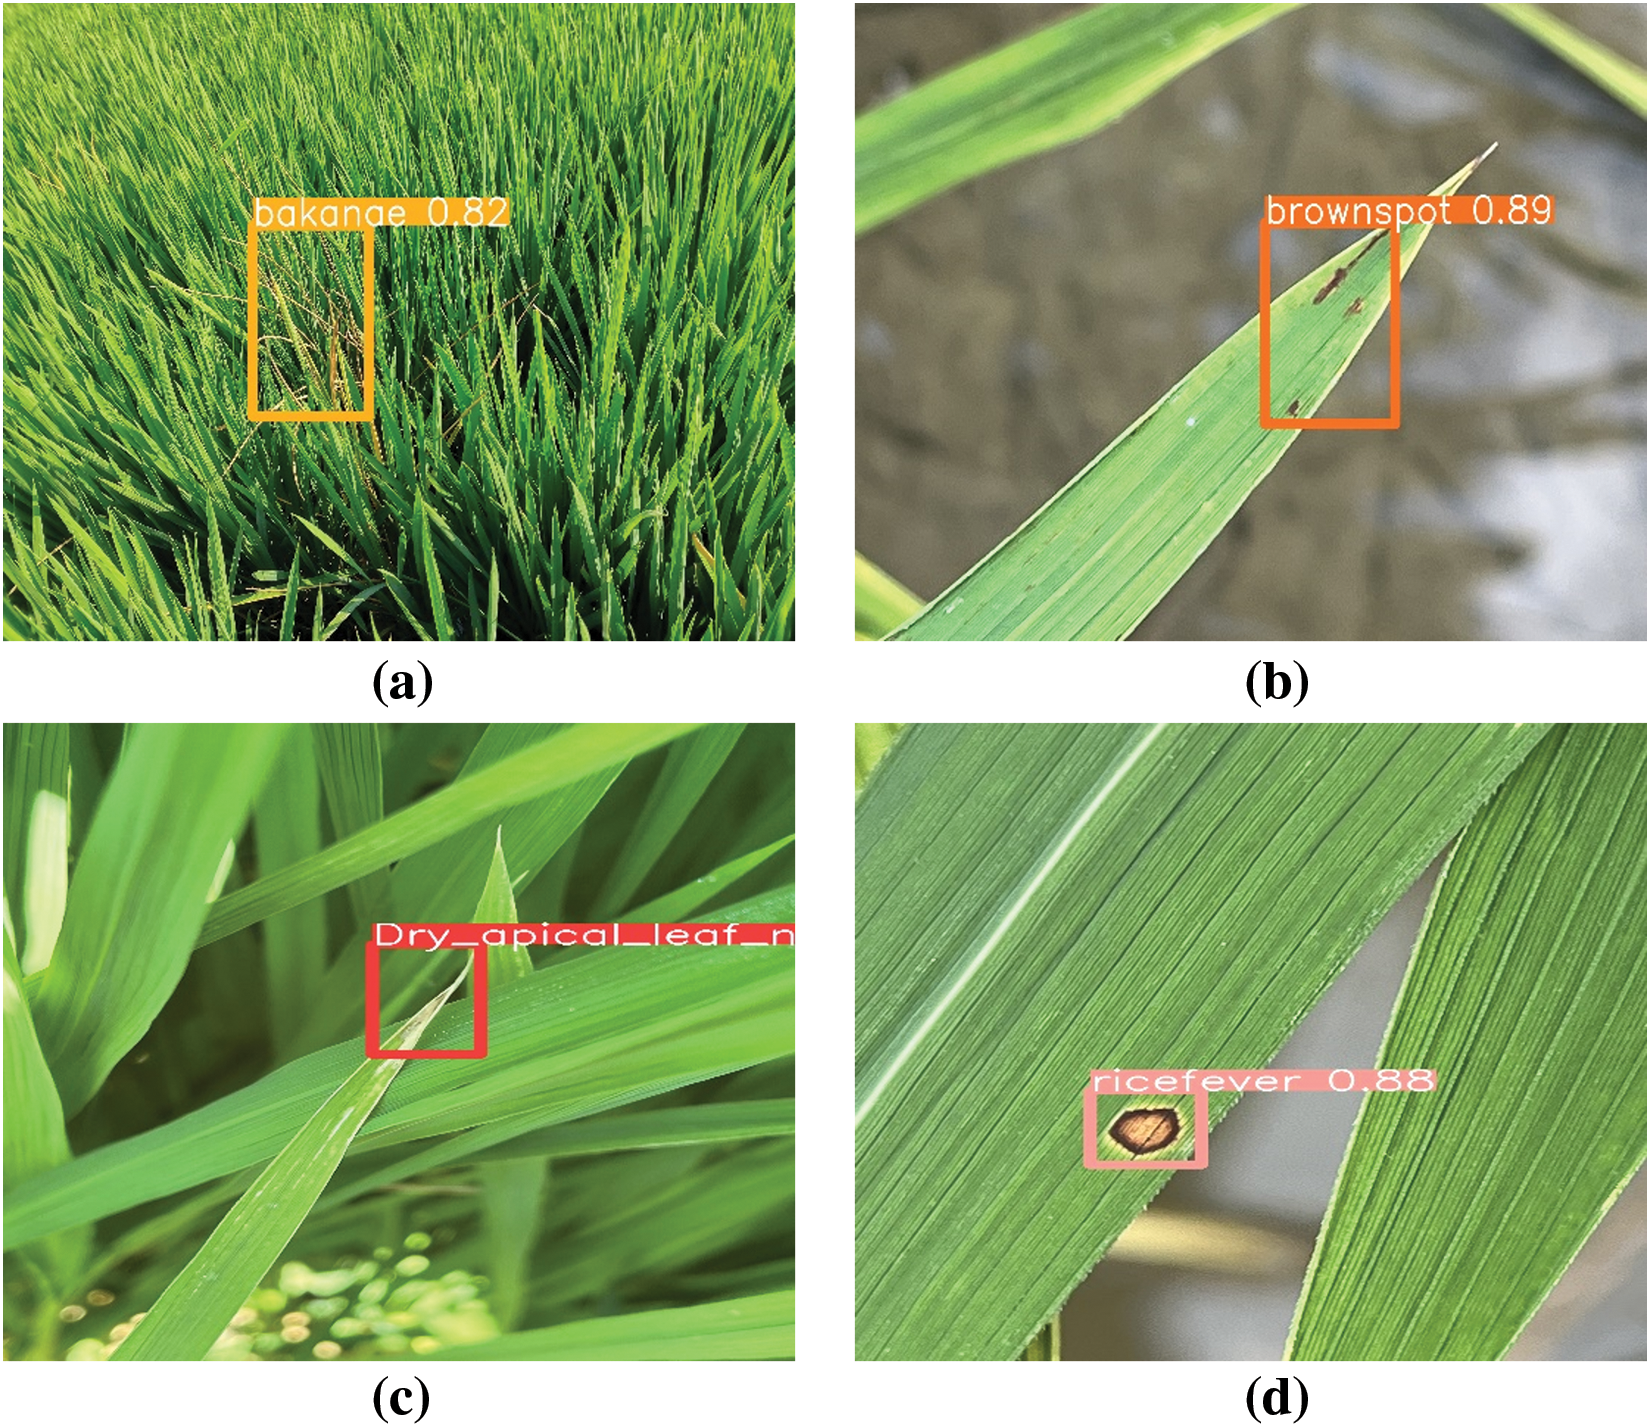
Figure 16: Detection results of rice test, (a) bakanae disease, (b) bacterial brownspot, (c) leaf rice fever, (d) dry tip nematode disease
To enhance the robustness of the results, we combined the training and test sets and conducted five rounds of model training using the Five-fold cross-validation approach. The outcomes, depicted in Fig. 17, illustrate that the improvements in the model’s performance were consistent and not random, because the enhanced model consistently outperformed the original model.
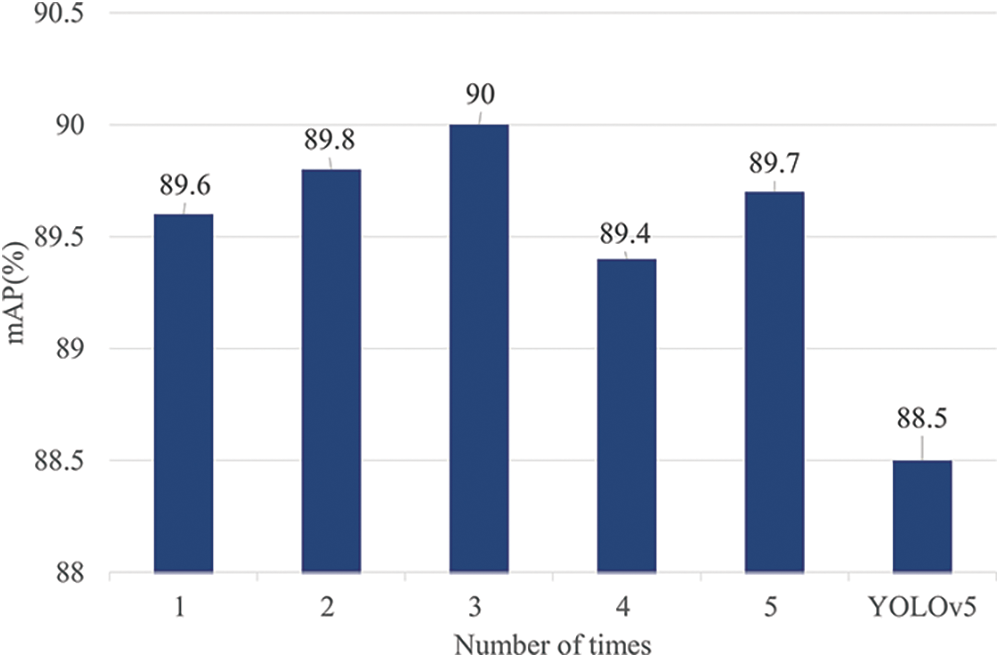
Figure 17: Five-fold cross-validation results of our model
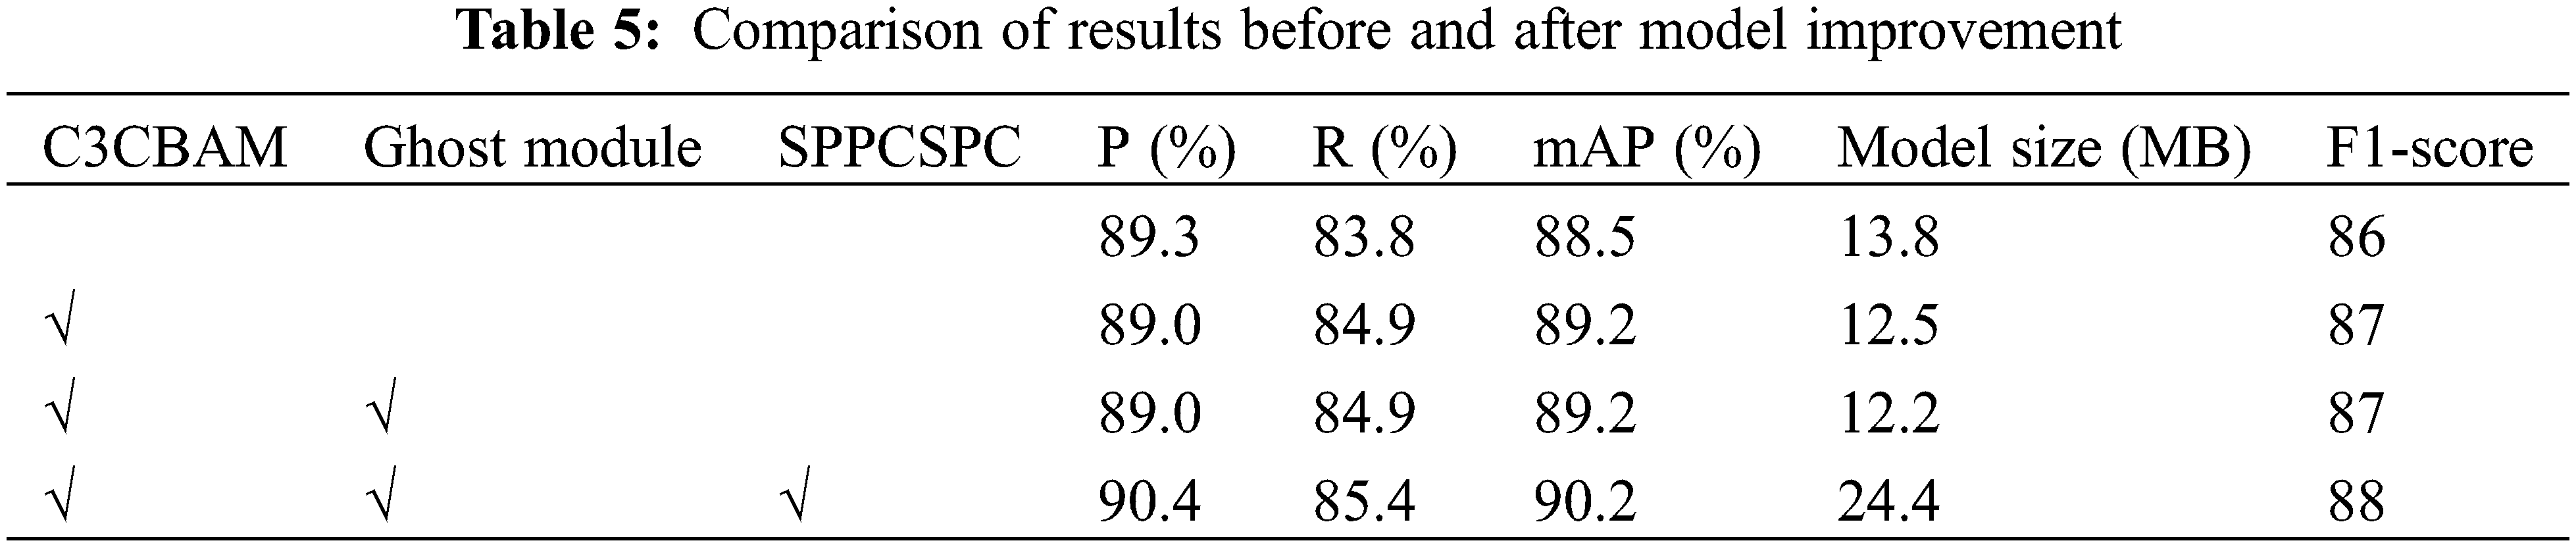
The YOLO-CRD algorithm improved the backbone and feature fusion layer of the YOLOv5s network. To evaluate the effectiveness of the improved method and modules, a series of ablation experiments were designed in a unified experimental environment. The experimental results are shown in Table 5. The modifications to YOLOv5 improved the accuracy. The C3CBAM module was introduced to the backbone, and this increased the mAP by up to 0.7% and the F1-score by 1. After adding the SPPCSPC, P increased by 1.4%, R increased by 0.5%, and mAP increased by 1%. Although the addition of SPPCSPC increased the size of the model, accurate identifications of diseases are required for practical applications, making the addition of SPPCSPC necessary.
To confirm that the enhanced model could effectively emphasize color and texture features, we incorporated Gradient-weighted Class Activation Mapping [39], and its visualizations of four rice disease images in the target domain are illustrated in Fig. 18. This visualization in Fig. 18 demonstrates that the improved model exhibited a more pronounced focus on the disease sites in comparison with the unimproved model.
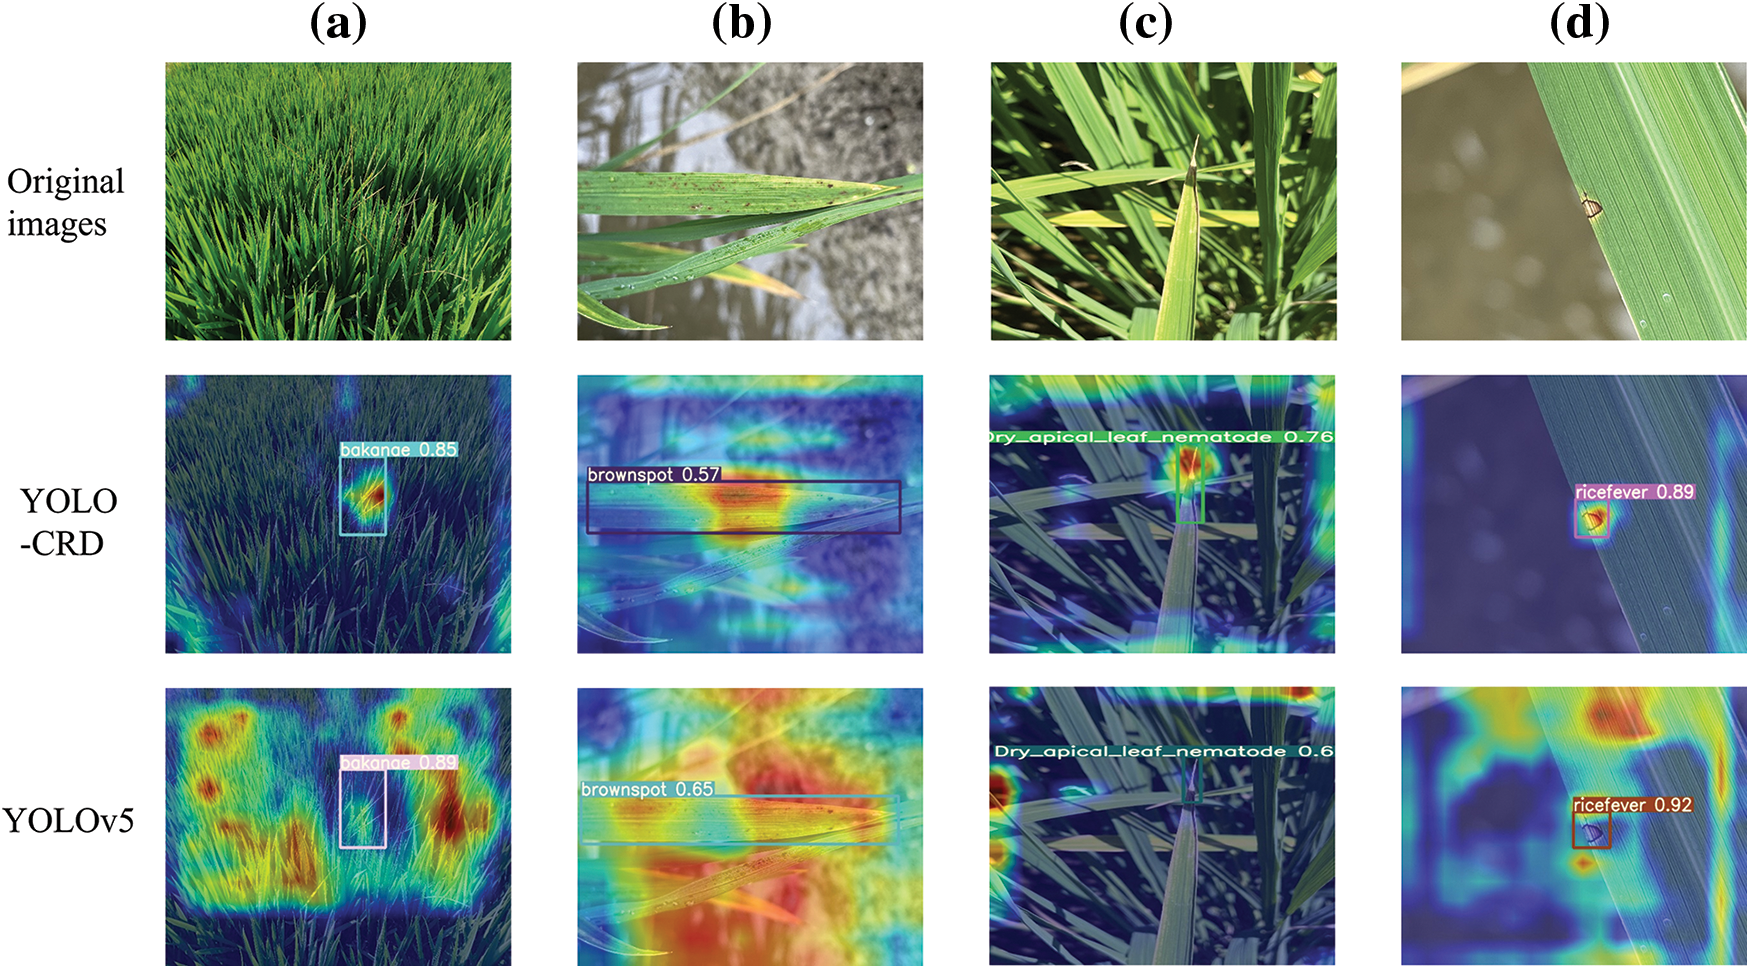
Figure 18: Grad-CAM visualization examples, (a) bakanae disease, (b) bacterial brownspot, (c) leaf rice fever, (d) dry tip nematode disease
As shown in Fig. 19, during the detection process, YOLOv5 overlapped more times, and some small targets could not be detected. However, YOLO-CRD had an increased focus on texture and color owing to the use of C3CBAM, which allowed a more comprehensive identification of the dry tip nematode disease. During the test set detection, YOLO-CRD missed two images showing bakanae disease, whereas YOLOv5 missed three images showing bakanae disease. Compared with YOLOv5, the model had lower false and missed detection rates and maintained high detection and positioning accuracy. Owing to the relatively large range of bakanae disease, the labeling range was narrowed, resulting in the identification accuracy of bakanae disease being lower than those of the other three diseases. In this model, the mAP for bakanae was also improved.
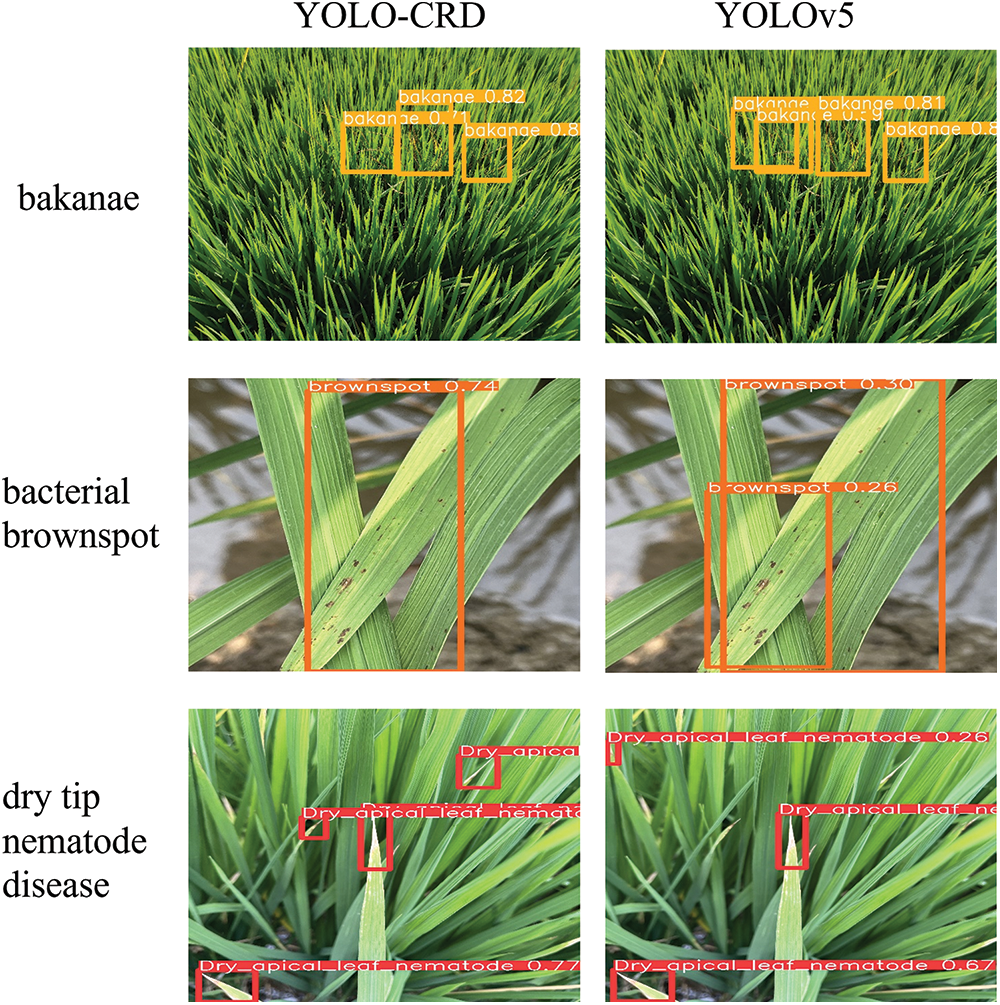
Figure 19: Detection comparison between YOLO-CRD and YOLOv5
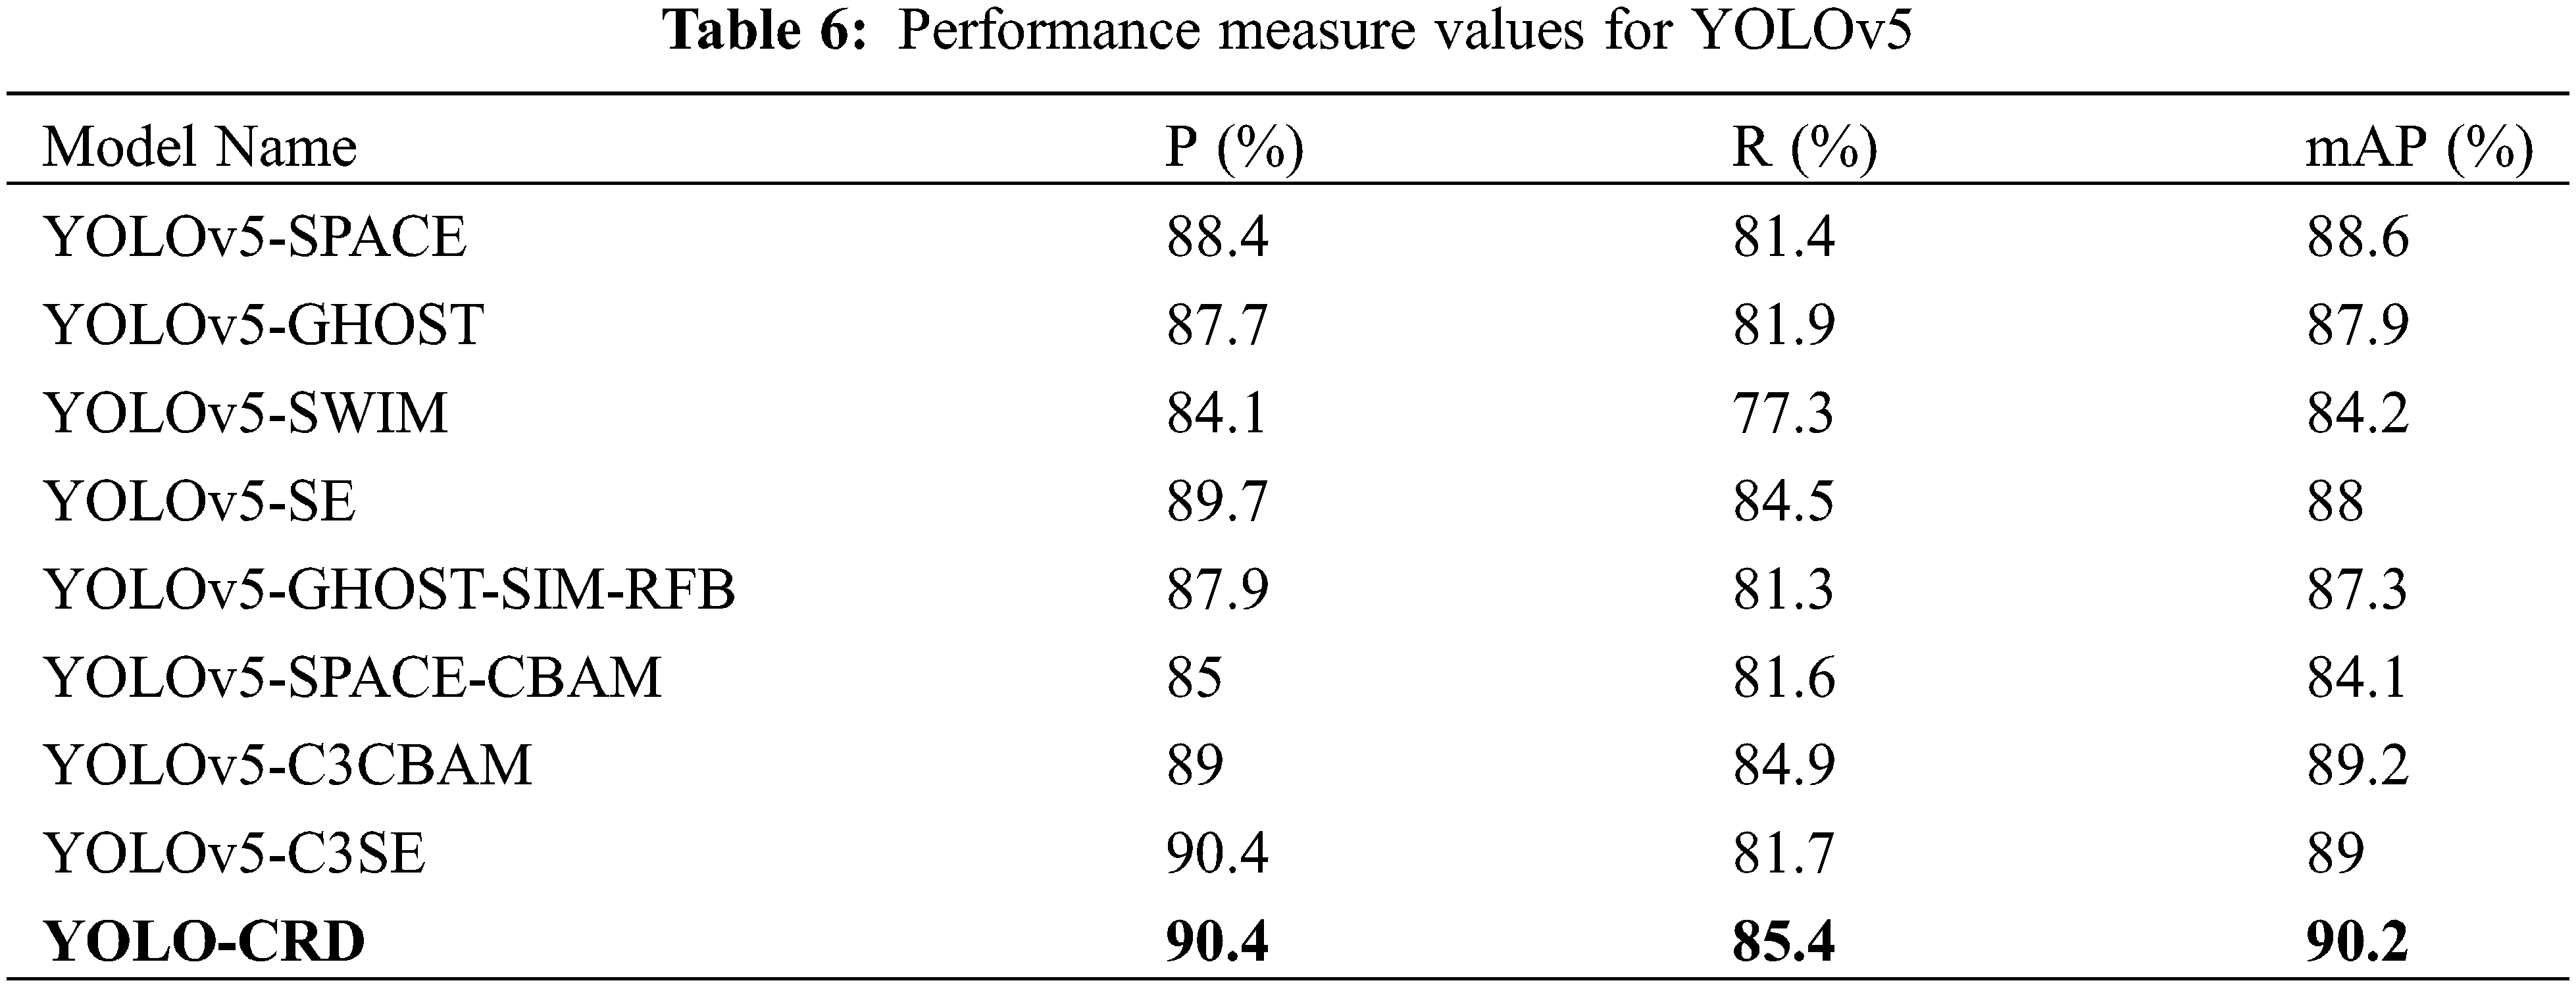
3.3 Comparative Experiments of Fusion Attention Mechanism
After the YOLO-CRD network model was enhanced with the C3CBAM module, the outcomes were compared with the original YOLOv5 network and other attention mechanisms, including SE, SIM, SPACE, and CBAM. Furthermore, we integrated the Ghost module with the attention mechanism and conducted a comparison with YOLO-CRD. The model’s detection results are presented in Table 6. For accuracy, YOLO-CRD was 0.1%–6.3% higher than other models. For mAP, YOLO-CRD was 1%–6.1% higher than other models. For R, YOLO-CRD is 0%–8.1% higher than other models. YOLO-CRD has better performance in terms of accuracy, mAP and R. The Swin Transformer algorithm was used to improve YOLOv5, but it still did not perform as well as YOLO-CRD.
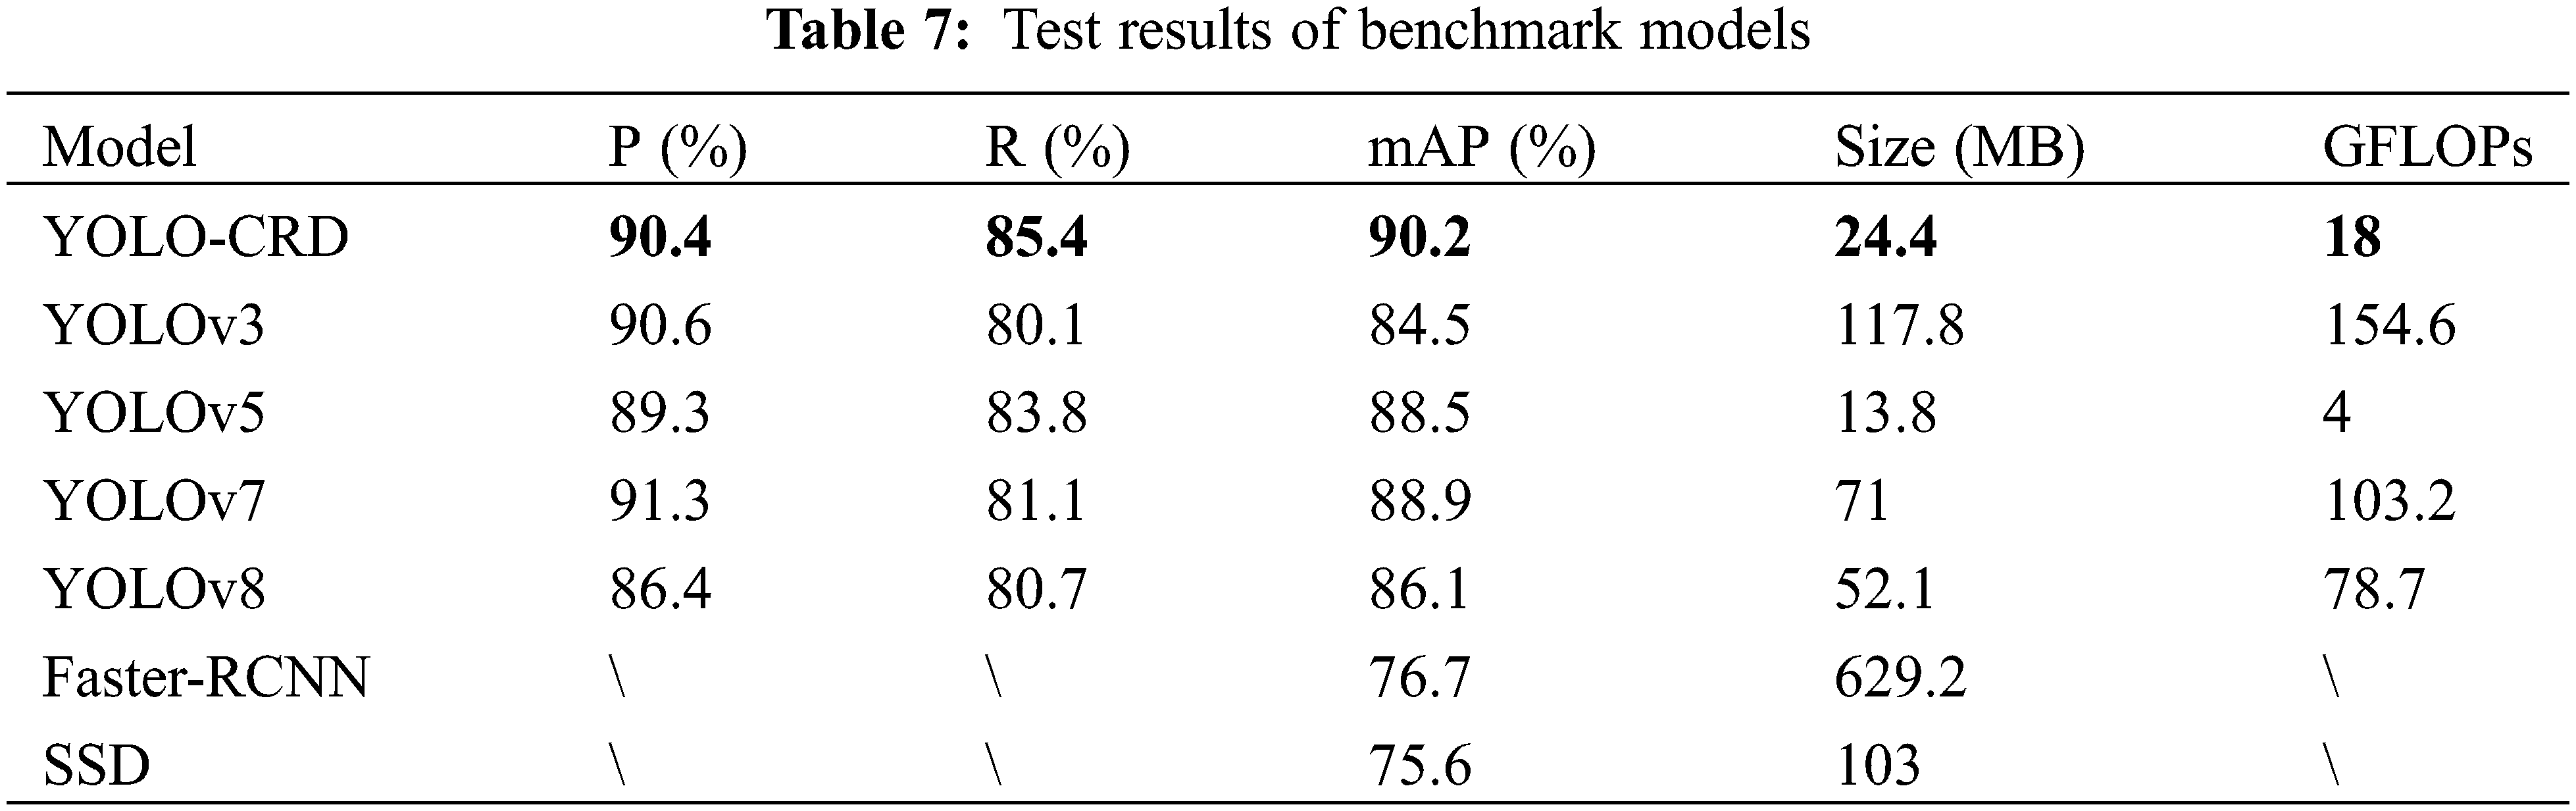
3.4 Comparison with State-of-the-Art Models
The performance of YOLO-CRD was evaluated on the same custom dataset as the most advanced models available, including the five standard models YOLOv3, YOLOv7, YOLOv8, Faster-R-CNN, and SSD. The comparative outcomes are shown in Table 7. Compared with YOLOv7 and YOLOv8, YOLO-CRD increased mAP by 1.3% and 4.1%, respectively, indicating that the model improved the detection of rice diseases. In a comparison among YOLOv7, YOLOv8, and YOLOv5, YOLOv5 had a better model size than YOLOv7 and a higher model accuracy than YOLOv8; consequently, YOLOv5 was selected as the benchmark model. Compared with YOLOv3, YOLO-CRD’s mAP was 5.7%. Compared with Faster-R-CNN, YOLO-CRD’s mAP was 13.5%. Compared with SSD, YOLO-CRD’s mAP was 14.6% higher. The model was also better than the two-stage model. As shown in Table 7, compared with GFLOPs, YOLO-CRD was less computationally intensive and had a faster processing time.
As shown in Fig. 20, YOLO-CRD better detected color changes in the images, detecting bakanae early when it was not readily evident. YOLOv7 missed three images of in bakanae disease, one of bacterial brown spot disease, and one of dry tip nematode disease. The detection accuracy of YOLOv7 for small and distant targets was slightly superior to that of YOLO-CRD. However, the YOLOv7 model size was significantly larger than that of YOLO-CRD, making the former not suitable for direct use in hand-held devices. Moreover, even though YOLOv7 had higher detection rates of small and long-distance targets, it also had more false positives. In particular, bacterial brown spot and rice fever which have relatively similar disease characteristics, were misidentified more often by YOLOv7 compared with YOLO-CRD. Although YOLO-CRD missed slightly more long-distance targets, it had higher prediction frame positioning accuracy.
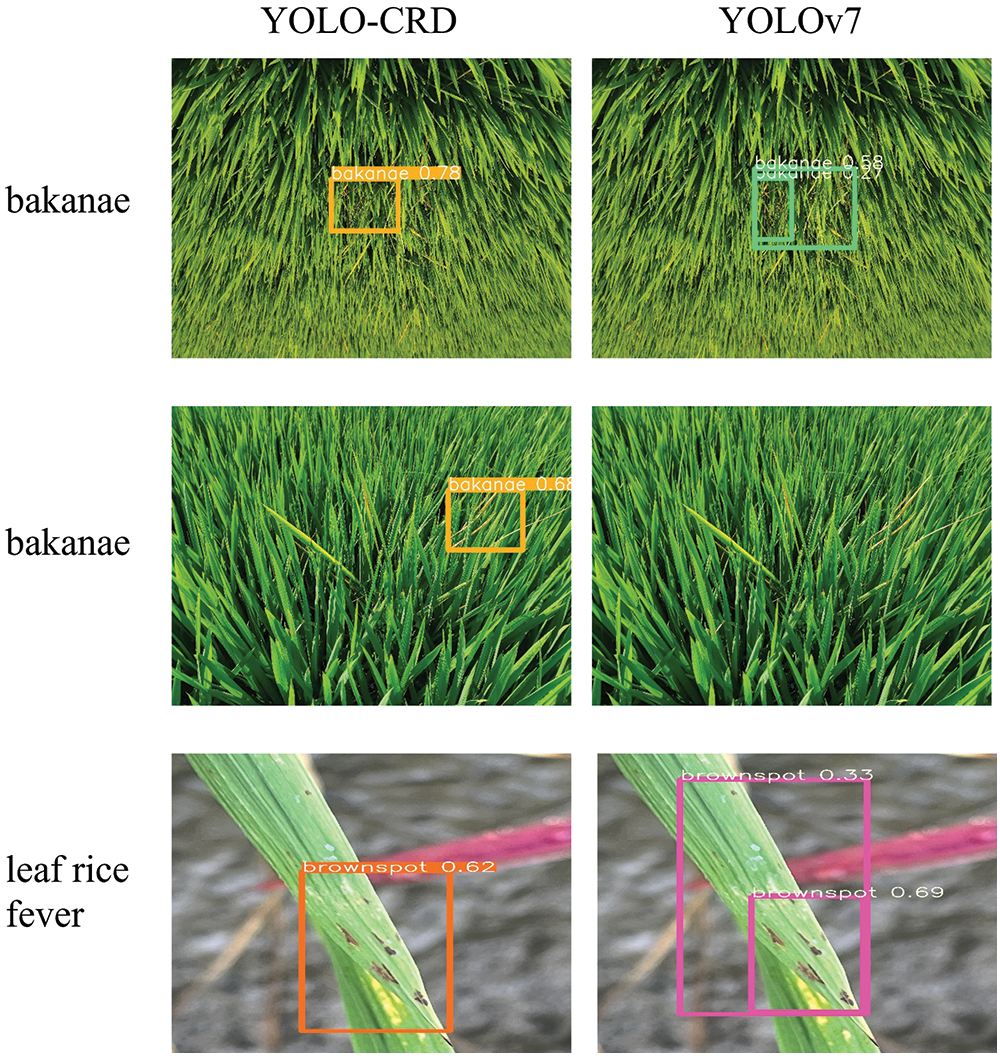
Figure 20: Detection comparison between YOLO-CRD and YOLOv7
Owing to the sparse and relatively small distribution of rice diseases in the images, the existing detection models may result in false predictions and failed disease detection, which in time would affect the subsequent yield. The C3CBAM, SPPCSPC, and Ghost modules were introduced into the YOLO-CRD network, and an attention map was generated by considering the information between channels and the spatial axis relationship. The detection outcomes revealed that the YOLO-CRD network model offers a high detection accuracy and precise positioning predictions for small targets, while maintaining computational efficiency.
At present, research on rice diseases mainly focuses on rice fever, a high-incidence disease of rice, but it varies among different regions and different rice species. Errors in the identification of plant diseases can easily lead to the use of the wrong pesticides, reduce economic benefits, and reduce crop yields. Therefore, this paper mainly collected images of common diseases of small-station rice, which is mainly cultivated in the Tianjin area. For these diseases, YOLO-CRD, a rice disease identification and detection method based on deep learning, was proposed. First, as shown in Table 2, we compared three basic models of YOLOv5, YOLOv8, and Faster-RCNN. YOLOv5 outperformed YOLOv8 and Faster-RCNN. YOLOv5 also had the smallest model size, making it suitable for portable smart devices. Therefore, this paper adopted YOLOv5 as the base model for further improvements. Second, various improvement methods were undertaken, and it was determined that adding the C3CBAM, SPPCSPC, and Ghost modules to the model had the best effect. The improved method was named YOLO-CRD, and in a comparison with the existing YOLOv7, YOLOv8, Faster-RCNN, and SSD models, YOLO-CRD had the best performance. The proposed YOLO-CRD achieved high recognition rates and small weights for rice diseases, and it can be applied to mobile devices. Fig. 21 shows the model on a mobile phone.
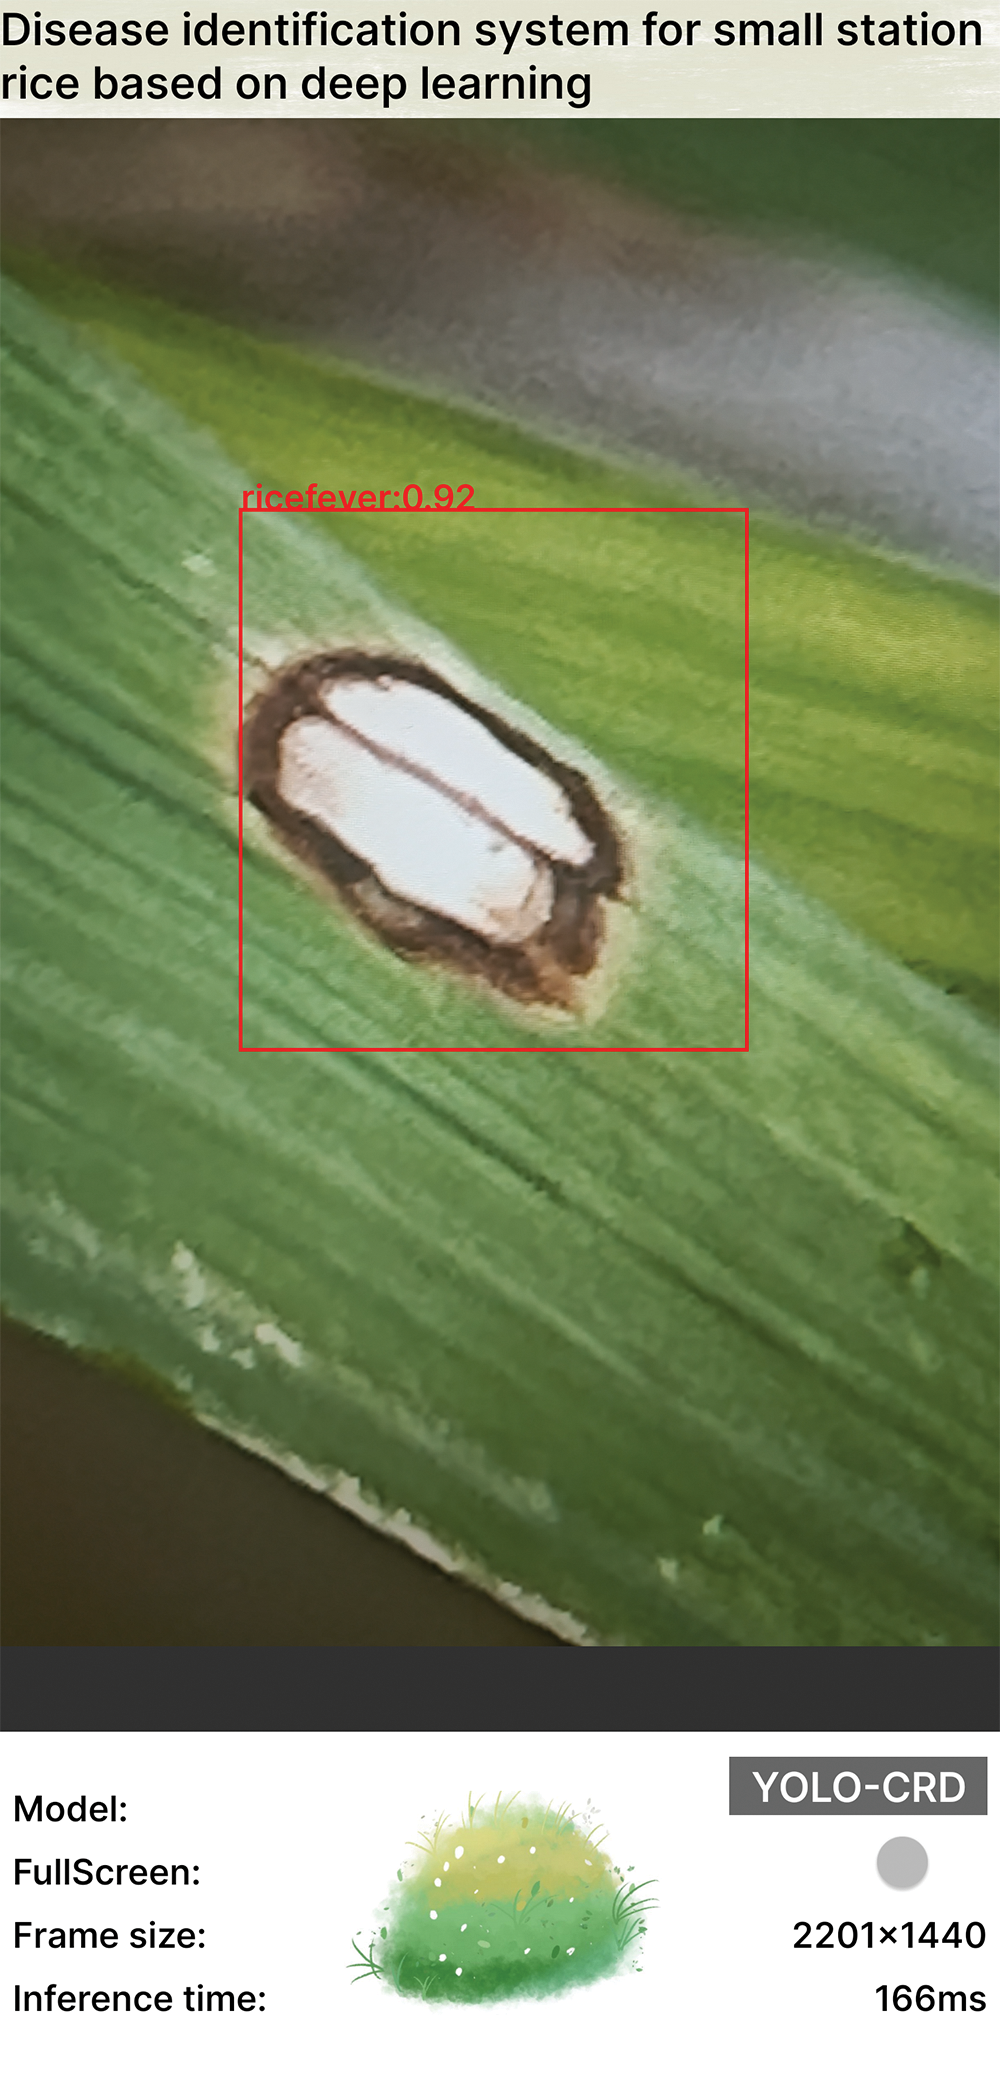
Figure 21: Schematic diagram of model on-board device identification
The mAP of the YOLO-CRD testing model was 90.2%, but the mAP values of bakanae and dry tip nematode disease were lower than those of the other two diseases. These two diseases are easily occluded, and their environmental background are more complex, resulting in low recognition rates. In the future, more images will be collected for bakanae and dry tip nematode disease to address the problem of low recognition rates. In the future, images of all the rice growth periods will be collected to increase the robustness of the model. Additionally, we will integrate images and meteorological data to aid in diagnosing rice disease conditions.
In this study, a YOLO-CRD model was established by collecting diseased rice images for rice disease detection. This study used YOLOv5s as the basic model and added C3CBAM, SPPCSPC, and Ghost modules. The detection results indicated that YOLO-CRD accurately and swiftly detected rice diseases, making it suitable for different rice varieties, lighting conditions, distances, and degrees of obstruction. In real-world experiments, YOLO-CRD achieved an average accuracy of 90.4%, a recall rate of 85.4%, a mAP of 90.2%, an F1-score of 88, and a detection time of 7.2 ms. When compared with the YOLOv5s, YOLOv7, and YOLOv8 algorithms, YOLO-CRD outperformed them in terms of performance. In summary, the model has a better recognition rate in the early disease stages and can reduce the use of pesticides during the rice production process. Owing to the short detection time, this method may be applied to mobile devices. However, our method still has some shortcomings, such as not considering different rice varieties growth stages. In the future, the following two additional research objectives will be undertaken: first, collect data from the seedling stage and add it to the model, allowing the identification of seedling disease, bacterial brown spot, dry tip nematode disease, and rice fever during the whole growth period of rice; and second, apply meteorological data to the rice disease detection process.
Acknowledgement: We thank everyone who assisted in carrying out the field experiment.
Funding Statement: Tianjin Science and Technology Plan Project (Grant No. 21YFSNSN00040), Tianjin Key R&D Plan Science and Technology Support Project (Grant No. 20YFZCSN00220), Central Financial Services to Guide Local Science and Technology Development Project (Grant No. 21ZYCGSN00590) and Tianjin Key Laboratory of Intelligent Crop Breeding Youth Open Project (Grant No. KLIBMC2302).
Author Contributions: The authors confirm contribution to the paper as follows: study conception and design: Tonghai Liu; data collection: Rui Zhang, Xiaoyue Seng, Chaungchuang Yuan, Wenzheng Liu, Tiantian Guo, Xue Wang; analysis and interpretation of results: Tonghai Liu, Rui Zhang; draft manuscript preparation: Tonghai Liu, Rui Zhang. All authors reviewed the results and approved the final version of the manuscript.
Availability of Data and Materials: The datasets produced and analyzed during the present study can be obtained from the corresponding author upon request.
Ethics Approval: Not applicable.
Conflicts of Interest: The authors declare that they have no conflicts of interest to report regarding the present study.
References
1. Sharma AB, Singh N, Singh TP. Association of Pseudomonas oryzihabitans with grain discoloration, panicle blight and chaffiness of rice in North India. Crop Prot. 2023;167:106188. doi:10.1016/j.cropro.2023.106188. [Google Scholar] [CrossRef]
2. FAO. Importance of investing in agriculture in emergency contexts. Available from: http://www.fao.org/documents/card/en/c/cc4892en. [Accessed 2023]. [Google Scholar]
3. Roy-Barman S, Chattoo BB. Rice blast fungus sequenced. Curr Sci. 2005;89(6):930–1. [Google Scholar]
4. Lu Y, Du J, Liu P, Zhang Y, Hao Z. Image classification and recognition of rice diseases: a Hybrid DBN and particle swarm optimization algorithm. Front Bioeng Biotechnol. 2022;10:855667. doi:10.3389/fbioe.2022.855667. [Google Scholar] [PubMed] [CrossRef]
5. Pathogens, precipitation and produce prices. Nat Clim Change. 2021;11:635. doi:10.1038/s41558-021-01124-4. [Google Scholar] [CrossRef]
6. Chatterjee S, Gangopadhyay C, Bandyopadhyay P, Bhowmick MK, Roy SK, Majumder A, et al. Input-based assessment on integrated pest management for transplanted rice (Oryza sativa) in India. Crop Prot. 2021;141:105444. doi:10.1016/j.cropro.2020.105444. [Google Scholar] [CrossRef]
7. Wang D, Saleh NB, Byro A, Zepp R, Sahle-Demessie E, Luxton TP, et al. Nano-enabled pesticides for sustainable agriculture and global food security. Nat Nanotechnol. 2022;17(4):347–60. doi:10.1038/s41565-022-01082-8. [Google Scholar] [PubMed] [CrossRef]
8. Gangola S, Bhatt P, Kumar AJ, Bhandari G, Joshi S, Punetha A, et al. Biotechnological tools to elucidate the mechanism of pesticide degradation in the environment. Chemosphere. 2022;296:133916. doi:10.1016/j.chemosphere.2022.133916. [Google Scholar] [PubMed] [CrossRef]
9. Liu EJ. Magma behaving brittly. Nat Geosci. 2021;14:180–1. doi:10.1038/s41561-021-00724-1. [Google Scholar] [CrossRef]
10. Mathulaprangsan S, Patarapuwadol S, Lanthong K, Jetpipattanapong D, Sateanpattanakul S. Rice disease recognition using effective deep neural networks. J Web Eng. 2021;20(3):853–78. [Google Scholar]
11. Barbedo JGA. Impact of dataset size and variety on the effectiveness of deep learning and transfer learning for plant disease classification. Comput Electron Agric. 2018;153:46–53. doi:10.1016/j.compag.2018.08.013. [Google Scholar] [CrossRef]
12. Li Y, Nie J, Chao X. Do we really need deep CNN for plant diseases identification? Comput Electron Agric. 2020;178(3):105803. [Google Scholar]
13. Rallapalli SM, Durai MS. A contemporary approach for disease identification in rice leaf. Int J Syst Assur Eng Manag. 2021:1–11. [Google Scholar]
14. Zhou C, Zhong Y, Zhou S, Song J, Xiang W. Rice leaf disease identification by residual-distilled transformer. Eng Appl Artif Intell. 2023;121:106020. doi:10.1016/j.engappai.2023.106020. [Google Scholar] [CrossRef]
15. Km S, V. S, P. SK, Ok S. AI based rice leaf disease identification enhanced by dynamic mode decomposition. Eng Appl Artif Intell. 2023;120:105836. doi:10.1016/j.engappai.2023.105836. [Google Scholar] [CrossRef]
16. Kumar A, Yadav DP, Kumar D, Pant M, Pant G. Multi-scale feature fusion-based lightweight dual stream transformer for detection of paddy leaf disease. Environ Monit Assess. 2023;195(9):1020. doi:10.1007/s10661-023-11628-5. [Google Scholar] [PubMed] [CrossRef]
17. Stephen A, Punitha A, Chandrasekar A. Designing self attention-based ResNet architecture for rice leaf disease classification. Neural Comput Appl. 2023;35(9):6737–51. doi:10.1007/s00521-022-07793-2. [Google Scholar] [CrossRef]
18. Tepdang S, Chamnongthai K. Boundary-based rice-leaf-disease classification and severity level estimation for automatic insecticide injection. Appl Eng Agric. 2023;39(3):367–79. doi:10.13031/aea.15257. [Google Scholar] [CrossRef]
19. Lu Y, Tao X, Jiang F, Du J, Li G, Liu Y. Image recognition of rice leaf diseases using atrous convolutional neural network and improved transfer learning algorithm. Multimed Tools Appl. 2024;83(5):12799–817. [Google Scholar]
20. Abasi AK, Makhadmeh SN, Alomari OA, Tubishat M, Mohammed HJ. Enhancing rice leaf disease classification: a customized convolutional neural network approach. Sustainability. 2023;15(20):15039. doi:10.3390/su152015039. [Google Scholar] [CrossRef]
21. Yuan P, Xia Y, Tian Y, Xu H. TRiP: a transfer learning based rice disease phenotype recognition platform using SENet and microservices. Front Plant Sci. 2024;14:1255015. doi:10.3389/fpls.2023.1255015. [Google Scholar] [PubMed] [CrossRef]
22. Bijoy MH, Hasan N, Biswas M, Mazumdar S, Jimenez A, Ahmed F, et al. Towards sustainable agriculture: a novel approach for rice leaf disease detection using dCNN and enhanced dataset. IEEE Access. 2024;12:34174–91. doi:10.1109/ACCESS.2024.3371511. [Google Scholar] [CrossRef]
23. Wang C, Du P, Wu H, Li J, Zhao C, Zhu H. A cucumber leaf disease severity classification method based on the fusion of DeepLabV3+ and U-Net. Comput Electron Agric. 2021;189:106373. doi:10.1016/j.compag.2021.106373. [Google Scholar] [CrossRef]
24. Li D, Wang R, Xie C, Liu L, Zhang J, Li R, et al. A recognition method for rice plant diseases and pests video detection based on deep convolutional neural network. Sensors. 2020;20:578. doi:10.3390/s20030578. [Google Scholar] [PubMed] [CrossRef]
25. Eguskiza Garcia I, Picón Ruiz A, Irusta Zarandona U, Bereciartua Pérez MA, Eggers T, Klukas C, et al. Analysis of few-shot techniques for fungal plant disease classification and evaluation of clustering capabilities over real datasets. Front Plant Sci. 2022;13:813237. doi:10.3389/fpls.2022.813237. [Google Scholar] [PubMed] [CrossRef]
26. Nan Y, Zhang H, Zeng Y, Zheng J, Ge Y. Intelligent detection of multi-class pitaya fruits in target picking row based on WGB-YOLO network. Comput Electron Agric. 2023;208:107780. doi:10.1016/j.compag.2023.107780. [Google Scholar] [CrossRef]
27. Zheng T, Jiang M, Li Y, Feng M. Research on tomato detection in natural environment based on RC-YOLOv4. Comput Electron Agric. 2022;198:107029. doi:10.1016/j.compag.2022.107029. [Google Scholar] [CrossRef]
28. Dang F, Chen D, Lu Y, Li Z. YOLOWeeds: a novel benchmark of YOLO object detectors for multi-class weed detection in cotton production systems. Comput Electron Agric. 2023;205:107655. doi:10.1016/j.compag.2023.107655. [Google Scholar] [CrossRef]
29. Zhao R, Zhu Y, Li Y. An end-to-end lightweight model for grape and picking point simultaneous detection. Biosyst Eng. 2022;223:174–88. doi:10.1016/j.biosystemseng.2022.08.013. [Google Scholar] [CrossRef]
30. Kiratiratanapruk K, Temniranrat P, Kitvimonrat A, Sinthupinyo W, Patarapuwadol S. Using deep learning techniques to detect rice diseases from images of rice fields. In: Fujita H, Fournier-Viger P, Ali M, Sasaki J, editors. Trends in artificial intelligence theory and applications. Artificial intelligence practices. IEA/AIE 2020. lecture notes in computer science. Cham: Springer International Publishing; 2020. p. 225–37. [Google Scholar]
31. Tian Y, Yang G, Wang Z, Li E, Liang Z. Detection of apple lesions in orchards based on deep learning methods of CycleGAN and YOLOV3-dense. J Sens. 2019;2019:1–13. [Google Scholar]
32. Cui J, Tan F. Rice plaque detection and identification based on an improved convolutional neural network. Agriculture. 2023;13(1):170. doi:10.3390/agriculture13010170. [Google Scholar] [CrossRef]
33. Jia L, Wang T, Chen Y, Zang Y, Li X, Shi H, et al. MobileNet-CA-YOLO: an improved YOLOv7 based on the MobileNetV3 and attention mechanism for rice pests and diseases detection. Agriculture. 2023;13(7):1285. doi:10.3390/agriculture13071285. [Google Scholar] [CrossRef]
34. Mohanty SP, Hughes DP, Salathé M. Using deep learning for image-based plant disease detection. Front Plant Sci. 2016;7:1419. doi:10.3389/fpls.2016.01419. [Google Scholar] [PubMed] [CrossRef]
35. Wang Y, Wang Z. A survey of recent work on fine-grained image classification techniques. J Vis Comun Image Represent. 2019;59:210–4. doi:10.1016/j.jvcir.2018.12.049. [Google Scholar] [CrossRef]
36. Shinde S, Kothari A, Gupta V. YOLO based human action recognition and localization. Proc Comput Sci. 2018;133:831–8. doi:10.1016/j.procs.2018.07.112. [Google Scholar] [CrossRef]
37. Woo S, Park J, Lee JY, Kweon IS. CBAM: convolutional block attention module. In: Proceedings of the European Conference on Computer Vision (ECCV); 2018; Munich, Germany. p. 3–19. [Google Scholar]
38. Han K, Wang Y, Tian Q, Guo J, Xu C, Xu C. GhostNet: More features from cheap operations. In: Proceedings of the IEEE/CVF Conference on Computer Vision and Pattern Recognition (CVPR); 2020; Seattle, WA, USA. p. 1577–86. [Google Scholar]
39. Selvaraju RR, Cogswell M, Das A, Vedantam R, Parikh D, Batra D. Grad-CAM: Visual explanations from deep networks via gradient-based localization. Available from: https://arxiv.org/abs/1610.02391v4. [Accessed 2016]. [Google Scholar]
Cite This Article
 Copyright © 2024 The Author(s). Published by Tech Science Press.
This work is licensed under a Creative Commons Attribution 4.0 International License , which permits unrestricted use, distribution, and reproduction in any medium, provided the original work is properly cited.
 Downloads
 Citation Tools