
 Submit a Paper
 Propose a Special lssue
 Open Access
ARTICLE

Comparative and Phylogenetic Analysis of the Complete Chloroplast Genomes of 19 Species in Rosaceae Family
1 Research Center for Traditional Chinese Medicine Resources and Ethnic Minority Medicine, Jiangxi University of Chinese Medicine, Nanchang, 330004, China
2 College of Life Sciences, Jiangxi University of Chinese Medicine, Nanchang, 330004, China
* Corresponding Authors: Xiaoyun Wang. Email: ; Jun Yuan. Email:
(This article belongs to the Special Issue: Recent Research Trends in Genetics, Genomics, and Physiology of Crop Plants)
Phyton-International Journal of Experimental Botany 2024, 93(6), 1203-1219. https://doi.org/10.32604/phyton.2024.051559
Received 08 March 2024; Accepted 26 April 2024; Issue published 27 June 2024
 View Full Text
 Download PDF
Abstract
Rosaceae represents a vast and complex group of species, with its classification being intricate and contentious. The taxonomic placement of many species within this family has been a subject of ongoing debate. The study utilized the Illumina platform to sequence 19 plant species from 10 genera in the Rosaceae. The cp genomes, varying in size from 153,366 to 159,895 bp, followed the typical quadripartite organization consisting of a large single-copy (LSC) region (84,545 to 87,883 bp), a small single-copy (SSC) region (18,174 to 19,259 bp), and a pair of inverted repeat (IR) regions (25,310 to 26,396 bp). These genomes contained 132–138 annotated genes, including 87 to 93 protein-coding genes (PCGs), 37 tRNA genes, and 8 rRNA genes using MISA software, 52 to 121 simple sequence repeat (SSR) loci were identified. D. arbuscular contained the least of SSRs and did not have hexanotides, A. lineata contained the richest SSRs. Long terminal repeats (LTRs) were primarily composed of palindromic and forward repeat sequences, meanwhile, The richest LTRs were found in Argentina lineata. Except for Argentina lineata, Fragariastrum eriocarpum, and Prunus trichostoma, which varied in gene type and position on both sides of the boundary, the remaining species were found to be mostly conserved according to IR boundary analysis. The examination of the Ka/Ks ratio revealed that only the infA gene had a value greater than 1, indicating that this gene was primarily subjected to positive selection during evolution. Additionally, 9 hotspots of variation were identified in the LSC and SSC regions. Phylogenetic analysis confirmed the scientific validity of the genus Prunus L. sensu lato (s.l.) within the Rosaceae family. The separation of the three genera Argentina Hill, Fragariastrum Heist. ex Fabr. and Dasiphora Raf. from Potentilla L. may be a more scientific classification. These results offer fresh perspectives on the taxonomy of the Rosaceae.Keywords
Supplementary Material
Supplementary Material FileThe Rosaceae family is estimated to have originated in the Late Cretaceous period [1]. With fewer species in the southern hemisphere and a greater richness in the northern temperate areas, it is extensively dispersed around the planet. This family consists of three subfamilies, 88 to 100 genera, and around 3000 species. China is the distribution center of the Rosaceae family, with more than 1,000 species in 51 genera [2]. Because of frequent hybridization, apomixis (asexual reproduction), and rapid radiation evolution, the phylogenetic connections within the Rosaceae family have always been a source of debate [3].
The classification of Rosaceae differs from that of other angiosperms and is greatly influenced by molecular phylogenetic studies. Besides Chrysobalanaceae and/or Neuradaceae, previous classifications have sometimes included Saxifragaceae, Crassulaceae, and Cunoniaceae [4], or Dichapetalaceae and Calycanthaceae [5] within the Rosales order. However, molecular evidence does not support these families as being particularly closely related to Rosaceae. Within the Rosaceae family itself, there have been published numerous taxonomic treatments pertaining to the Rosaceae’s classification. The family is divided into four subfamilies, Amygdaloideae (Prunoideae), Maloideae, Rosoideae, and Spiraeoideae, the most frequently accepted taxonomy to date, primarily based on fruit kinds [6]. However, Potter et al. classified the Rosaceae into three subfamilies, namely Dryadoideae, Rosoideae, and Amygdaloideae, based on phylogenetic analysis of six nuclear and four chloroplast genes. Former members of Prunoideae, Maloideae, Spiraeoideae, and a few taxa belonging to Rosoideae are included in the Amygdaloideae [7]. Subsequently, Hong et al. revised the Potter system by eliminating the level of supertribe and merging Osmaronieae and tribe Kerrieae into a broader Kerrieae tribe [8]. It also divided some tribes into subtribes and genera. After revisions, Rosaceae now has three subfamilies and fifteen tribes. Understanding the evolutionary history of the Rosaceae family is crucial for biodiversity conservation and the improvement of commercially important species.
The economically valuable species of the Rosaceae family is mainly concentrated in genera with a large number of species, such as Rubus L., Rosa L., and Potentilla L. There are also some species with medicinal value in smaller genera like Malus Mill. and Crataegus L. [2]. Rubus is the largest genus in the Rosaceae family, encompassing over 700 shrubs and herbaceous plants [9]. The fruits of the Rubus plants have been dubbed “superfruits” due to their rich content of anthocyanins, phenolic acids, flavonoids, tannins, and other beneficial secondary metabolites [10]. The origin center of the Rubus has long been debated. Some researchers suggested that it originated in southwest China [11,12], while others believed North America is the center of Rubus origin [13]. Research on Rubus has primarily focused on the taxa in Europe and America, and the phylogenetic relationship of Chinese Rubus species remains unresolved [14]. Rosa L. is a typical genus in the Rosaceae family that has gained popularity in recent years due to its therapeutic properties. For example, the famous traditional Chinese medicinal plant, the rose flower (Meiguihua), is known for its blood circulation-promoting, qi-regulating, and mood-lifting properties. Therefore, it is frequently used to treat female disorders such as irregular menstruation and dysmenorrhea [15]. Extracts from rose flowers also serve as anti-inflammatory and expectorant agents for respiratory diseases [16]. Historically, plants from the Potentilla have been used for medicinal purposes in both China and Europe [17]. Modern medical research has discovered that the extracts of various Potentilla species exhibit good antioxidant, anti-tumor, and anti-ulcer effects [18]. The fruits of Fragaria L., commonly known as strawberries, are the most favored. Apart from their appealing taste, strawberries also possess antioxidant, antibacterial, and anti-inflammatory properties. China is the Sorbus L. genus’s primary distribution location, and it is widely recognized for its ornamental value [19]. In the Rosaceae family, each genus has unique traits, although there is frequently debate on the genealogical relationships both within and across species.
The angiosperm chloroplast genome displays a quadripartite structure with a pair of repeats (IRs) dividing a small single-copy region (SSC) from a large single-copy region (LSC) [20,21]. The chloroplast genome is extensively utilized in reconstructing phylogenetic relationships and facilitating species-level identification [22,23]. It serves as a crucial molecular marker for analyzing intraspecific genetic diversity [24,25]. Our comprehension of the evolution of the chloroplast genome can be improved by comparing whole chloroplast genomes [26,27]. Moreover, the genome of chloroplasts offers a perfect paradigm for phylogenetic connection resolution and molecular markers in genome evolution [28]. As of 27 March 2024, the NCBI database has documented the chloroplast genomes of 16,554 plant species, underscoring their pivotal role in DNA barcoding applications [29]. Consequently, the chloroplast genome remains an integral component in the realms of plant identification, taxonomic classification, and phylogenetic studies [30].
The unique ecological environment of the Tibetan Plateau has nurtured distinct medicinal resources, particularly within the Rosaceae family, a primary group of Tibetan medicinal plants [31]. These plants, characterized by slow growth and long life cycles, face the risk of resource depletion, posing significant challenges for domestication and introduction [32]. Furthermore, the extremely fragile ecological environment supporting these medicinal resources—vulnerable to damage and difficult to restore—underscores the importance of understanding the genomic characteristics and phylogeny of Rosaceae Tibetan medicines. Such knowledge is crucial for the effective protection and sustainable utilization of these valuable medicinal resources. The Rosaceae family, characterized by its vast species diversity and complex taxonomy, has always presented challenges in the classification of certain genera, notably Potentilla and Prunus. This research offers new perspectives on the taxonomic disagreements pertaining to these genera, thereby laying a foundational framework for further research on the phylogeny and structural diversity of the Rosaceae. Such contributions are pivotal for advancing our understanding of the family’s evolutionary relationships and morphological variations.
Dr. Zhong Guoyue of Jiangxi University of Chinese Medicine (JUTCM) confirmed plant samples belonging to 19 different Rosaceae species that were obtained in the Tibet Autonomous Region of China (Table S1). Every voucher specimen is stored at the JUTCM Herbarium.
2.2.1 DNA Extraction and Sequencing
Using the Plant Genomic DNA Kit (TIANGEN BIOTECH (BEIJING) Co., Ltd., Beijing, China) and a manual technique, genomic DNA was isolated from leaf material. A NanoDrop spectrophotometer was utilized to quantify the concentration of DNA. DNA (>50 ng/μL) was fragmented using sonication, purified and then subjected to end repair. The size of the DNA fragments was determined by gel electrophoresis. Following the standard Illumina genomic DNA library preparation protocol, the Illumina Novaseq 6000 platform (Genepioneer Biotechnologies, Nanjing, China) was used to build and sequence a dual-indexed library with an insert size of 350 bp.
2.2.2 Chloroplast Genome Assembly and Annotation
Trimmomatic v0.36 software [33] was used to filter the raw reads. After trimming the endpoints of the sequences, single bases with a Phred quality score of less than 20 and consecutive uncalled bases with a value more than three were eliminated. Sequences with a trimmed median quality score below 21 or a length below 40 bp were discarded. After quality filtering, Bowtie2 v.2.2.6 [34] was used to map the reads to the available cp genomes of Rosaceae species, downloaded from NCBI, to exclude sequences from nuclear and mitochondrial sources. Subsequently, all putative cp sequences were mapped back to the reference sequences and then de novo assembled using GetOrganelle v1.7.5 [35]. Finally, the high-quality clean data were mapped to the complete plastome for error checking. The CpGAVAS2 software [36] was used to automatically annotate the cp genome, and manual correction was performed using the Geneious v11.0.5 software [37] with reference to previously published cp genomes. The cp genome map was generated using the online tool OGDRAW v1.1 [38].
MISA [39] was used to identify simple sequence repeats (SSRs), and 10, 5, 4, 3, 3, and 3 were the lowest thresholds for mono-, di-, tri-, tetra-, penta-, and hexa-nucleotides, respectively. Four types of long repetitions were identified using REPuter [40]: forward, reverse, palindromic, and complimentary repeats. The following detection parameter values were applied: repfind 30-h 3-best 1000-c-f -p-r-l.
2.2.4 Codon Usage Bias and Ka/Ks Ratio
To determine patterns of codon use and compute codon bias (RSCU), CodonW software 1.4.2 [41] was employed. Using the CODEML method in PAML V4.973 software [42], the ratio of nonsynonymous nucleotide substitution rate to synonymous nucleotide substitution rate (Ka/Ks) for each gene was calculated. Pairwise comparisons were conducted, and each protein-coding gene’s dN/dS ratio was computed using the PAML yn00 program. The specific parameters were set to icode = 10, weighting = 0, common f3 × 4 = 0, and all CODEML control file parameters were kept at their default values.
The IR (Inverted repeat) boundaries were created and the gene type and position inside the boundary region were determined using the IRscope software [43] (https://irscope.shinyapps.io/irapp/). Additionally, the expansion and contraction of genes were found.
The nucleotide variability (Pi) of cp genomes was determined by aligning sequences using MAFFT V5 software [44], then manually modifying the sequences with the BioEdit program [45]. DnaSP version 5.1 was utilized to do the study of sliding windows [46]. 200 bp was the step size and 600 bp was the window length that were specified.
To construct the phylogenetic relationships and examine the phylogenetic status of Rosaceae, the complete cp genomes of 110 Rosaceae species were download from GenBank (Table S2), In this study, we selected two species from the Rosales as outgroups: Hippophae rhamnoides subsp. sinensis Rousi (NC_049156) and Berchemiella wilsonii (Schneid.) Nakai (NC_043912). This choice allows us to establish a comparative framework for phylogenetic analysis, providing a reference point for the genetic background of the taxa under study. Using the following parameter settings, we used MAFFT [44] online to align the 131 complete cp genomes (including 19 Rosaceae species). Then, we used the Gblocks [47] algorithm in PhyloSuite v1.2.275 [48] to remove the ambiguously aligned fragments: minimum number of sequences for a conserved/flank position (17/17), maximum number of contiguous non-conserved positions (8), minimum length of a block (10), and allowed gap positions (with half). The best fitting nucleotide substitution model (TVM+F+I+I+R6) was chosen by ModelFinder [49]. The maximum likelihood (ML) (bootstrap = 1000) and Bayesian inference (BI) (generations = 2,000,000; chains = 4; runs = 2) trees were constructed by IQ-tree and MrBayes in Phylosuite, respectively. Finally, The trees were modified by iTOL online (https://itol.embl.de/).
3.1 Chloroplast Genome Features
The Q30 values of the cp genomes of the 19 Rosaceae species ranges from 92.11% to 93.75%, indicating that the sequencing quality was reliable. The 19 cp genomes range from 153,366 bp (D. arbuscula) to 159,895 bp (S. koehneana), and all exhibit a typical quadripartite structure, consisting of LSC region (8,445–87,883 bp), SSC region (18,174–19,259 bp), and IR region (25,310–26,396 bp) (Table S2). The total GC content was 37.81%–41.1%. The GC content in LSC region, SSC region and IR region was 34.2%–35.23%, 30.25%–31.45% and 42.54%–42.9%, respectively. The total number of annotated genes in all species ranges from 132 to 138, including 87–93 PCGs, 37 tRNA genes, and 8 rRNA genes (Fig. 1, Table S3).
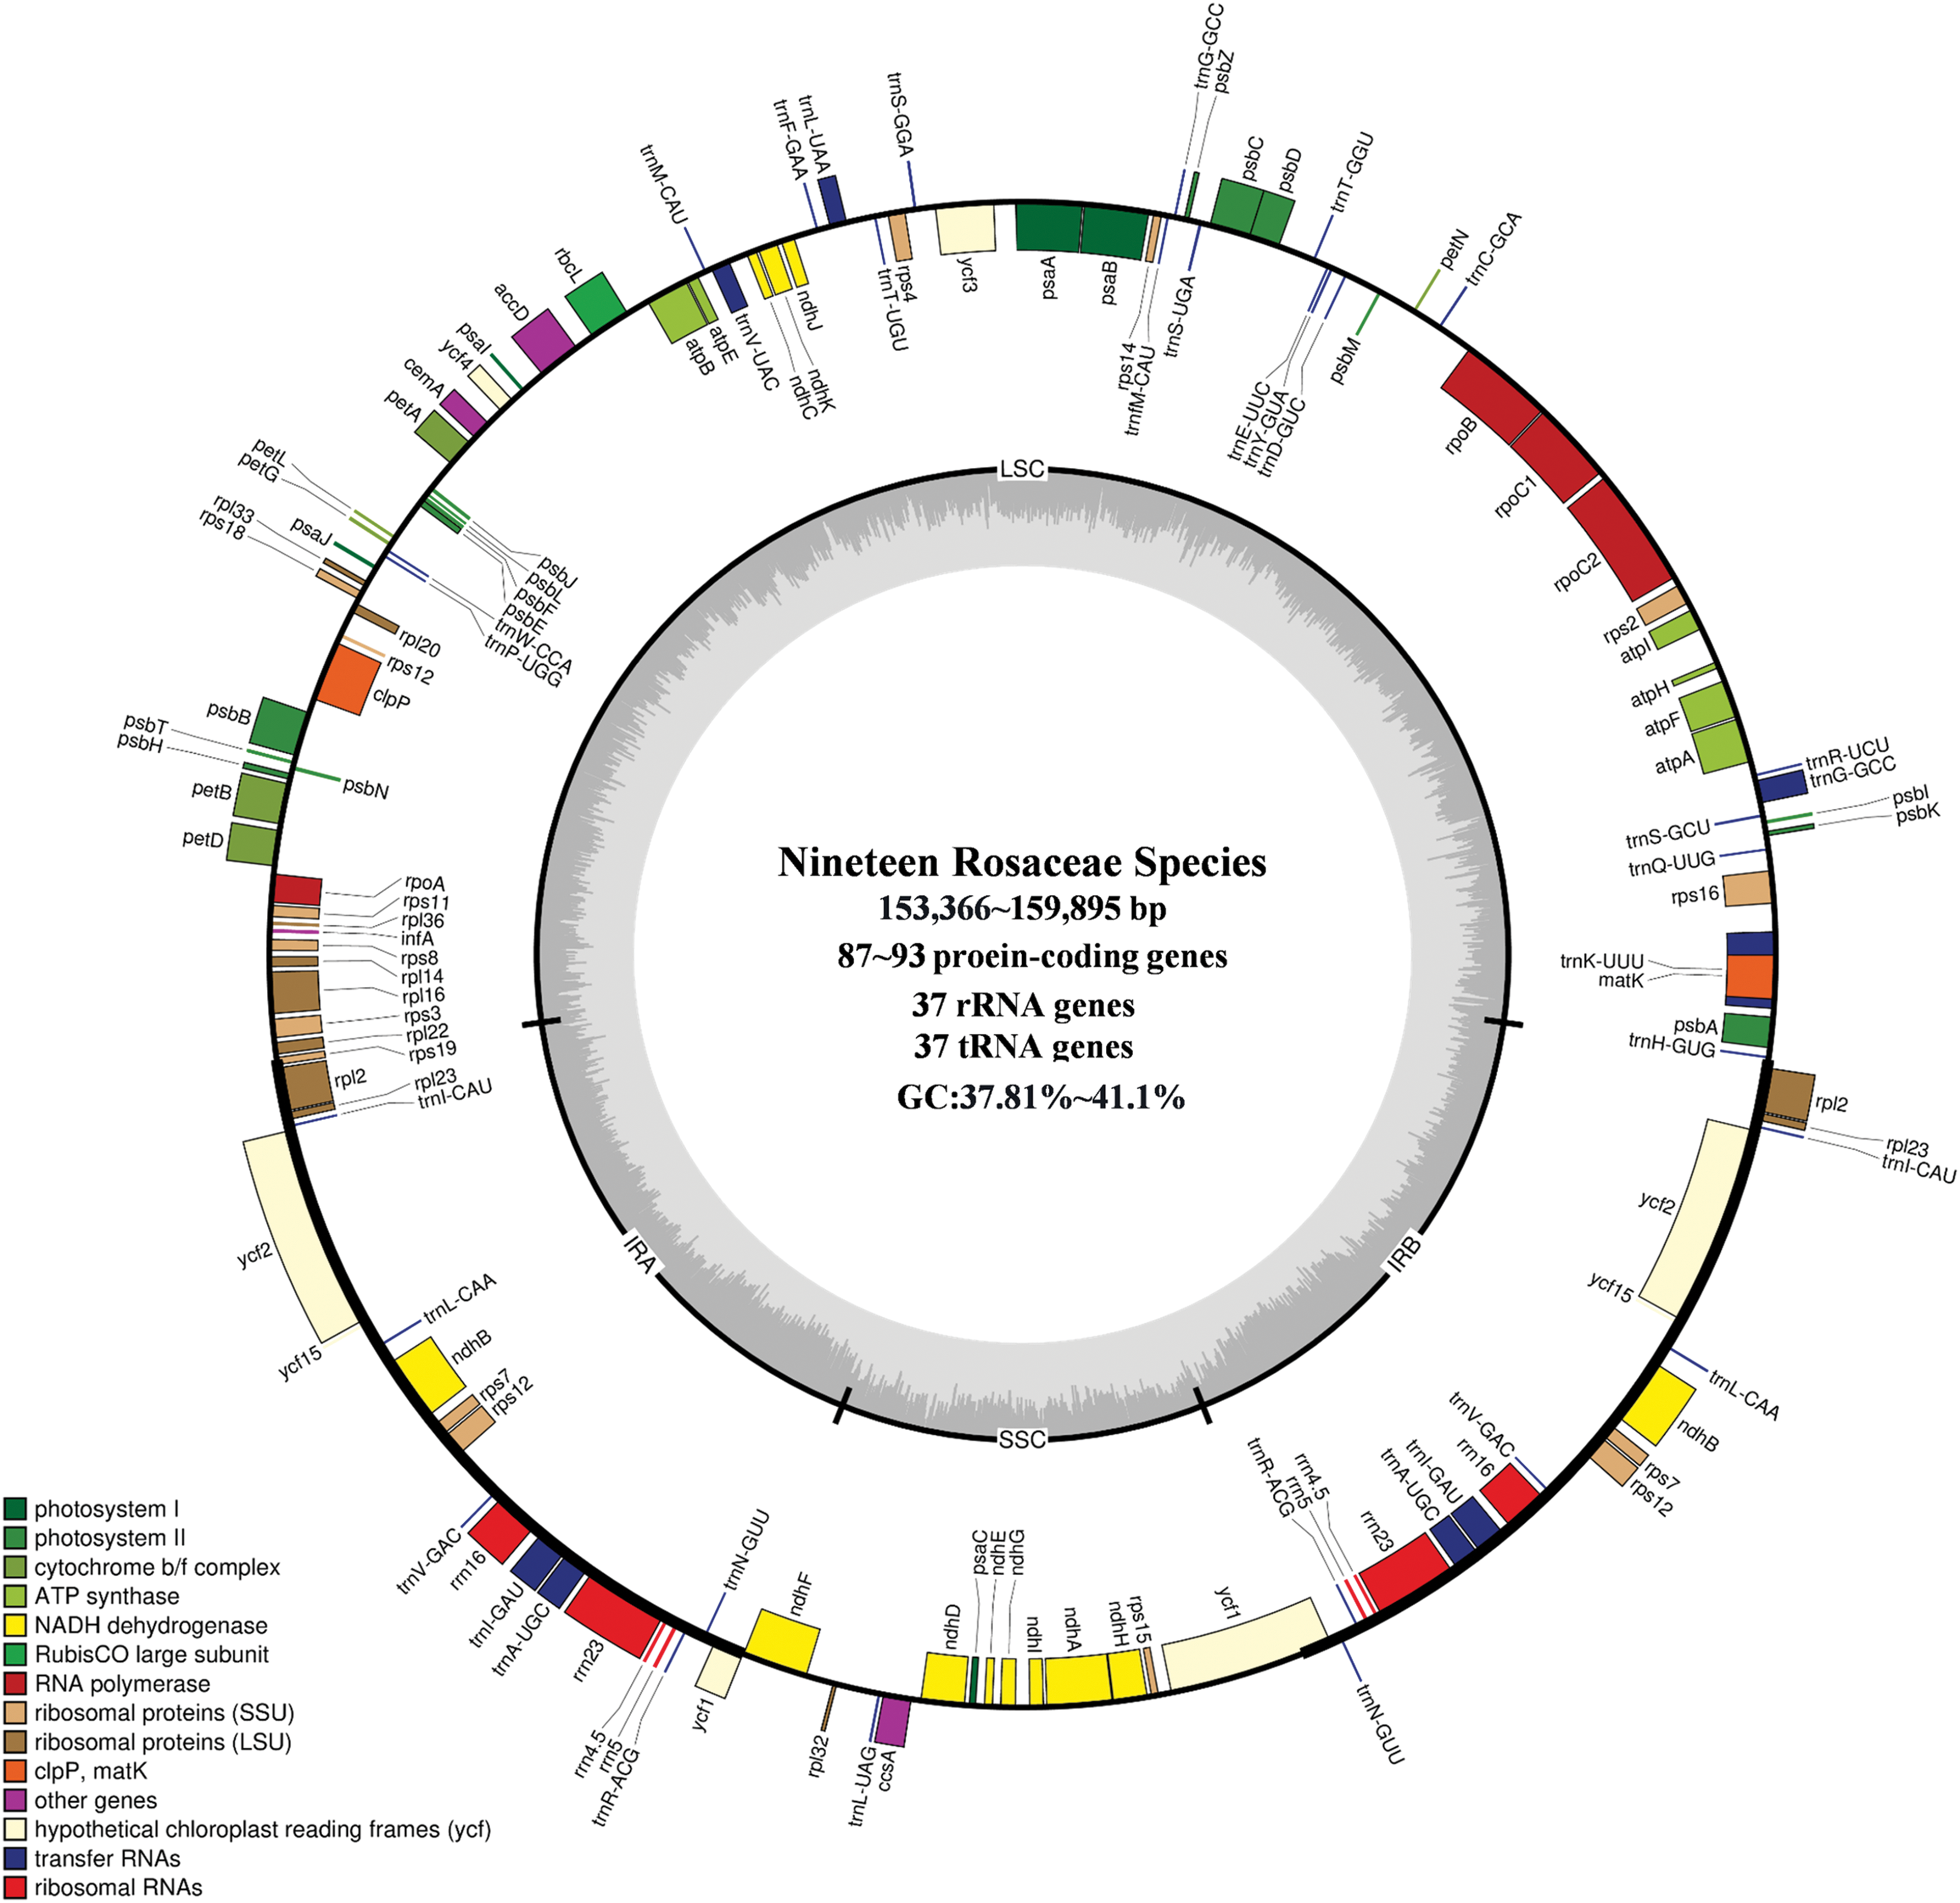
Figure 1: Cp genome map of 19 Rosaceae species. Genes on the inside of the large circle are transcribed clockwise and those on the outside are transcribed counterclockwise. The genes are color-coded based on their functions. The dashed area represents the GC composition of the cp genome. LSC, large single copy region; IR, inverted repeat; SSC, small single copy region
The relative likelihood of synonymous codons expressing a certain amino acid is known as the Relative Synonym Codon Usage (RSCU). The codon composition of 87–93 PCGs in the 19 cp genomes of Rosaceae species was analyzed, and RSCU values were calculated. The cp genomes contained 63 codons (including UAG, UAA, UGA) (Fig. 2), encoding 20 amino acids. The total number of codons encoding proteins ranged from 26,361 (A. lineata) to 27,014 (R. graciliflora).
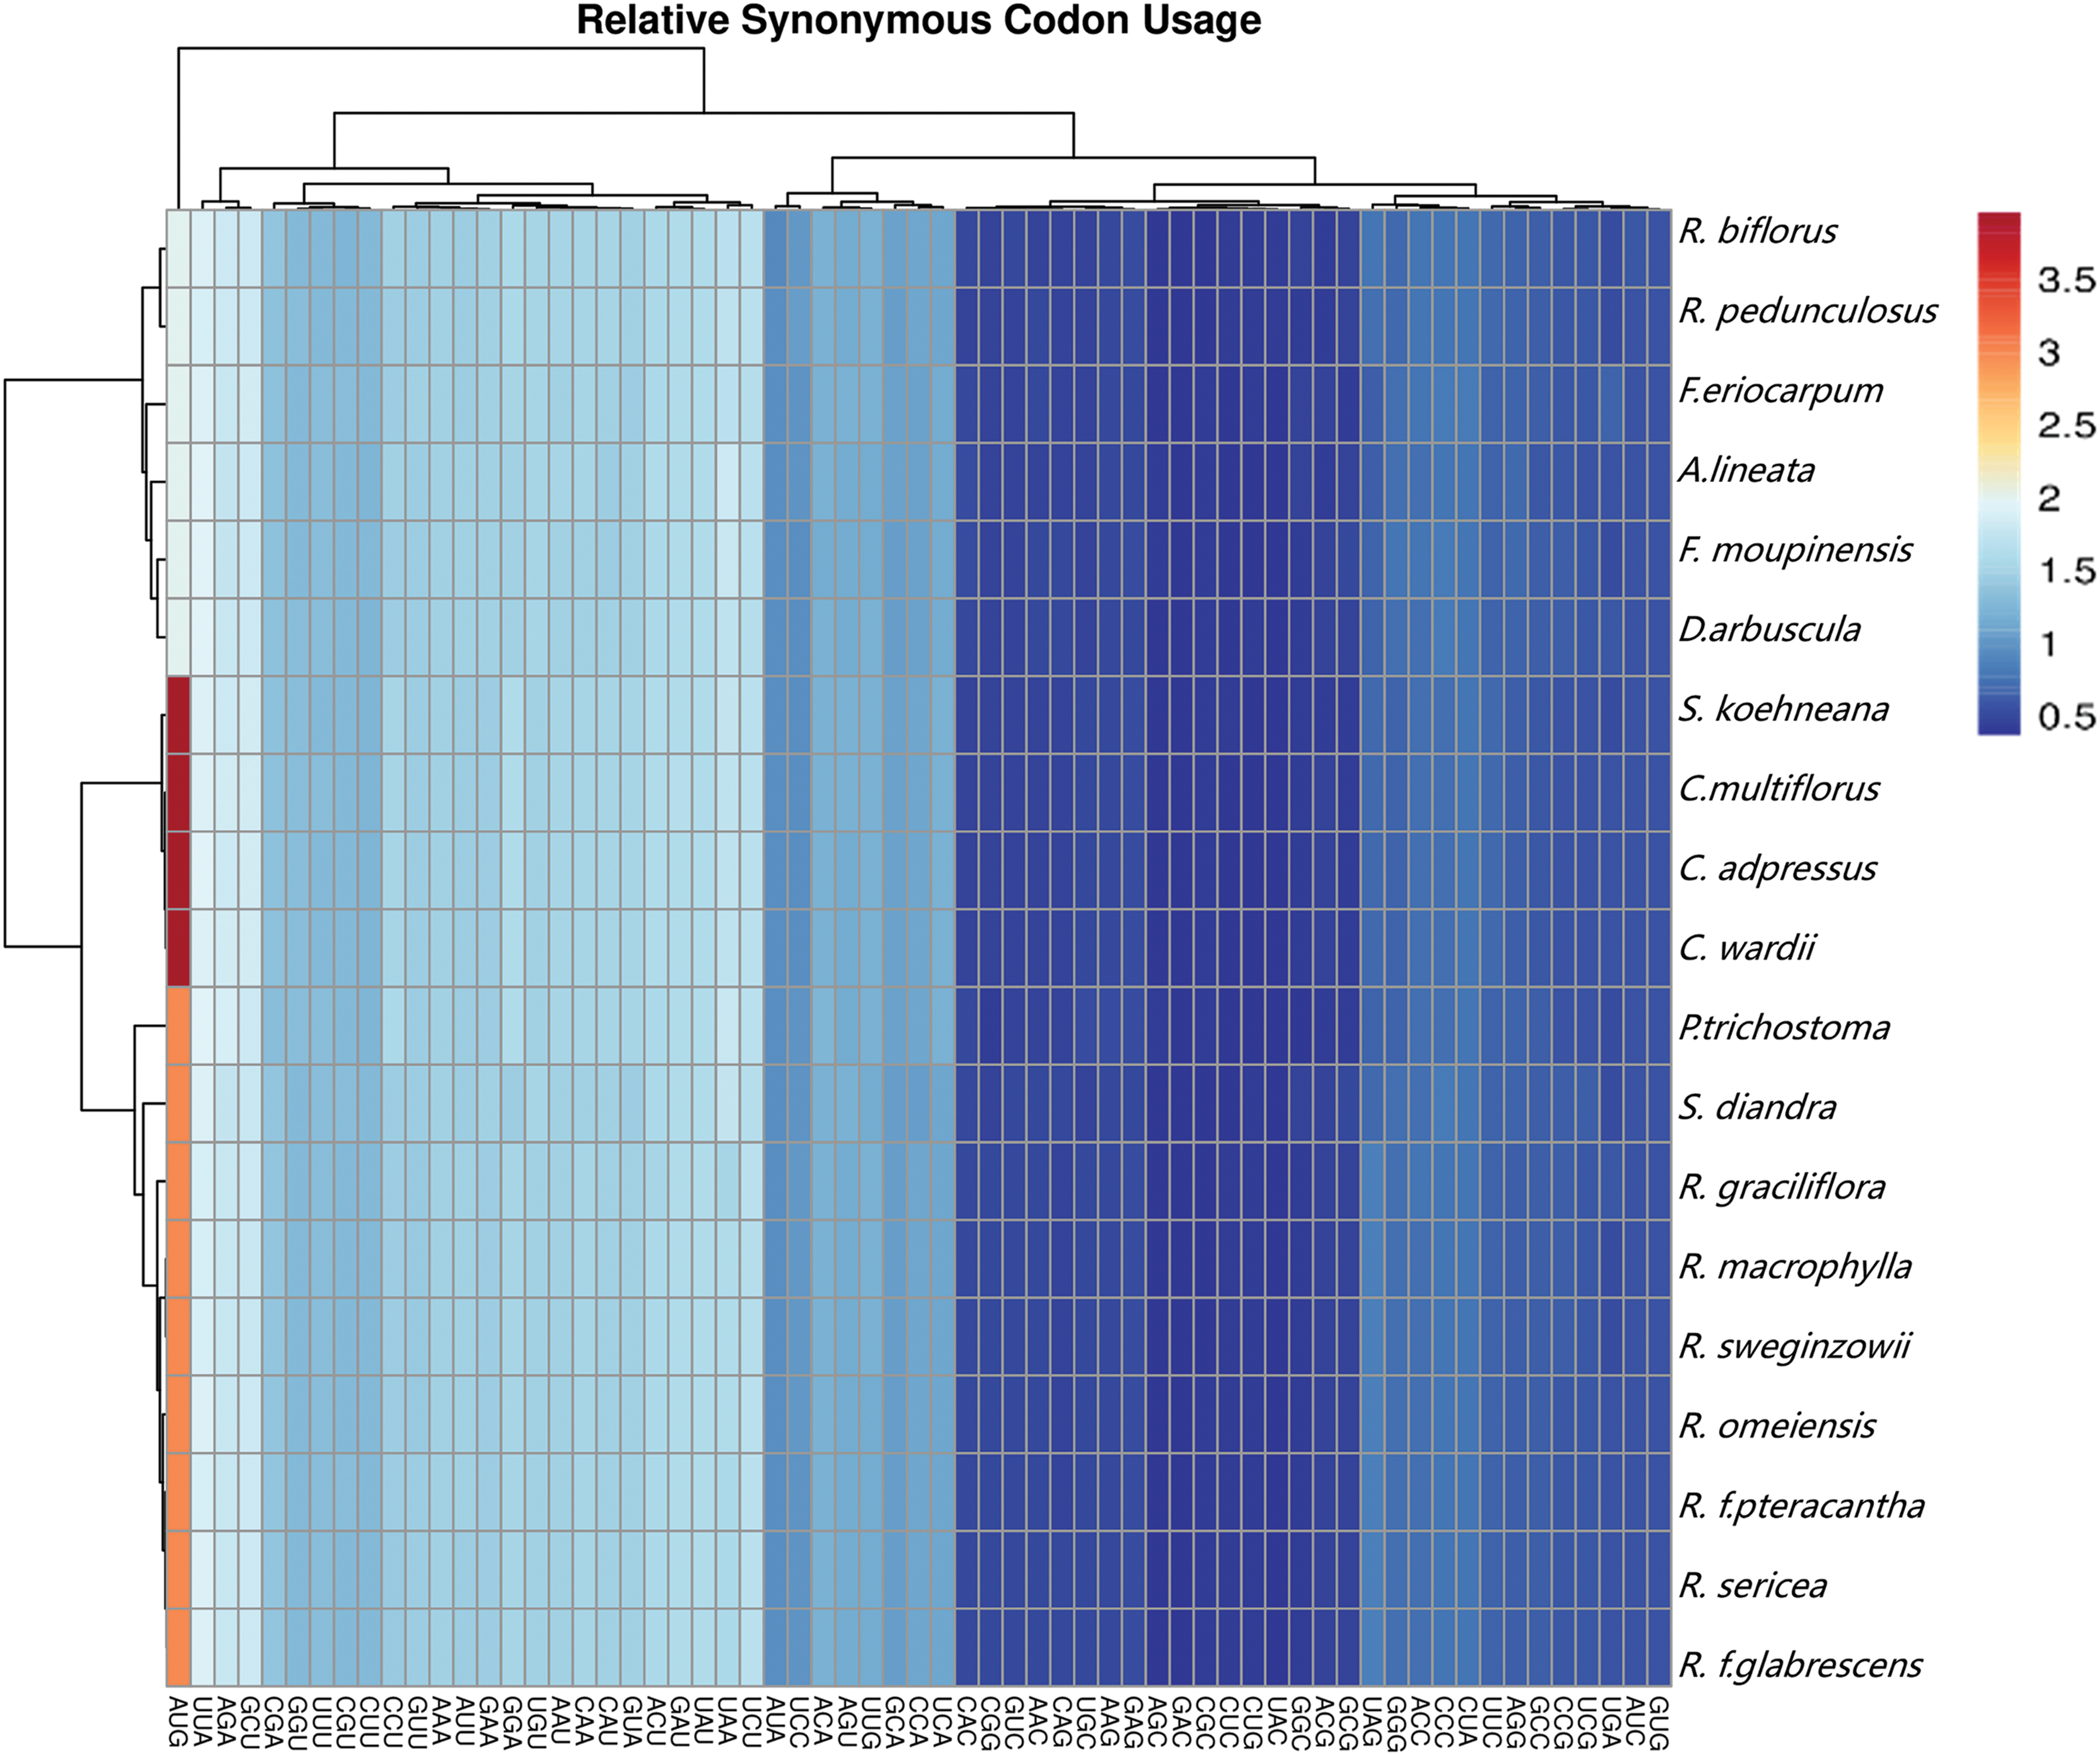
Figure 2: Heatmap of relative synonymous codon usage (RSCU) of 19 Rosaceae cp genomes
Leucine (Leu) has the highest codon usage rate (2,776 to 2,847), while Cysteine (Cys) has the lowest codon usage rate (298 to 315). The RSCU values of the 19 cp genomes ranged from 0.3684 to 3.962. Methionine (Met), which was encoded by AUG, had the greatest RSCU value among them, whereas leucine (Leu) was encoded by CUG, which had the lowest. Furthermore, 30 codons had an RSCU greater than 1 and 33 codons had an RSCU less than 1. All of the codons with RSCU > 1 terminated in A or U, which was in line with the numerous A/T features of angiosperm cp genomes (Fig. 2).
3.3 Repetitive Structure Analysis
A total of 52 (P. fruticosa) to 121 (R. biflorus) SSR loci were detected in the 19 cp genomes, comprising six types of repeats (Fig. 3). Among them, the mononucleotide repeats were the richest (38–84), followed by di- (10–20), tetra- (2–11), tri- (0–7), pentanucleotide repeats (0–4), and hexanucleotide repeats (0–3), respectively. Mononucleotide, dinucleotide, and tetranucleotide repeats existed in the cp genomes of all 19 species. Trinucleotide repeats were absent in P. trichostoma, C. adpressus, C. multiflorus, C. wardii, and S. koehneana. Pentanucleotide repeats were present in P. trichostoma, C. adpressus, C. wardii, R. sweginzowii, S. diandra, and S. koehneana, but absent in the other 13 species. Hexanucleotide repeats were only found in P. trichostoma, R. graciliflora, R. macrophylla, R. sweginzowii, S. diandra, and S. koehneana (Fig. 3).
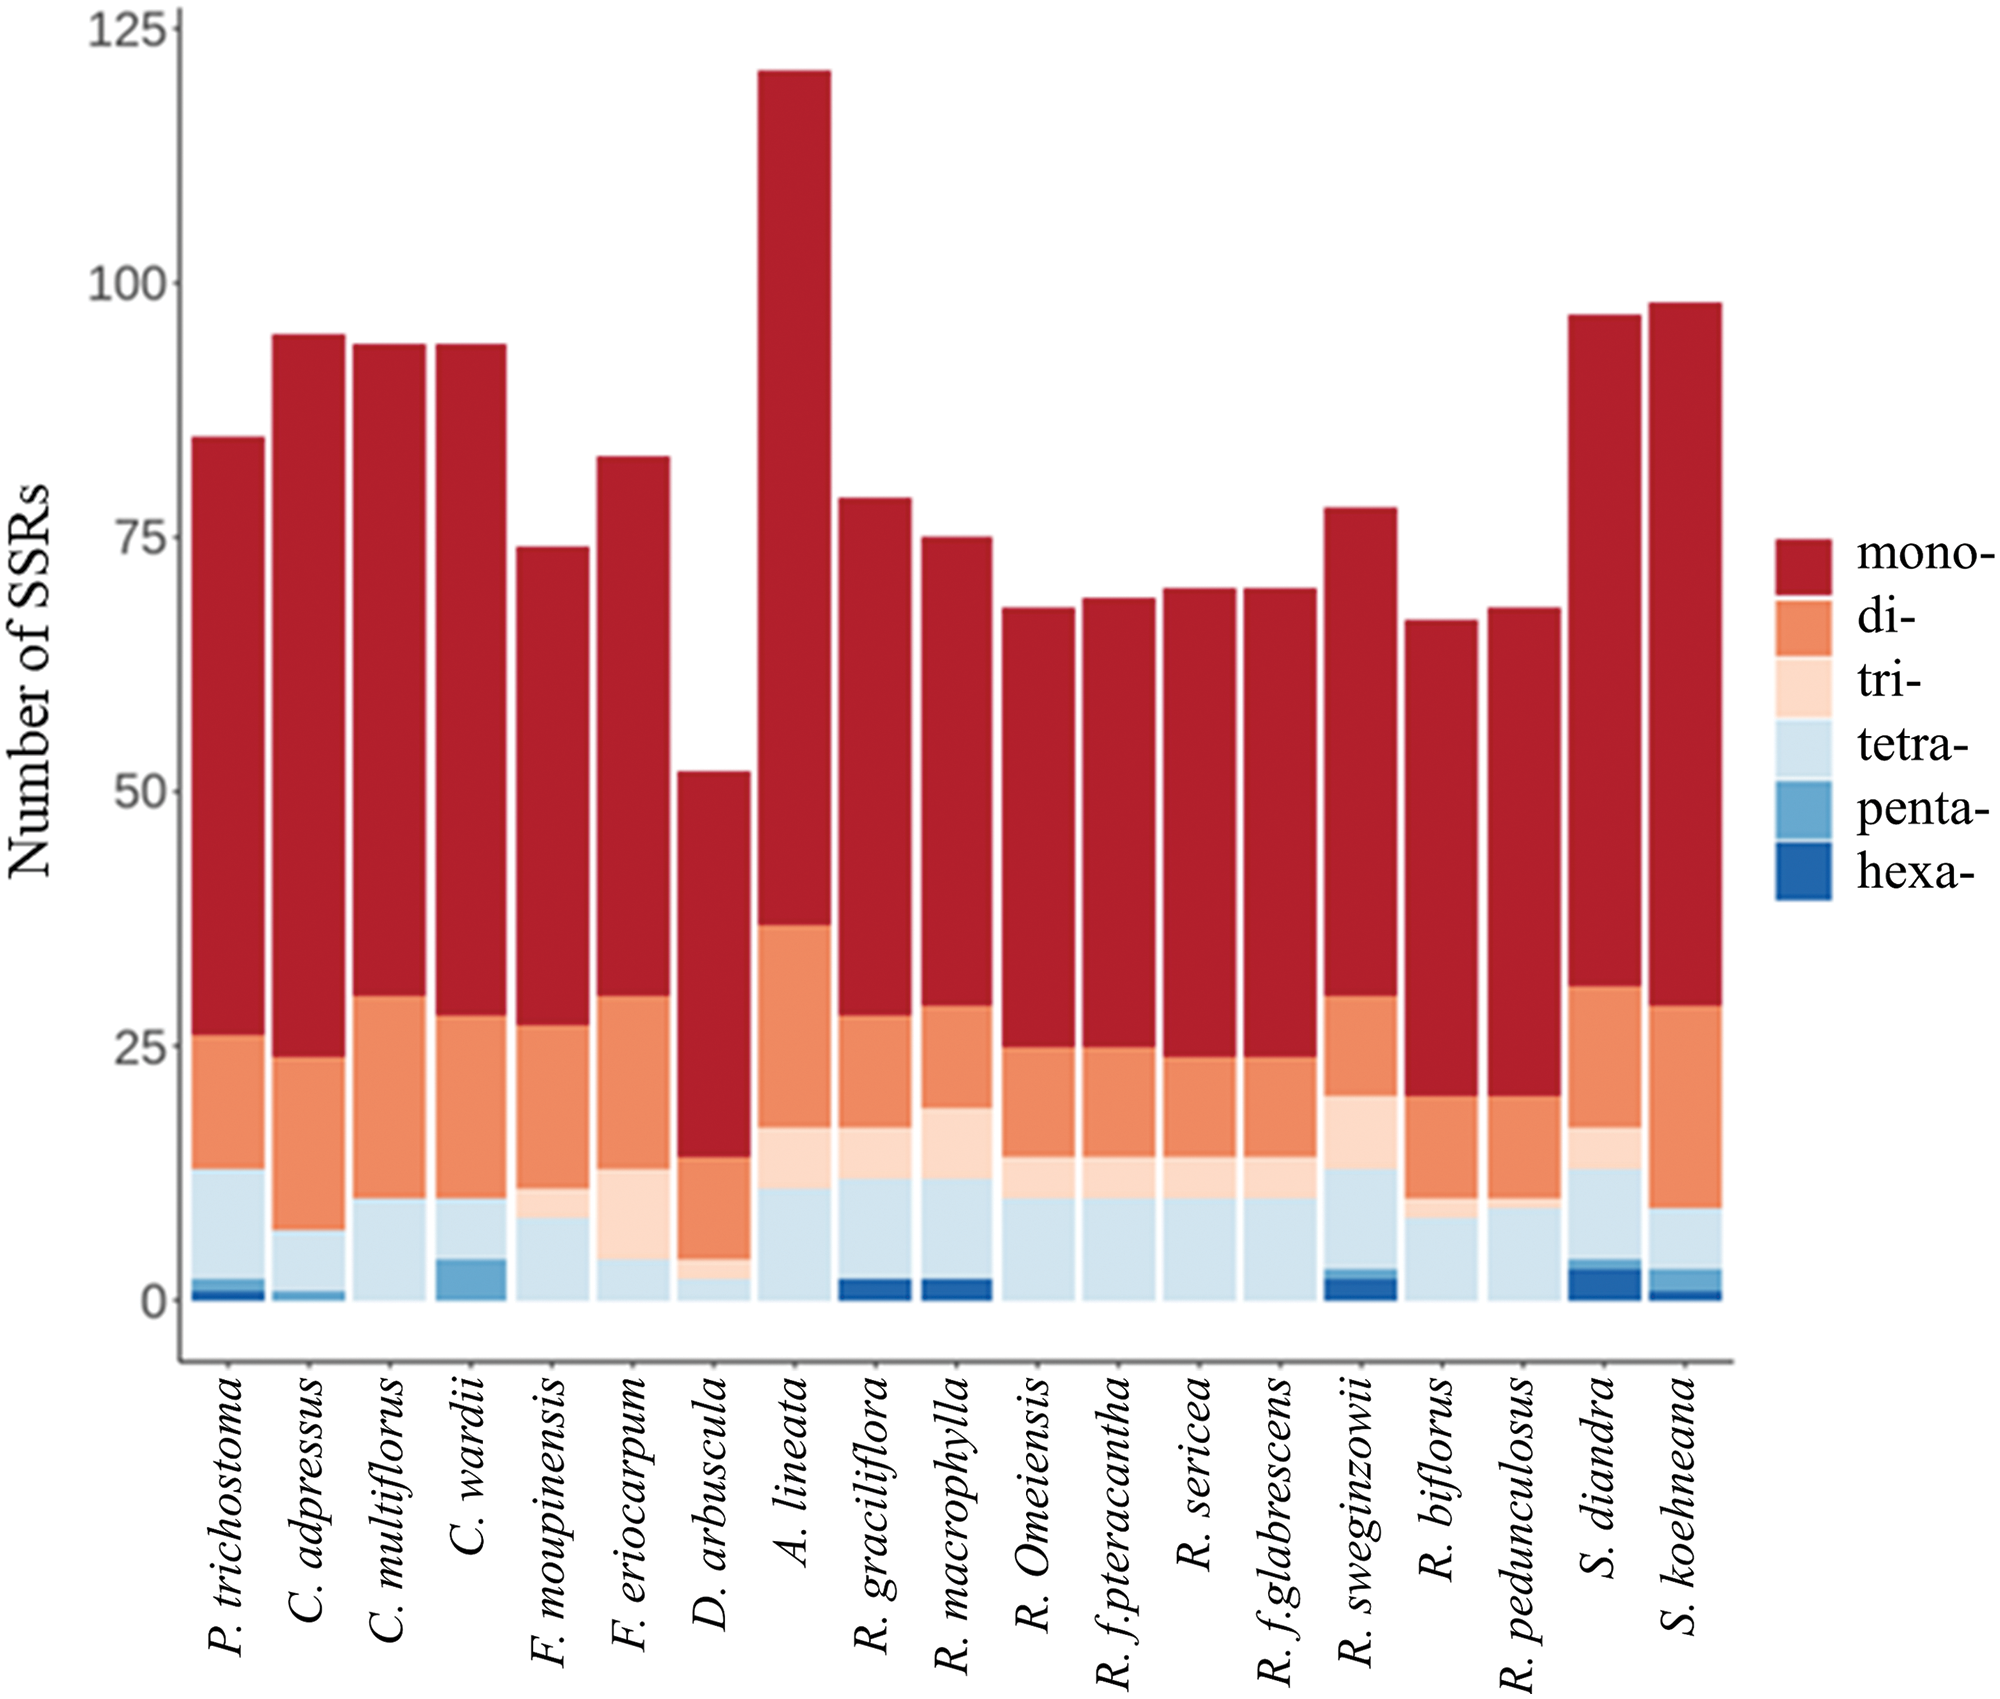
Figure 3: Analysis of cpSSRs in 19 Rosaceae cp genomes
SSRs were not evenly distributed across the cp genomes. The LSC region included 46–96 SSRs, the SSC region had 5–12 SSRs, and the IR region contained 0–15 SSRs. More specifically, there were no SSRs in the IR region of D. arbuscula’s cp genome. Future research on genetic diversity may find areas of fast evolution and suitable targets due to the large number of SSRs found in the LSC region.
There are 32–77 long repeat sequences in the cp genomes of 19 Rosaceae species. There are four different types of repeat sequences: forward (F), reverse (R), palindromic (P), and complementary (C). The large repeat sequences were between 30 and 26,396 bp long. Complementary repeat sequences were found only in nine species, i.e., C. multiflora, C. wardii, F. moupinensis, F. eriocarpa, A. lineatum, R. biflorus, R. pedunculosus, S. diandra, and S. koehneana. Forward, palindromic, and reverse repeat sequences were found in all 19 species. The number of forward repeat sequences ranged from 13 to 38, palindromic repeat sequences ranged from 15 to 27, and reverse repeat sequences ranged from 1 to 10. The most prevalent sequences were palindromic repeats, which made up 31.17% to 55.56% of all sequences, followed by forward repeat sequences, accounting for 29.17% to 49.35% (Fig. 4).
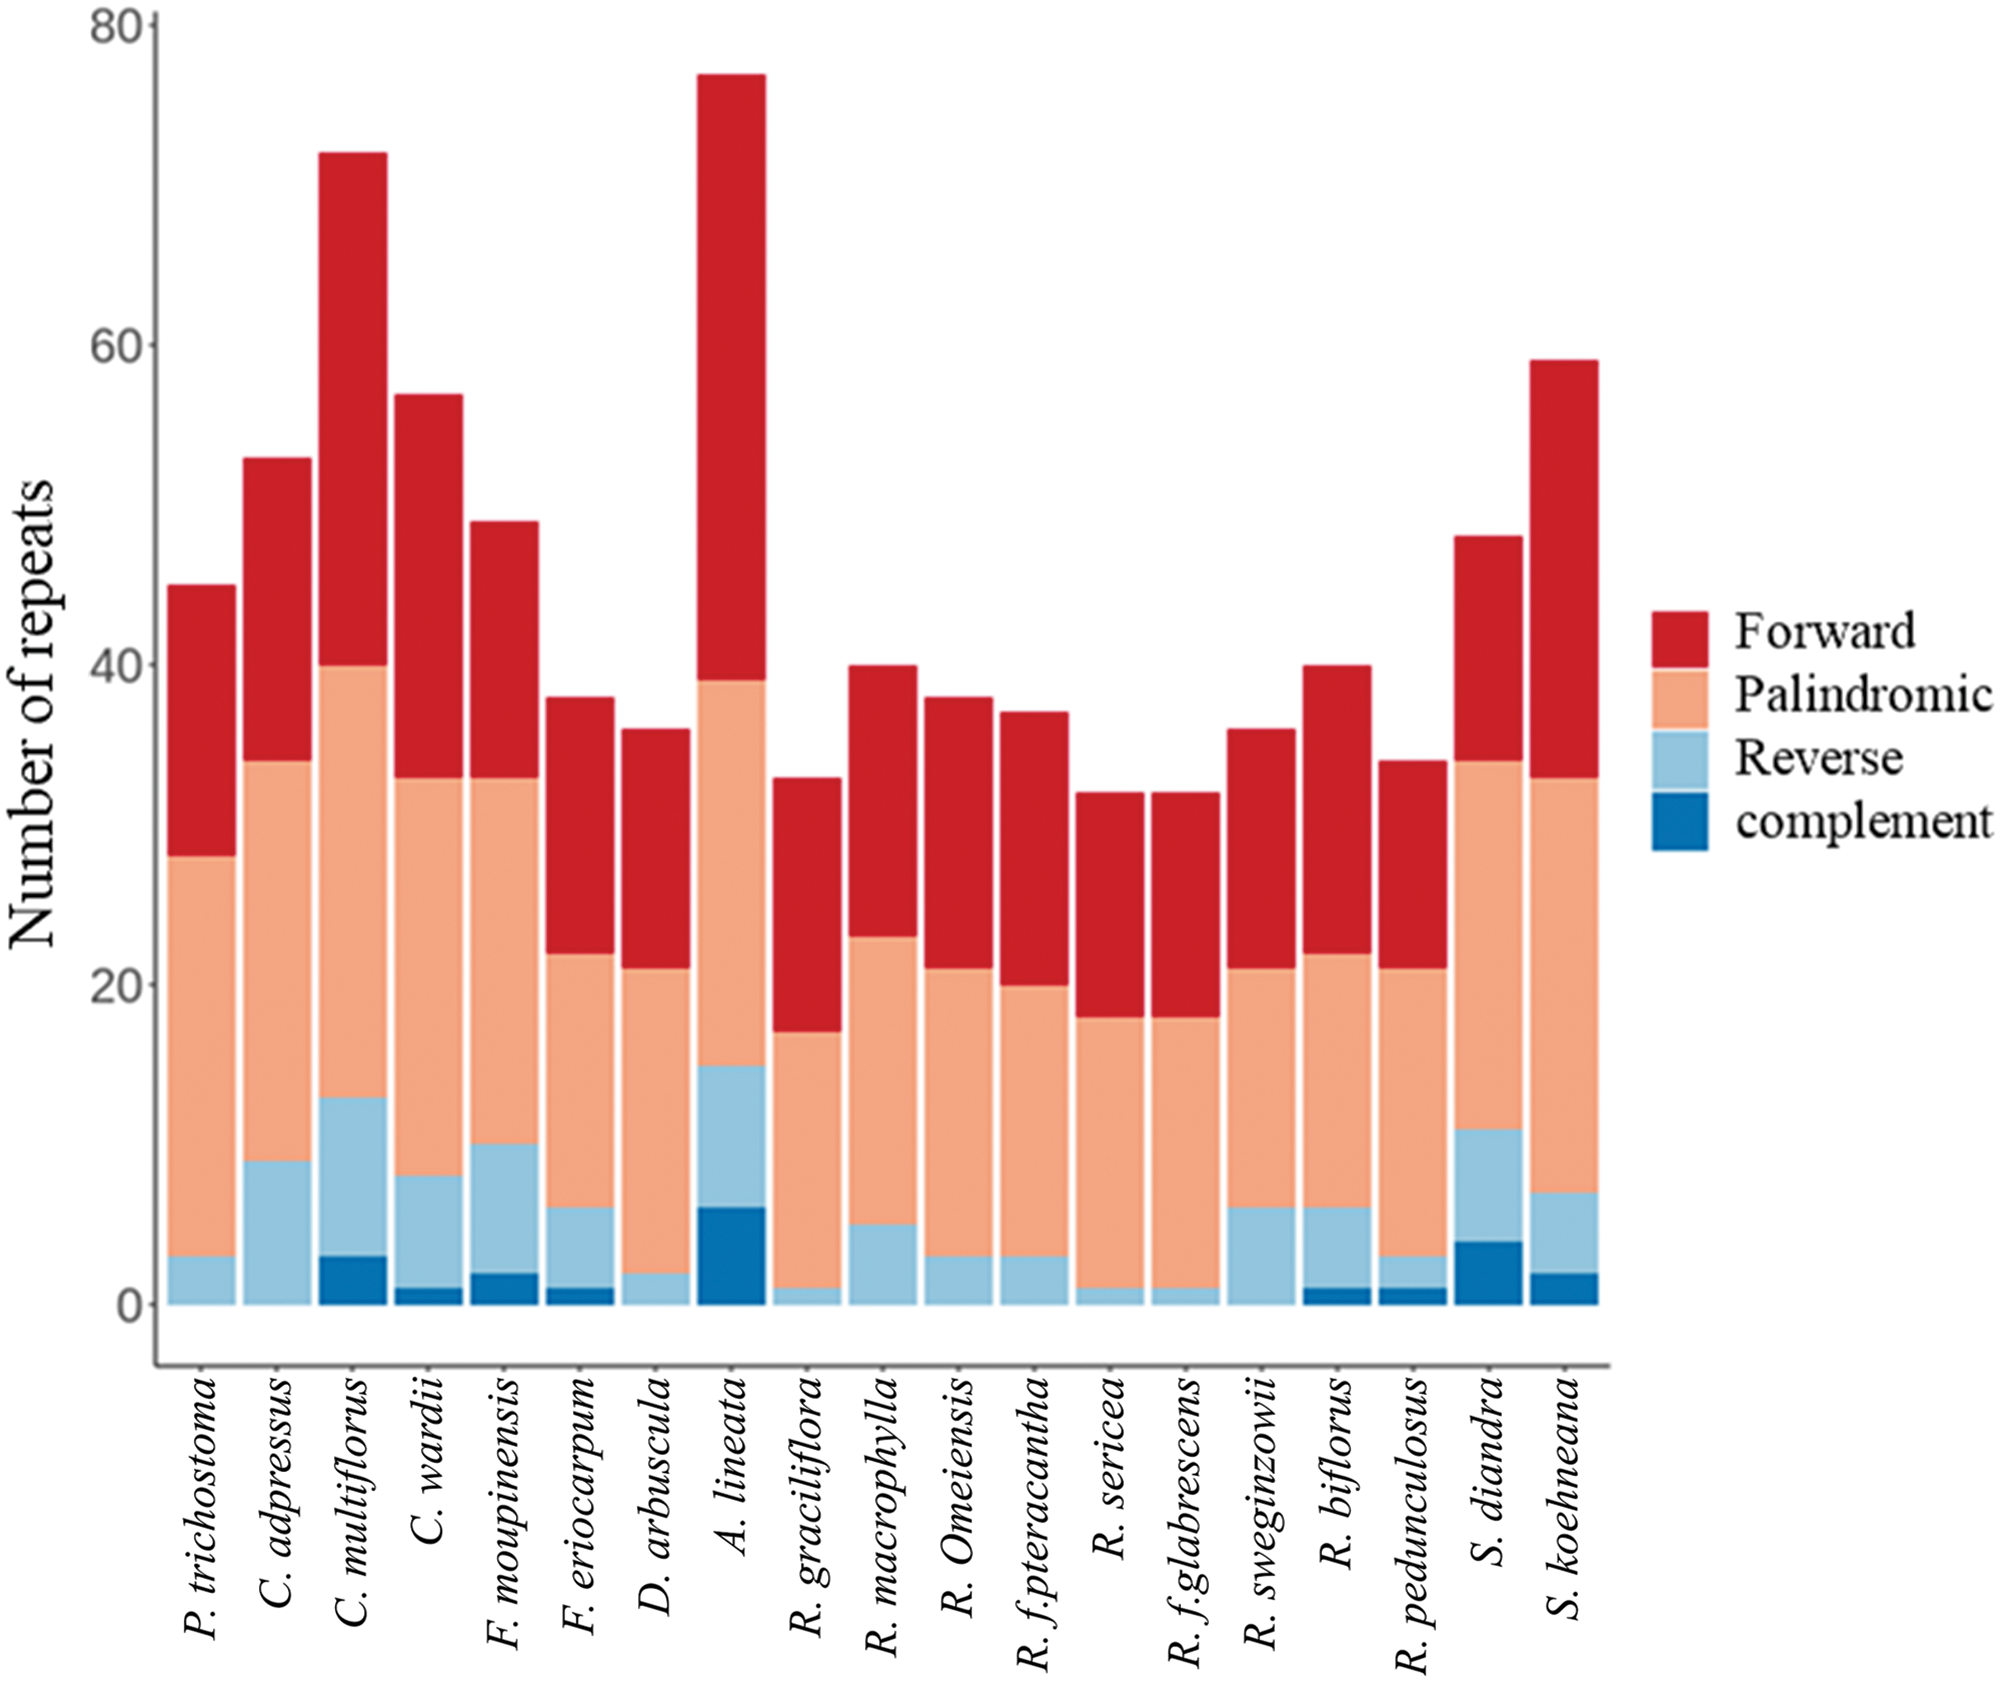
Figure 4: Analysis of cpLTRs in 19 Rosaceae cp genomes
This study offers a meticulous examination of the IR boundaries and adjacent genes within 19 species of the Rosaceae family. Despite the similar lengths of the IR regions across these species—spanning from 25,310 to 26,396 base pairs—variations in their expansion and contraction were noted. The study highlights the conservation of the SSC/IRa boundary, in stark contrast to the variability observed in the LSC/IRb, IRb/SSC, and IRa/LSC boundaries, with significant differences notably present at the LSC/IRb and IRb/SSC junctures. Particularly for P. trichostoma, an anomaly in the LSC/IRb boundary positioning between the rp122 and rps19 genes was identified, diverging from the consistent placement between the rps19 and rp12 genes seen in the other 18 species.
The positioning of the rps19 maintained consistency across seven Rosa species, precisely 11 bp from the LSC/IRb boundary. Conversely, in Cotoneaster and Sorbus species, the gene straddled the LSC/IRb boundary, with portions extending into both the LSC and IRb regions. Rubus species displayed the rps19 gene merely 7 bp away from the LSC/IRb boundary, indicating a variance among different genera. The rp12 gene resided entirely within the IRb region across all species examined.
The ndhF gene, situated in the SSC region, either crossed the IRb/SSC boundary or was positioned at various distances from it in 16 species across 8 genera, excluding Cotoneaster and Sorbus. The ycf1 gene consistently spanned the transition from the SSC to IRa regions in all species. Furthermore, the trnH gene crossed the IRa/LSC boundary in seven Rosa species, diverging in its precise location across different genera.
In terms of boundaries, variations were most prominently observed at the LSC/IRb (JLB) and IRb/SSC (JSB) boundaries. Among the species examined, those in the genera Cotoneaster and Sorbus showed the greatest similarity in their IR boundaries, with sizes and distances being remarkably consistent. Interestingly, A. lineata, F. eriocarpum, and D. arbuscula exhibited significant divergences in their boundary configurations, suggesting that these differences may have contributed to their evolutionary divergence from Potentilla (Fig. 5). These findings highlight the complexity and variability in the positioning of genes relative to the IR boundaries across the Rosaceae family, providing valuable insights into the evolutionary relationships and genetic diversity within this group.
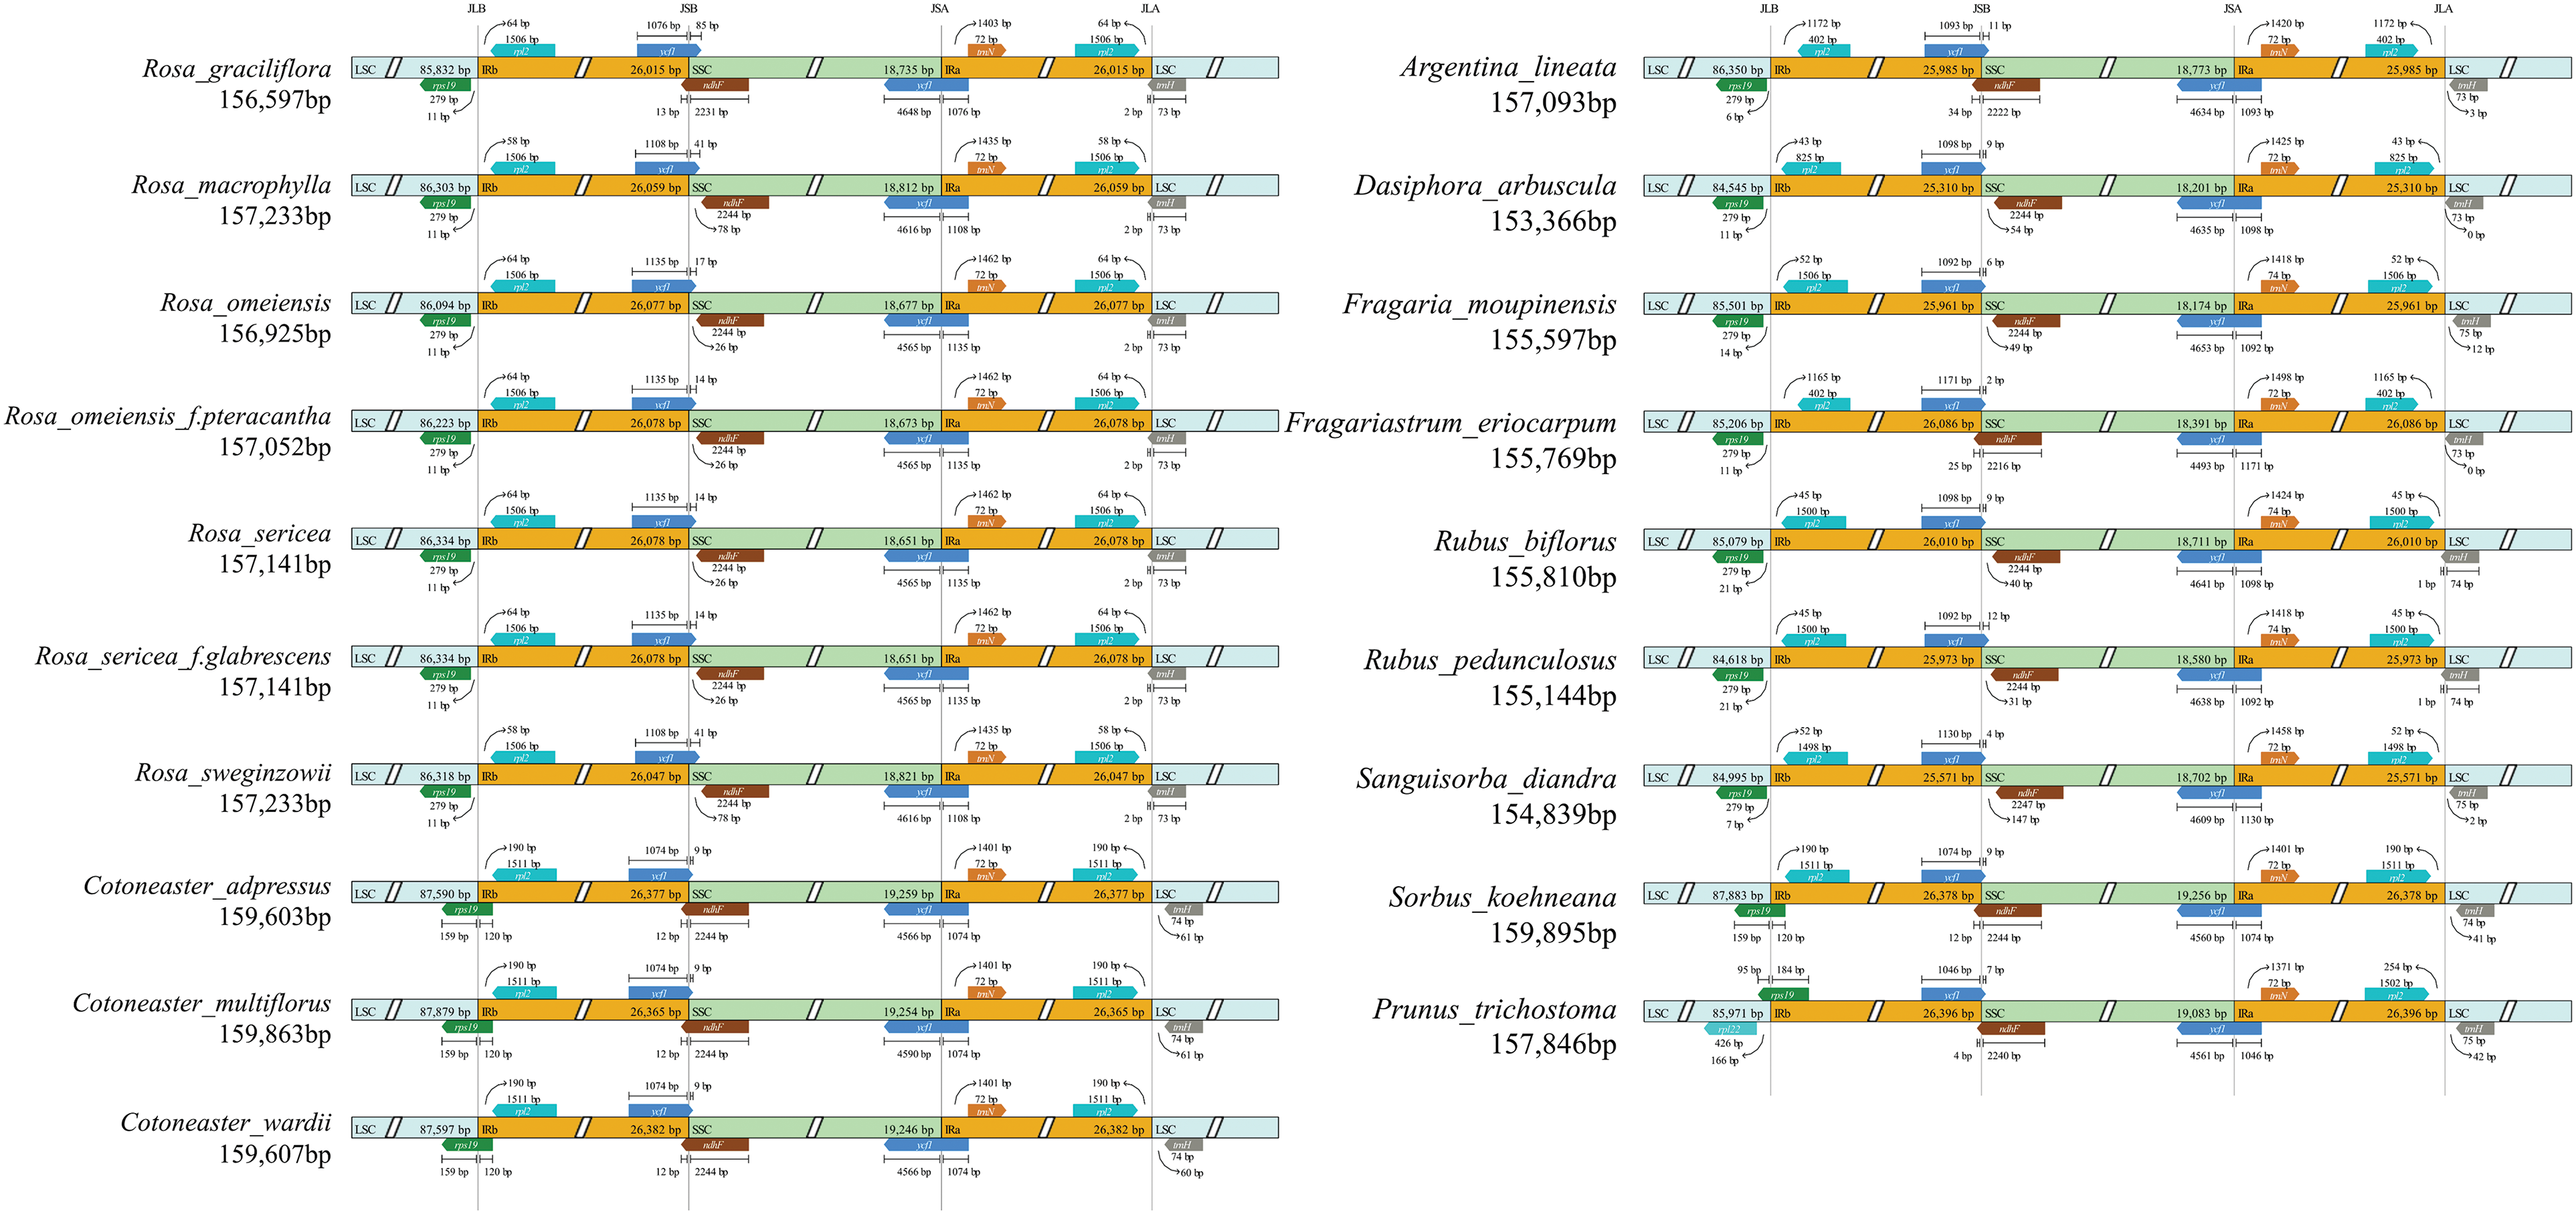
Figure 5: IR boundaries of 19 cp genomes. JLB, JSB, JSA, and JLA represent the four different junctions on the cp genome boundaries
3.5 Selection Pressure Analysis
The evolutionary rate of sequences is influenced by nucleotide substitutions and selective pressures. The Ka/Ks ratio is commonly used to measure whether PCGs are under selective pressure. Only 83 PCGs in the 19 cp genomes had Ka or Ks values (Fig. 6). Since Ka or Ks = 0, which indicates that these sequences were preserved without nonsynonymous or synonymous nucleotide alterations, the Ka/Ks values for the other PCGs cannot be computed. The Ka/Ks values ranged from 0.00 to 1.06, indicating purifying selective constraints acting on the chloroplast PCGs. Genes with a Ka/Ks value of 0 included at pH, orf188, petN, psaC, psbA, psbD, psbE, psbF, psbI, psbM, psbN, rpl36, rps12, rps7, and ycf15, indicating that they were under strong purifying selection. Genes with both Ka and Ks values of 0 included orf42, psaJ, psbL, rpl23, and ycf68. Only three genes, ycf2, psaI, and infA, had a Ka/Ks value greater than 0.5. Among the 83 genes, only infA had a Ka/Ks value greater than 1, indicating positive selection acting on this gene (Fig. 6).
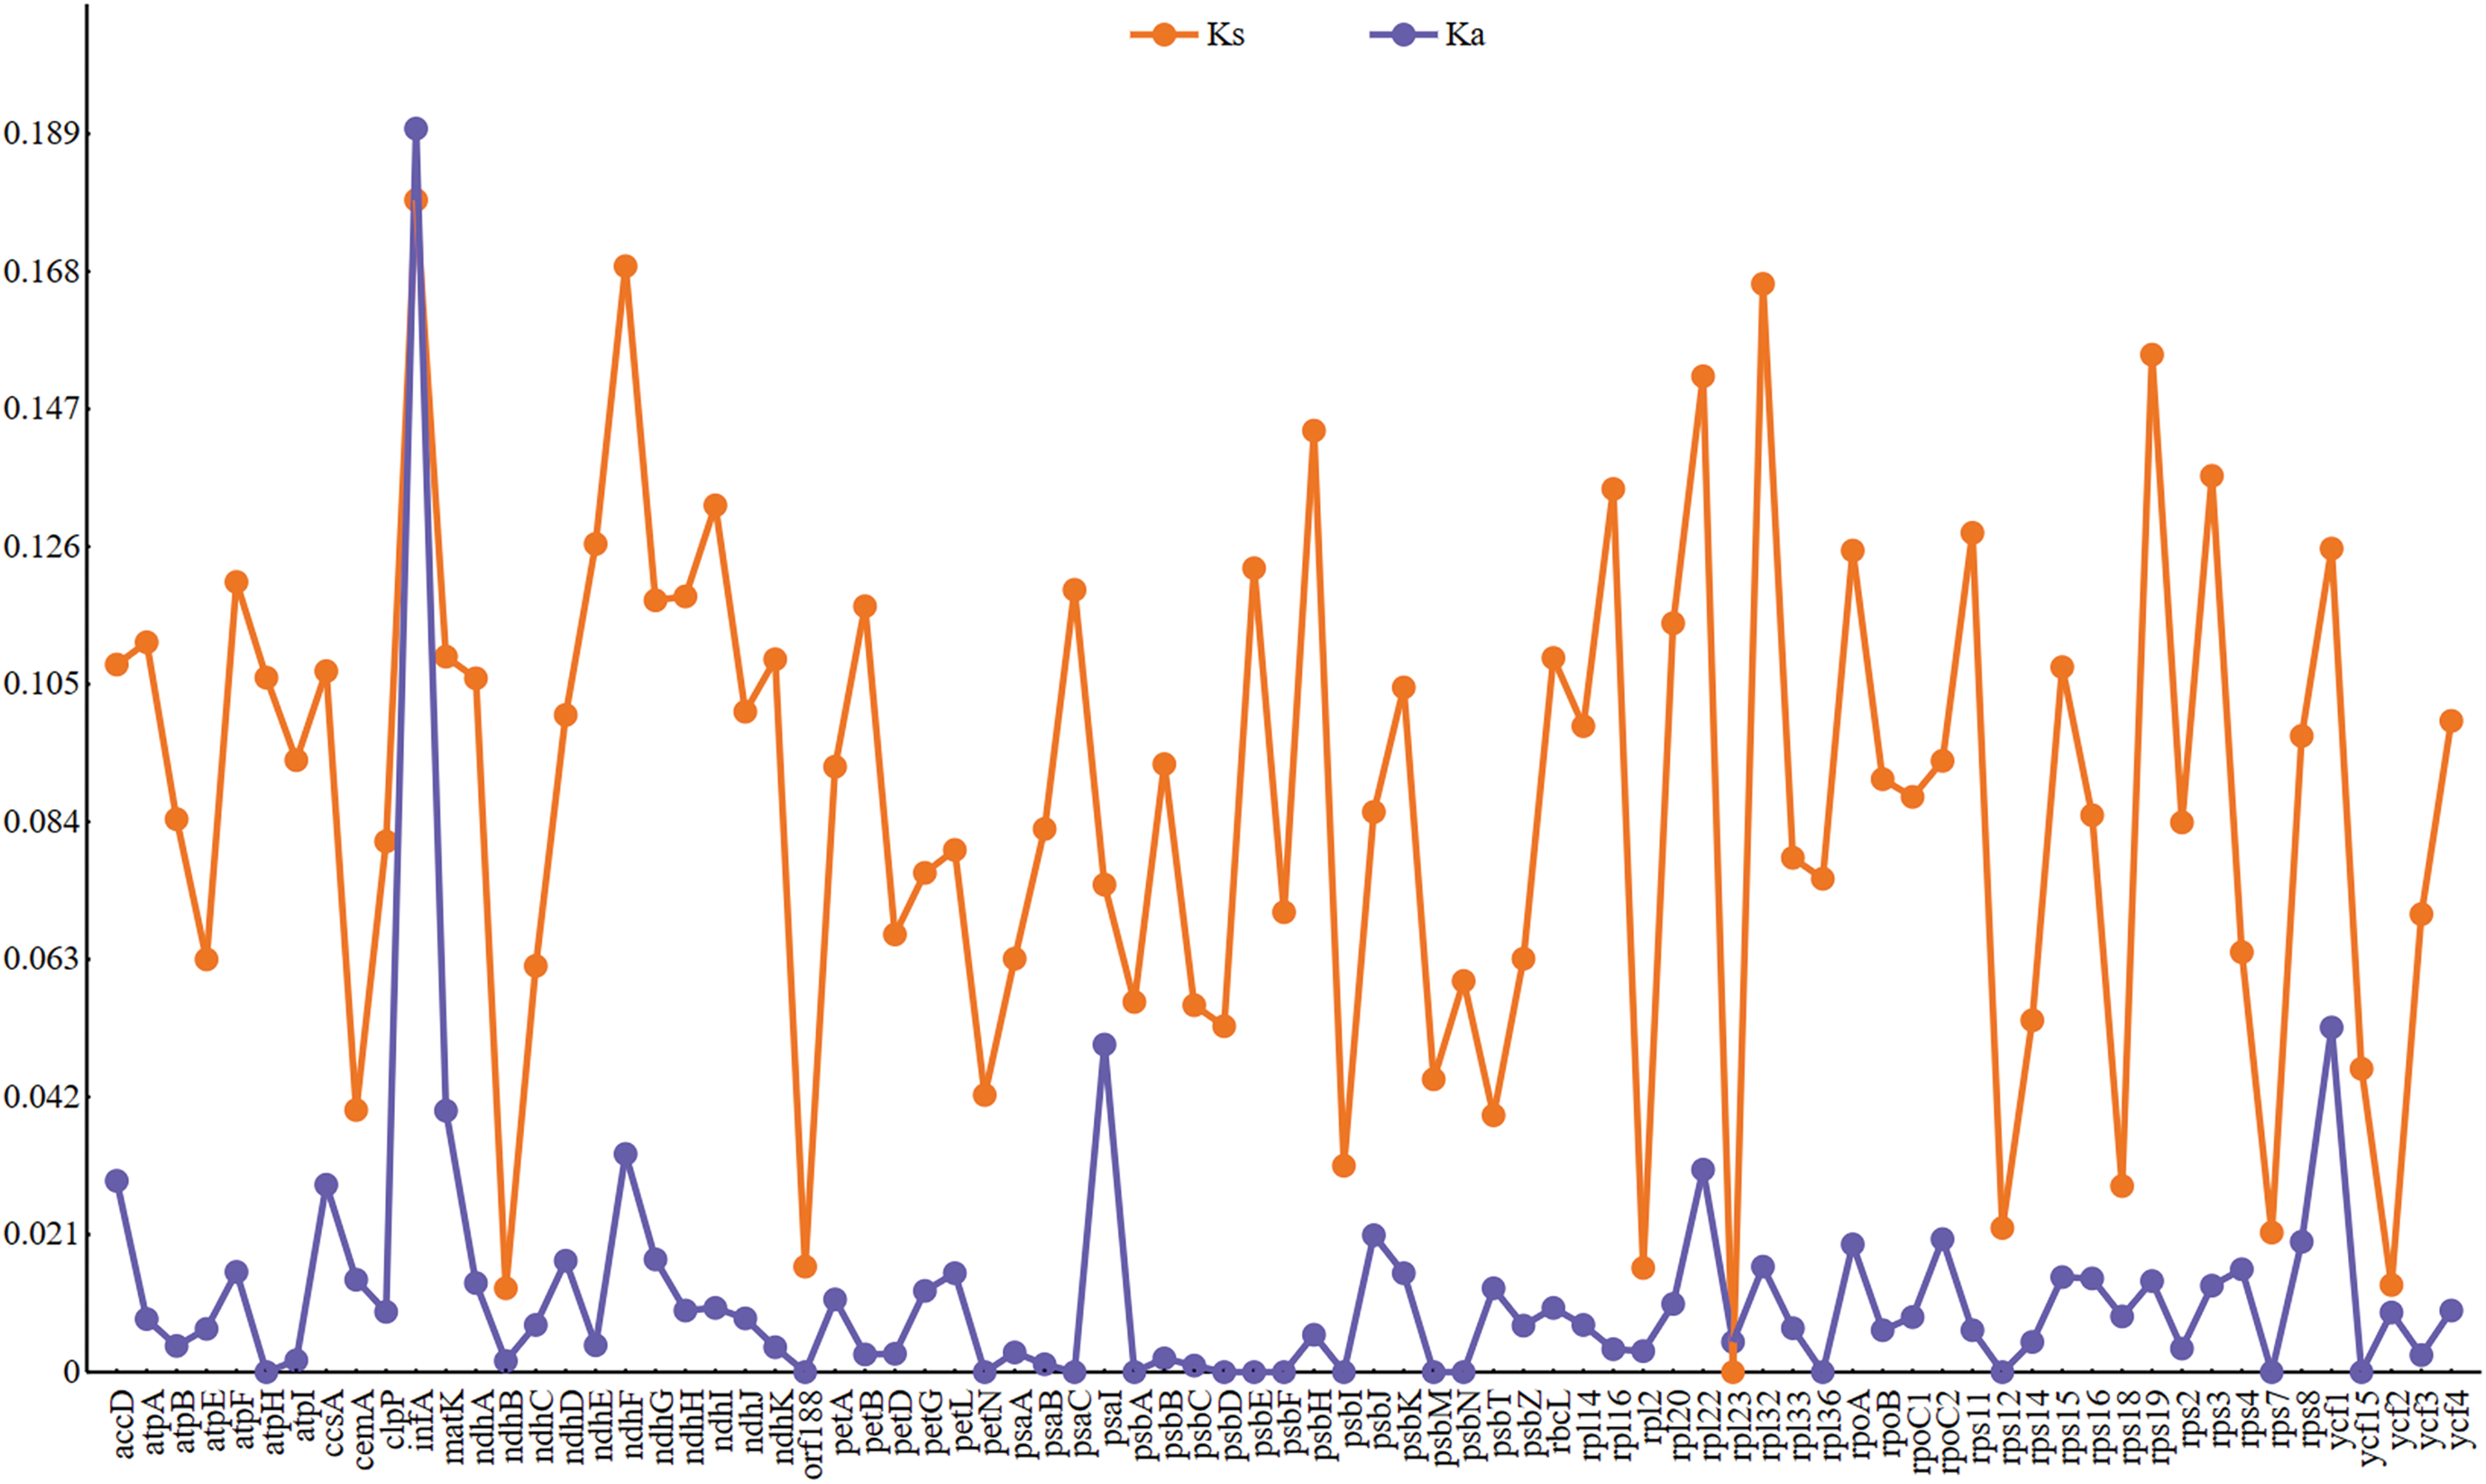
Figure 6: KaKs value of 83 PCGs in 19 cp genomes
Higher pi values indicate greater polymorphism and divergence hotspots. By using a sliding window approach to calculate nucleotide diversity (pi) values, the average nucleotide diversity (pi) values in the LSC, SSC, and IR regions of the 19 cp genomes ranged from 0.000 to 0.215 (Fig. 7), suggesting that these species may have undergone rapid nucleotide substitutions. Among them, the SSC region exhibited the highest pi value, indicating that the variation was concentrated in this area. The pi value of IR region was the lowest, which once again verified that IR region was more conservative than LSC and SSC region. A total of nine regions with higher pi values (pi > 0.13) were identified, including 36401–37000 (0.131), 61601–62200 (0.137), 55801–56400 (0.141), 12801–13400 (0.159), 129801–130400 (0.152), 130001–130600 (0.160), 130201–130800 (0.175), 56201–56800 (0.183), and 128801–129400 (0.215). Among them, five regions were in the LSC region, and 4 regions were in the SSC region (Fig. 7).
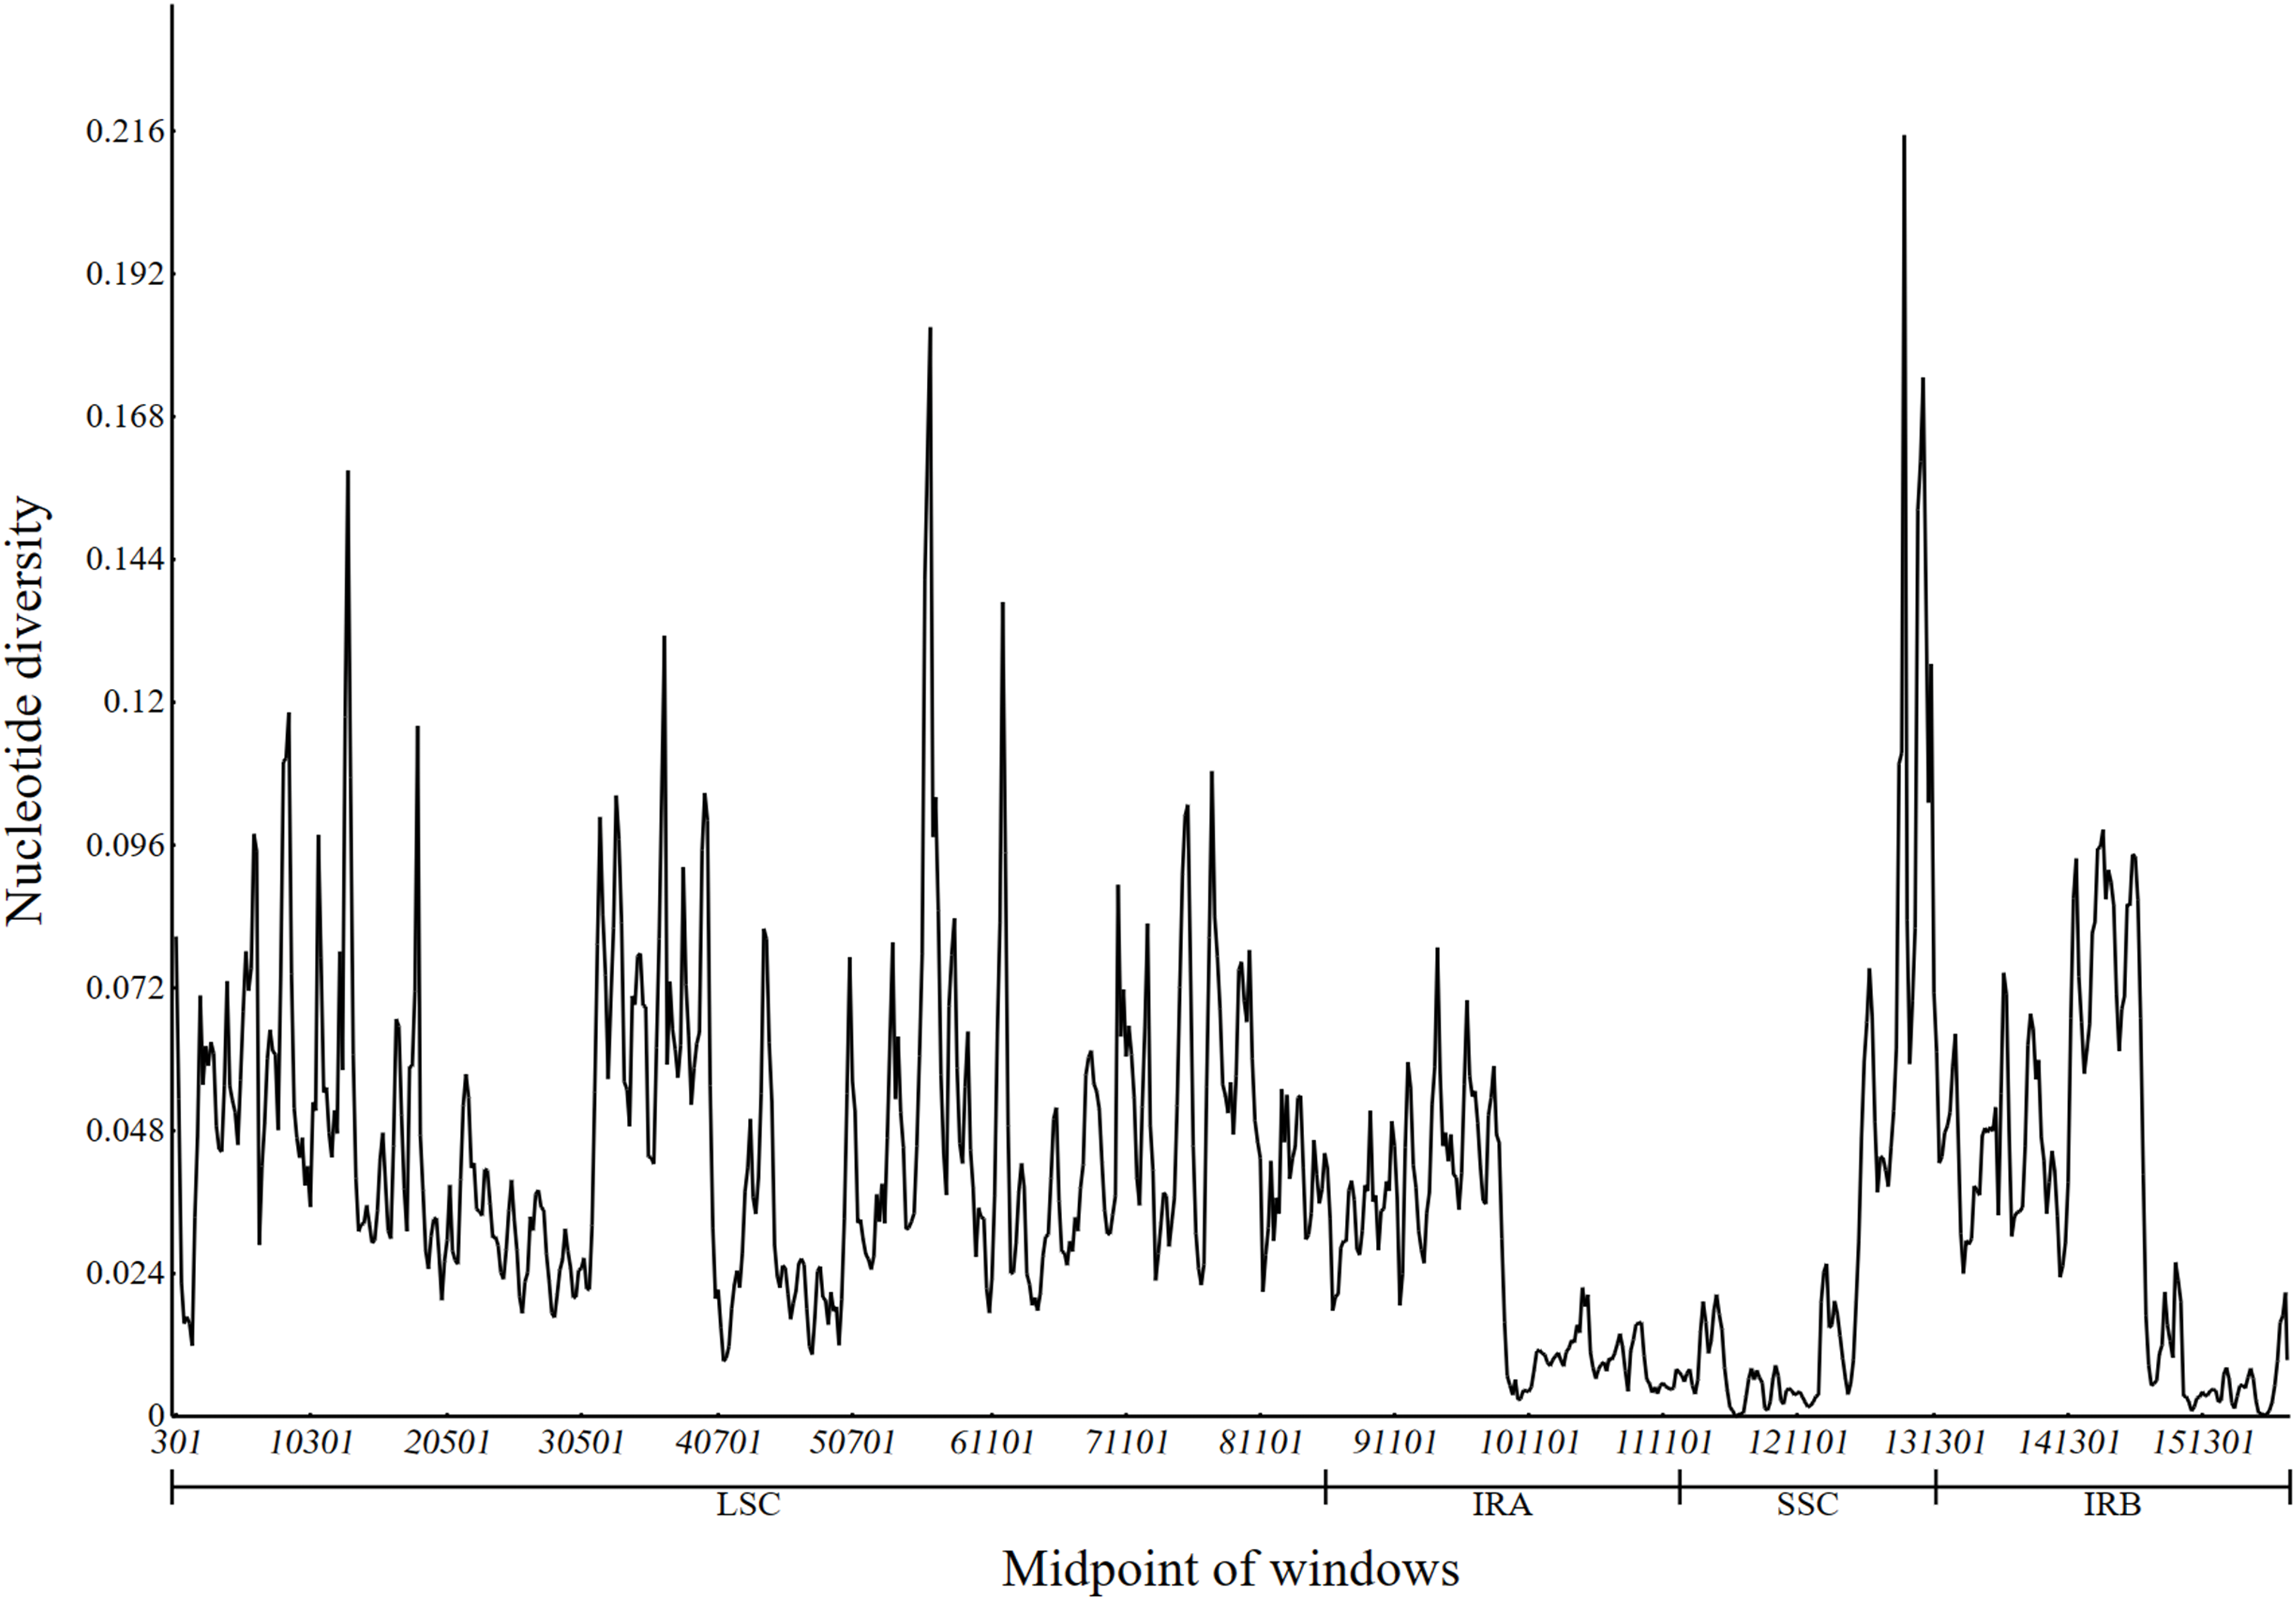
Figure 7: Nucleotide diversity of 19 cp genomes
Using the complete cp genomes of 19 Rosaceae species obtained in this study and 110 Rosaceae species downloaded from the NCBI website, the ML and BI phylogenetic trees were constructed using the Phylosuite software. The ML and BI trees have exactly the same topological structure, and the bootstarp value of most branch nodes was greater than 75 and the posterior probability was greater than 0.997, indicating that the phylogenetic relationship was reliable. The 129 species of the Rosaceae family can be divided into 8 branches, namely Clade I to Clade VIII. Clades I to III belong to Prunus L., Sorbus L., and Cotoneaster Medik., respectively, all of which are part of the Amygdaloideae subfamily. Prunus L falls within the Amygdaleae tribe, whereas Clades II and III are grouped into the Maleae tribe, forming a cohesive monophyletic cluster. These clades, representing the Maleae, stand as sister groups. Moving to Clades IV through VIII, they comprise Rubus L., Sanguissorba L., Rosa L., Argentina L., Fragariastrum L., Dasiphora L., and Fragaria L., all under the Rosoideae subfamily. Within Clade IV, Rubus L. is categorized under the tribe Rubeae and bifurcates into two branches, each supported by a 100% bootstrap value. Clade IV and Clades V to VIII share a sister group relationship. Clade V is uniquely defined by a monophyletic lineage of Sanguissorba. Clade VI features Rosa L. of the Roseae tribe, with its internal nodes primarily exceeding an 89% bootstrap value, barring one at 69%. Clades VII and VIII, belonging to the Potentilleae tribe, include Argentina L., Fragariastrum L., Dasiphora L., and Fragaria L., with Clade VI being a sister group to these clades (Fig. 8).
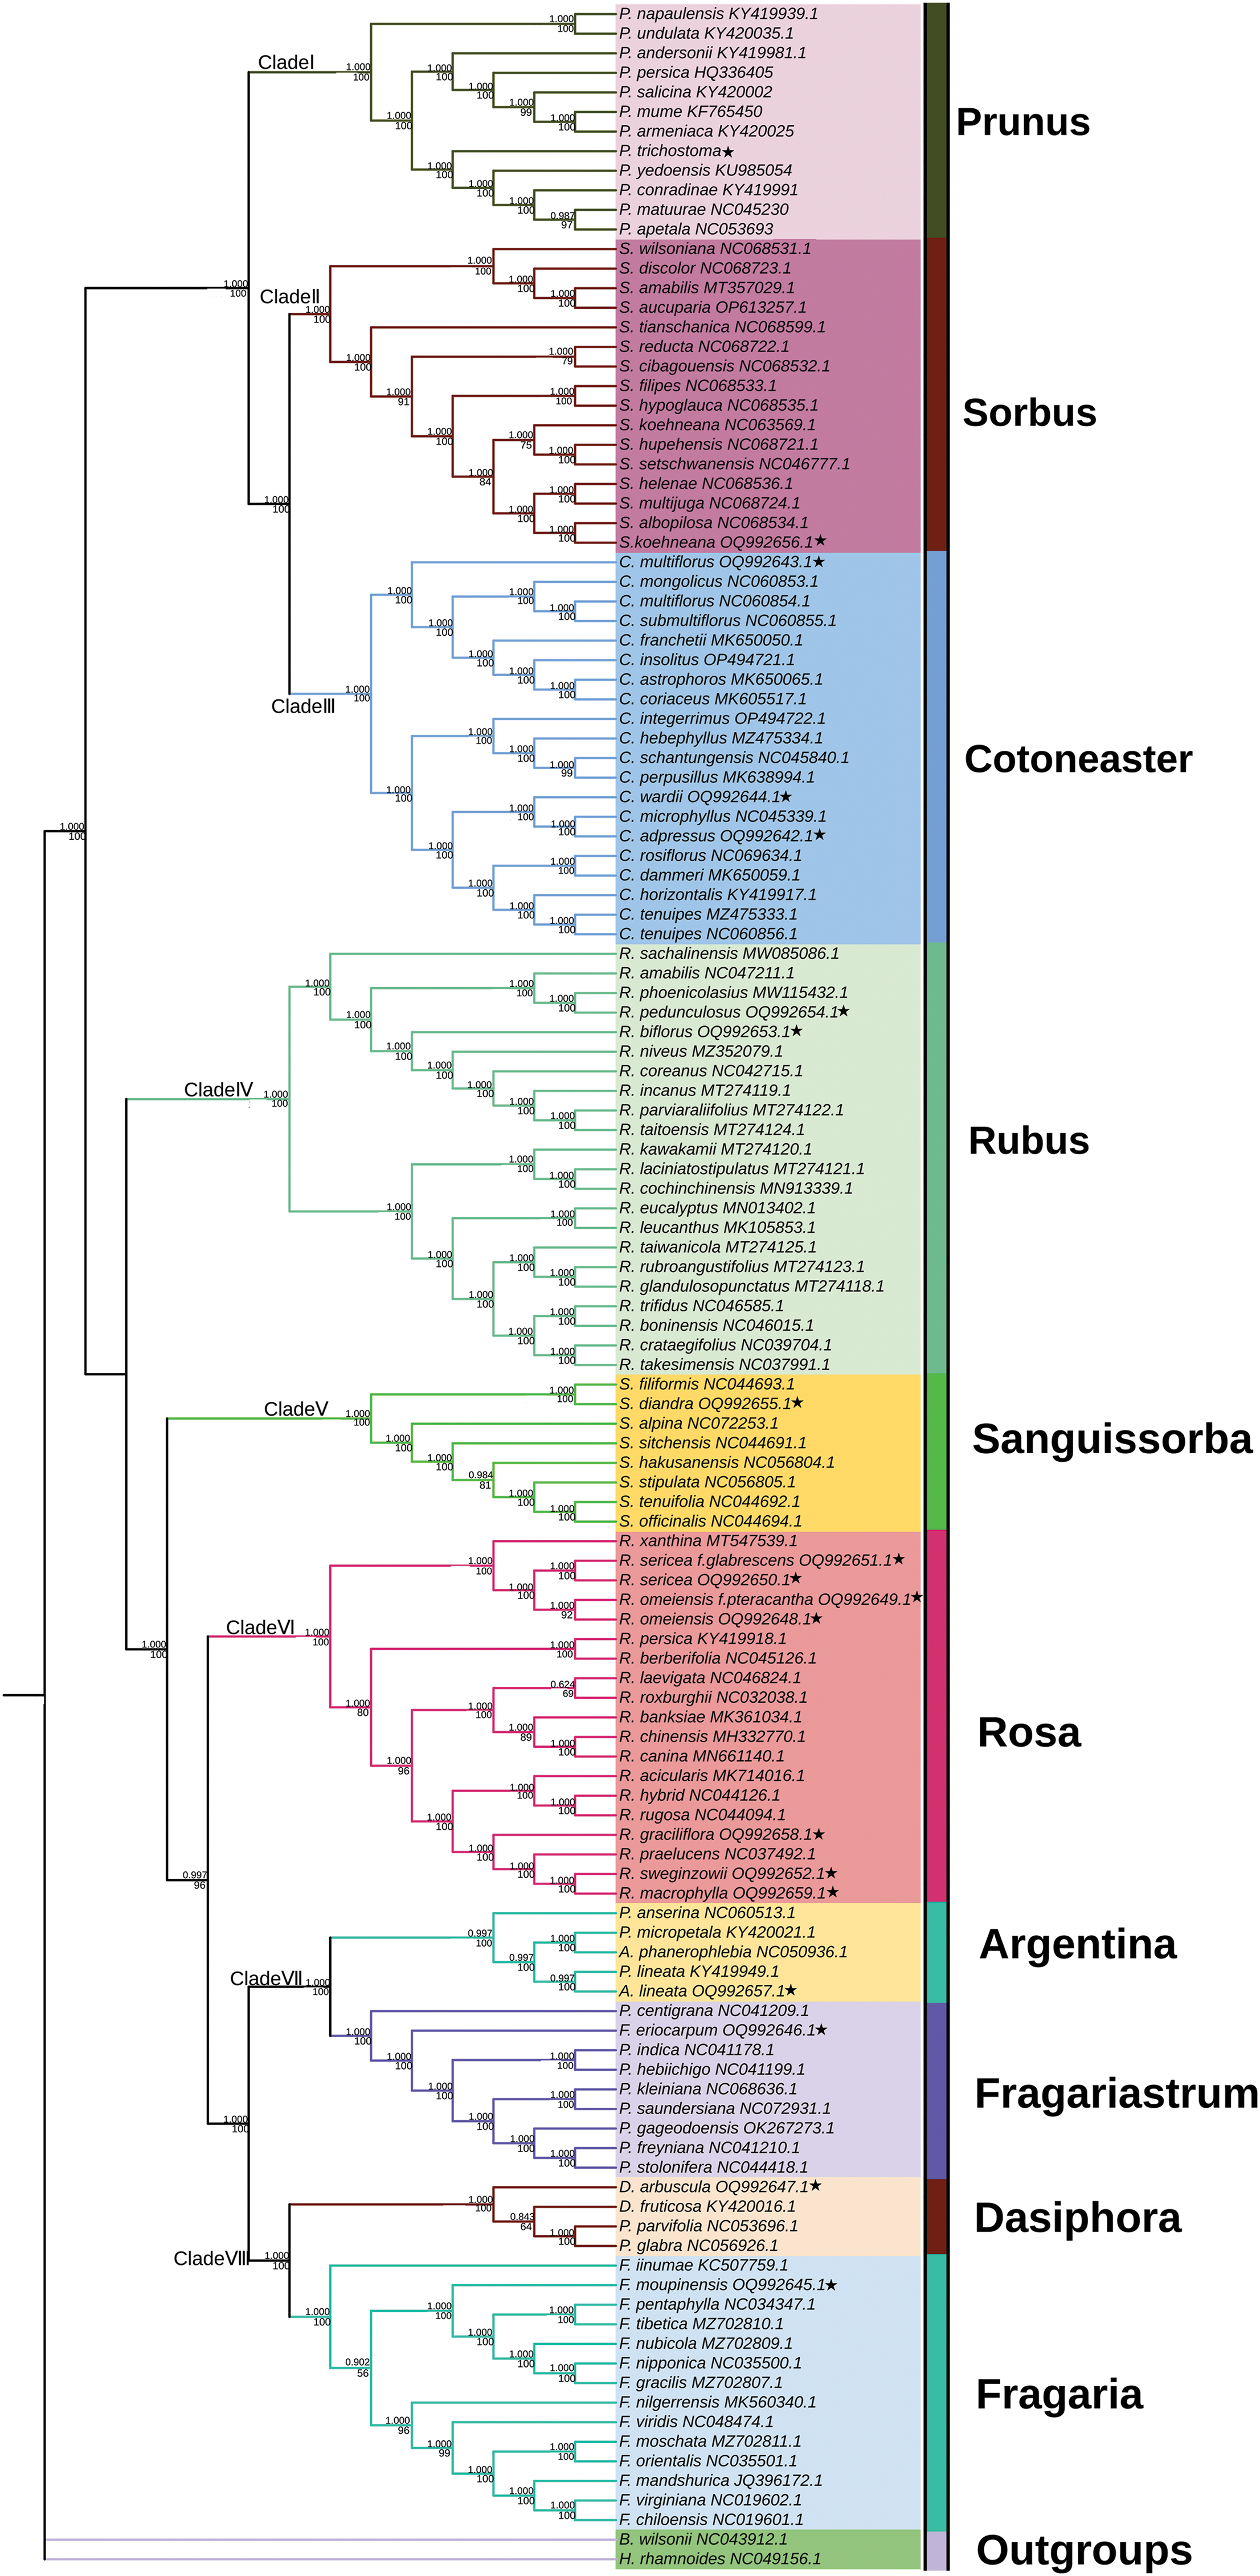
Figure 8: The ML and BI phylogenetic trees based on the complete cp genomes of 129 Rosaceae species. The ★ symbol represented the 19 cp genomes sequenced in this study
4.1 Characterization of the Cp Genomes
This study sequenced and compared the complete cp genomes of 19 Rosaceae species from Tibet. The results indicated that the 19 cp genomes exhibited a conserved gene order and gene content, and displayed a typical quadripartite structure (LSC, SSC, IRa, and IRb). These cp genomes are similar in size, structure, and gene content to previously published Rosaceae cp genomes [50–52].
The cpSSRs are characterized by maternal inheritance, abundant polymorphism, and good reproducibility in plants, as a result, they are frequently employed as molecular markers for species identification, and population genetics research [53–55]. The distribution of SSRs in the cp genomes of plants is uneven. The number of detected SSR loci in the 19 Rosaceae species ranged from 52–121, with the largest number of single nucleotide repeats. Among them, 46–96 SSRs were distributed in the LSC region, 5–12 SSRs in the SSC region, and 0–15 SSRs in the IR region, while the IR region of D. fruticosa lacked SSR distribution. In line with earlier research, there were much more SSRs in the LSC region than in the SSC and IR regions [56]. Long repetitive sequences may accelerate cp genome rearrangements and increase population genetic diversity [56]. A total of 32–77 long repetitive sequences were identified in all 19 species, including three types, i.e., forward (F), palindrome (P), and reverse (R).
Plants exhibit a preference for synonymous codon usage [57]. Codon usage bias is the result of long-term evolution and adaptation to the environment [58], and therefore is related to phylogenetic relationships [53]. The 19 Rosaceae plants’ cp genomes exhibit comparable overall codon use patterns and a propensity for A/U-end synonymous codons. The frequent A/T traits seen in the cp genomes of angiosperms are consistent with this [59,60].
Genes containing a single intron are widely present in organisms. The infA gene is a gene with a single intron. However, among the 19 species studied, the infA gene was only found in the cp genome of R. pedunculosus. The infA gene is unstable and is easily lost from the cp genome of angiosperms and transferred to the nucleus [61]. Similarly, the atpF gene is also a gene with a single intron, and it is only found in C. adpressus, C. multiflorus, C. wardii, S. koehneana, and P. trichostoma. The complete atpF gene has been discovered in some cp genomes of the Amygdaloideae subfamily, while the loss of the atpF gene has also been observed in some genera of the Rosaceae [62]. The loss of the atpF gene was widespread in the 19 cp genomes of Rosaceae family.
The cp genome may be utilized to research phylogenetic categorization and genome evolution among plant lineages since variations in the IR region’s size are frequently caused by these changes [63]. The length of IR region and LSC region was similar in most of the 19 species. However, three species in the genus Cotoneaster, as well as S. koehneana, have significantly longer IR and LSC regions than species in other genera. Additionally, these four species all possess the atpF gene, while the atpF gene is missing in six of the remaining seven genera. The loss of the atpF gene is one of the reasons for the differences in the sizes of the IR and LSC regions in the cp genomes of Rosaceae species.
The IRb/SSC (JSB) boundary in these 19 cp genomes is positioned between the ycf1 and ndhF genes, and it is consistently spanned by the ycf1 gene. However, the distance between the ndhF gene and the JSB boundary varies. For example, among the seven species of Rosa, ndhF gene is located less than 100 bp away from this boundary in six species, while in the three species of Cotoneaster, ndhF gene spans across the boundary by 12 bp. In the two species of Rubus, the ndhF gene is approximately 30 bp away from the boundary. The results above indicate that ndhF exhibits strong genus-specific characteristics and may be used to determine the correct classification of genera within the Rosaceae family.
Nine areas (pi > 0.13) with high values were identified in 19 different species. Four of them were in the SSC region and five of them were in the LSC region. As further evidence of the IR region’s greater conservation than the LSC and SSC regions, the SCS region had the greatest pi value and the IR region the lowest. The nucleotide diversity of the IR area did not contain any substantially divergent sequences, suggesting that these regions are largely conserved [64].
A common method for assessing nucleotide evolutionary rates and selection pressure locations in coding sequences is the ratio of dN/dS [65]. Due to the fact that infA is the sole gene that has experienced positive selection, as shown by a Ka/Ks value more than 1.
According to years of morphological and molecular research, the Rosaceae family can be divided into three subfamilies, namely the redefined Rosoideae, expanded Amygdaloideae, and the newly separated Dryadoideae which was formerly a part of Spiraeoideae. However, the relationships between these three subfamilies are still uncertain. Studies suggested that Dryadoideae could most likely be placed at the base of the entire Rosaceae family, or serve as the sister group of Rosoideae or Amygdaloideae [8]. Within the framework of these three subfamilies, a new system for Rosaceae family was proposed by Potter et al. [7]. In 2016, Xiang et al. [8] had further refined the classification within the Rosaceae family under the Potter system, positioning the Roseae at the forefront of the Rosoideae subfamily’s divergence, subsequently followed by the Agrimonieae. Contrary to this arrangement, the present study had proposed an alternative order. Notably, the Potter system did not delineate the Agrimonieae as a separate entity.
Prunus trichostoma belongs to the Amygdaleae tribe of Prunus genus. There have been two ways to classify Amygdaleae tribe. One is only composed of the “Genus Prunus sensu lato”, which is further divided into sub. Genus, including subg. Prunus, subg. Amygdalus, subg. Cerasus, subg. Padus, and subg. Laurocerasus. However, it is not yet clear whether Maddenia and Pygeum belong to the “Genus Prunus sensu lato”. The other way is to divide “Genus Prunus sensu lato” into smaller genera that make up the Amygdaleae tribe. The previously popular Rydberg system follows the former way. Due to technological limitations, early molecular studies usually constructed phylogenetic relationships based on a single sequence. Except that the subgenus in the Rydberg system were not monophyletic groups, and Maddenia and Pygeum were also embedded within “Genus Prunus sensu lato”, making it difficult to differentiate the various evolutionary lineages. In addition, the inconsistencies between phylogenetic trees constructed from cp and nuclear genomes have led taxonomists to prefer to maintain a “Genus Prunus sensu lato”, so that the Amygdaleae tribe has only one genus and no sub. Genus. Some researchers separate Cerasus as a genus [66]. However, APG Ⅳ systems maintain the concept of “Genus Prunus sensu lato” in the end, which is consistent with our analysis based on ML and BI trees. Besides, it is appropriate to include P. trichostoma in the “Genus Prunus sensu lato”.
The taxonomic status of Argentina Hill, Dasiphora Raf., and Fragariastrum Heist. ex Fabr. has long been a subject of debate. Initially classified within the genus Potentilla, they were later separated to form independent genera [67–69]. The species of Fragariastrum, Dasiphora, and Argentina clustered together, aligning with the taxonomic relationship in the APG IV system. A. lineata and F. eriocarpum formed Clade VII, while Dasiphora and Fragaria formed Clade VIII, indicating a closer relationship between Fragariastrum and Argentina. Therefore, the genera Argentina, Fragariastrum, and Dasiphora should be separated from Potentilla.
The investigation encompassed 19 species within the Rosaceae family. Hence, to deepen our comprehension of the phylogenetic interrelations within this family, it is imperative to extend the research to a broader array of species.
These results expand researchers’ understanding of the diversity and evolutionary relationships in the Rosaceae family. In summary, this study provides abundant resources for the study of cp genomes in Rosaceae family, and has reference value for evolutionary research and species identification within the family.
Acknowledgement: None.
Funding Statement: This research was funded by the Jiangxi Provincial Natural Science Foundation, Grant Number 20232BAB216119.
Author Contributions: Riwa Mahai analyzed the data and wrote the manuscript. Rongpeng Liu helped to analyze the data. Xiaolang Du and Zejing Mu collected the samples. Jun Yuan and Xiaoyun Wang revised the manuscript. Jun Yuan and Zejing Mu designed the research study. All authors reviewed the results and approved the final version of the manuscript.
Availability of Data and Materials: The first author can provide the datasets used and/or analyzed during the current investigation upon reasonable request. You may get the raw data for the plastomes sequencing by visiting the following website: https://www.ncbi.nlm.nih.gov/.
Ethics Approval: Not applicable.
Conflicts of Interest: The authors declare that they have no conflicts of interest to report regarding the present study.
Supplementary Materials: The supplementary material is available online at https://doi.org/10.32604/phyton.2024.051559.
References
1. Zhang SD, Jin JJ, Chen SY, Chase MW, Soltis DE, Li HT, et al. Diversification of Rosaceae since the Late Cretaceous based on plastid phylogenomics. New Phytol. 2017;214(3):1355–67. doi:10.1111/nph.2017.214.issue-3. [Google Scholar] [CrossRef]
2. Zou DT, Wang QG, Luo A, Wang ZH. Species richness patterns and resource plant conservation assessments of Rosaceae in China. China: China J Plant Ecol. 2019;431:1–15 (In Chinese). [Google Scholar]
3. Du Z, Lu K, Zhang K, He Y, Wang H, Chai G, et al. The chloroplast genome of Amygdalus L. (Rosaceae) reveals the phylogenetic relationship and divergence time. BMC Genomics. 2021;22:645. doi:10.1186/s12864-021-07968-6. [Google Scholar] [PubMed] [CrossRef]
4. Anderson WR. An integrated system of classification of flowering plants. Brittonia. 1982;34:268–70. doi:10.2307/2806386. [Google Scholar] [CrossRef]
5. Hutchinson J. The genera of flowering plants. Oxford: Clarendon Press; 1964. [Google Scholar]
6. Schulze-Menz GK. Rosaceae. In: Melchior H, editor. Engler’s Syllabus der PflanzenfamilienII. Berlin: Gebrüder Borntraeger; 1964. p. 209–18. [Google Scholar]
7. Potter D, Eriksson T, Evans RC, Oh S, Smedmark JEE, Morgan DR, et al. Phylogeny and classification of Rosaceae. Plant Syst Evol. 2007;266:5–43. doi:10.1007/s00606-007-0539-9. [Google Scholar] [CrossRef]
8. Xiang Y, Huang CH, Hu Y, Wen J, Li S, Yi T, et al. Evolution of Rosaceae fruit types based on nuclear phylogeny in the context of geological times and genome duplication. Mol Biol Evol. 2017;34(2):262–81. [Google Scholar] [PubMed]
9. Meng Q, Manghwar H, Hu W. Study on supergenus Rubus L.: edible, medicinal, and phylogenetic characterization. Plants. 2022;11(9):1211. doi:10.3390/plants11091211. [Google Scholar] [PubMed] [CrossRef]
10. Kaume L, Howard LR, Devareddy L. The blackberry fruit: a review on its composition and chemistry, metabolism and bioavailability, and health benefits. J Agric Food Chem. 2012;60(23):5716–27. doi:10.1021/jf203318p. [Google Scholar] [PubMed] [CrossRef]
11. Kalkman C. The phylogeny of the Rosaceae. Bot J Linn Soc. 1988;98:37–59. doi:10.1111/boj.1988.98.issue-1. [Google Scholar] [CrossRef]
12. Gu Y, Sun ZJ, Cai JH, Huang YS, He SA. Introduction and utilization of small fruits in China, with special refercence to Rubus species. ISHS Acta Hortic. 1989;262:47–56. [Google Scholar]
13. Carter KA, Liston A, Bassil NV, Alice LA, Bushakra JM, Sutherland BL, et al. Target capture sequencing unravels Rubus evolution. Front Plant Sci. 2019;10:1615. doi:10.3389/fpls.2019.01615. [Google Scholar] [PubMed] [CrossRef]
14. Wang Y, Chen Q, Chen T, Tang H, Liu L, Wang X. Phylogenetic insights into Chinese Rubus (Rosaceae) from multiple chloroplast and nuclear DNAs. Front Plant Sci. 2016;7:968. [Google Scholar] [PubMed]
15. Jian HY, Zhang YH, Yan HJ, Qiu XQ, Wang QG, Li SB, et al. The complete chloroplast genome of a key ancestor of modern roses, Rosa chinensis var. spontanea, and a comparison with congeneric species. Molecules. 2018;23(2):389. doi:10.3390/molecules23020389. [Google Scholar] [PubMed] [CrossRef]
16. Mileva M, Ilieva Y, Jovtchev G, Gateva S, Zaharieva MM, Georgieva A, et al. Rose flowers—a delicate perfume or a natural healer? Biomolecules. 2021;11(1):127. doi:10.3390/biom11010127. [Google Scholar] [PubMed] [CrossRef]
17. Tomczyk M, Latté KP. Potentilla—a review of its phytochemical and pharmacological profile. J Ethnopharmacol. 2009;122(2):184–204. doi:10.1016/j.jep.2008.12.022. [Google Scholar] [PubMed] [CrossRef]
18. Tomczyk M, Paduch R, Wiater A, Pleszczyńska M, Kandefer-Szerszeń M, Szczodrak J. The influence of aqueous extracts of selected Potentilla species on normal human colon cells. Acta Pol Pharm. 2013;70(3):523–31. [Google Scholar] [PubMed]
19. Zhang SD, Ling LZ. Molecular structure and phylogenetic analyses of the plastomes of eight Sorbus sensu stricto species. Biomolecules. 2022;12(11):1648. doi:10.3390/biom12111648. [Google Scholar] [PubMed] [CrossRef]
20. Zhu A, Guo W, Gupta S, Fan W, Mower JP. Evolutionary dynamics of the plastid inverted repeat: the effects of expansion, contraction, and loss on substitution rates. New Phytol. 2016;209(4):1747–56. doi:10.1111/nph.2016.209.issue-4. [Google Scholar] [CrossRef]
21. Ye WQ, Yap ZY, Li P, Comes HP, Qiu YX. Plastome organization, genome-based phylogeny and evolution of plastid genes in Podophylloideae (Berberidaceae). Mol Phylogenet Evol. 2018;127:978–87. doi:10.1016/j.ympev.2018.07.001. [Google Scholar] [PubMed] [CrossRef]
22. Li E, Liu K, Deng R, Gao Y, Liu X, Dong W, et al. Insights into the phylogeny and chloroplast genome evolution of Eriocaulon (Eriocaulaceae). BMC Plant Biol. 2023;23:32. doi:10.1186/s12870-023-04034-z. [Google Scholar] [PubMed] [CrossRef]
23. Dong W, Li E, Liu Y, Xu C, Wang Y, Liu K, et al. Phylogenomic approaches untangle early divergences and complex diversifications of the olive plant family. BMC Biol. 2022;20(1):92. doi:10.1186/s12915-022-01297-0. [Google Scholar] [PubMed] [CrossRef]
24. Guo C, Liu K, Li E, Chen Y, He J, Li W, et al. Maternal donor and genetic variation of Lagerstroemia indica cultivars. Int J Mol Sci. 2023;24(4):3606. doi:10.3390/ijms24043606. [Google Scholar] [PubMed] [CrossRef]
25. Sun J, Wang Y, Qiao P, Zhang L, Li E, Dong W, et al. Pueraria montana population structure and genetic diversity based on chloroplast genome data. Plants. 2023;12(12):2231. doi:10.3390/plants12122231. [Google Scholar] [PubMed] [CrossRef]
26. Abdullah, Mehmood F, Rahim A, Heidari P, Ahmed I, Poczai P. Comparative plastome analysis of Blumea, with implications for genome evolution and phylogeny of Asteroideae. Ecol Evol. 2021;11(12):7810–26. doi:10.1002/ece3.v11.12. [Google Scholar] [CrossRef]
27. Henriquez CL, Abdullah, Ahmed I, Carlsen MM, Zuluaga A, Croat TB, et al. Molecular evolution of chloroplast genomes in Monsteroideae (Araceae). Planta. 2020;251(3):72. doi:10.1007/s00425-020-03365-7. [Google Scholar] [PubMed] [CrossRef]
28. Dong WP, Sun JH, Liu YL, Xu C, Wang YH, Suo ZL, et al. Phylogenomic relationships and species identification of the olive genus Olea (Oleaceae). J Syst Evol. 2022;60(6):1263–80. doi:10.1111/jse.v60.6. [Google Scholar] [CrossRef]
29. Yu J, Wu X, Liu C, Newmaster S, Ragupathy S, Kress WJ. Progress in the use of DNA barcodes in the identification and classification of medicinal plants. Ecotoxicol Environ Saf. 2021;208(23):111691. [Google Scholar] [PubMed]
30. Nguyen HQ, Nguyen TNL, Doan TN, Nguyen TTN, Phạm MH, Le TL, et al. Complete chloroplast genome of novel Adrinandra megaphylla Hu species: molecular structure, comparative and phylogenetic analysis. Sci Rep. 2021;11(1):11731. doi:10.1038/s41598-021-91071-z. [Google Scholar] [PubMed] [CrossRef]
31. Li B, Luo YL, Li ZL. Investigation and research on Tibetan medicinal plant resources of Rosaceae in Gannan region. Plateau Sci Res. 2018;2(2):28–33 (In Chinese). [Google Scholar]
32. Xian EY, Liu L, Li Y, Zhang YC. Chromosomal karyotype analysis of two Tibetan medicinal plants of Rosaceae family in Tibet. Chin J Ethnomed. 2014;20(10):37–9 (In Chinese). [Google Scholar]
33. Bolger AM, Lohse M, Usadel B. Trimmomatic: a flexible trimmer for Illumina sequence data. Bioinform. 2014;30(15):2114–420. doi:10.1093/bioinformatics/btu170. [Google Scholar] [PubMed] [CrossRef]
34. Langmead B, Trapnell C, Pop M, Salzberg SL. Ultrafast and memory-efficient alignment of short DNA sequences to the human genome. Genome Biol. 2009;10(3):R25. doi:10.1186/gb-2009-10-3-r25. [Google Scholar] [PubMed] [CrossRef]
35. Jin JJ, Yu WB, Yang JB, Song Y, dePamphilis CW, Yi TS, et al. GetOrganelle: a fast and versatile toolkit for accurate de novo assembly of organelle genomes. Genome Biol. 2020;21:241. doi:10.1186/s13059-020-02154-5. [Google Scholar] [PubMed] [CrossRef]
36. Shi L, Chen H, Jiang M, Wang L, Wu X, Huang L, et al. CPGAVAS2, an integrated plastome sequence annotator and analyzer. Nucleic Acids Res. 2019;47:W65–73. doi:10.1093/nar/gkz345. [Google Scholar] [PubMed] [CrossRef]
37. Kearse M, Moir R, Wilson A, Stones-Havas S, Cheung M, Sturrock S, et al. Geneious Basic: an integrated and extendable desktop software platform for the organization and analysis of sequence data. Bioinform. 2012;28(12):1647–9. doi:10.1093/bioinformatics/bts199. [Google Scholar] [PubMed] [CrossRef]
38. Lohse M, Drechsel O, Kahlau S, Bock R. OrganellarGenomeDRAW—a suite of tools for generating physical maps of plastid and mitochondrial genomes and visualizing expression data sets. Nucleic Acids Res. 2013;41:W575–W581. doi:10.1093/nar/gkt289. [Google Scholar] [PubMed] [CrossRef]
39. Thiel T, Michalek W, Varshney RK, Graner A. Exploiting EST databases for the development and characterization of gene-derived SSR-markers in barley (Hordeum vulgare L.). Theor Appl Genet. 2003;106(3):411–22. doi:10.1007/s00122-002-1031-0. [Google Scholar] [PubMed] [CrossRef]
40. Kurtz S, Choudhuri JV, Ohlebusch E, Schleiermacher C, Stoye J, Giegerich R. REPuter: the manifold applications of repeat analysis on a genomic scale. Nucleic Acids Res. 2001;29(22):4633–42. doi:10.1093/nar/29.22.4633. [Google Scholar] [PubMed] [CrossRef]
41. Peden JF. Analysis of codon usage (Ph.D. Thesis). University of Nottingham: UK; 1999. [Google Scholar]
42. Yang Z. PAML 4: phylogenetic analysis by maximum likelihood. Mol Biol Evol. 2007;24(8):1586–91. doi:10.1093/molbev/msm088. [Google Scholar] [PubMed] [CrossRef]
43. Amiryousefi A, Hyvönen J, Poczai P. IRscope: an online program to visualize the junction sites of chloroplast genomes. Bioinformatics. 2018;34(17):3030–1. doi:10.1093/bioinformatics/bty220. [Google Scholar] [PubMed] [CrossRef]
44. Katoh K, Kuma KI, Toh H, Miyata T. MAFFT version 5: improvement in accuracy of multiple sequence alignment. Nucleic Acids Res. 2005;33(2):511–8. doi:10.1093/nar/gki198. [Google Scholar] [PubMed] [CrossRef]
45. Hall TA. BioEdit: a user-friendly biological sequence alignment editor and analysis program for windows 95/98/NT. Nucleic Acids Symp Ser. 1999;41:95–8. [Google Scholar]
46. Librado P, Rozas J. DnaSP v5: a software for comprehensive analysis of DNA polymorphism data. Bioinformatics. 2009;25(11):1451–2. doi:10.1093/bioinformatics/btp187. [Google Scholar] [PubMed] [CrossRef]
47. Talavera G, Castresana J. Improvement of phylogenies after removing divergent and ambiguously aligned blocks from protein sequence alignments. Syst Biol. 2007;56(4):564–77. doi:10.1080/10635150701472164. [Google Scholar] [PubMed] [CrossRef]
48. Zhang D, Gao F, Jakovlić I, Zou H, Zhang J, Li WX, et al. An integrated and scalable desktop platform for streamlined molecular sequence data management and evolutionary phylogenetics studies. Mol Ecol Resour. 2020;20:348–55. doi:10.1111/men.v20.1. [Google Scholar] [CrossRef]
49. Kalyaanamoorthy S, Minh BQ, Wong TKF, Von Haeseler A, Jermiin LS. ModelFinder: fast model selection for accurate phylogenetic estimates. Nat Methods. 2017;14(6):587–9. doi:10.1038/nmeth.4285. [Google Scholar] [PubMed] [CrossRef]
50. Jansen RK, Saski C, Lee SB, Hansen AK, Daniell H. Complete plastid genome sequences of three rosids (Castanea, Prunus, Theobromaevidence for at least two independent transfers of rpl22 to the nucleus. Mol Biol Evol. 2011;28:835–47. doi:10.1093/molbev/msq261. [Google Scholar] [PubMed] [CrossRef]
51. Wang S, Shi C, Gao LZ. Plastid genome sequence of a wild woody oil species, Prinsepia utilis, provides insights into evolutionary and mutational patterns of Rosaceae chloroplast genomes. PLoS One. 2013;8(9):e73946. doi:10.1371/journal.pone.0073946. [Google Scholar] [PubMed] [CrossRef]
52. Jin GH, Chen SY, Yi TS, Zhang SD. Characterization of the complete chloroplast genome of apple (Malus × domestica, Rosaceae). Plant Divers. 2014;36(4):468–84. [Google Scholar]
53. Liu S, Xue D, Cheng R, Han H. The complete mitogenome of Apocheima cinerarius (Lepidoptera: geometridae: ennominae) and comparison with that of other lepidopteran insects. Gene. 2014;547:136–44. doi:10.1016/j.gene.2014.06.044. [Google Scholar] [PubMed] [CrossRef]
54. Shen X, Wu M, Liao B, Liu Z, Bai R, Xiao S, et al. Complete chloroplast genome sequence and phylogenetic analysis of the medicinal plant Artemisia annua. Molecules. 2017;22(8):1330. doi:10.3390/molecules22081330. [Google Scholar] [PubMed] [CrossRef]
55. Qi W, Lin F, Liu Y, Huang B, Cheng J, Zhang W, et al. High-throughput development of simple sequence repeat markers for genetic diversity research in Crambe abyssinica. BMC Plant Biol. 2016;16(1):139. doi:10.1186/s12870-016-0828-y. [Google Scholar] [PubMed] [CrossRef]
56. Qian J, Song J, Gao H, Zhu Y, Xu J, Pang X, et al. The complete chloroplast genome sequence of the medicinal plant Salvia miltiorrhiza. PLoS One. 2013;8(2):e57607. doi:10.1371/journal.pone.0057607. [Google Scholar] [PubMed] [CrossRef]
57. Sharp PM, Matassi G. Codon usage and genome evolution. Curr Opin Genet Dev. 1994;4(6):851–60. doi:10.1016/0959-437X(94)90070-1. [Google Scholar] [PubMed] [CrossRef]
58. Li Y, Sylvester SP, Li M, Zhang C, Li X, Duan Y, et al. The complete plastid genome of Magnolia zenii and genetic comparison to Magnoliaceae species. Molecules. 2019;24(2):261. doi:10.3390/molecules24020261. [Google Scholar] [PubMed] [CrossRef]
59. Eguiluz M, Rodrigues NF, Guzman F, Yuyama P, Margis R. The chloroplast genome sequence from Eugenia uniflora, a Myrtaceae from Neotropics. Plant Syst Evol. 2017;303(9):1199–212. doi:10.1007/s00606-017-1431-x. [Google Scholar] [CrossRef]
60. Zheng G, Wei L, Ma L, Wu Z, Gu C, Chen K. Comparative analyses of chloroplast genomes from 13 Lagerstroemia (Lythraceae) species: identification of highly divergent regions and inference of phylogenetic relationships. Plant Mol Biol. 2020;102(6):659–76. doi:10.1007/s11103-020-00972-6. [Google Scholar] [PubMed] [CrossRef]
61. Millen RS, Olmstead RG, Adams KL, Palmer JD, Lao NT, Heggie L, et al. Many parallel losses of infA from chloroplast DNA during angiosperm evolution with multiple independent transfers to the nucleus. Plant Cell. 2001;13(3):645–58. doi:10.1105/tpc.13.3.645. [Google Scholar] [PubMed] [CrossRef]
62. Yang J, Chiang YC, Hsu TW, Kim SH, Pak JH, Kim SC. Characterization and comparative analysis among plastome sequences of eight endemic Rubus (Rosaceae) species in Taiwan. Sci Rep. 2021;11(1):1152. doi:10.1038/s41598-020-80143-1. [Google Scholar] [PubMed] [CrossRef]
63. Wang RJ, Cheng CL, Chang CC, Wu CL, Su TM, Chaw SM. Dynamics and evolution of the inverted repeat-large single copy junctions in the chloroplast genomes of monocots. BMC Evol Biol. 2008;8(1):36. doi:10.1186/1471-2148-8-36. [Google Scholar] [PubMed] [CrossRef]
64. Wang W, Yang T, Wang HL, Li ZJ, Ni JW, Su S, et al. Comparative and phylogenetic analyses of the complete chloroplast genomes of six Almond species (Prunus spp. L.). Sci Rep. 2020;10:10137. doi:10.1038/s41598-020-67264-3. [Google Scholar] [PubMed] [CrossRef]
65. Yang Z, Nielsen R. Estimating synonymous and nonsynonymous substitution rates under realistic evolutionary models. Mol Biol Evol. 2000;17:32–43. doi:10.1093/oxfordjournals.molbev.a026236. [Google Scholar] [PubMed] [CrossRef]
66. Austin DE. Diversity and classification of flowering plants. Econ Bot. New York: Columbia University Press; 1998. p. 182. [Google Scholar]
67. Eriksson T, Lundberg M, Töpel M, Östensson P, Smedmark JEE. Sibbaldia: a molecular phylogenetic study of a remarkably polyphyletic genus in Rosaceae. Plant Syst Evol. 2015;301:171–84. doi:10.1007/s00606-014-1063-3. [Google Scholar] [CrossRef]
68. Töpel M, Lundberg M, Eriksson T, Eriksen B. Molecular data and ploidal levels indicate several putative allopolyploidization events in the genus Potentilla (Rosaceae). PLoS Curr. 2011;3:RRN1237. [Google Scholar]
69. Dobeš C, Paule J. A comprehensive chloroplast DNA-based phylogeny of the genus Potentilla (Rosaceaeimplications for its geographic origin, phylogeography and generic circumscription. Mol Phylogenet Evol. 2010;56:156–75. doi:10.1016/j.ympev.2010.03.005. [Google Scholar] [PubMed] [CrossRef]
Cite This Article
 Copyright © 2024 The Author(s). Published by Tech Science Press.
This work is licensed under a Creative Commons Attribution 4.0 International License , which permits unrestricted use, distribution, and reproduction in any medium, provided the original work is properly cited.
 Downloads
 Citation Tools