 Open Access
ARTICLE
Quantitative and Qualitative Responses of Hydroponic Tomato Production to Different Levels of Salinity
1 Department of Agricultural Engineering, College of Food and Agriculture Sciences, King Saud University, Riyadh, 11451, Saudi Arabia
2 Precision Agriculture Research Chair, Deanship of Scientific Research, King Saud University, Riyadh, 11451, Saudi Arabia
3 Chair of Dates Industry & Technology, Deanship of Scientific Research, King Saud University, Riyadh, 11451, Saudi Arabia
4 Agricultural Research Centre, Agricultural Engineering Research Institute (AEnRI), Giza, 12619, Egypt
* Corresponding Author: ElKamil Tola. Email:
Phyton-International Journal of Experimental Botany 2024, 93(6), 1311-1323. https://doi.org/10.32604/phyton.2024.049535
Received 10 January 2024; Accepted 15 March 2024; Issue published 27 June 2024
Abstract
From economic and nutritional points of view, tomato is, historically, considered one of the most important crops. Without significant yield reduction, most commercial cultivars of tomato crops are sensitive to moderate levels of salinity. However, high levels of salt stress can negatively affect the yield and quality of tomato fruits. Therefore, this study was conducted to evaluate the yield and fruit quality of three tomato cultivars (Forester, Ghandowra-F1, and Feisty-Red) cultivated hydroponically, under three different levels of nutrient solution salinity. Evaluation of tomato fruits was performed based on quantity (number and weight of fruits, and total fruit yield), physical quality (color and firmness), and chemical quality (refractometric index “Brix”, pH, EC, K, Na, and NO). Experiments were conducted using three salinity levels of the nutrient solution with electrical conductivity values (dSm) of 2.5 (control), 6.0, and 9.5. Results showed that the studied tomato cultivars were significantly influenced by high salinity (9.5 dSm) in comparison to the low (2.5 dSm) and medium (6.0 dSm) levels of salinity. On average, the highest fruit weight per plant of 1944.84 g and total fruit yield of 4.42 kgm were observed at the low salinity level; however, no significant differences were obtained in the two yield factors (single fruit weight and total fruit yield) for the low and medium salinity levels. On the other hand, a significant reduction in tomato yield (31%) was associated with the high salinity level compared to the yield at low and medium salinity levels. Results of physical quality parameters showed highly significant differences among all salinity levels. On average, the maximum value of color change (1.72) was associated with the medium salinity level, and the maximum value of firmness (9.61 Ncm) was recorded at the high salinity level. Salinity levels and tomato cultivars introduced significant differences in chemical quality parameters; however, no significant differences in these parameters were attributed to the low and medium salinity levels. The maximum value of pH was recorded for the combination of medium salinity and Forester cultivar. Moreover, the maximum values of Brix, EC, K, Na, and NO were recorded for the Ghandowra-F1 cultivar at the high salinity level. Unlike the Feisty-Red, the performance of the Forester and Ghandowra-F1 cultivars was found to be acceptable at the tested medium salinity level (6.0 dSm).Keywords
Globally, the commercial production of tomato (Solanum lycopersicum L.) is of increasing interest, as it is the second most important vegetable after potatoes [1]. On the other hand, tomato is one of the largest crops produced under hydroponic systems in the world and one of the essential crops grown in greenhouses in the Kingdom of Saudi Arabia (KSA). Where there is more than 1260 ha. of greenhouse-planted areas with a mean yield of 35–45 and 8–10 kgm−2 under controlled and uncontrolled greenhouses, respectively [2]. Currently, most tomatoes are produced in greenhouses using either soil or soilless systems. Soilless-grown plants rely primarily on optimal concentrations of minerals needed for plant growth [3]. Therefore, hydroponics systems have recently been widely adopted for growing tomato plants in nutrient solutions to control the requirements of water and fertilizers and to protect plants from diseases, pests, and salinity stresses [4].
The quality of the produced tomato fruits is affected by the environmental conditions during the growing season, such as water stress, salinity stress, fertilizer applications, different agricultural practices, and genetic changes [5]. Although tomatoes are salt-sensitive crops, salinity may improve the taste of tomato fruits and their metabolism [6]. Moreover, salinity can also increase the contents of the total soluble solids (Degree of Brix (°Brix)) and the titratable acidity; which are two of the most important tomato quality parameters [7]. Based on weight, 90% of tomato contents is water; therefore, they can be easily damaged by septicity and physical shocks, and they have a climacteric breathing pattern causing rapid quality changes due to high ethylene production after harvest [8]. Barrios et al. [9] reported that firmness and color are also important parameters of tomato maturity and quality. Firmness is one of the main factors for evaluating tomato quality and is considered an indicator of shelf life and fruit taste [10]. However, the quality of tomato fruit can be determined by the hardness of the external and internal structure of the fruit, which is different for different varieties. Simon et al. [11] reported that the quality parameters of tomato fruits, including the sugar content, acidity, and acid-brix ratio, could help determine the ripening stage and influence the taste of tomatoes.
The tomato color is also one of the main visible factors used to evaluate the ripeness and post-harvest life. Perez-Alvarez et al. [12] determined the apparent color by measuring the achromatic component L* (relative darkness or lightness), and the chromatic descriptors (a* and b* values). The degree of ripeness of tomatoes can visually be assessed based on the color of tomato fruits. Although the tomato color is compared against the standard classification chart [13], inaccuracy in human observations and judgments can occur and result in errors in the classifications [14]. Camelo et al. [13] stated that the color of a tomato is the most important external characteristic for assessing ripeness and post-harvest life, and is a key factor in the consumers’ purchasing decision. In general, consumers evaluate tomato quality by color, uniform ripeness, firmness, shape, size, composition, and taste, as well as nutritional content and shelf life [9]. Lopez et al. [15] reported that tomato colors can be detected along three vertical axes: L (white to black), a (green to red), and b (blue to yellow). According to the USDA, tomato maturity is classified, based on color, into six stages: green, break green (10% non-green color), turning (10% to 30% non-green color), pink, bright red, and red [16].
Salt stress is one of the major factors that can affect tomato growth attributes, such as germination, root/shoot development, Na+/K+ ratio in roots and shoots, as well as total production [17]. In general, most commercial tomato cultivars are sensitive to moderate levels of salinity of up to 2.5 dSm−1, without a significant reduction in yield [18]. Cuartero et al. [19] reported that salinity reduced tomato seed germination and prolonged the time to germination to such an extent that establishing a competitive crop by direct seeding is difficult in soils where the electrical conductivity (EC) of the saturated extract is equal to or higher than 8 dSm−1. Adams [20] also showed that the highest yield of tomato plants grown in rockwool was obtained at 3 dSm−1 and the lowest at 12 dSm−1. Moreover, Agius et al. [21] reported that salt stress led to reduced tomato fruit yield due to its negative effects on flowering, fruit number, and fruit size; however, salinity imposed a positive effect on fruit quality based on the growth stage and application time of salinity. Therefore, the main objective of this study was to assess the quantitative and qualitative responses of different tomato cultivars to different levels of salinity under a hydroponics system.
Three commercial tomato cultivars (Forester, Ghandowra-F1, and Feisty-Red) were planted on perlite substrate bags in a greenhouse equipped with a semi-closed hydroponic system. The greenhouse (Fig. 1), which belonged to the Precision Agriculture Research Chair, King Saud University, Riyadh, Saudi Arabia (46° 37′ 10″ N & 24° 44′ 12″ E) was equipped with MACQU (Geosmart, Athens, Greece) systems for indoor climate control, irrigation and for carrying out the planned treatments. The indoor climate system and the irrigation system were both controlled by a programmable “MACQU.STP” software program. The greenhouse, of approximately 900 m2 area comprises 12 plant lines consisting of stainless-steel troughs at a height of 1.0 m above the ground and a slope of 5%, and spaced at about 1.78 m. Each plant line accommodated 27 perlite bags 1.0 m long and a capacity of 30 L. Drippers of 3 L h−1 discharge capacity were used to irrigate the plants.
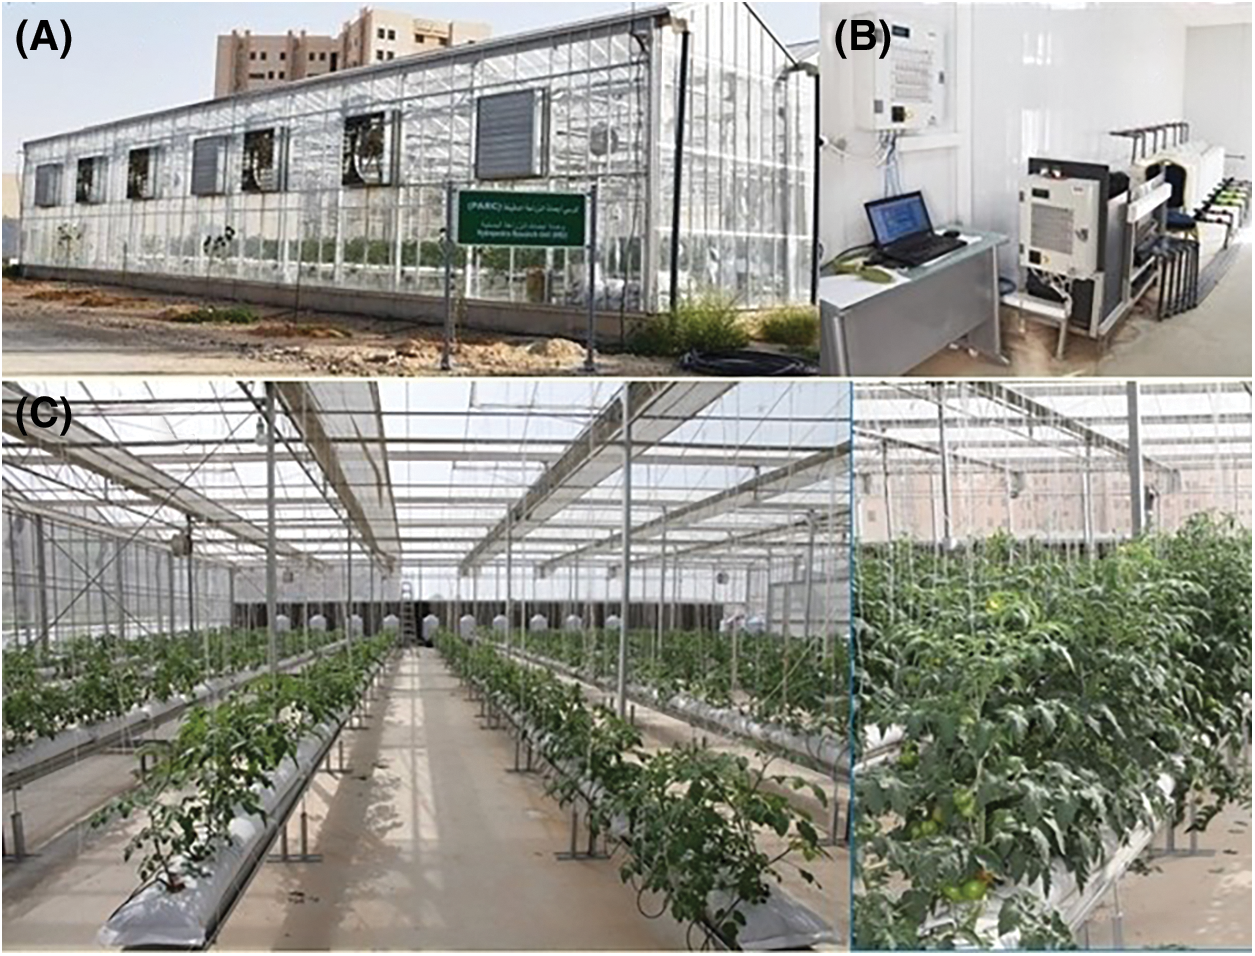
Figure 1: (A) The hydroponic greenhouse, (B) control unit, (C) steel troughs (plant lines) including perlite bags and plants as well as the irrigation system
Seedlings of the tested tomato cultivars were transplanted 50 days after sowing (04 December 2022), and the study continued until the end of March 2023. The seedlings were transplanted into the perlite bags, soaked with the nutrient solution, at 25 cm spacing between the plants along the plant line. Since the spacing between the plant lines was approximately 1.78 m, the plant density was maintained at approximately 2.25 plants m−2. The pH of the nutrient solution was monitored daily and maintained at a range of 5.5 to 6.5. Irrigation water was provided to plants using self-draining drippers of a flow rate of 3 Lh−1, where the irrigation scheme was weekly updated according to current requirements. The EC of the municipality-supplied water used for irrigation was 1.0 dSm−1, and the number of nutrient elements; Na+, Ca2+, K+, HCO3−, Cl−, and SO4− were 3.61, 0.76, 0.19, 0.35, 2.39, and 1.82 meq L−1, respectively.
An automatic hydroponic fertilizer dosing machine (MACQU) was used for the preparation of nutrition solutions with three salinity levels, low (2.5 dSm−1), medium (6.0 dSm−1), and high (9.5 dSm−1). The low salinity level (Salinity-1; S1) was obtained by automatically mixing the municipality-supplied water with an EC of ~1.0 dSm−1 with the fertilizer using the hydroponic system dosing unit to set the nutrient solution salinity to 2.5 dSm−1. Subsequently, the medium salinity level (Salinity-2; S2) and the high salinity level (Salinity-3; S3) were obtained by adding, using the dosing unit, NaCl to the nutrient solution to reach 6.0 and 9.5 dSm−1 for S2 and S3, respectively. To control the possible osmotic shock, NaCl concentration was started at 20 mM and gradually increased until the target concentrations were achieved. The solutions were periodically replaced, based on critical EC values.
The study site was under a dry climate, high temperatures, and long daytime hours that ranged from 10.5 h. during the winter season up to 13.5 h. in the summer season. The hydroponic greenhouse was equipped with climate control sensors for temperature, relative humidity, and light. During the study period, the temperature in the greenhouse was adjusted at a range from 18°C to 22°C across the daytime. Solar radiation of 400 flux was adjusted using automated shading screens to control the light dispersion during the sunshine period. The desired greenhouse temperature was set using a fan-pad cooling and a circulating fan-heating system. The nutrient solution was provided, 2 to 7 times during the daytime, to plants for 2 min during the initial growth stage and for 8 minutes during the maturity stage using automatic activated motor pumps. Over the nighttime, the nutrient solution was supplied two times (with a duration of 3 min each) at 11 pm and 2 am. during high-temperature days (>34°C outside the greenhouse).
2.2 Quantitative Tomato Yield Components
The quantitative tomato yield components were determined and the effects of salinity levels and tomato cultivars on these components were assessed. These components included tomato fruit number per single plant (fruits/plant), tomato fruit weight per single plant (g/plant), and total tomato fruit yield per area (kgm−2).
2.3 Physical Quality Parameters
The characteristics of the surface color of tomato fruits, namely, L* (lightness), b* (yellowness), and a* (redness) were measured in triplicate. The Hunter Lab-scan XE colorimeter (Hunter Lab, Reston, VA, USA) was calibrated against a standard white tile and used to measure the surface color at three points in the tomato fruits. The total color change (∆E) was then determined (Eq. (1)).
where the subscript 0 indicates the initial color, L, a, and b are the color parameters of fresh tomato fruit.
Tomato fruit firmness was determined using a TA-HDi textural analyzer (Model: HD3128, Stable Micro Systems, Surrey, England). Measurements were taken from three different sides covering the entire tomato surface. The firmness was measured by a cylindrical probe (1 mm in diameter) penetrating a tomato fruit at a speed of 1 mm s−1 to a depth of 5 mm. The probe proceeded with penetration of the sample with a uniform force to a depth of 10 mm to obtain the force/distance deformation curves expressed in units of Ncm−1.
2.4 Chemical Quality Parameters
Fresh tomato fruits were cut into small pieces and juiced using an electrical mixer for two to three minutes. The juice was then placed on a filter paper (Whatman No. 1) and the extracted solution was used to measure the chemical quality parameters of the tomato fruits. These parameters included the refractometric index (Brix), pH, EC, and the concentration of nutrients. The Brix, which is an indicator of the content of the total soluble solids of the extracted tomato fruit juice, was measured using a digital portable refractometer (Model DR 6300-T, Ireland). The pH, EC, and the concentrations of selected nutrients (K+, Na+, NO3−) in the extracted tomato fruit juice were measured using Nutrient LAQUAtwin Meters (Spectrum Technologies, Inc., USA).
The experimental work was set in a split-plot design with three replicates, using the salinity level as the main treatment and the tomato cultivar as the sub-treatment. Based on the quantitative and qualitative tomato yield components, the ANOVA statistical tool (SAS for Windows v. 9.4) was employed to evaluate the performance of the different tomato cultivars hydroponically grown under different salinity levels.
3.1 Effect of Salinity Levels on the Quantitative Tomato Yield Components
Table 1 presents the results of the statistical analysis of the effect of salinity levels on the quantitative yield components (fruit number per plant, weight of fruits per plant, and total fruit yield) of the studied tomato cultivars. These results showed that the number and weight of fruits per single plant, and total fruit yield were all inversely proportional to the increase in the concentration of salt. The lowest values of the tomato quantitative yield components were recorded with the highest salinity level (salinity-3; 9.5 dSm−1), with high significant differences in the number of fruits per plant compared to the low and medium salinity levels. These results were consistent with the results reported by Magan et al. [22], where high salinity concentrations, especially in the root zone, negatively affected the growth of tomato plants and the number and size of fruits, and therefore to a reduction in the total yield of tomato fruits.

3.1.1 Number of Tomato Fruits per Plant
Results showed a significant reduction in the number of tomato fruits per plant (15 fruits/plant) associated with the highest salinity level (salinity-3) of 9.5 dSm−1 compared to 22 fruits/plant and 19 fruits/plant under the medium salinity level (salinity-2; 6.0 dSm−1) and the lowest salinity level (salinity-1) of 2.5 dSm−1, respectively. No significant differences in the number of tomato fruits per plant were recorded between the low (salinity-1) and the medium (salinity-2) salinity levels. On the other hand, there were no significant differences in the number of tomato fruits per plant among tested tomato cultivars. On average, the highest number of tomato fruits per plant and the lowest number were recorded for the Ghandowra-F1 cultivar and the Feisty-Red cultivar, respectively (Fig. 2). Results revealed that, for all studied tomato cultivars, the highest number of tomato fruits per plant was recorded at the medium salinity level (salinity-2; 6.0 dSm−1).
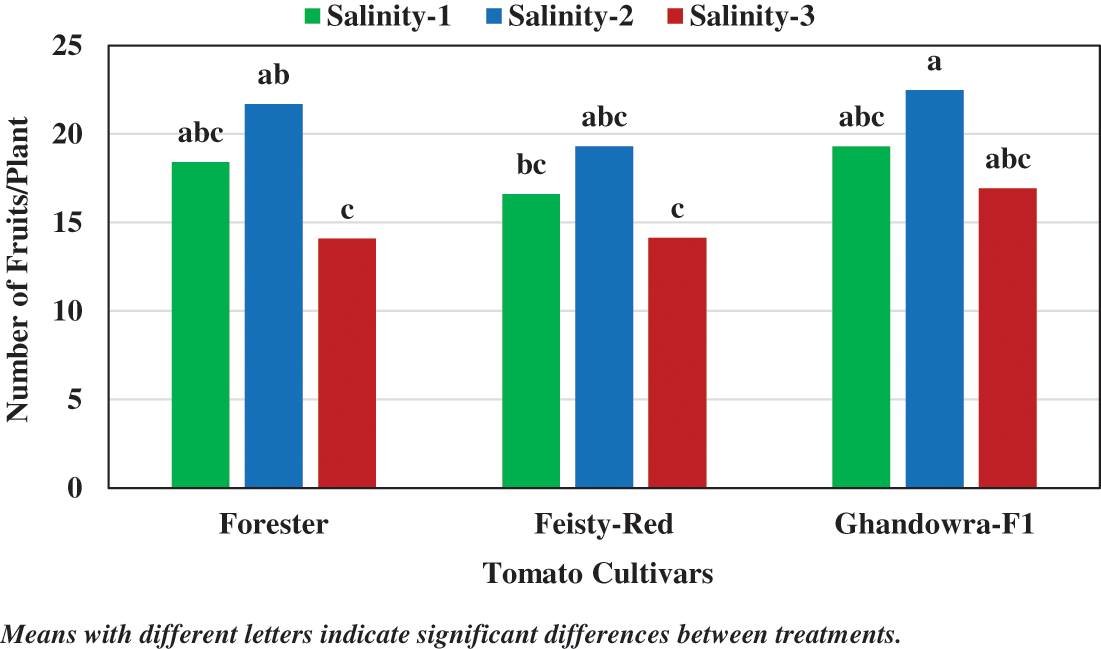
Figure 2: Impact of salinity and tomato cultivars on the number of fruits per plant
3.1.2 Weight of Tomato Fruits per Plant
The statistical analysis results showed that the weight of tomato fruits per plant decreased significantly under the highest salinity level (salinity-3) of 9.5 dSm−1. On average, the highest weight of tomato fruits (1944.84 g/plant) was obtained at the lowest salinity level (salinity-1) of 2.5 dSm−1, which was of no significant difference compared to 1916.65 g/plant recorded for the medium salinity level (salinity-2) of 6.0 dSm−1. Results showed no significant differences in the weight of tomato fruits per plant among the studied cultivars, with the highest mean weight of tomato fruits per plant of 1753.69 g/plant that was obtained for the Feisty-Red cultivar. Fig. 3 shows the effect of salinity levels on the average fruit weight per plant for the studied tomato cultivars. The maximum fruit weight per plant was observed at the low salinity level for both the Forester (2097 g/plant (and the Feisty-Red (1979.90 g/plant) cultivars, with no significant differences compared to that at the medium salinity level. For the Ghandowra-F1 cultivar, however, the highest fruit weight of 1938.58 g/plant was recorded at the medium salinity level.
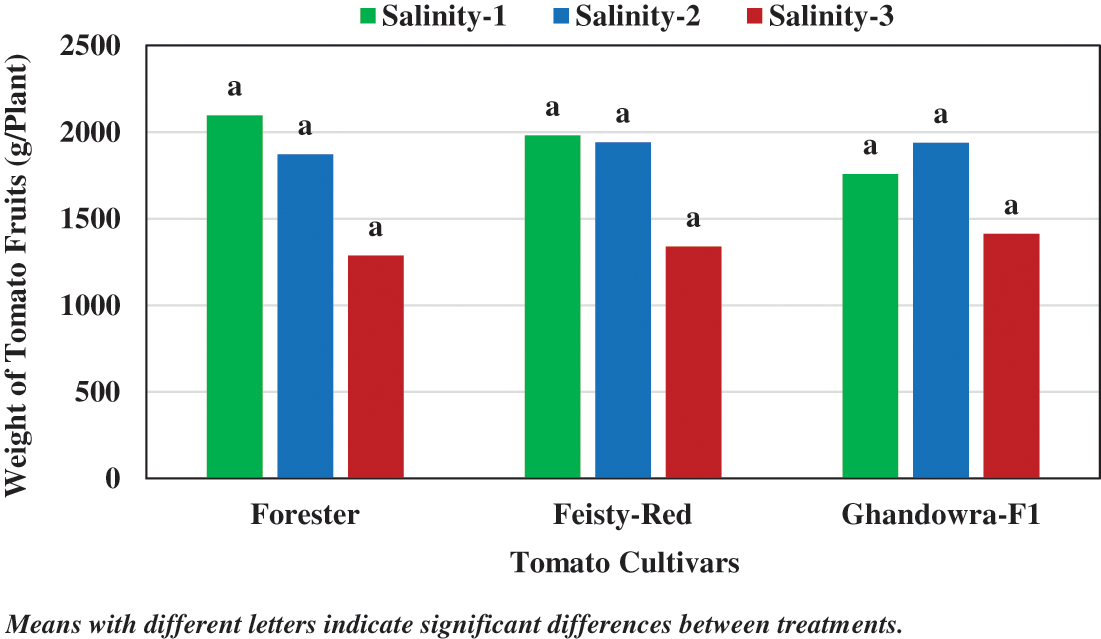
Figure 3: Impact of salinity and tomato cultivars on the weight of tomato fruit per plant
3.1.3 Total Tomato Fruit Yield
Significant differences between the total tomato fruit yield under low and high salinities were determined (Fig. 4). On average, the highest value of fruit yield (4.42 kgm−2) and the lowest (3.06 kgm−2) were recorded at the lowest salinity level (salinity-1) and the highest salinity level (salinity-3), respectively. However, no significant differences were recorded in the total fruit yield between the low and the medium salinity levels. Moreover, no significant differences were recorded in the total fruit yield among the studied tomato cultivars. On average, the lowest yield was recorded at the high salinity level for all tomato cultivars. This is because the exposure of tomato plants to high salinity stress causes negative effects on the rate of photosynthesis [23] and reduces the available water in the root zone [24] leading to a decrease in the number of fruits and fruit size resulting in a decrease in the total fruit yield. On the other hand, the highest average fruit yield was recorded at the low salinity level followed by that at the medium salinity level with no significant differences for all cultivars.
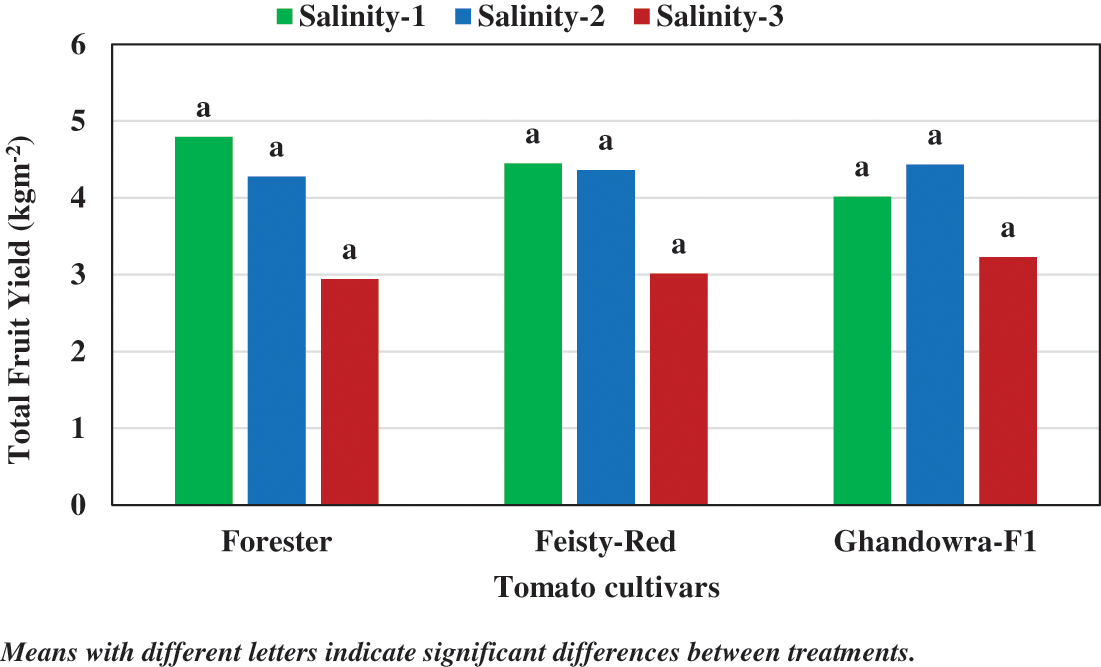
Figure 4: Impact of salinity and tomato cultivars on the total fruit yield
3.2 Effect of Salinity on the Quality of Tomato Fruits
3.2.1 Physical Quality Parameters
The statistical analysis results of the studied physical quality parameters (color and firmness) are presented in Table 2. Overall, the results showed highly significant differences (Pr < 0.0001) in the color and firmness of tomato fruits due to different salinity levels and tomato cultivars.

Results revealed that the highest mean value (1.72) of the color change (∆E) of tomato fruits was recorded at the medium salinity level (salinity-2) of 6.0 dSm-1, with significant differences from that obtained at the lowest and highest salinity levels of 2.50 and 9.5 dSm−1, respectively. On average, the maximum value (1.82) of color change was obtained in the Forester cultivar, which was significantly different from that of Gandowra-F1 (1.70) and Feisty-Red (1.10). Moreover, the highest average color value of Forester (2.2) and Ghandowra-F1 (1.81) was recorded at the medium salinity level; however, the value of 1.2 was recorded for the Ghandowra-F1 cultivar at the high salinity level (Fig. 5).
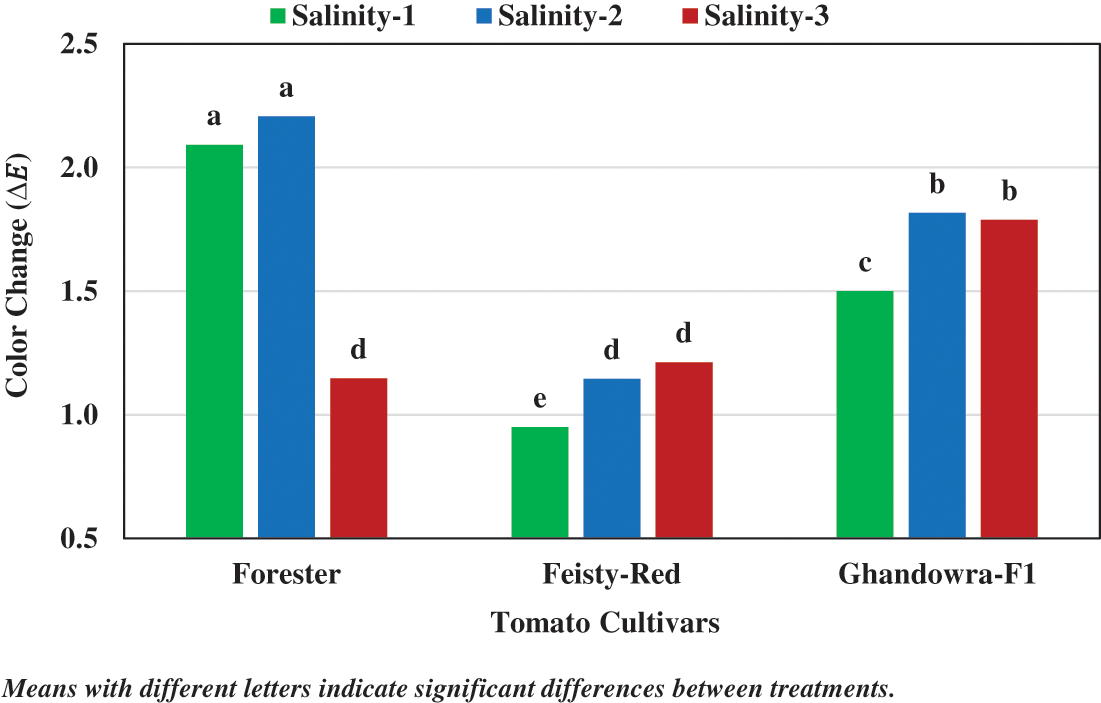
Figure 5: Impact of salinity and cultivars on tomato color
Results revealed that the highest mean value of tomato fruit firmness (Ncm−1) was recorded at the highest salinity level (salinity-3) of 9.5 dSm−1, which was significantly higher than the mean firmness values of 9.28 and 8.78 Ncm−1 recorded at the medium and the low salinity levels, respectively (Fig. 6). These results agreed with the results of Tang et al. [25], where it was stated that tomato fruits produced in nutrient solutions with high salt content had high firmness and cuticle thickness. Although the firmness of tomato fruits is an important quality parameter, harder tomato fruits would not have an ideal taste and flavor for customers [26]. As for the different tomato cultivars, the highest mean value of fruit firmness (9.45 Ncm−1) and the lowest (8.78 Ncm−1) were recorded for the Forester cultivar and the Feisty-Red cultivar, respectively.
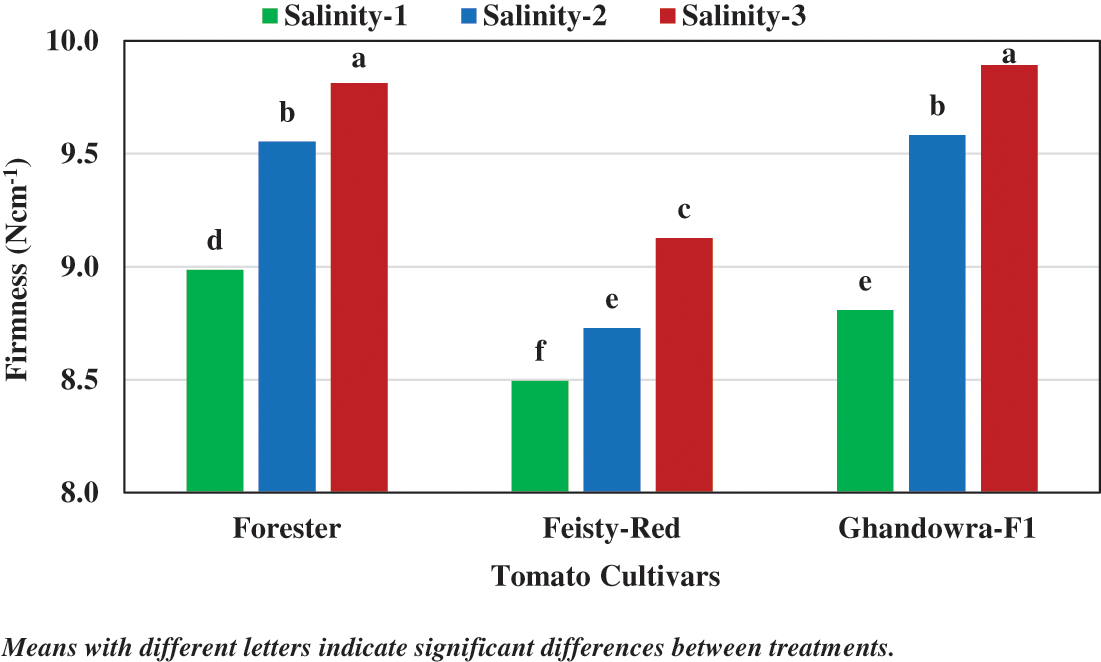
Figure 6: Impact of salinity and cultivars on tomato fruit firmness
3.2.2 Chemical Quality Parameters
Results of the statistical analysis of the chemical quality parameters (Brix, pH, EC, and concentration of nutrients in tomato fruit juice (K+, Na+, and NO3−) related to the tested crop are all presented in Table 3. In general, the results showed significant differences, due to different salinity levels, in all chemical quality parameters of tomato fruits. Except for EC, results showed significant differences among tomato cultivars in the studied chemical quality parameters.

On average, the highest value of Brix level (7.27%) was recorded at the highest salinity level (salinity-3) of 9.5 dSm−1, which was significantly different from that recorded at the low (6.94%) and the medium (6.95%) salinity levels. These results are in agreement with the results reported by Saito et al. [27] who revealed that the concentrations of sugar and total soluble solids (Brix) in tomato fruits were proportional to the salinity levels, as the total soluble content of tomato fruits increased with the increasing salt content in irrigation water. However, no significant differences were recorded between the mean values of Brix under the low and the medium salinity levels. The results also showed that the highest mean Brix value (7.74%) was recorded for the Ghandowra-F1 cultivar and the lowest value (6.59%) was recorded for the Feisty-Red. Moreover, the highest mean Brix values were obtained at the highest salinity level (salinity-3) of 9.5 dSm−1 for Forester and Feisty-Red cultivars (Fig. 7). For Ghandowra-F1 cultivar, the highest mean Brix value was observed at the low salinity level. High levels of soluble solids in tomato fruits enhance good flavor, taste, profit, and high demand from customers [28]; therefore, these soluble solids should be analyzed to assess the commercial quality of tomatoes [29]. However, increased Brix contents in tomato fruits resulting from excess salt can cause a decrease in fruit weight and lead to a decrease in the total yield [27,30].
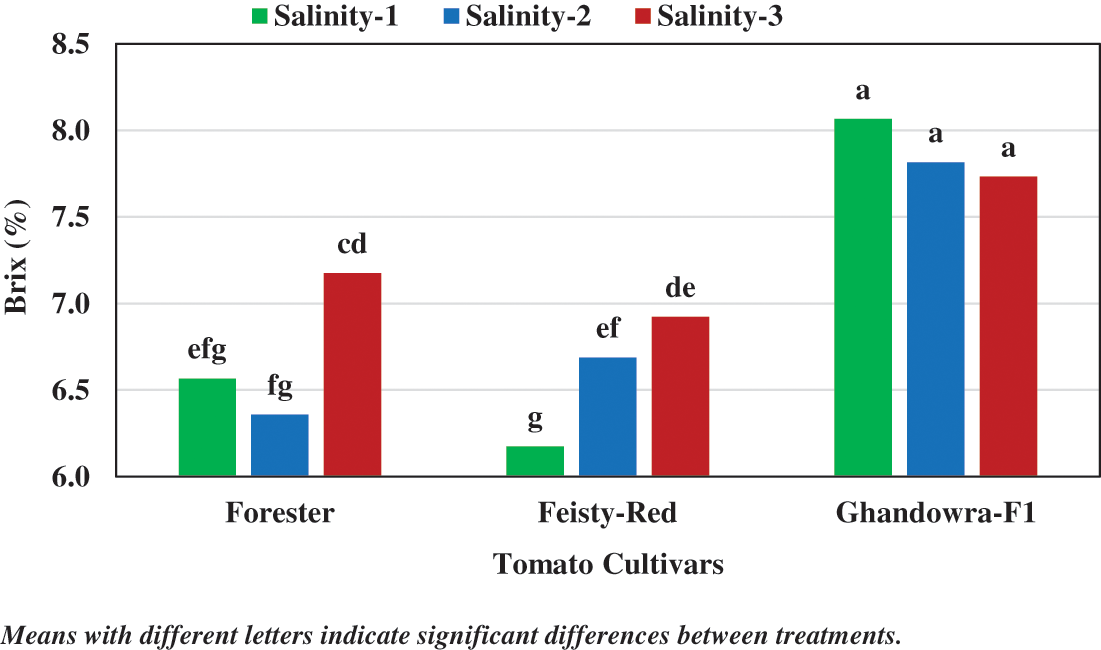
Figure 7: Impact of salinity level and cultivars on the Brix value of tomato fruits
The pH and Electrical Conductivity (EC)
Values of the pH of tomato fruit juice showed highly significant differences (p < 0.0001) among the studied tomato cultivars. On average, the maximum pH value of 4.53 was recorded for the Forester cultivar and was significantly higher than that of the Feisty-Red (4.39) and the Ghandowra-F1 (4.33) cultivars. On the other hand, both the pH and EC of tomato fruit juice showed significant responses to salinity levels. On average, the highest pH value of 4.47 was recorded at the medium salinity level (salinity-2) of 6 dSm−1 and the lowest value (4.36) was at the highest salinity level (salinity-3) of 9.5 dSm−1. These results are consistent with those reported by Cuartero et al. [19] and Magan et al. [22]. Fig. 8 shows the response of pH and EC parameters to the interaction between salinity levels and tomato cultivars. On average, the highest pH value was obtained at salinity-2 for the Forester and the Feisty-Red cultivars; however, the highest EC value was recorded at salinity-3 for the Forester and Feisty-Red cultivars.
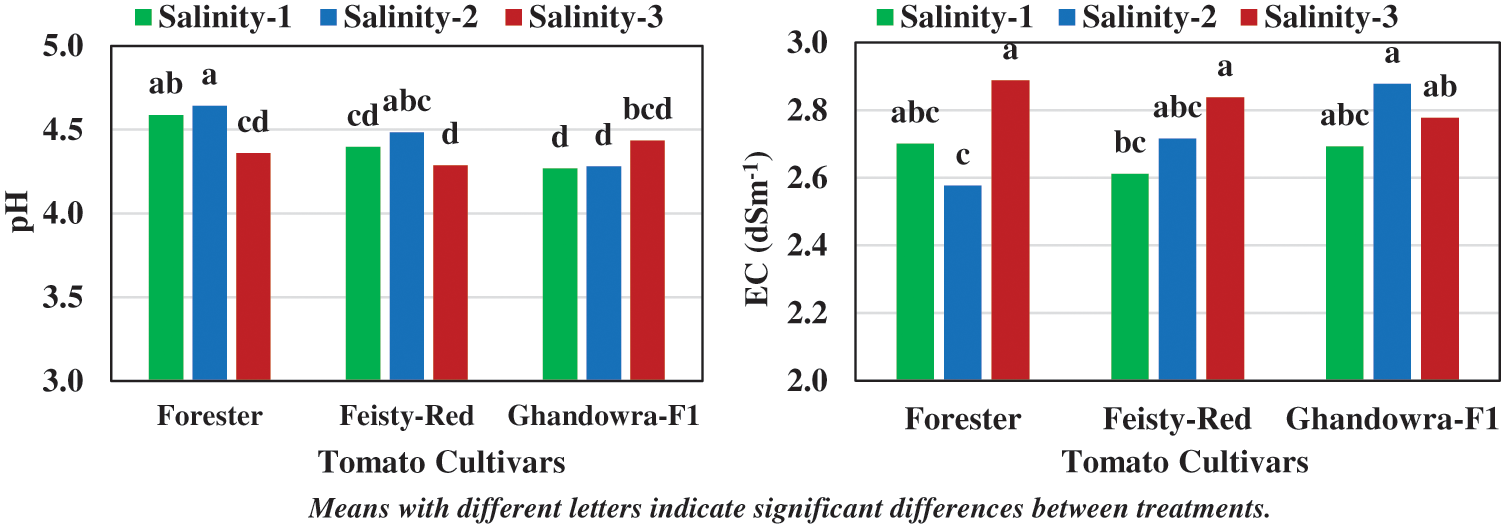
Figure 8: Impact of salinity and tomato cultivars on the pH and EC
Concentration of Nutrients (K+, Na+, NO3−)
The studied nutrients in the tomato fruit juice showed significant differences (p < 0.005) among tomato cultivars. On average, the highest values (ppm) of the K+ (1960), Na+ (62.91), and NO3− (440.18) were recorded for the Ghandowra-F1 cultivar, which was significantly different from the values of other cultivars. Moreover, all nutrients showed significant differences (p < 0.05) among salinity levels. On the other hand, the highest mean values of K+, Na+, and NO3− were recorded at salinity-3 (9.5 dSm−1), which were significantly higher than those recorded at salinity-1 (2.5 dSm−1). In general, the highest mean concentrations of K+, Na+, and NO3− in tomato fruit juice were obtained at salinity-3 (9.5 dSm−1) for all cultivars (Fig. 9).

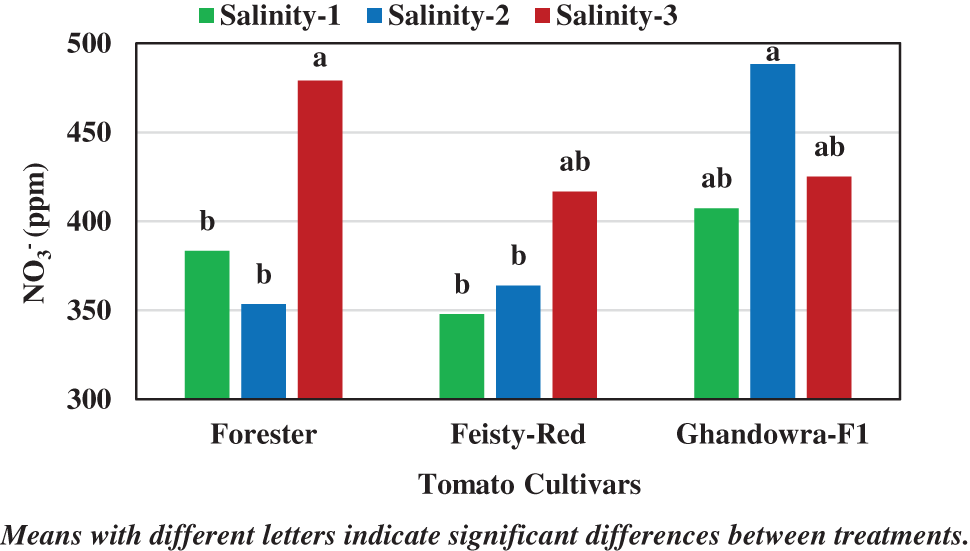
Figure 9: Response of pH and EC to the interaction of salinity and tomato cultivars
A study was carried out to investigate the performance of tomato crops (quality and quantity) using three tomato cultivars (Forester, Ghandowra-F1, and Feisty-Red) grown in a hydroponic glasshouse under three different levels of salinity (2.5, 6.0, and 9.5 dSm−1). Tomato fruit performance was evaluated in terms of quantitative tomato yield components (fruits’ number per plant, weight of fruits per plant, and total tomato fruit yield) and qualitative parameters, including physical (color and firmness) and chemical quality parameters (Brix, pH, EC, K+, Na+, and NO3−). The main conclusions are as follows:
• A significant (Pr < 0.0001) negative impact of high salinity level on the studied quality parameters of tomato fruits (i.e., number of fruits per plant, weight of fruits per plant, total fruit yield, fruit color, fruit firmness, Brix, pH, EC, K+, Na+, and NO3-) was revealed.
• On average, a significant reduction in the total tomato fruit yield (about 31%) was obtained under the highest salinity level (salinity-3) of 6.0 dSm−1 compared to the yield at the lowest salinity level (salinity-1) of 2.5 dSm−1.
• For all cultivars, no significant differences in the studied quality parameters were obtained at the lowest (salinity-1) of 2.5 dSm−1 and the medium (salinity-2) of 9.5 dSm−1 salinity levels. Thus, the medium salinity level (salinity-2) of 6.0 dSm−1 was considered to be optimum for tomatoes grown under hydroponic systems, as it is the most common in available irrigation water.
• On average, the Forester and the Ghandowra-F1 tomato cultivars, grown under hydroponic systems, produced the best quality tomato fruits.
Acknowledgement: The authors are grateful to the Deanship of Scientific Research, King Saud University for funding this study through the Vice Deanship of Scientific Research Chairs.
Funding Statement: The authors received no specific funding for this study.
Author Contributions: Conceptualization, Khalid A. Al-Gaadi, Ahmed M. Zeyada and ElKamil Tola; Data curation, Ahmed M. Zeyada, ElKamil Tola and Khalid A. M. Ahmed; Formal analysis, Ahmed M. Zeyada, ElKamil Tola, Khalid A. M. Ahmed and Abdullah M. Alhamdan; Investigation, Khalid A. Al-Gaadi, Rangaswamy Madugundu and Mohamed K. Edrris; Methodology, Ahmed M. Zeyada, ElKamil Tola, Khalid A. M. Ahmed and Mohamed K. Edrris; Resources, Ahmed M. Zeyada, and ElKamil Tola; Supervision, Khalid A. Al-Gaadi, ElKamil Tola, Abdullah M. Alhamdan and Rangaswamy Madugundu; Writing-original draft, Ahmed M. Zeyada; Writing-review & editing, Khalid A. Al-Gaadi and ElKamil Tola. All authors have read and agreed to the published version of the manuscript.
Availability of Data and Materials: All the data supporting the findings of this study are included in this article, and any further data will be provided by the corresponding author upon request.
Ethics Approval: Not applicable.
Conflicts of Interest: The authors declare that they have no conflicts of interest to report regarding the present study.
References
1. Panno S, Davino S, Caruso AG, Bertacca S, Crnogorac A, Mandic A, et al. A review of the most common and economically important diseases that undermine the cultivation of tomato crop in the mediterranean basin. Agronomy. 2021;11(11):2188. doi:10.3390/agronomy11112188. [Google Scholar] [CrossRef]
2. Statistical report. Kingdom of Saudi Arabia: Ministry of Environment, Water and Agriculture; 2021. Available from: https://www.mewa.gov.sa/ar/InformationCenter/DocsCenter/YearlyReport/Pages/default.aspx. [Accessed 2023]. [Google Scholar]
3. Fussy A, Papenbrock J. An overview of soil and soilless cultivation techniques-chances, challenges and the neglected question of sustainability. Plants. 2022;11(9):1153. doi:10.3390/plants11091153. [Google Scholar] [PubMed] [CrossRef]
4. Rajaseger G, Chan KL, Tan KY, Ramasamy S, Khin MC, Amaladoss A, et al. Hydroponics: current trends in sustainable crop production. Bioinformation. 2023;19(9):925–38. doi:10.6026/bioinformation. [Google Scholar] [CrossRef]
5. Zhang J, Liu S, Zhu X, Chang Y, Wang C, Ma N, et al. Comprehensive evaluation of tomato fruit quality and identification of volatile compounds. Plants. 2023;12(16):2947. doi:10.3390/plants12162947. [Google Scholar] [PubMed] [CrossRef]
6. Oliveira CES, Zoz T, Seron CC, Boleta EHM, Lima BH, Souza LRR, et al. Can saline irrigation improve the quality of tomato fruits? Agron J. 2022;114(2):1–15. [Google Scholar]
7. Moles TM, de Brito Francisco R, Mariotti L, Pompeiano A, Lupini A, Incrocci L, et al. Salinity in autumn-winter season and fruit quality of tomato landraces. Front Plant Sci. 2019;10:1078. doi:10.3389/fpls.2019.01078. [Google Scholar] [PubMed] [CrossRef]
8. Al-Dairi M, Pathare PB, Al-Yahyai R. Chemical and nutritional quality changes of tomato during postharvest transportation and storage. J Saudi Soc Agric Sci. 2021;20(6):401–8. [Google Scholar]
9. Barrios AG, Borquez R, Rico-Garcia E, Toledano-Ayala M, Soto-Zarazua GM. Tomato quality evaluation with image processing: a review. Afr J Agric Res. 2011;6(14):3333–9. [Google Scholar]
10. Batu A. Determination of acceptable firmness and colour values of tomatoes. J Food Eng. 2004;61(3):471–5. doi:10.1016/S0260-8774(03)00141-9. [Google Scholar] [CrossRef]
11. Goisser S, Krause J, Fernandes M, Mempel H. Determination of tomato quality attributes using portable NIR-sensors. Karlsruhe, Germany; 2019 Mar 13–14. Available from: https://publikationen.bibliothek.kit.edu/1000092314. [Accessed 2023]. [Google Scholar]
12. Perez-Alvarez JA, Fernandezlopez J, Sayas ME, Rosmini MR. Determinación objetiva del color en los alimentos. TechnoFOOD. 1999;11:18–28. [Google Scholar]
13. Umeohia UE, Olapade AA. Quality attributes, physiology, and postharvest technologies of tomatoes (Lycopersicum esculentum)—A review. Am J Food Sci Technol. 2024;12(2):42–64. doi:10.12691/ajfst-12-2-1. [Google Scholar] [CrossRef]
14. Rizzo M, Marcuzzo M, Zangari A, Gasparetto A, Albarelli A. Fruit ripeness classification: a survey. Artif Intell Agric. 2023;7(2):44–57. [Google Scholar]
15. Lopez Camelo A, Gomez PA. Comparison of color indexes for tomato ripening. Hortic Bras, Brasília. 2004;22(3):534–7. doi:10.1590/S0102-05362004000300006. [Google Scholar] [CrossRef]
16. USDA-United States Department of Agriculture. United states standards for grading of fresh market tomatoes. Washington DC: USDA Agricultural Marketing Service; 1976. Available from: https://www.ams.usda.gov/sites/default/files/media/Tomato_Standard%5B1%5D.pdf. [Accessed 2023]. [Google Scholar]
17. Parida AK, Das AB. Salt tolerance and salinity effects on plant: a review. Ecotoxical Environ Saf. 2005;60(3):324–49 (In Spanish). doi:10.1016/j.ecoenv.2004.06.010. [Google Scholar] [PubMed] [CrossRef]
18. Zhang P, Jiang S, Dai Y, Zhang Z, Senge M. Combined treatment of salinity stress and fruit thinning effect on tomato. Front Nutr. 2022;29(9):857977. [Google Scholar]
19. Cuartero J, Fernández-Munoz R. Tomato and salinity. Sci Hortic. 1988;78(1–4):83–125. [Google Scholar]
20. Adams P. Effects of increasing the salinity of the nutrient solution with major nutrients or sodium chloride on the yield, quality and composition of tomatoes grown in rockwool. J Hortic Sci. 1991;66(2):201–7. doi:10.1080/00221589.1991.11516145. [Google Scholar] [CrossRef]
21. Agius C, von Tucher S, Rozhon W. The effect of salinity on fruit quality and yield of cherry tomatoes. Horticulturae. 2022;8(1):59. doi:10.3390/horticulturae8010059. [Google Scholar] [CrossRef]
22. Magan JJ, Gallardo M, Thompson RB, Lorenzo P. Effects of salinity on fruit yield and quality of tomato grown in soil-less culture in greenhouses in Mediterranean climatic conditions. Agric Water Manag. 2008;95(9):1041–55. doi:10.1016/j.agwat.2008.03.011. [Google Scholar] [CrossRef]
23. Ors S, Ekinci M, Yildirim E, Sahin U, Turan M, Dursun A. Interactive effects of salinity and drought stress on photosynthetic characteristics and physiology of tomato (Lycopersicon esculentum L.) seedlings. S Afr J Bot. 2021;137:355–39. [Google Scholar]
24. Yadav SP, Bharadwaj R, Nayak H, Mahto R, Singh RK, Prasad SK. Impact of salt stress on growth, productivity and physicochemical properties of plants: a review. Int J Chem Stud. 2019;7(2):1793–8. [Google Scholar]
25. Tang H, Zhang X, Gong B, Yan Y, Shi Q. Proteomics and metabolomics analysis of tomato fruit at different maturity stages and under salt treatment. Food Chem. 2020;311:126009. doi:10.1016/j.foodchem.2019.126009. [Google Scholar] [PubMed] [CrossRef]
26. Oms-Oliu G, Hertog M, van de Poel B, Ampofo-Asiama J, Geeraerd AH, Nicolai BM. Metabolic characterization of tomato fruit during preharvest development, ripening, and postharvest shelf-life. Postharvest Biol Technol. 2011;62(1):7–16. doi:10.1016/j.postharvbio.2011.04.010. [Google Scholar] [CrossRef]
27. Saito T, Fukuda N, Nishimura S. Effects of salinity treatment duration and planting density on size and sugar content of hydroponically grown tomato fruits. J Jpn Soc Hortic Sci. 2006;75(5):392–8. doi:10.2503/jjshs.75.392. [Google Scholar] [CrossRef]
28. Tiwari JK, Rai N, Singh MK, Mishra LK, Mishra G, Behera TK. Characterization of tomato lines for yield components, processing traits and disease resistance based on phenotype and molecular markers. Veg Sci. 2023;50(2):302–9. [Google Scholar]
29. Yuri JE, Costa ND, Lima MACD, Resende GMD, Ferreira TD, Silva MC. Mini tomato cultivars for the Submid São Francisco Valley, Brazil. Rev Caatinga. 2016;29(4):1015–20. doi:10.1590/1983-21252016v29n427rc. [Google Scholar] [CrossRef]
30. Okano K, Nkano Y, Watanabe S, Ikdeda T. Control of fruit quality by salinity stress at various fruit development stages of single-truss tomato grown in hydroponics. Environ Control Biol. 2002;40(4):375–82. doi:10.2525/ecb1963.40.375. [Google Scholar] [CrossRef]
Cite This Article
 Copyright © 2024 The Author(s). Published by Tech Science Press.
This work is licensed under a Creative Commons Attribution 4.0 International License , which permits unrestricted use, distribution, and reproduction in any medium, provided the original work is properly cited.


 Submit a Paper
 Propose a Special lssue
 View Full Text
 Download PDF
 Downloads
 Citation Tools