
 Submit a Paper
 Propose a Special lssue
 Open Access
ARTICLE
Potentially Suitable Area and Change Trends of Tulipa iliensis under Climate Change
1 College of Agriculture and Animal Husbandry, Qinghai University, Xining, 810016, China
2 Key Laboratory of Qinghai Province for Landscape Plants Research, Plateau Flower Research Centre, Qinghai University, Xining, 810016, China
* Corresponding Author: Xiuting Ju. Email:
Phyton-International Journal of Experimental Botany 2024, 93(5), 981-1005. https://doi.org/10.32604/phyton.2024.049668
Received 13 January 2024; Accepted 08 April 2024; Issue published 28 May 2024
 View Full Text
 Download PDF
Abstract
Tulipa iliensis, as a wild plant resource, possesses high ornamental value and can provide abundant parental materials for tulip breeding. The objective of this research was to forecast the worldwide geographical spread of Tulipa iliensis by considering bioclimatic, soil, and topographic variables, the findings of this research can act as a benchmark for the conservation, management, and utilization of Tulipa iliensis as a wild plant resource. Research results indicate that all 12 models have an area under curve (AUC) of the receiver operating characteristic curve (ROC) values greater than 0.968 for the paleoclimatic, current, and future climate scenarios, this suggests an exceptionally high level of predictive accuracy for the models. The distribution of Tulipa iliensis is influenced by several key factors. These factors include the mean temperature of the driest quarter (Bio9), calcium carbonate content (T_CACO), slope, precipitation of the driest month (Bio14), Basic saturation (T_BS), and precipitation of the coldest quarter (Bio19). During the three paleoclimate climate scenarios, the appropriate habitats for Tulipa iliensis showed a pattern of expansion-contraction expansion. Furthermore, the total suitable area accounted for 13.38%, 12.28%, and 13.28% of the mainland area, respectively. According to the current climate scenario, the High-suitability area covers 61.78472 × 10 km, which accounts for 6.57% of the total suitable area, The Mid-suitability area covers 190.0938 × 10 km, accounting for 20.2% of the total suitable area, this represents a decrease of 63.53%~67.13% compared to the suitable area of Tulipa iliensis under the paleoclimate scenario. Under the Shared Socioeconomic Pathways (SSP) scenarios, in 2050 and 2090, Tulipa iliensis is projected to experience a decrease in the High, Mid, and Low-suitability areas under the SSP126 climate scenario by 7.10%~12.96%, 2.96%~4.27% and 4.80%~7.96%, respectively. According to the SSP245 scenario, the high suitability area experienced a slight expansion of 2.26% in 2050, but a reduction of 6.32% in 2090. In the SSP370 scenario, the High-suitability areas had a larger reduction rate of 11.24% in 2050, while the Mid-suitability and Low-suitability areas had smaller expansion rates of 0.36% and 4.86%, respectively. In 2090, the High-suitability area decreased by 4.84%, while the Mid and Low-suitability areas experienced significant expansions of 15.73% and 45.89%, respectively. According to the SSP585 scenario, in the future, the High, Mid, and Low-suitability areas are projected to increase by 5.09%~7.21%, 7.57%~17.66%, and 12.30%~48.98%, respectively. The research offers enhanced theoretical direction for preserving Tulipa iliensis’ genetic variety amidst evolving climatic scenarios.Keywords
Discussing how plants react to climatic shifts has consistently been a favored subject in global change and biogeography research. The biodiversity and ecological stability of plants are greatly affected by worldwide climatic shifts [1]. The Sixth Assessment Report of IPCC (IPCC AR6) was released, which reveals that climate change is causing significant changes to the distribution of species across diverse ecosystems globally [2]. Confronting the challenges of climate change, high-altitude areas are vulnerable to environmental damage due to limited biodiversity [3]. The Tibetan Plateau (73.43–104.67°E, 25.98–39.82°N) stands as the world’s tallest plateau, recognized as the “Roof of the World” and the “Third Pole”, and is generally considered to be a climate change-sensitive region [4–6]. Part of China’s Xinjiang province is situated on the Qinghai-Tibet Plateau, which has a dry climate with low precipitation, high evaporation, fragile ecology, and high sensitivity to climate change, this climate is typical of the temperate continental arid climate. The significant changes between dry and wet seasons greatly impact the rejuvenation of the ecological setting and safeguarding of the region’s biodiversity and ecosystems. With the changing global climate, the region as a whole is experiencing a trend towards warming and increased humidity [7]. Tulipa iliensis is primarily found in Russia, Central Asia, and Xinjiang, China. Due to the effects caused by climate change, the geographic distribution of Tulipa iliensis may undergo significant change. Therefore, it is of utmost importance to conduct investigations on the suitable distribution of Tulipa iliensis to address the effects of climatic alterations and predict alterations in the species distribution in the future. This will allow for the development of appropriate strategies for protecting biodiversity.
Species distribution models (SDMs) are used to collect data on species through survey data, specimen records, and literature records. Once the data is collected, species algorithms are applied to determine the species’ ecological niche and express its habitat preference as a probability [8,9]. SDMs are extensively employed in forecasting the current geographic range of species, evaluating the impact of climatic shifts on the spread of species and the appropriateness of habitats, and estimating the potential response of species’ suitable areas to climate change [10]. Climatic envelope models (CEMs) [11], Habitat suitability models (HSMs) [12], and Maximum entropy models (MaxEnt) [13] are frequently employed in forecasting the distribution of species. Among these models, the MaxEnt model stands out for its enhanced efficiency regarding data needs, predictive outcomes, and steadiness. It ensures unbiased prediction results by making objective inferences about the allocation of unidentified species derived from a restricted set of recognized samples and the maximum entropy principle [14]. The MaxEnt model is frequently used to evaluate the suitability of distribution for plants, animals, and bacteria [15–17]. It is commonly to predict the suitable habitat for endangered and protected plants. such as Primula filchnerae [18], Handeliodendron bodinieri [19], and Rhodiola L. [20].
The Tulipa iliensis is a perennial plant that blooms in early spring, it belongs to the Tulipa L. genus of the Liliaceae family. This plant is found in Xinjiang, China and the Central Asian region of Russia, it mainly grows in plain deserts, dry slopes, and gravel grasslands [21]. The Tulipa iliensis goes through dormancy in summer and winter. The flower buds start to form from late June to mid-August, which takes around 6 weeks [22]. Due to its characteristics of solitary terminal flowers, large and brightly colored petals, strong adaptability, and short growth cycle, Tulipa iliensis possesses high ornamental value and can provide abundant parental materials for breeding purposes. In recent years, research on Tulipa iliensis has mainly focused on genetic diversity [23–26], seed germination characteristics [27–30], dormant habits [31], phenological characteristics [32–34], chloroplast genome characteristics and other related areas [35]. However, there is currently no research on the distribution trend of Tulipa iliensis under climate change conditions. The population of Tulipa iliensis in Xinjiang, China is decreasing due to habitat destruction and livestock grazing in early spring. Analyzing the primary environmental factors that restrict the survival of Tulipa iliensis and forecasting patterns within the framework of worldwide climate change holds paramount significance.
Through field investigation and website searches, we collected distribution data of Tulipa iliensis, the MaxEnt 3.4.4 model was utilized for our predictions of the potential response of suitable areas for Tulipa iliensis to climate change. This study aimed to (1) explore the key environmental factors that limit the distribution of Tulipa iliensis; (2) simulate and predict the potential spatial distribution and suitable habitats of Tulipa iliensis under different climate scenarios; (3) investigate the expansion and contraction of the past, future and current distribution areas. The research results are expected to provide valuable insights into the rational protection, management, and utilization of wild germplasm resources of Tulipa iliensis.
2.1 Geographic Distribution Data
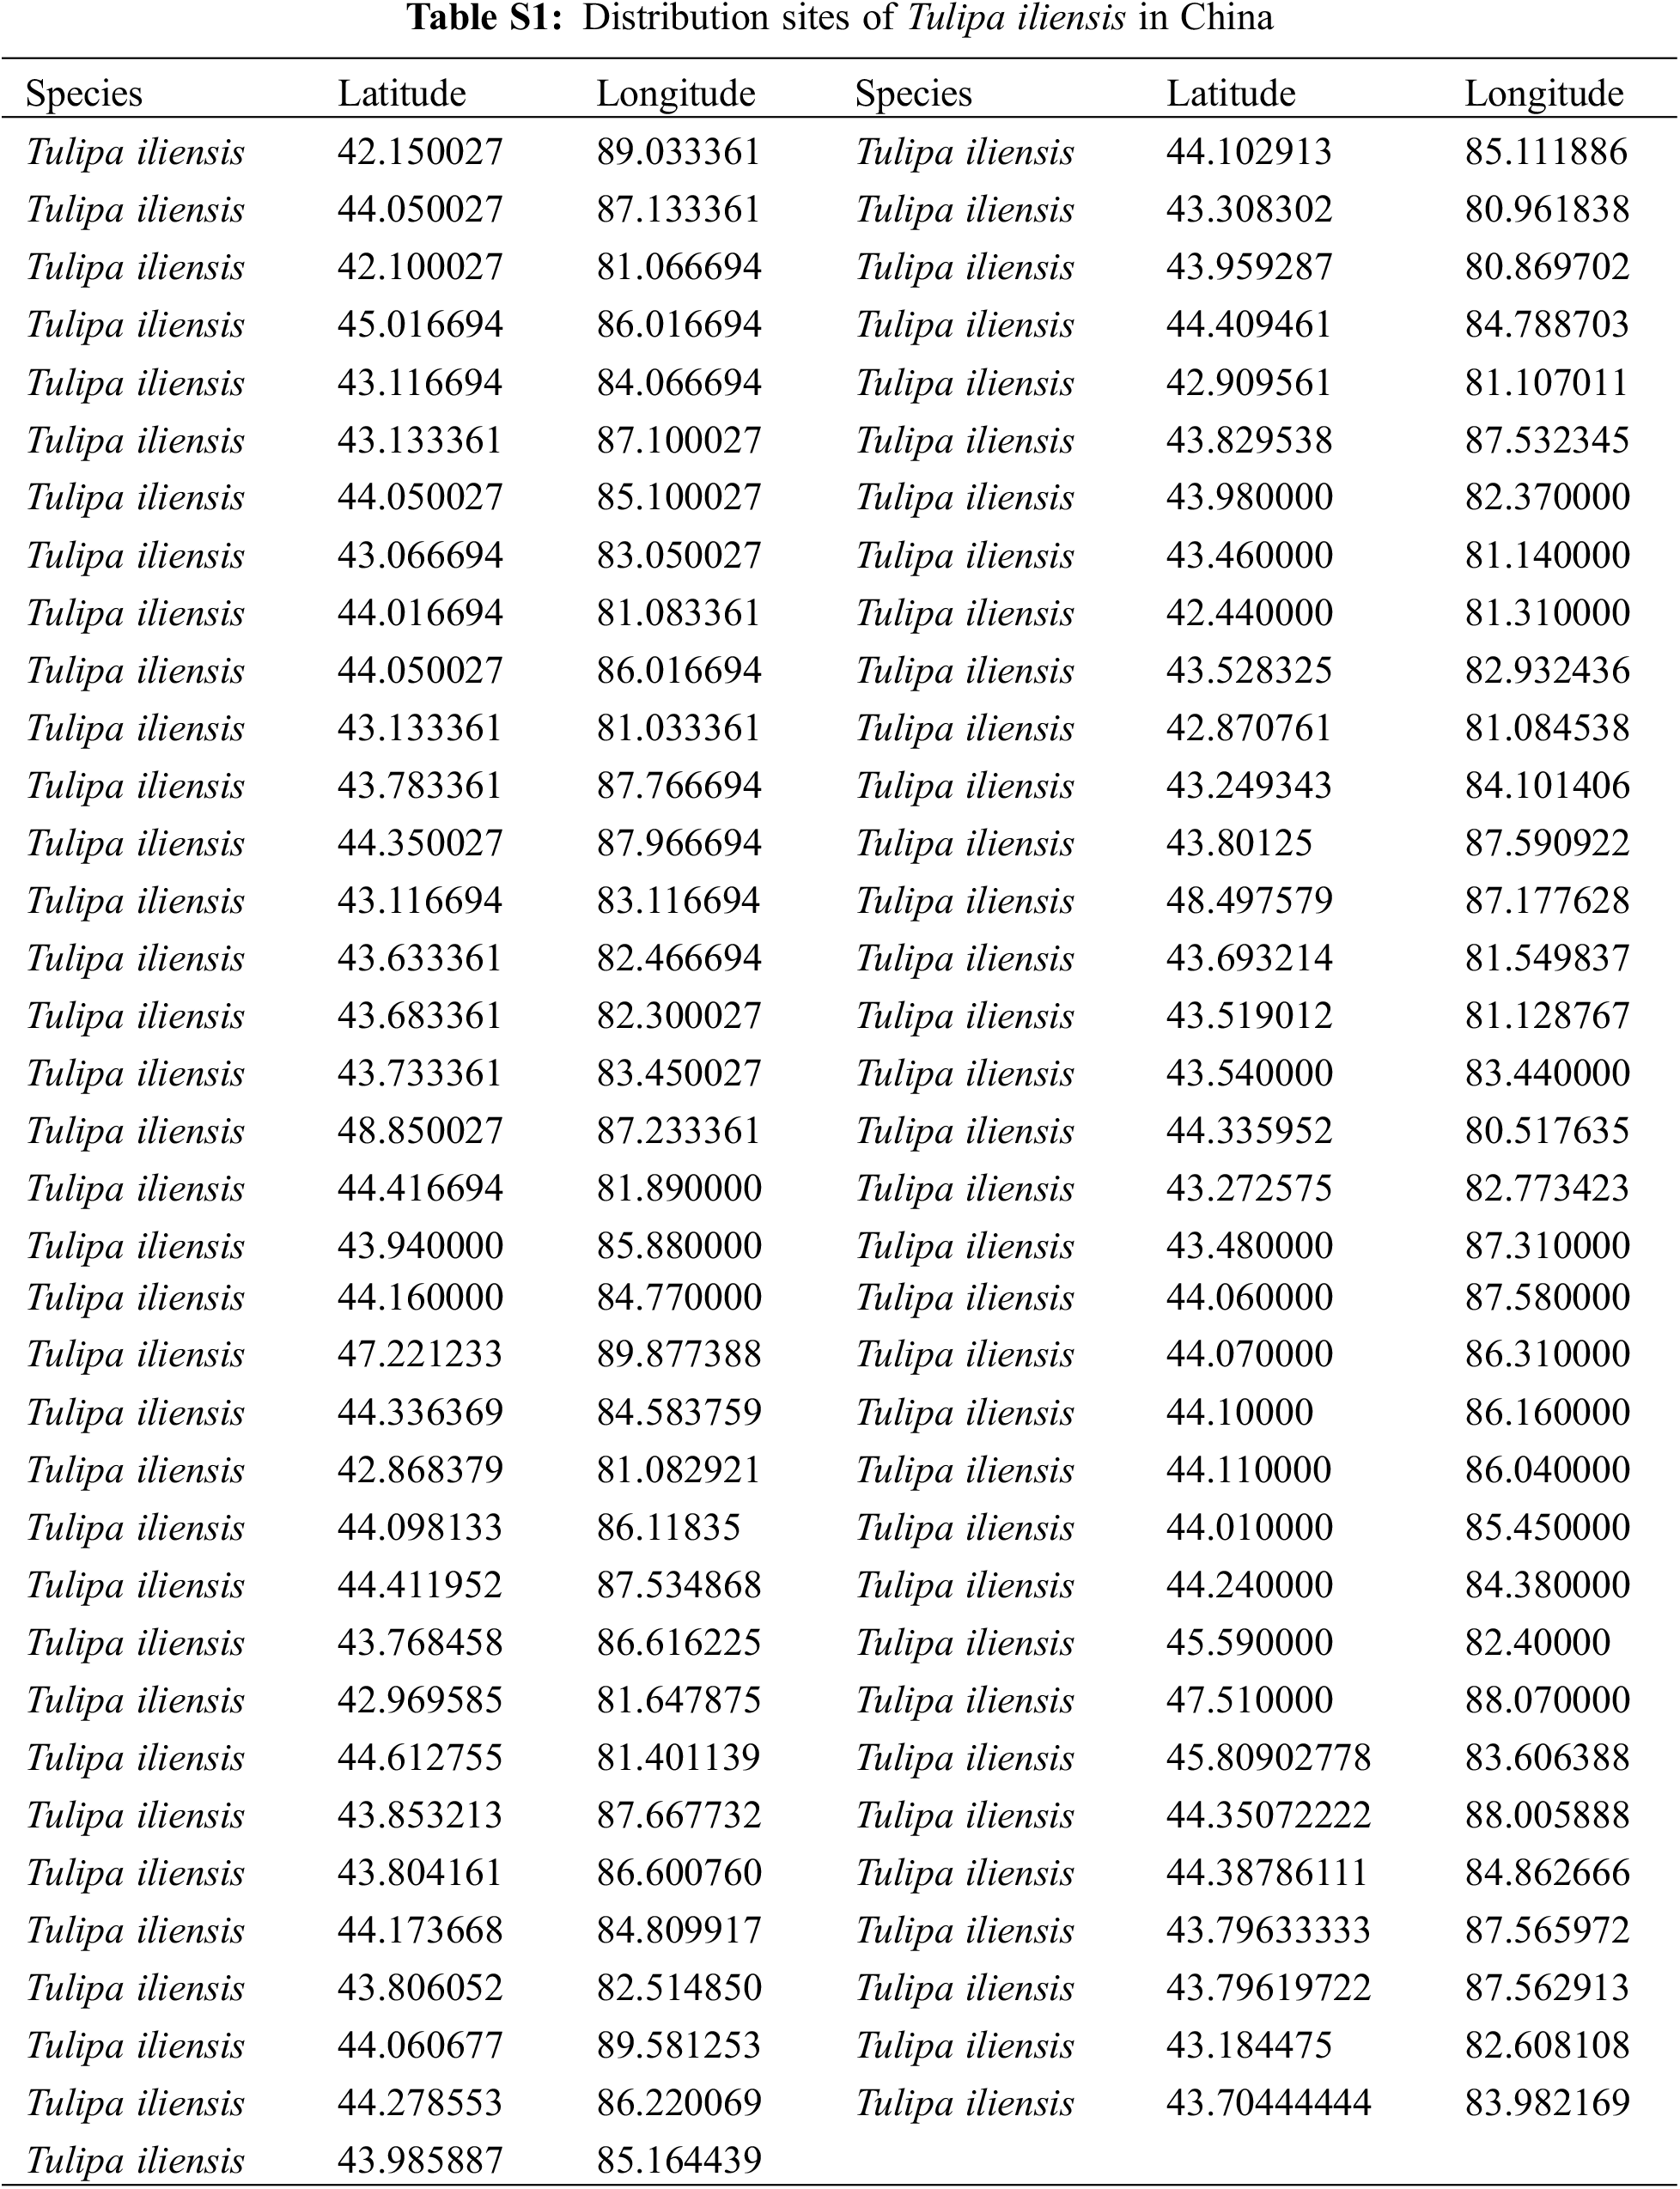
The geographical distribution data for Tulipa iliensis is primarily sourced from the Chinese Virtual Herbarium (https://www.cvh.ac.cn), the National Specimen Information Infrastructure (http://www.nsii.org.cn/2017/home.php), the Global Biodiversity Information Facility (https://doi.org/10.15468/dl.utfvy5), as well as field survey and literature records. All sampling points that did not have pictures, had unclear information or were duplicates were eliminated from the distribution records of Tulipa iliensis. Data was collected from a total of 71 sites (Table S1), and a species distribution map for Tulipa iliensis was created using ArcGIS 10.8 software (Fig. 1).
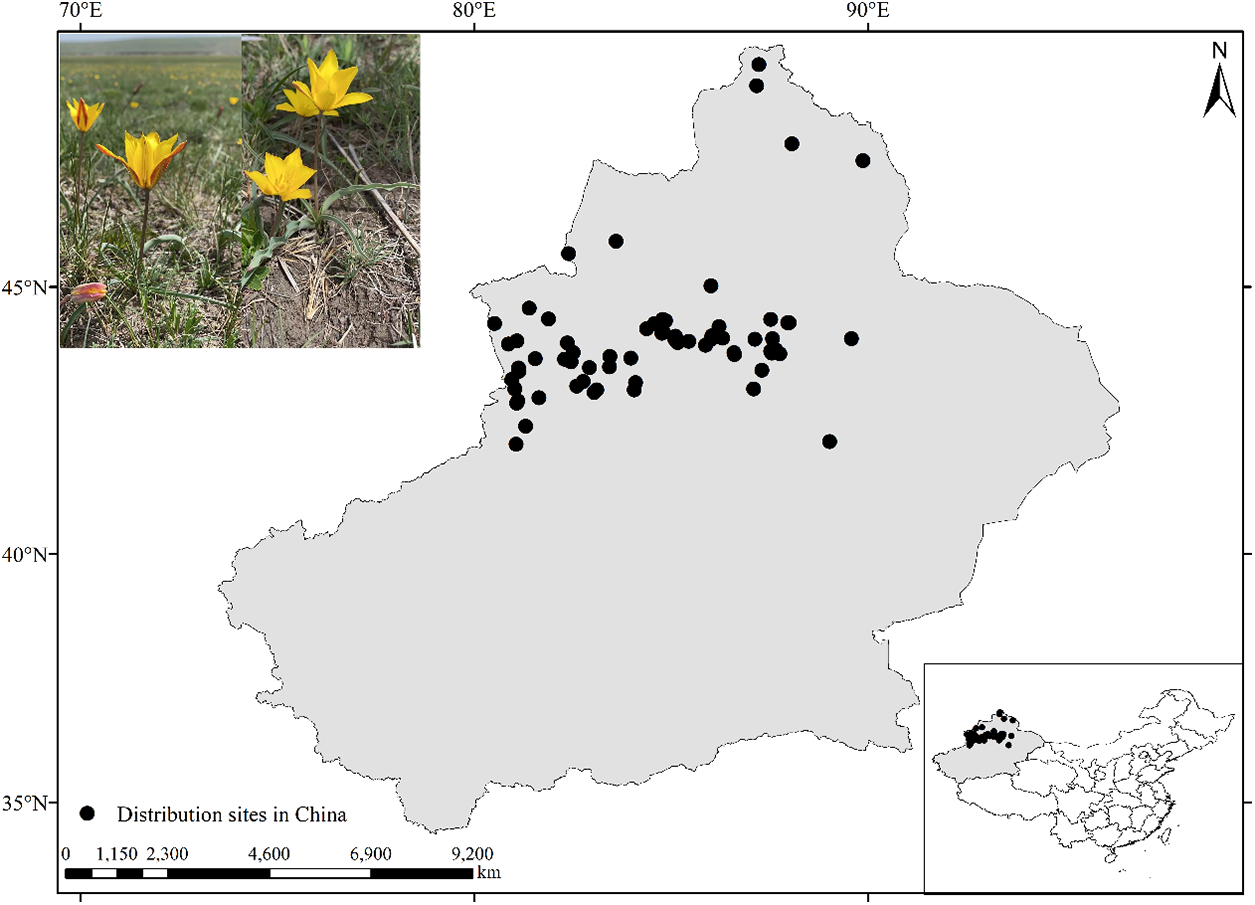
Figure 1: Distribution sites of Tulipa iliensis in China
2.2 Data Sources and Preprocessing of Environment Variables
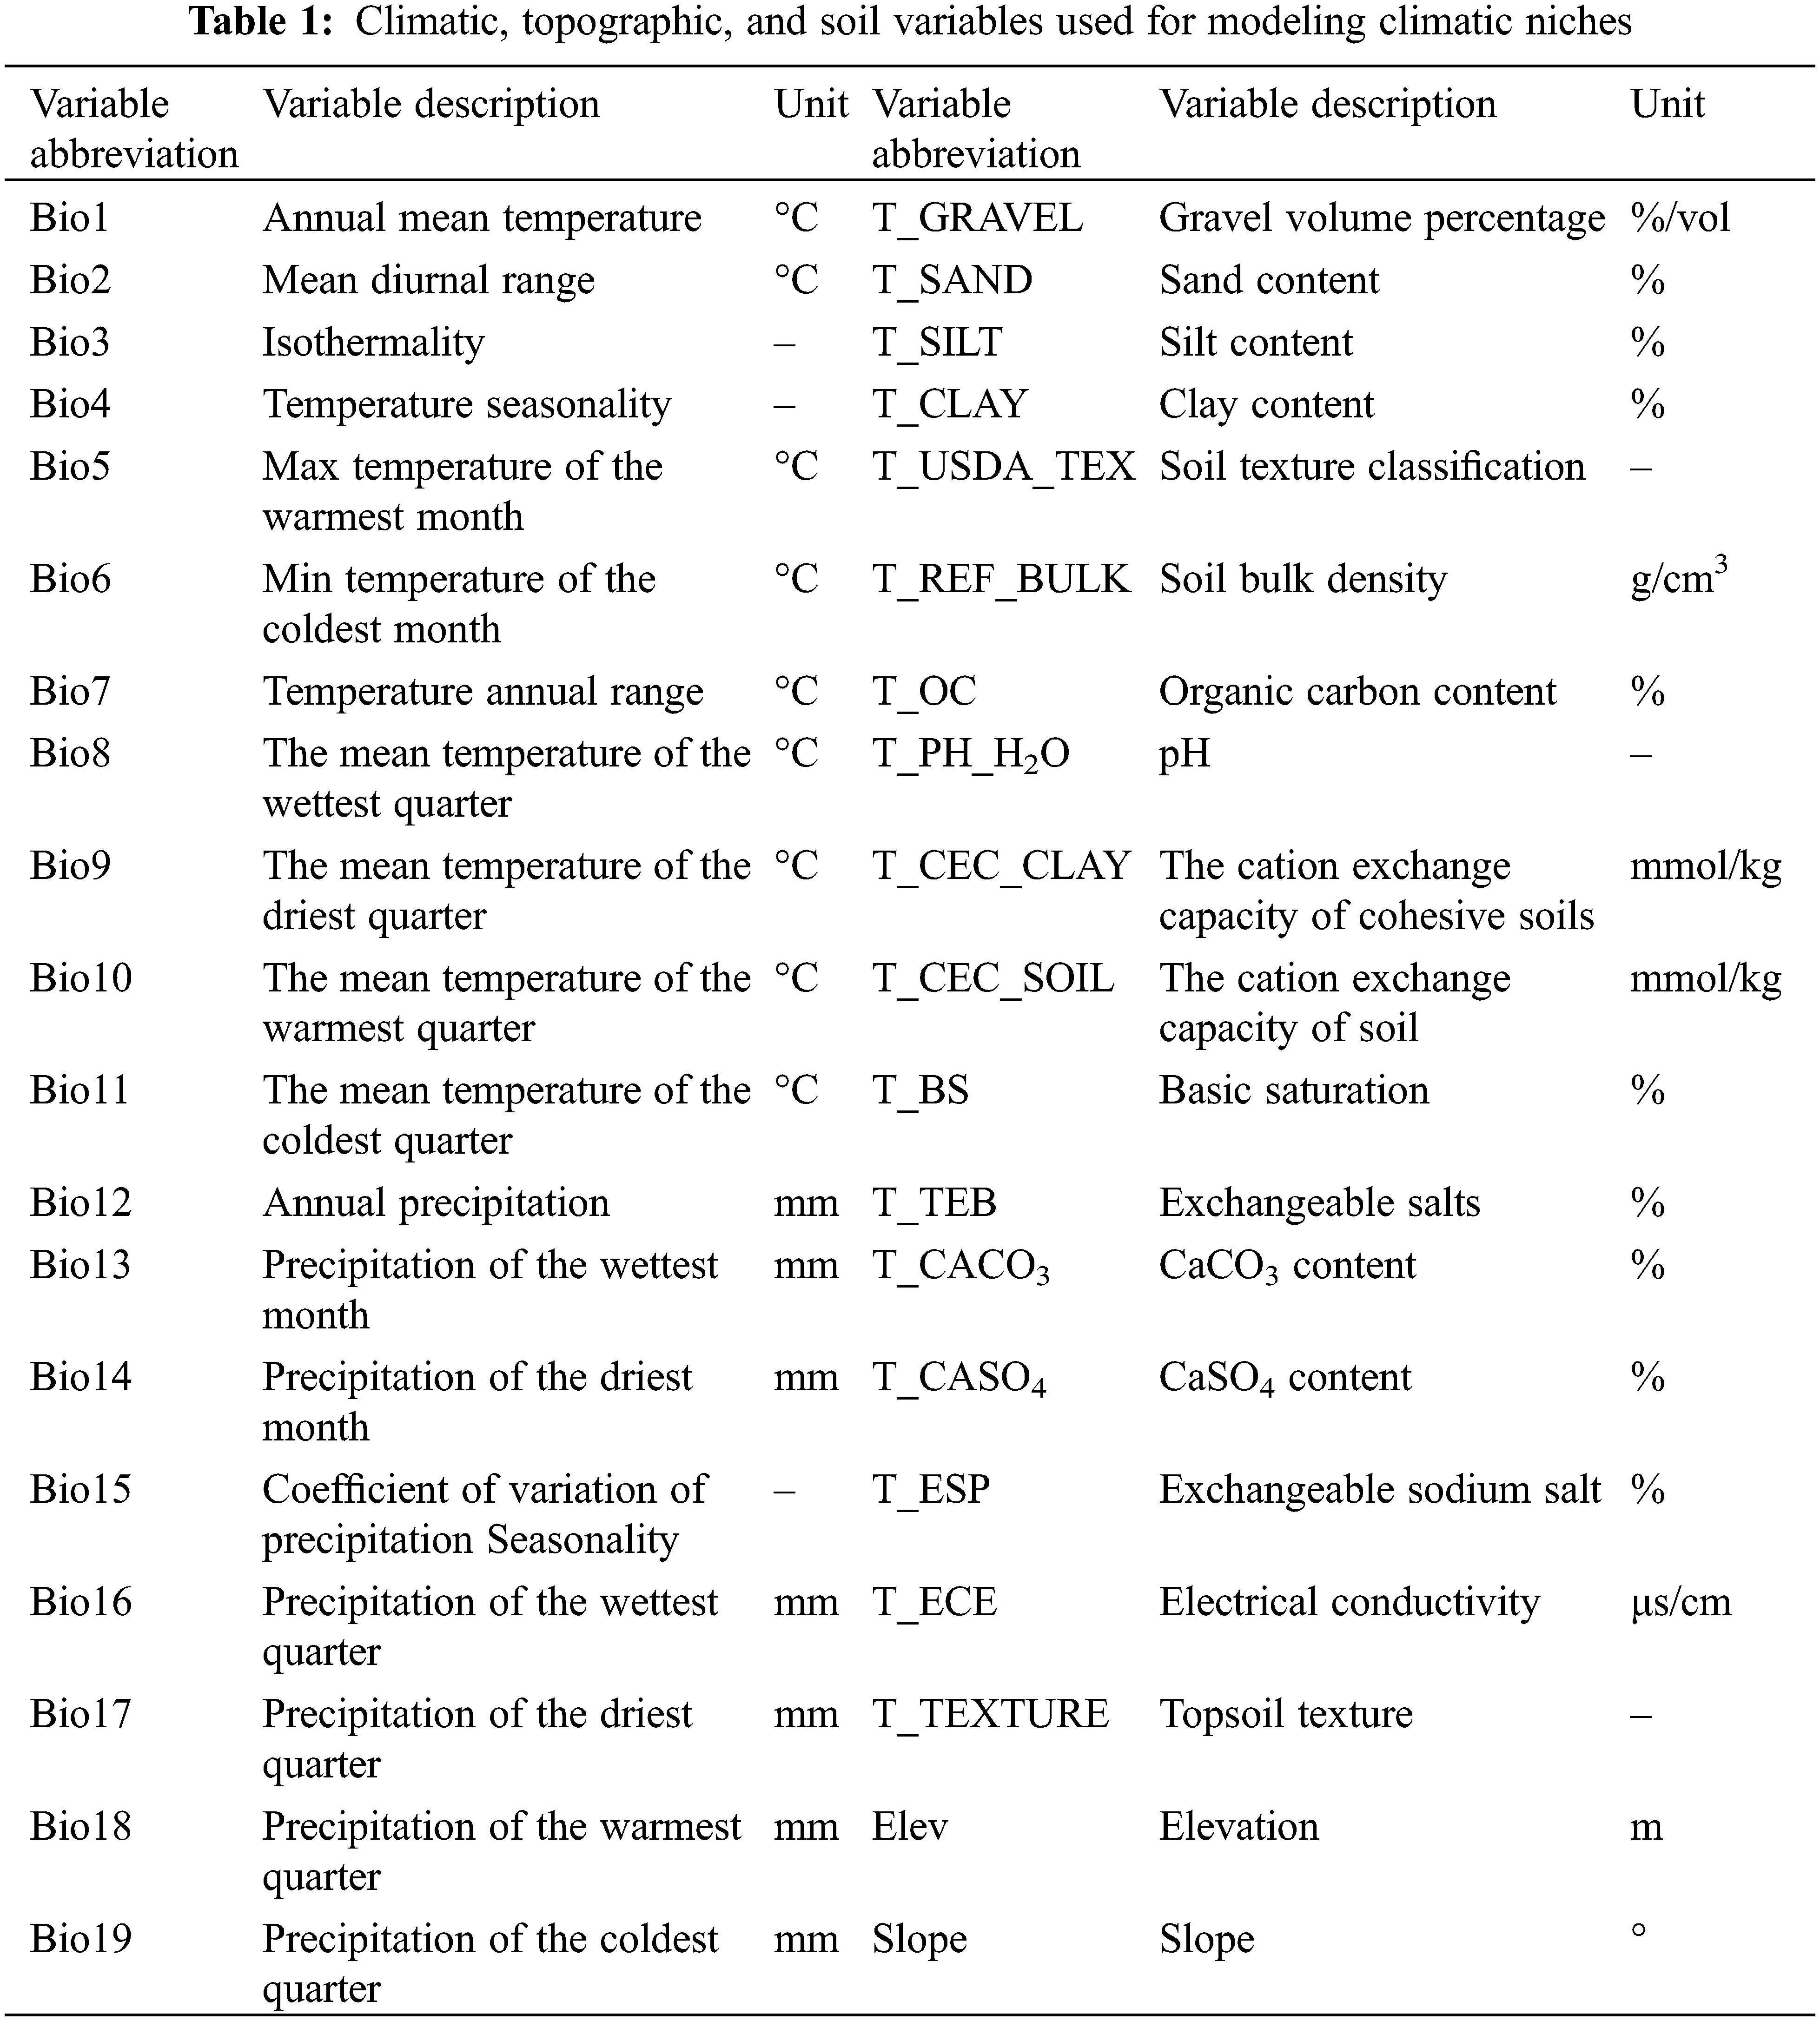
This study selected a total of 38 environmental variables, including 19 climate variables, 17 soil variables, and 2 topographic variables, to predict the potential distribution of Tulipa iliensis (Table 1), Aspect was not selected as an environmental variable in this study, because “Aspect” is measured in degree, However, the modeling method does not understand that some two different values represent the same meaning, for example, 360° and 0° represent the same value, north [36,37]. Data on three paleoclimatic scenarios (Last-inter-glacial, Last-Glacial-Maximum, Mid-Holocene), current and future climate variables were obtained from the WorldClim 1.4 and WorldClim 2.0 databases (https://www.worldclim.org), with spatial resolutions of 30″ and 2.5′, respectively; Soil variables were extracted from the Harmonized World Soil Database v1.2 (https://www.fao.org). The upper soil properties (0–30 cm) were used and 17 soil variables were selected at a spatial resolution of 30″. The Worldclim2.1 World Climate Database (https://www.worldclim.org) is the source of the topographic data, with a spatial resolution of 2.5′.
In the CMIP 6 scenarios, the BCC-CSM2-MR model will be used to make predictions about future climate. These predictions will be based on the shared economic pathways of SSP126, SSP245, SSP370, and SSP585 [38,39]. Due to limitations in the data available, Historical soil and topographic factor data will serve to forecast the appropriateness of upcoming distribution. A total of 38 environmental variables related to climate, soil, and topography will be combined with the coordinates, layer boundaries, resolution, and grid size of the data mentioned above.
When utilizing the MaxEnt3.4.4 model to import 38 environmental variables for species modeling, it has been observed that the variables have similar effects on the species distribution pattern. To prevent overfitting and avoid the model results from being affected, it is essential to screen the environmental variables [40]. We utilized ENMTools1.0.4 R package to perform a Pearson correlation study across 38 environmental factors [41]. Only those variables that maintained absolute correlation coefficients below 0.80 and demonstrated evident ecological importance were kept [42].
Geographic distribution and environmental variable data of Tulipa iliensis were imported using the MaxEnt3.4.4 model, 75% of the distribution points were made up of the training set, whereas the test set comprised the other 25%. The environmental parameter settings have been configured to use the Jackknife technique to assess how environmental factors influence the distribution of species. Response curves have been generated to determine the spectrum of species dispersal as a reaction to environmental factors. Additionally, prediction maps have been created to display the species’s range of distribution using grid images. The settings are configured to perform 10 replications, while the other settings remain at their default values. The Jackknife test is used to conduct gain tests on normalized training for a single environmental variable [43,44]. For transparency and reproducibility, we followed the “Overview, Data, Model Fitting, Assessment and Predictions” (ODMAP) protocol by Zurell et al. [45,46].
2.4 Model Evaluation and Validation
The area under the curve (AUC) of the receiver operating characteristic curve (ROC) value is used as a measure to access the level of fit of the model, regardless of the threshold, on a scale from 0 to 1. AUC values between 0.7 and 0.8 indicate relatively precise results, while values between 0.8 and 0.9 indicate high accuracy, and values between 0.9 and 1.0 indicate very high accuracy [47]. After evaluating the simulated plants, their fitting results were analyzed based on these value standards.
2.5 Evaluate the Significance of Environmental Factors and Categorize Appropriate Habitats
Import the simulation results from MaxEnt3.4.4 into ArcGIS 10.8 and convert them into raster data. Use reclassification with the Jenks’ Nature Breaks [48] for segmenting the appropriate environment for Tulipa iliensis into four distinct tiers: three for paleoclimatic and current scenarios (0~0.07 for Non-suitability, 0.07~0.25 for Low-suitability, 0.25~0.52 for Mid-suitability, 0.52~1.0 for High-suitability); future climate scenarios (0~0.04 Non-suitability, 0.04~0.18 for Low-suitability, 0.18~0.44 for Mid-suitability, 0.44~1.0 for High-suitability). Finally, calculate the distribution area for each of the four levels of suitable habitat.
2.6 Species Distribution Centroid Migration Route
The grid data of Tulipa iliensis simulated by the MaxEnt3.4.4 model was applied in the computation of the centroids of the High-suitability areas across various periods using the SDMtoolbox tool in ArcGIS 10.8. The study described the migration pattern of Tulipa iliensis and drew its dynamic migration path in suitable areas across the world by analyzing the distribution of centroids in different periods.
3.1 Preliminary Screening of Environmental Variables
After analyzing the correlations among 38 environmental factors (refer to Fig. 2), 17 specific environmental variables were ultimately chosen for the model, namely: Bio9, T_CACO3, Slope, Bio14, T_BS, Bio13, Bio19, Elev, Bio2, Bio3, T_GRAVEL, T_SAND, Bio15, T_CLAY, T_CASO4, T_ESP, T_TEB.
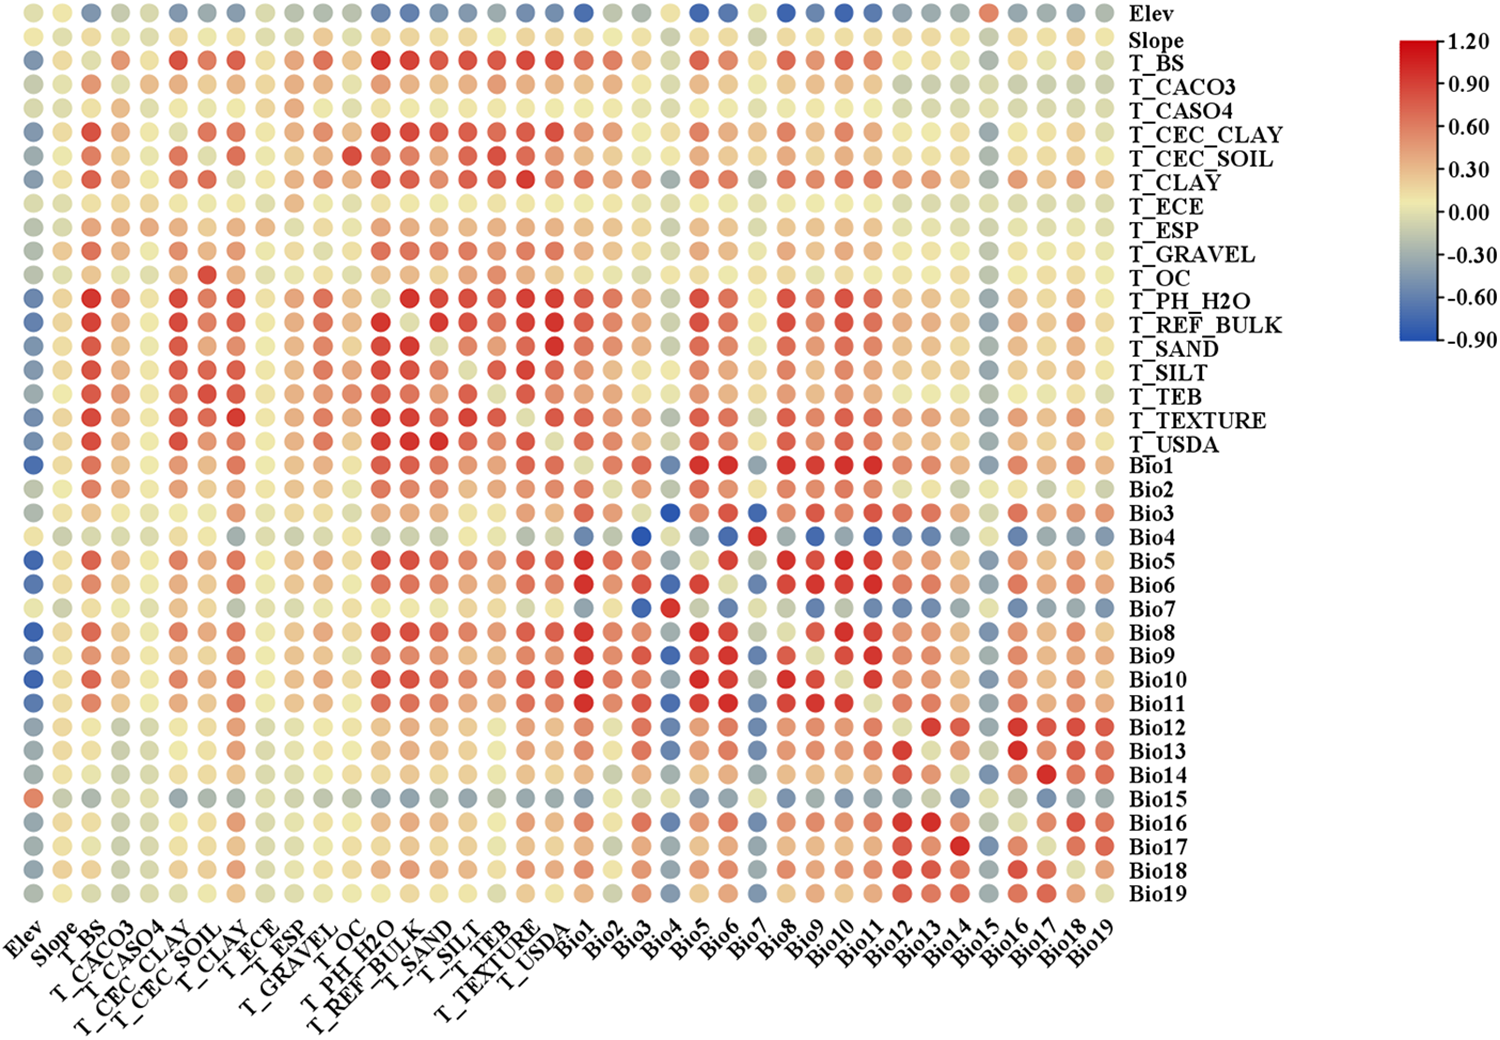
Figure 2: Correlations of 38 environmental factors
Note: Blue: correlation coefficient <0; red: correlation coefficient >0; yellow: correlation coefficient =0; The darker the shade of red or blue, the stronger the absolute value of the correlation coefficient.
3.2 Model Prediction Accuracy Evaluation
Validation results indicate that 12 model simulations have AUC values greater than 0.965 under paleoclimatic, current, and future climate scenarios (Fig. 3). According to the AUC value model accuracy assessment standard, the model exhibits an exceptionally high level of predictive precision. This suggests that the MaxEnt model provides reliable predictions of the potential suitable distribution of Tulipa iliensis. The resulting potential suitable distribution map of Tulipa iliensis is highly credible.
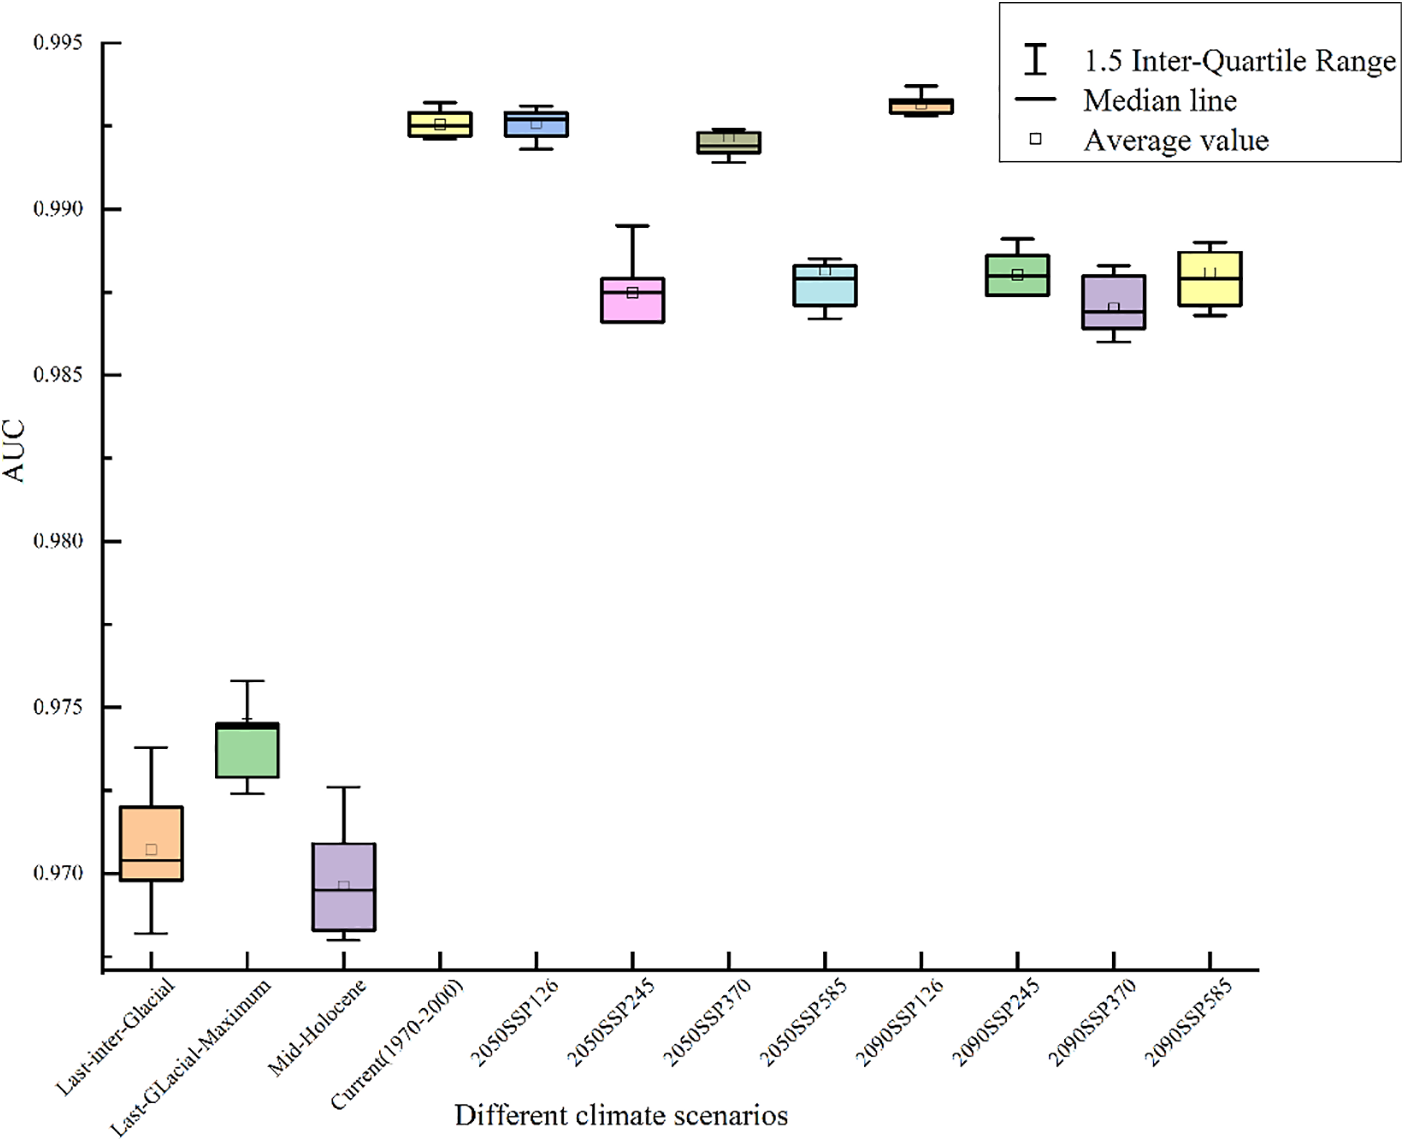
Figure 3: MaxEnt 3.4.4 predicted AUC values under multiple climate states in different periods
3.3 Analysis of Dominant Environmental Factors
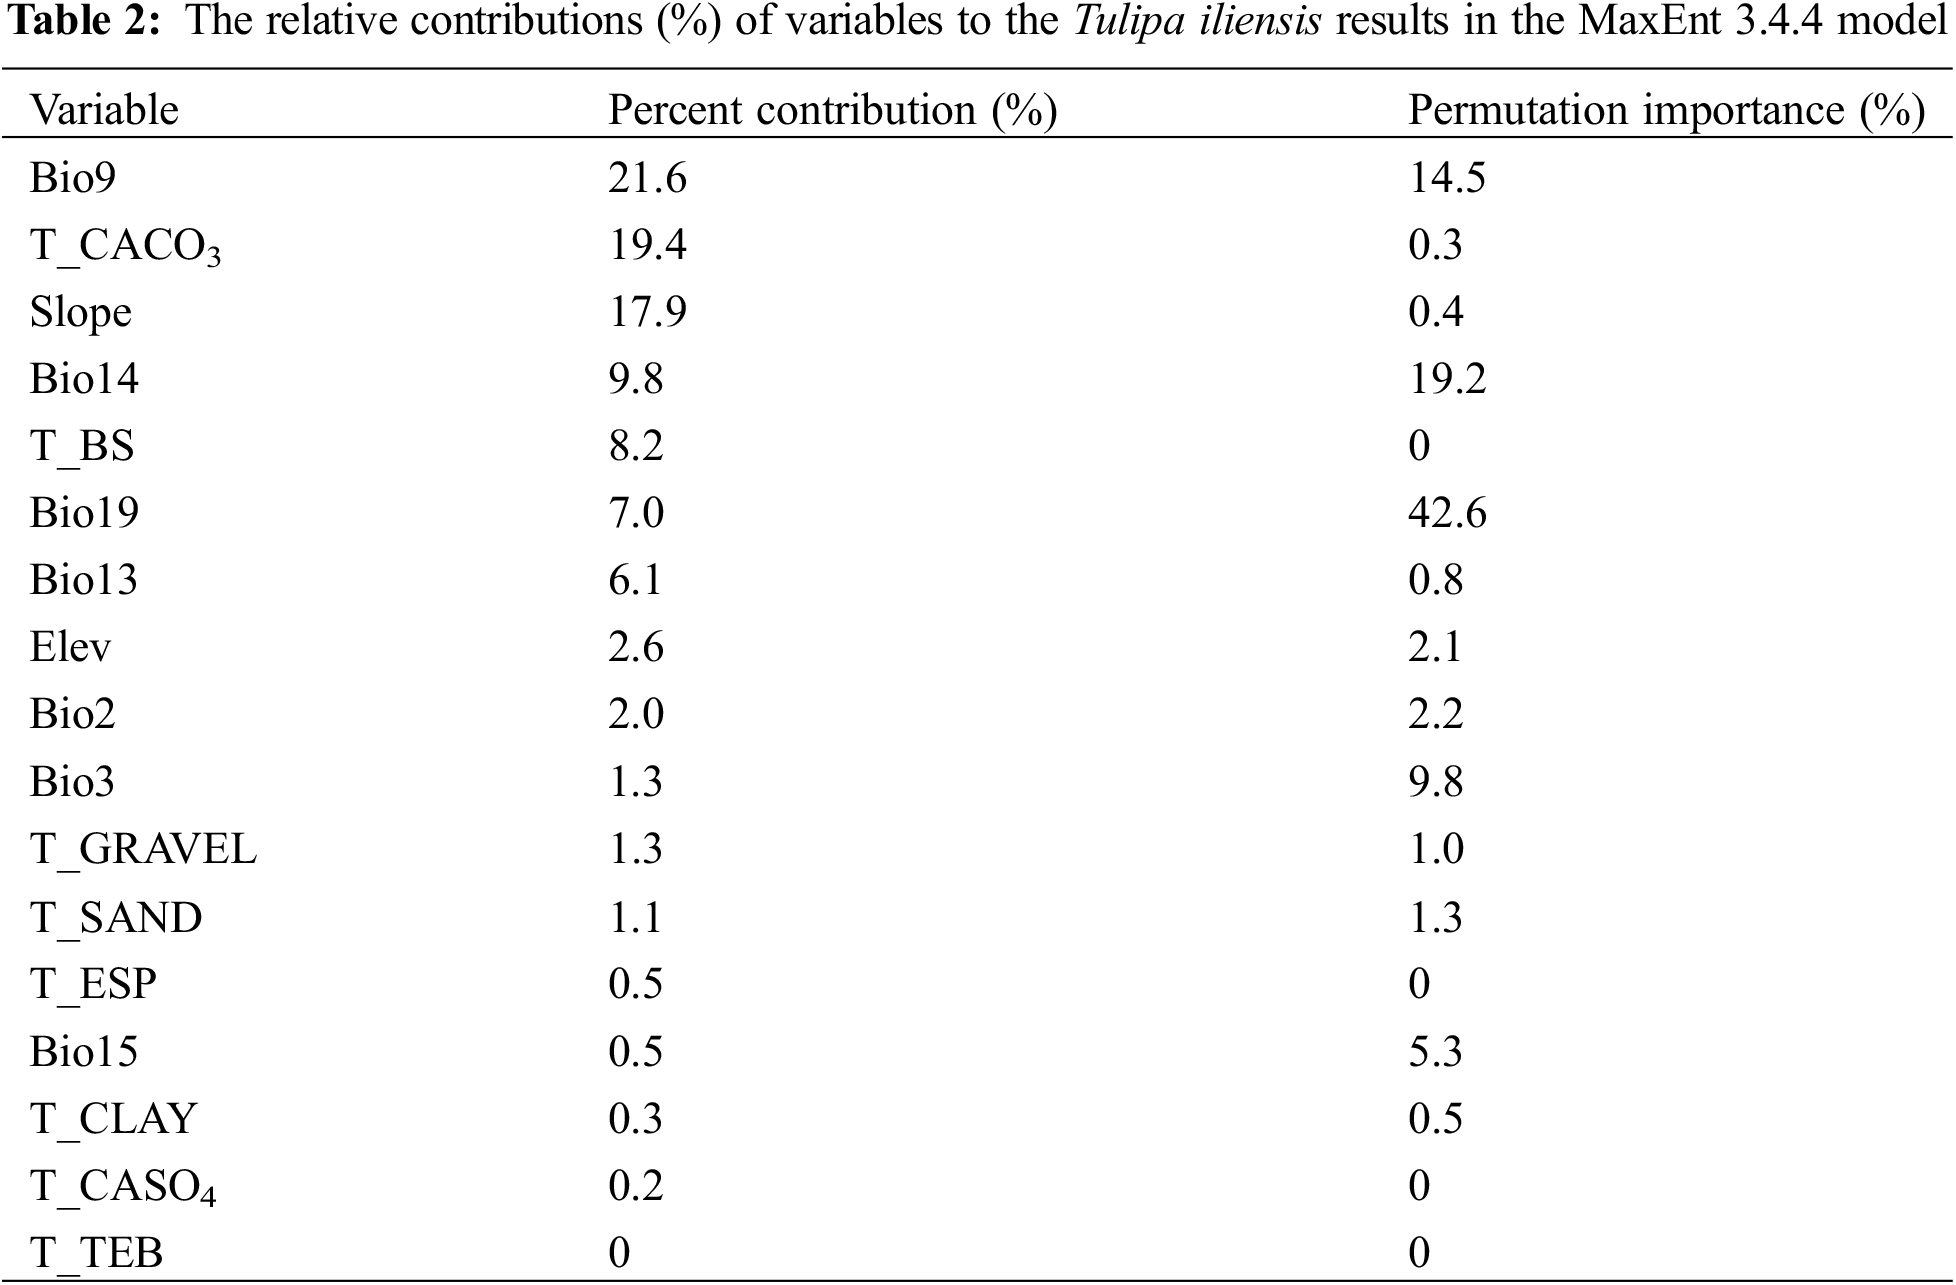
By using MaxEnt3.4.4 modeling, we were able to determine the influence of various environmental factors on the suitable distribution area of Tulipa iliensis. The analysis of the contribution rates of the top 7 environmental variables showed that: the mean temperature of the driest quarter (Bio9, 21.6%) was the largest contributing environmental variable, followed by CaCO3 content (T_CACO3, 19.4%), slope (17.9%), precipitation of the driest month (Bio14, 9.8%), basic saturation (T_BS, 8.2%), precipitation of the coldest quarter (Bio19, 7.0%), and precipitation of the wettest month (Bio13, 6.1%), and (Table 2). After normalizing training gains for 18 environmental variables, we conducted the Jackknife test to examine the results (Fig. S1). The findings indicate that the mean temperature of the driest quarter (Bio9) had the greatest impact, followed by the precipitation of the driest month (Bio14), CaCO3 content (T_CACO3), exchangeable salts (T_TEB), precipitation of the coldest quarter (Bio19), Mean diurnal range (Bio2), and slope. This analysis suggests that the Bio9, T_CACO3, slope, Bio14, T_BS, and Bio19 are the 6 dominant environmental elements impacting Tulipa iliensis distribution.
Using the MaxEnt3.4.4 model, we modeled and analyzed the contribution rates of 6 dominant environmental factors, under various climate scenarios. In the Last-inter-Glacial, Last-Glacial-Maximum, and Mid-Holocene climate scenarios, soil variables were found to be the most influential in determining the suitable distribution of Tulipa iliensis, accounting for 42.2% of the distribution, specifically, T_CACO3 was identified as the dominant environmental variable. In the current climate scenario, climate variables were found to possess the most significant effect on the appropriate spread of Tulipa iliensis, accounting for 48.6% of the contribution, with Bio9 being the dominant environmental variable. Looking ahead to the future scenarios of 2050 under SSP126, SSP245, SSP370, and SSP585, climate variables were still found to be the most influential, accounting for 48.4%, 48.1%, 47.1%, and 48%, respectively, Bio9 remained the dominant environmental variable. Similarly, In the future scenarios of 2090 under SSP126, SSP245, SSP370, and SSP585, climate variables continued to have the greatest impact, accounting for 48.9%, 48.3%, 46.9%, and 48.3%, respectively, however, in the SSP585 scenario, T_CACO3 was identified as the dominant environmental variable (Fig. 4).
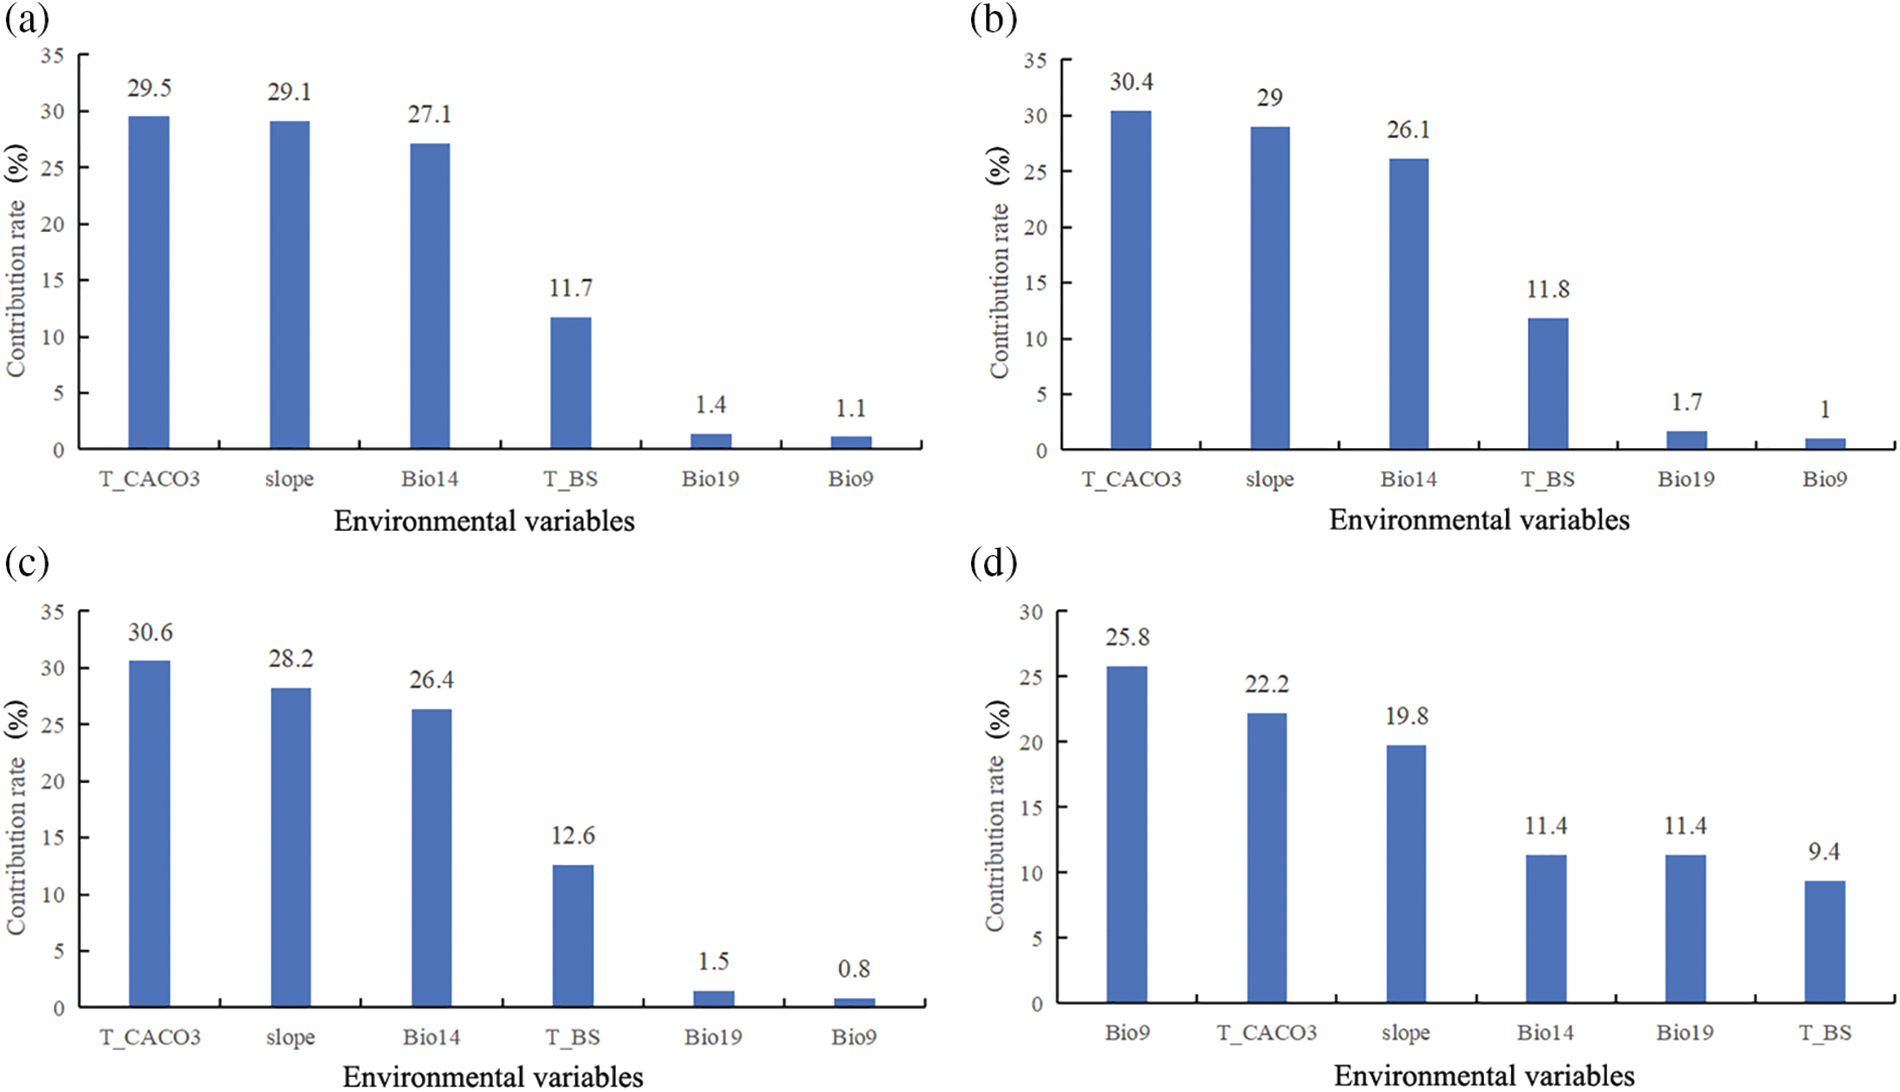
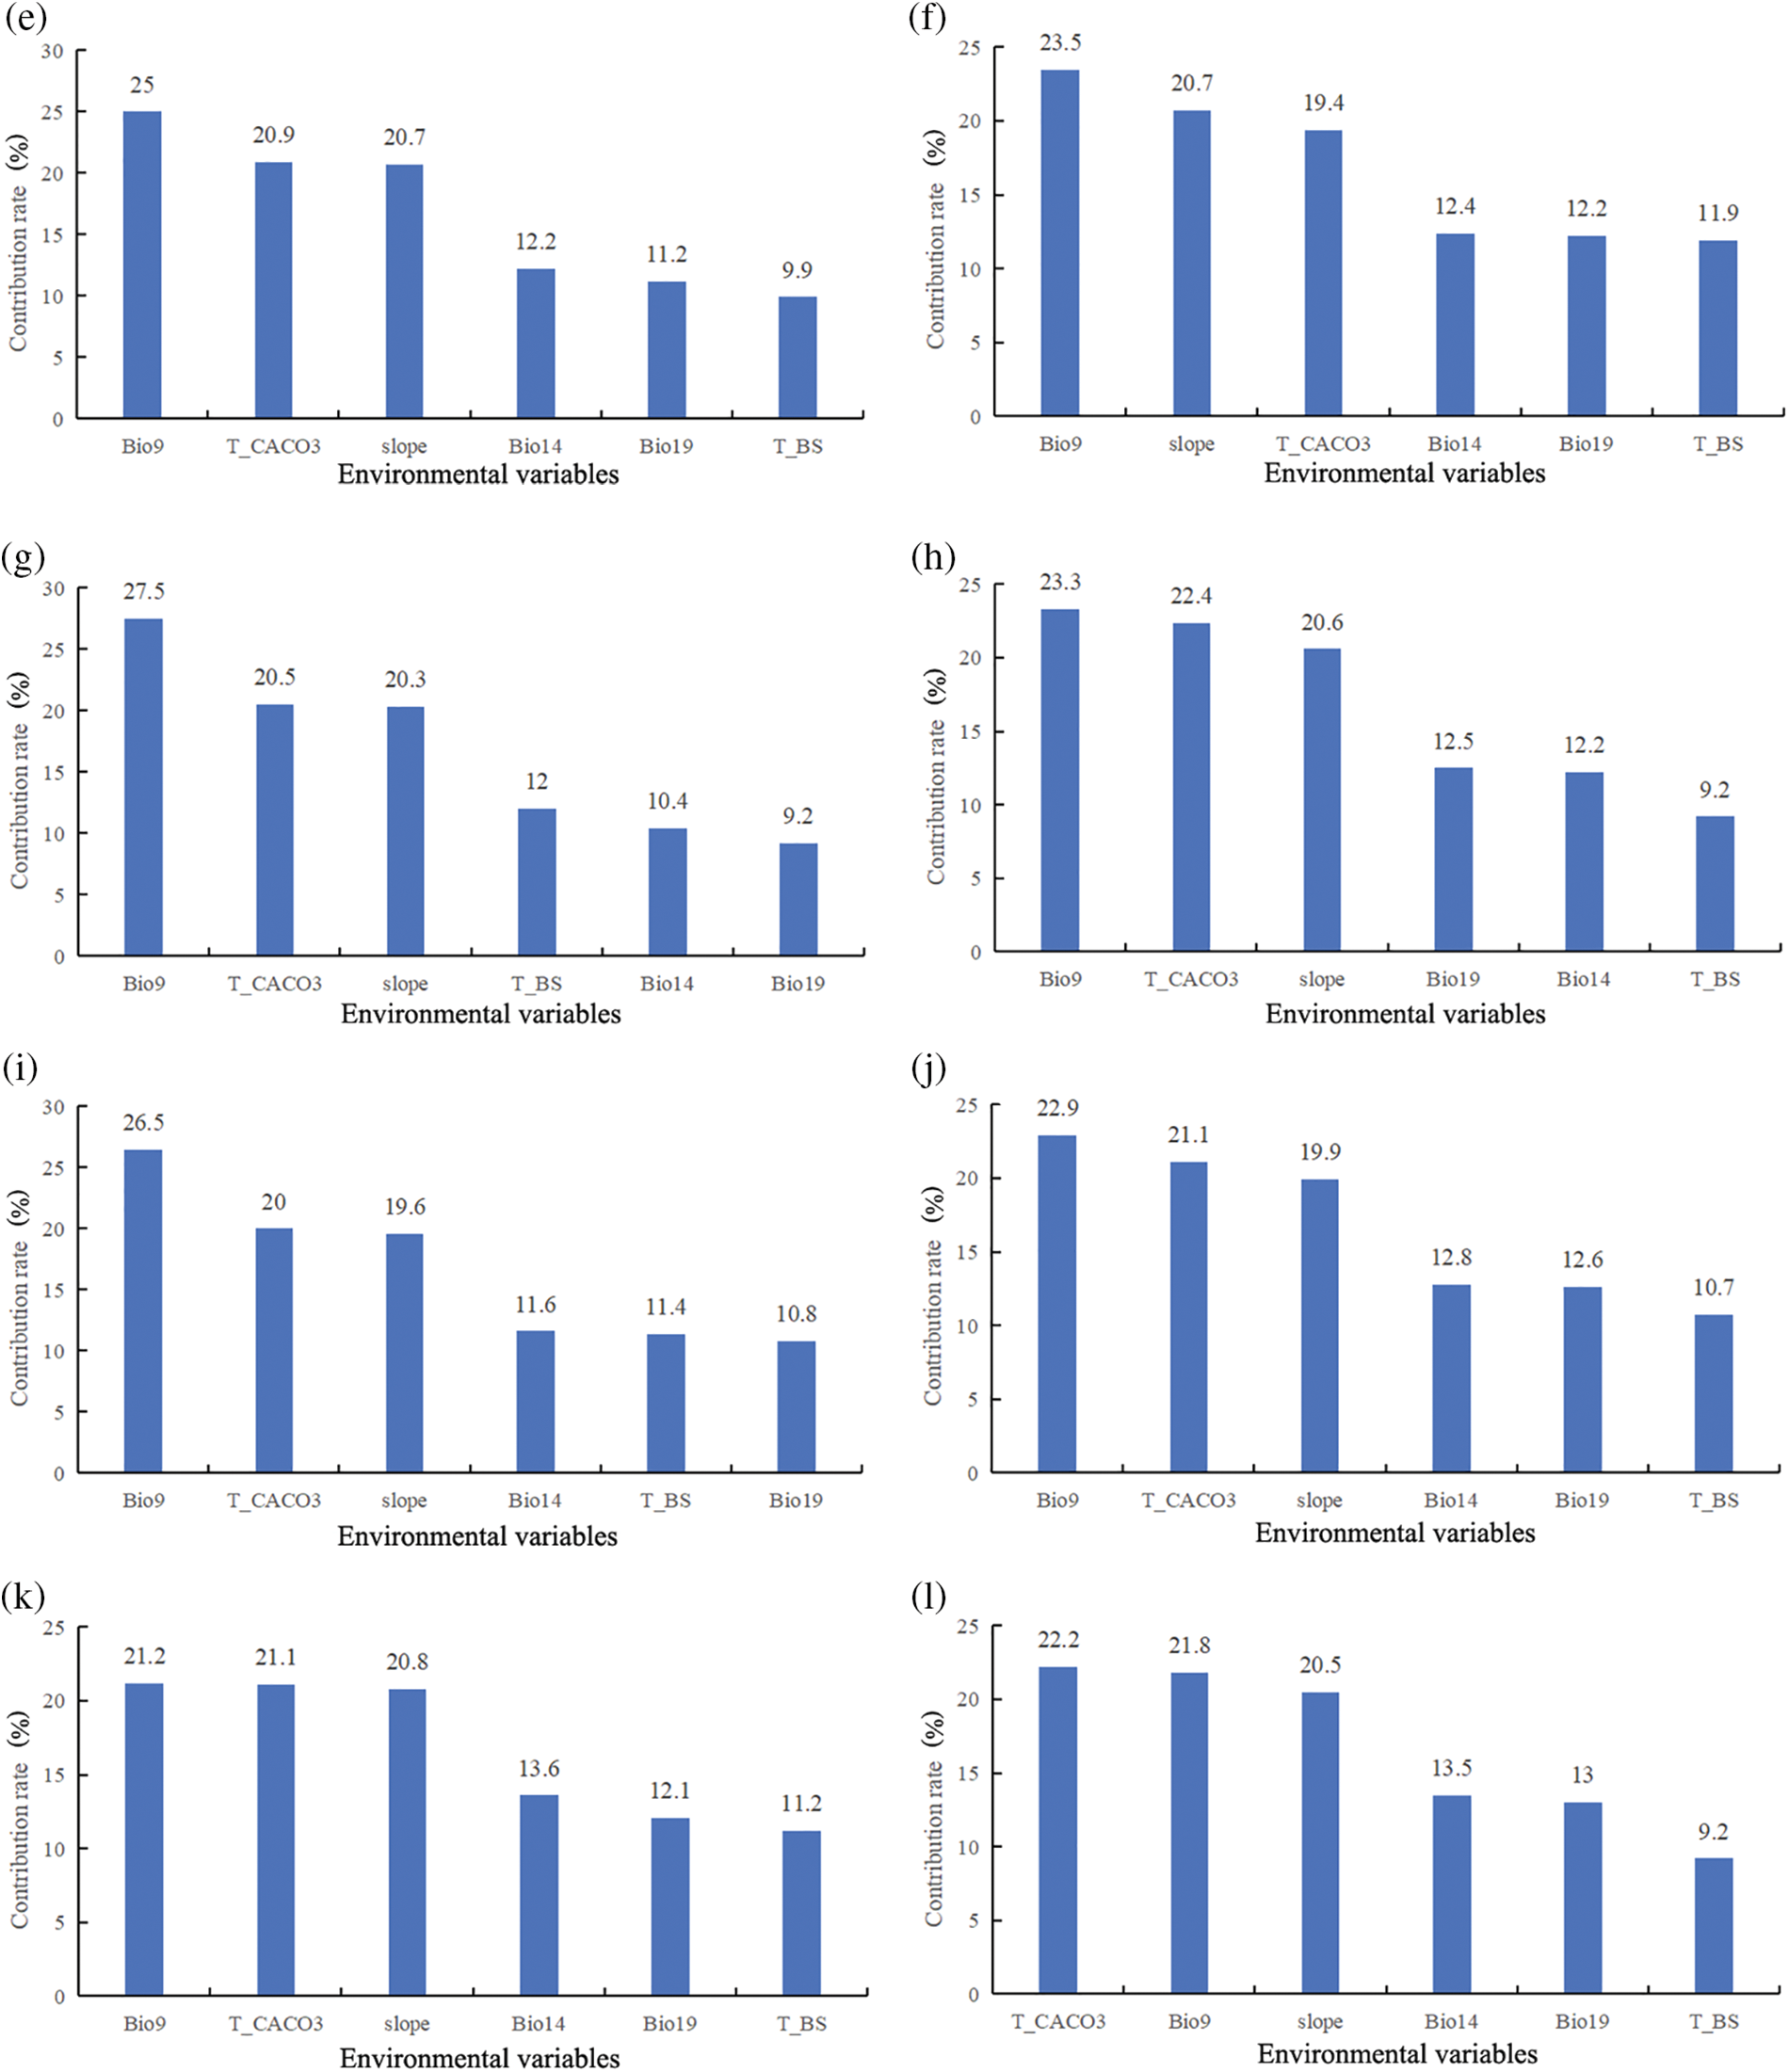
Figure 4: Contribution of different environmental variables in climate scenarios in different periods. (a). Last-inter-Glacial; (b). Last-Glacial-Maximum; (c). Mid-Holocene; (d). Current (1970–2000) (e). 2050SSP126; (f). 2050SSP245; (g). 2050SSP370; (h). 2050SSP585; (i). 2090SSP126; (j). 2090SSP245; (k). 2090SSP370; (l). 2090SSP585
Under the 12 climate scenarios, the climatic factors greatly influencing Tulipa iliensis’s possible distribution, the mean temperature of the driest quarter (Bio9), precipitation of the driest month (Bio14), and precipitation of the coldest quarter (Bio19), these variables were found to be dominant during the paleoclimatic climate scenarios. In the current and future climate scenarios of 2050 (SSP126, SSP245, SSP370, SSP585) and 2070 (SSP126, SSP245, SSP585), the mean temperature of the driest quarter (Bio9) remained the dominant environmental variable. However, in the 2070 SSP245 and SSP585 scenarios, the precipitation of the driest month (Bio14) became the dominant environmental variable (Fig. 5).
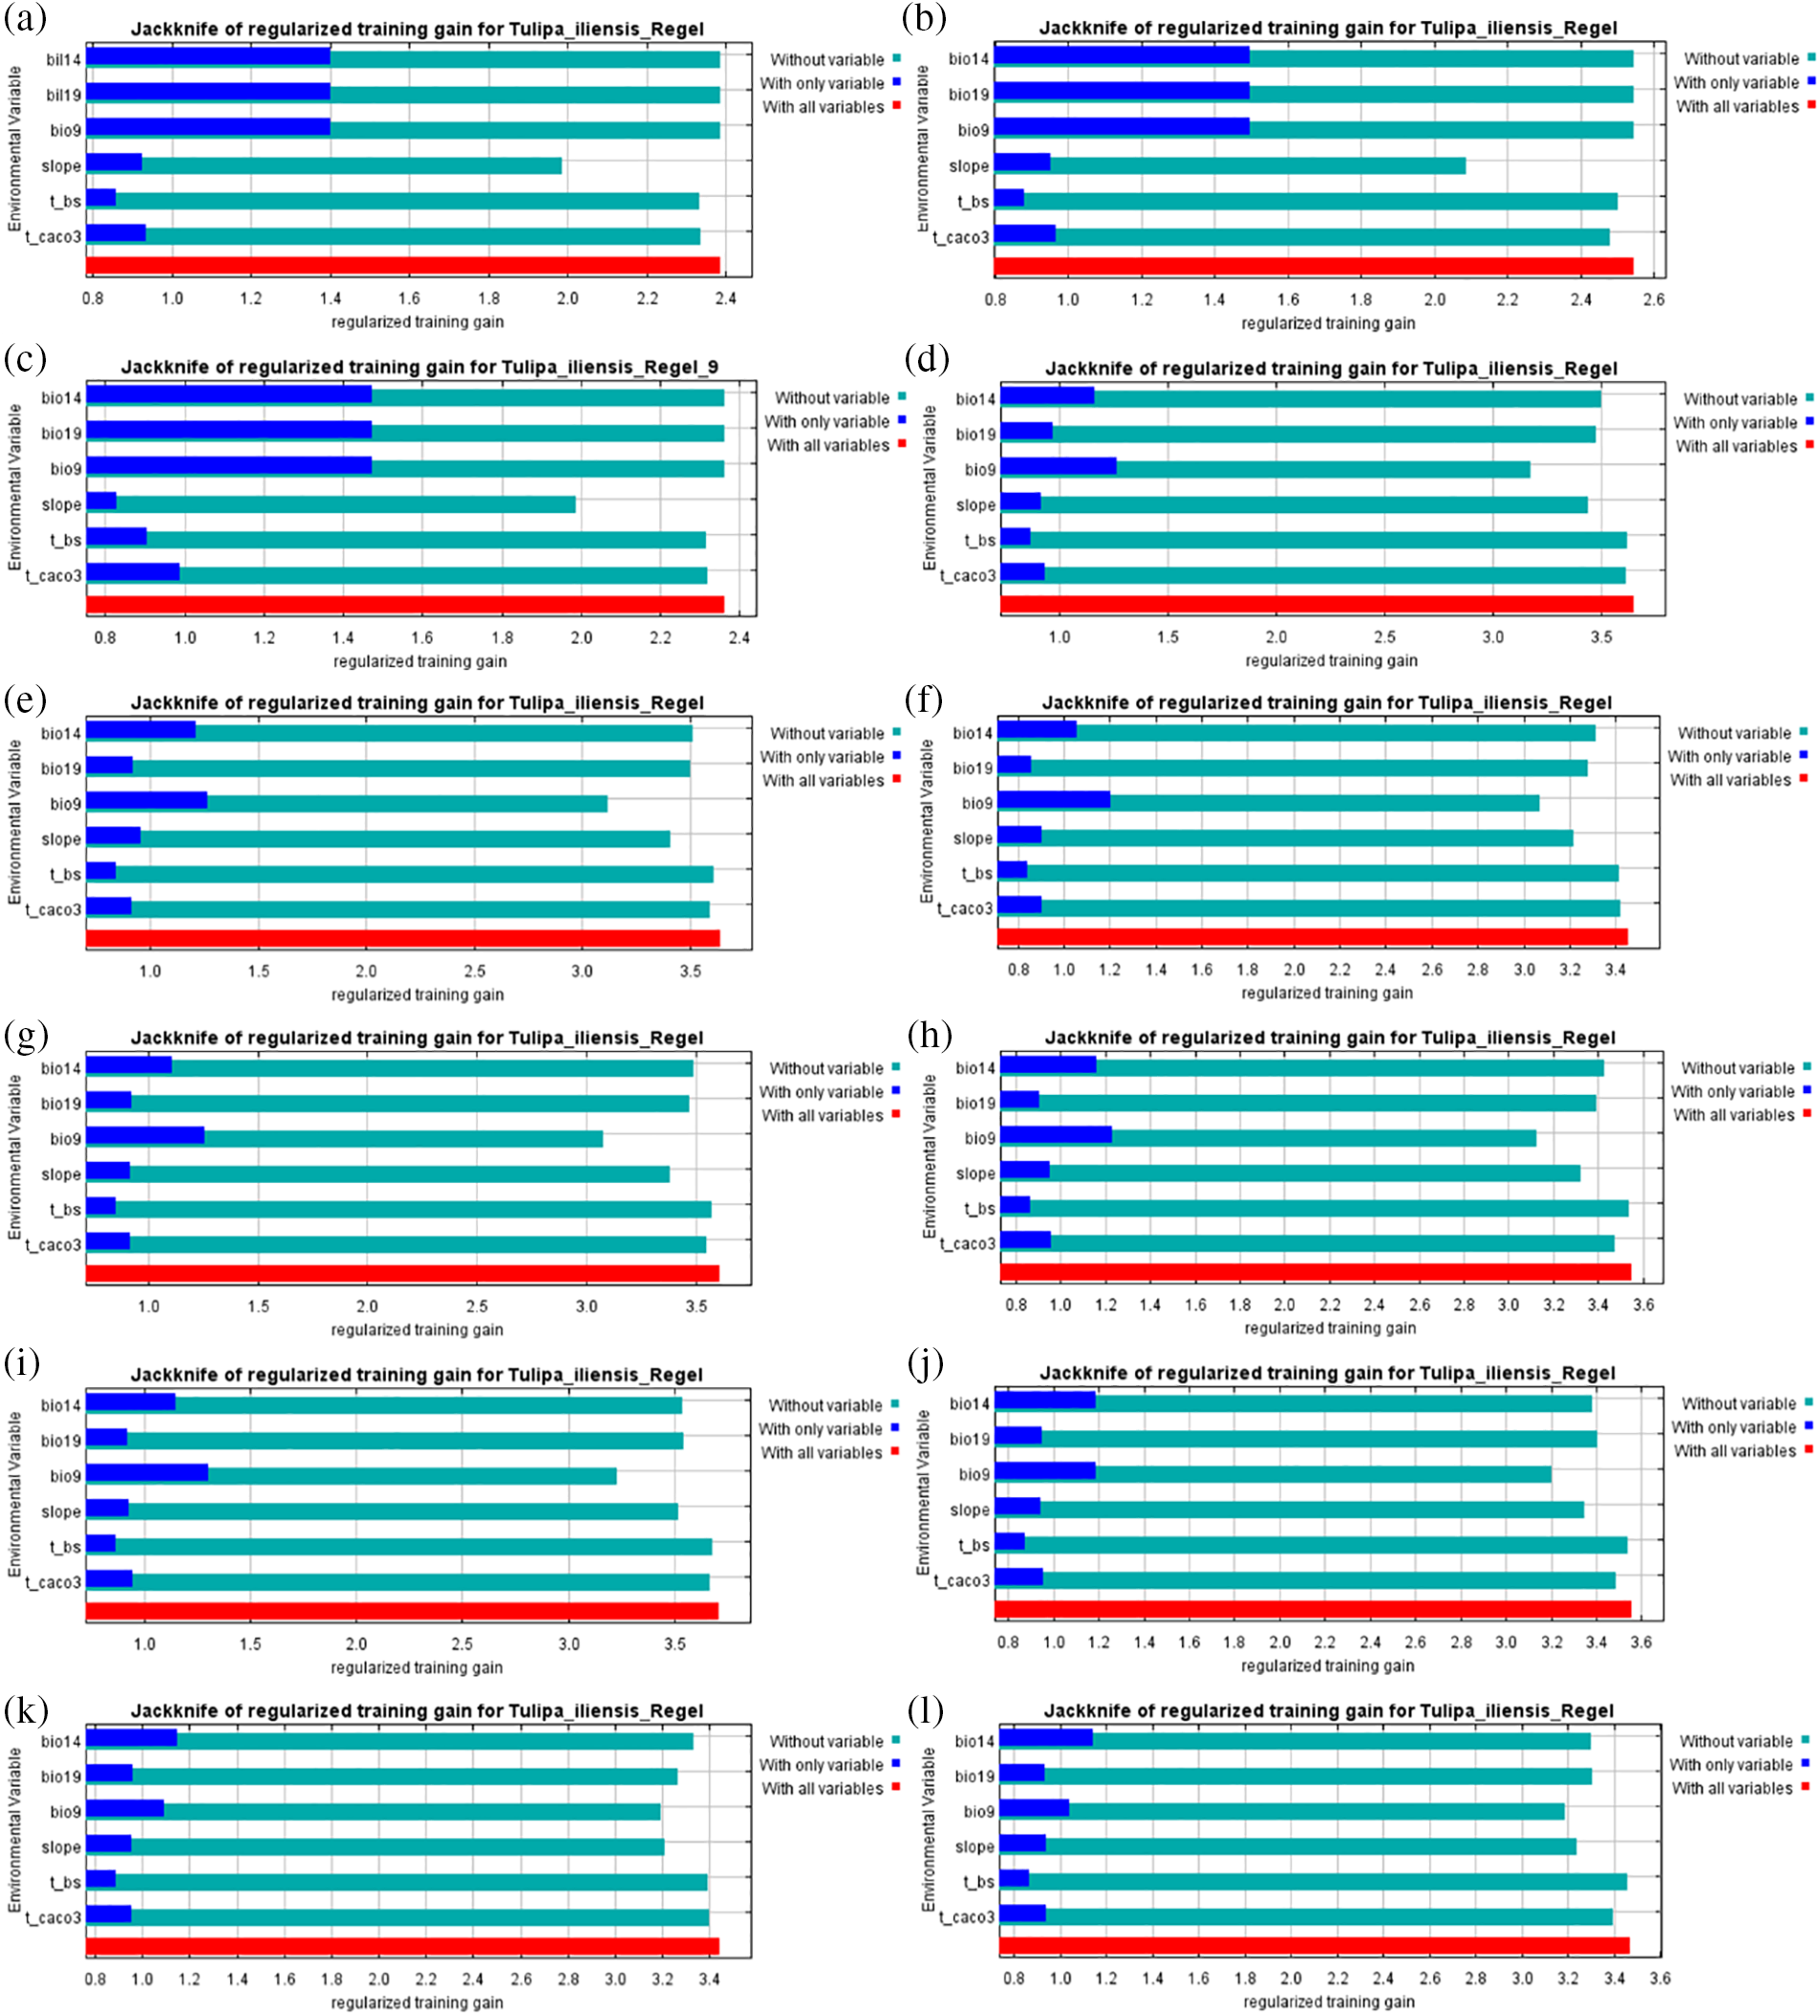
Figure 5: Single variable regularized training gain in climate scenarios in different periods. (a). Last-inter-Glacial; (b). Last-Glacial-Maximum; (c). Mid-Holocene; (d). Current (1970–2000); (e). 2050SSP126; (f). 2050SSP245; (g). 2050SSP370; (h). 2050SSP585; (i). 2090SSP126; (j). 2090SSP245; (k). 2090SSP370; (l). 2090SSP585
3.4 Dominant Environmental Variable Response Range
The MaxEnt3.4.4 model is capable of generating response curves to statistically analyze the range of changes in various environmental variables and determine the probability of species suitability within that range. By utilizing the univariate model response curve, we can gain a clearer understanding of how environmental variables impact the distribution of Tulipa iliensis.
Within a certain range, as the values of these 6 environmental variables increase, the probability of the existence of Tulipa iliensis gradually increases, reaching a peak, and then gradually decreases with further increases in variable values. The suitable range for the mean temperature of the driest quarter (Bio9) is −14.63~−8.07°C, with an optimum value of −11.35°C; the suitable range for CaCO3 content (T_CACO3) is 0.53–23.71 g/mol, with an optimum value of 7.91 g/mol; the suitable range for slope (slope) is 0.92–10.10°, with an optimum value of 3.55°; the suitable range for precipitation of the driest month (Bio14) is 3.04~7.39 mm, with an optimum value of 3.43 mm; Tulipa iliensis is suitable for growth and distribution when the basic saturation (T_BS) is greater than 99.44%, and the distribution probability is highest at 99.44%; the suitable range for precipitation of the coldest quarter (Bio19) is 11.09~25.36 mm, with the highest distribution probability at 15.85 mm (Fig. 6).
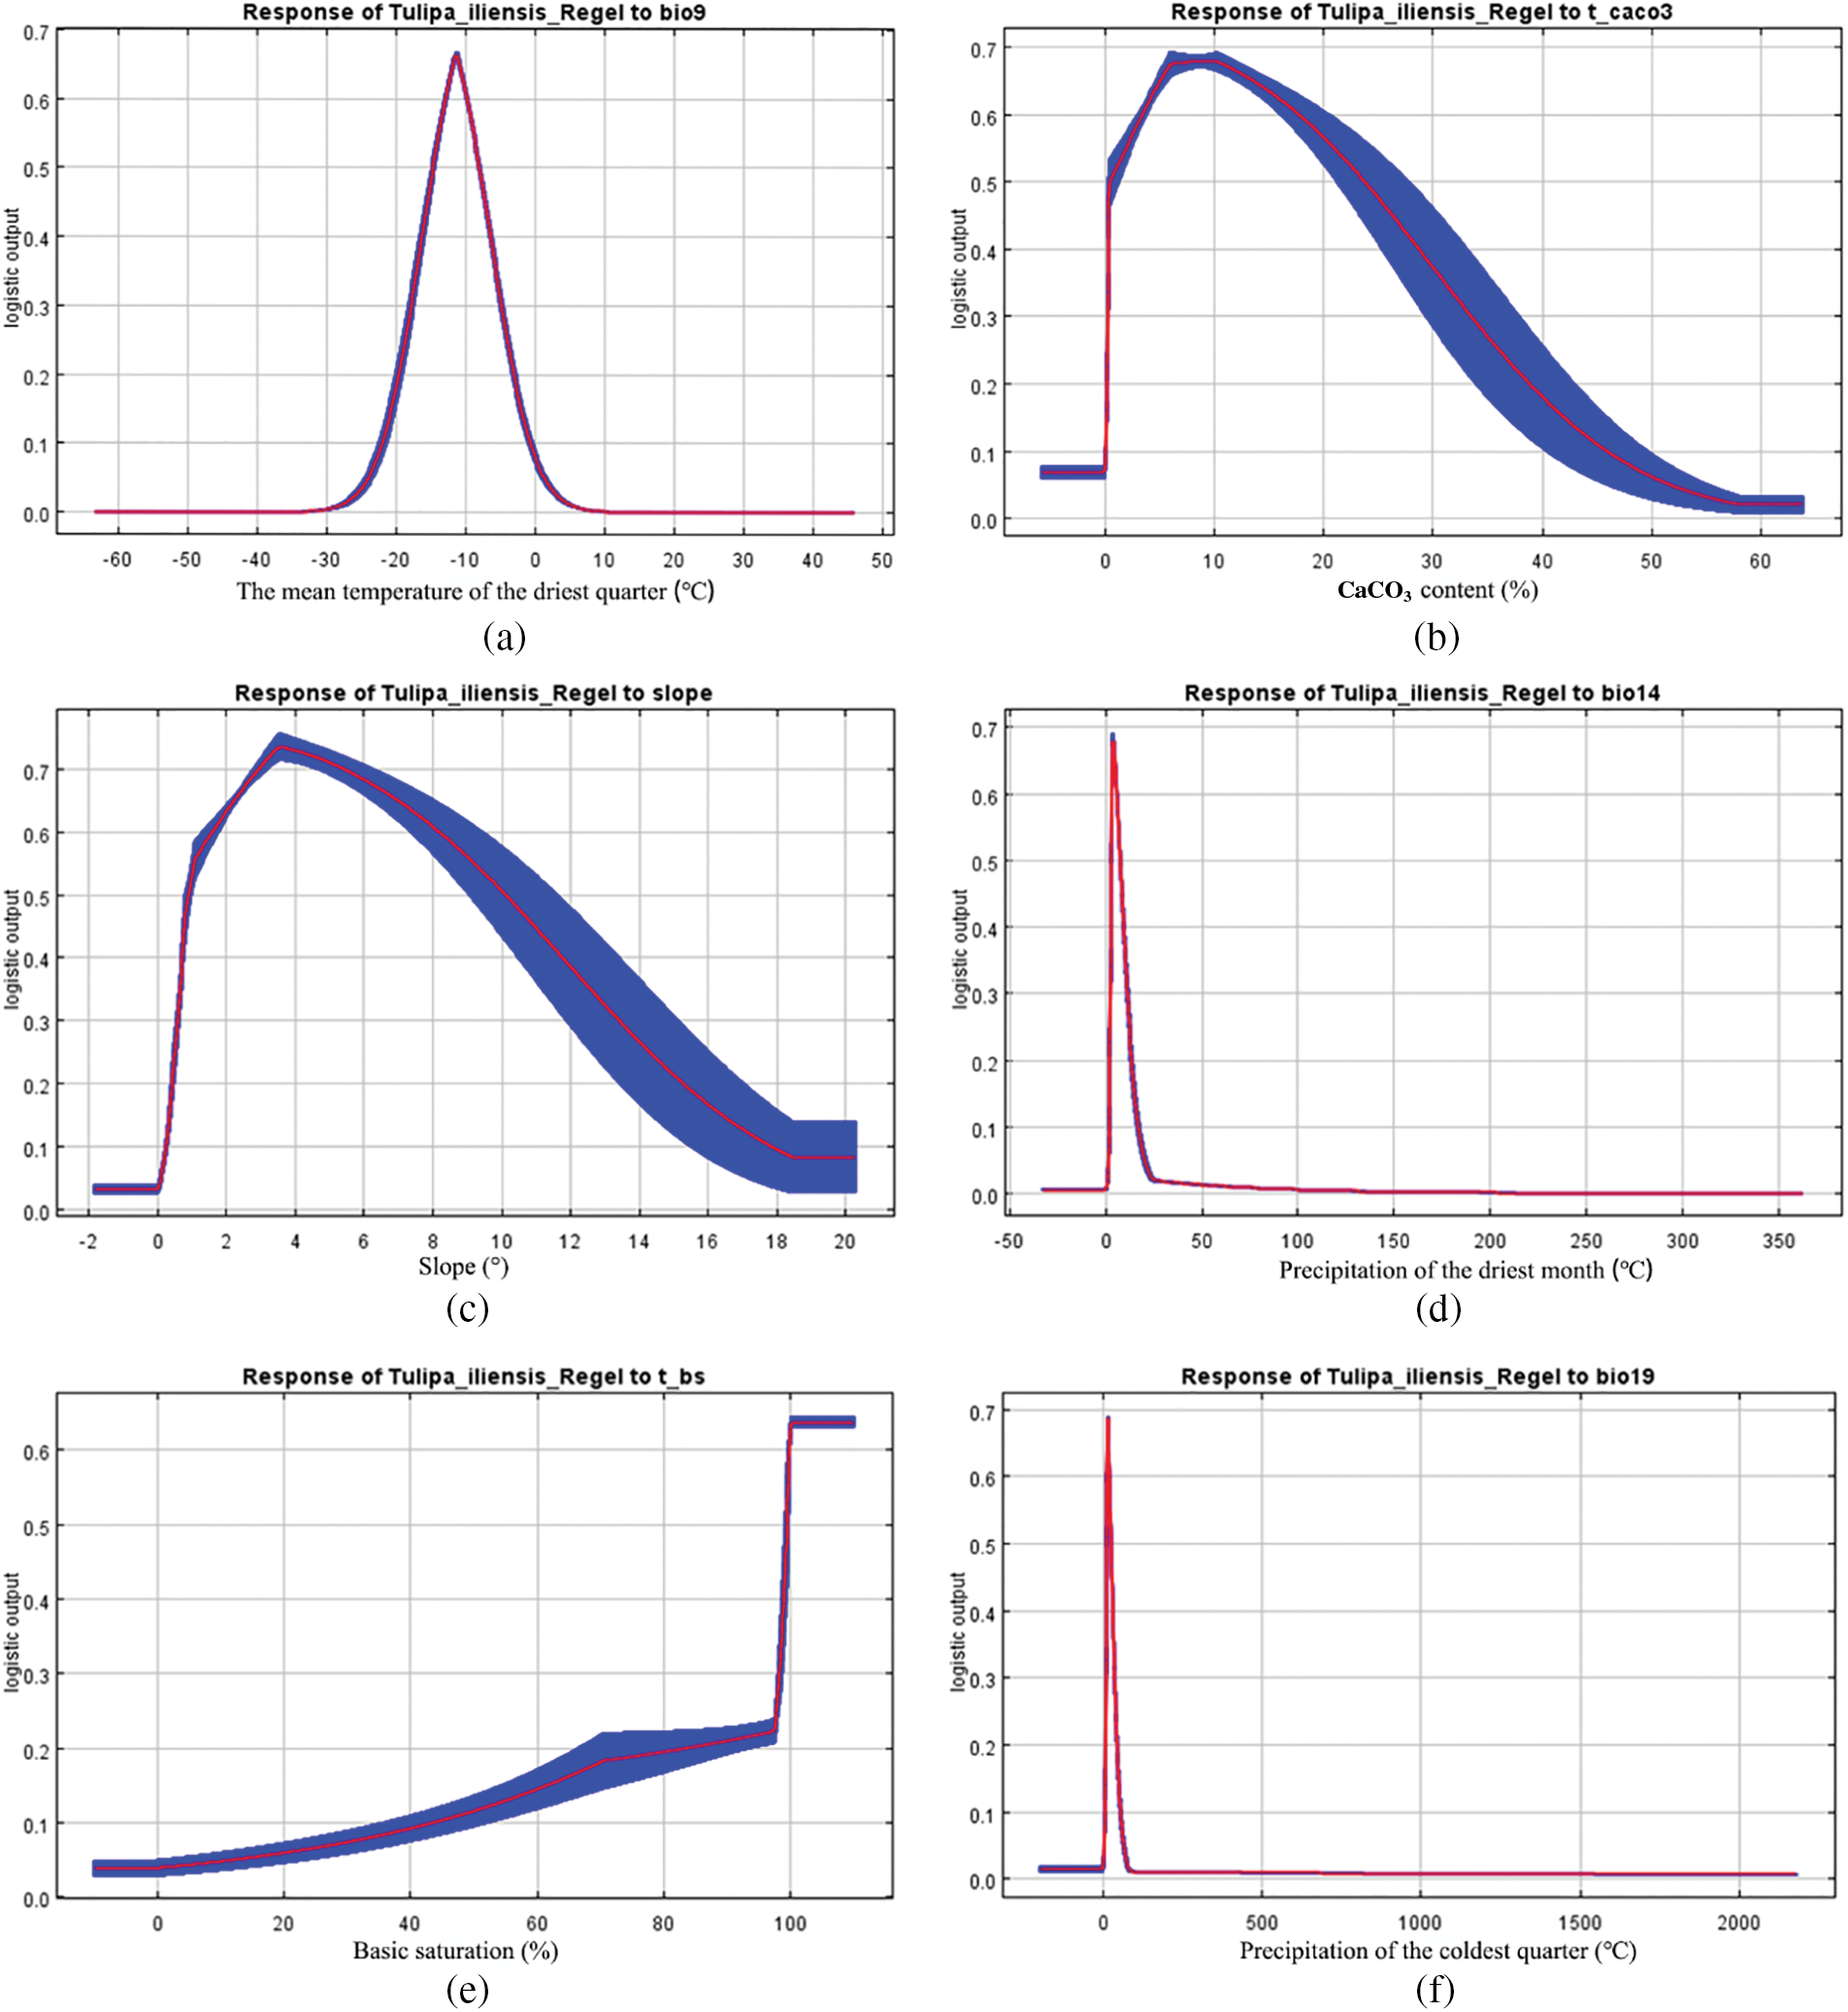
Figure 6: Relationships between key environmental variables and the probability of existence for Tulipa iliensis. (a). Mean temperature of the driest quarter (Bio9); (b). CaCO3 content (T_CACO3); (c). Slope (slope); (d). Precipitation of driest month (Bio14); (e). Basic saturation (T_BS); (f). Precipitation of coldest quarter (Bio19)
3.5 Global Distribution of Suitable Areas for Tulipa iliensis under Current Climate Scenarios
In the current climate scenario, the High and Mid-suitability areas for the Tulipa iliensis are predominantly dispersed in the central and northeastern parts of North America, Central Asia (Northern China, Northern Kazakhstan, Mongolia, Southern Russia, Eastern Kyrgyzstan, Eastern Tajikistan, Eastern Kashmir, and North Korea) (Fig. 7). Among them, the area of the High-suitability area is 61.78472 × 10⁴ km2, accounting for 6.57% of the total suitable area; the area of the Mid-suitability area is 190.0938 × 10⁴ km2, accounting for 20.2% of the total suitable area; the area of the Low-suitability area is 689.0087 × 10⁴ km2, accounting for 73.23% of the total suitable area. Compared with the suitable area for Tulipa iliensis in the paleoclimatic climate scenarios, the reduced range is 63.53%~67.13%.
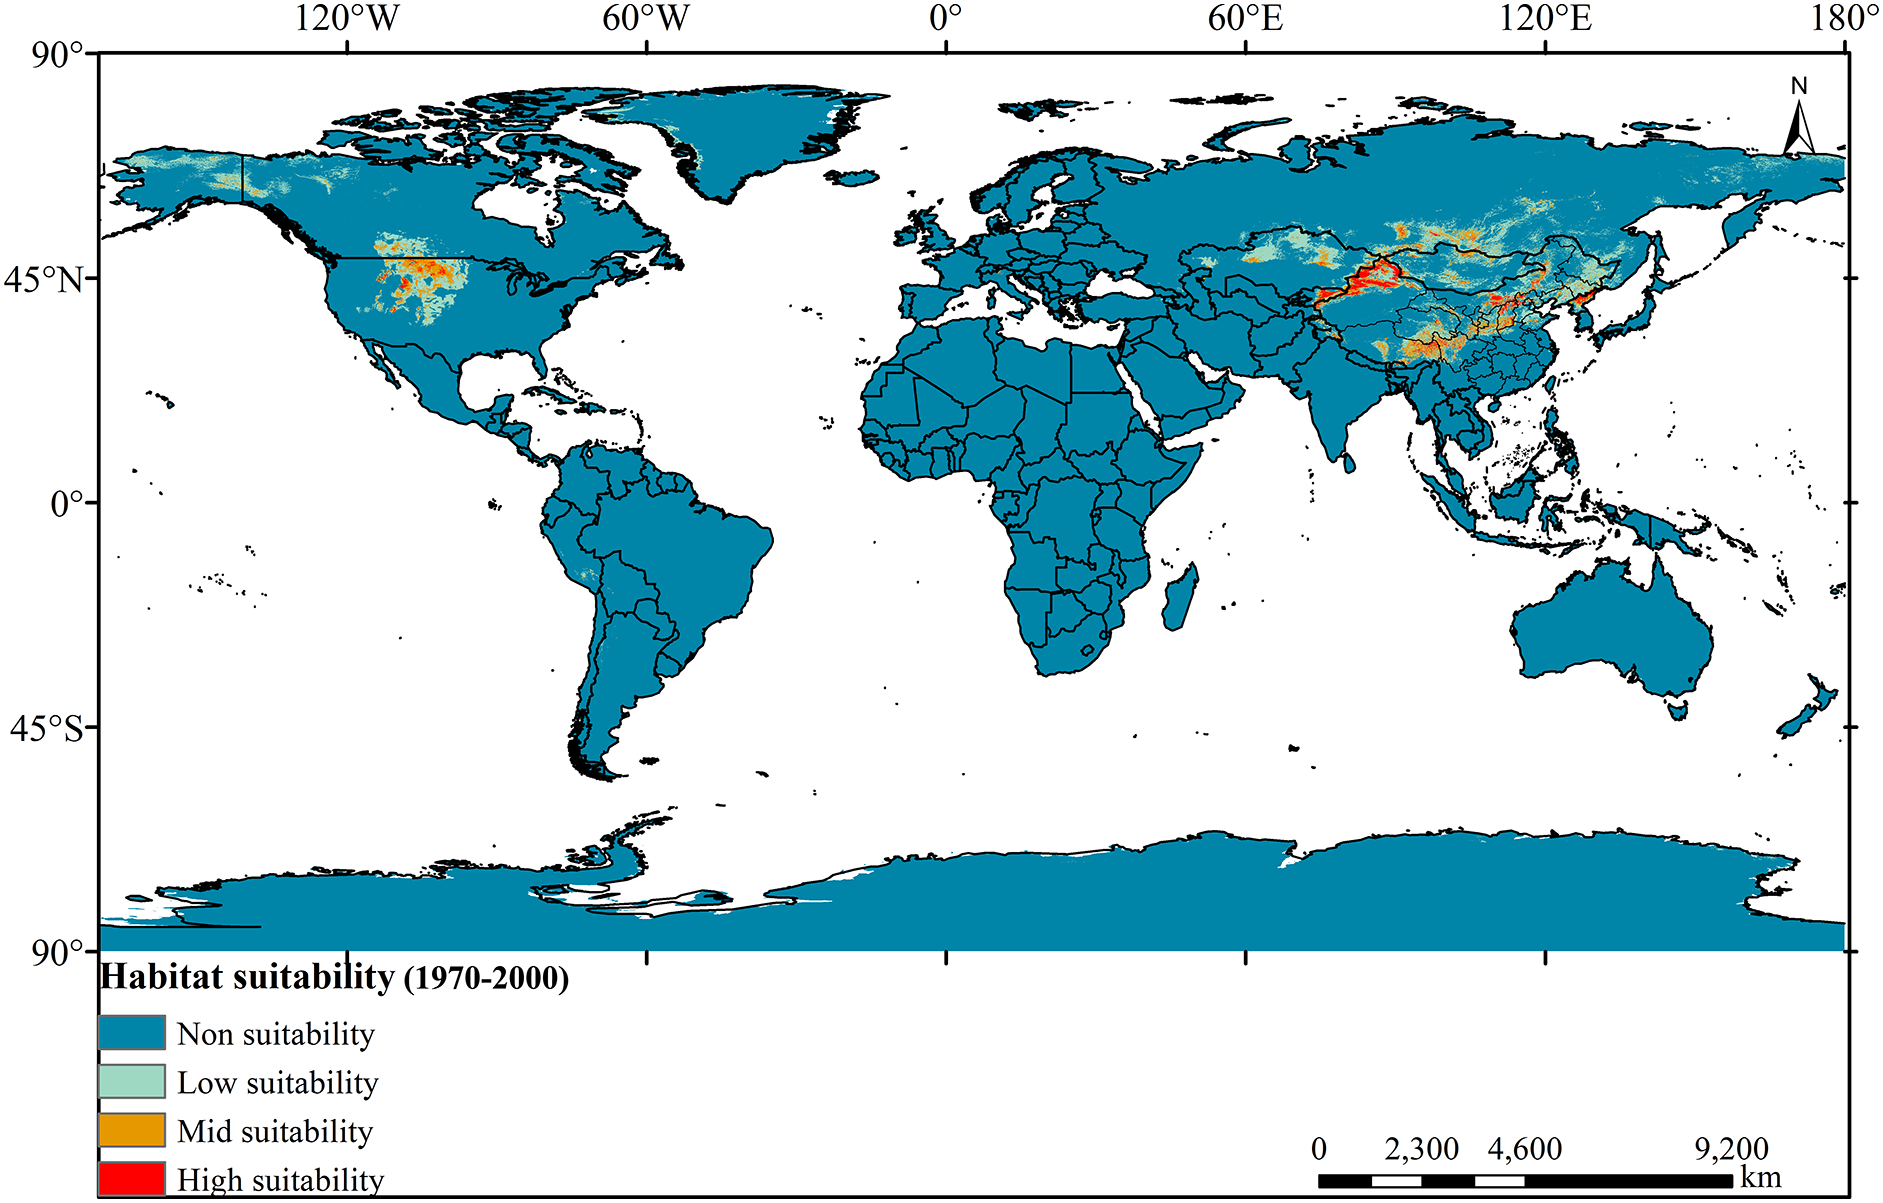
Figure 7: Distribution of suitable areas for Tulipa iliensis under current climate scenarios global
3.6 Global Distribution of Suitable Areas for Tulipa iliensis under Paleoclimatic Climate Scenarios
Evaluating the geographical spread of appropriate habitats for Tulipa iliensis in both paleoclimatic and current climate conditions, it is evident that the former has a much larger distribution range than the latter.
Under three types of paleoclimatic scenarios (Fig. 8), the High and Mid-suitability areas for Tulipa iliensis are predominantly found in North America’s central region, the western and southern coastal areas of South America (Peru, Bolivia, Chile, and Argentina), southern Europe (Mediterranean and black sea coasts, Western coastal countries), Central Asia (northern China, Turkey, Iran, Afghanistan, southern Russia, Kazakhstan, Mongolia, Kyrgyzstan, Tajikistan, Kashmir, Nepal, northern India, South Korea, North Korea, Japan), southern Oceania (Tasmania, New Zealand), and Africa (Lesotho, Ethiopia, Morocco).
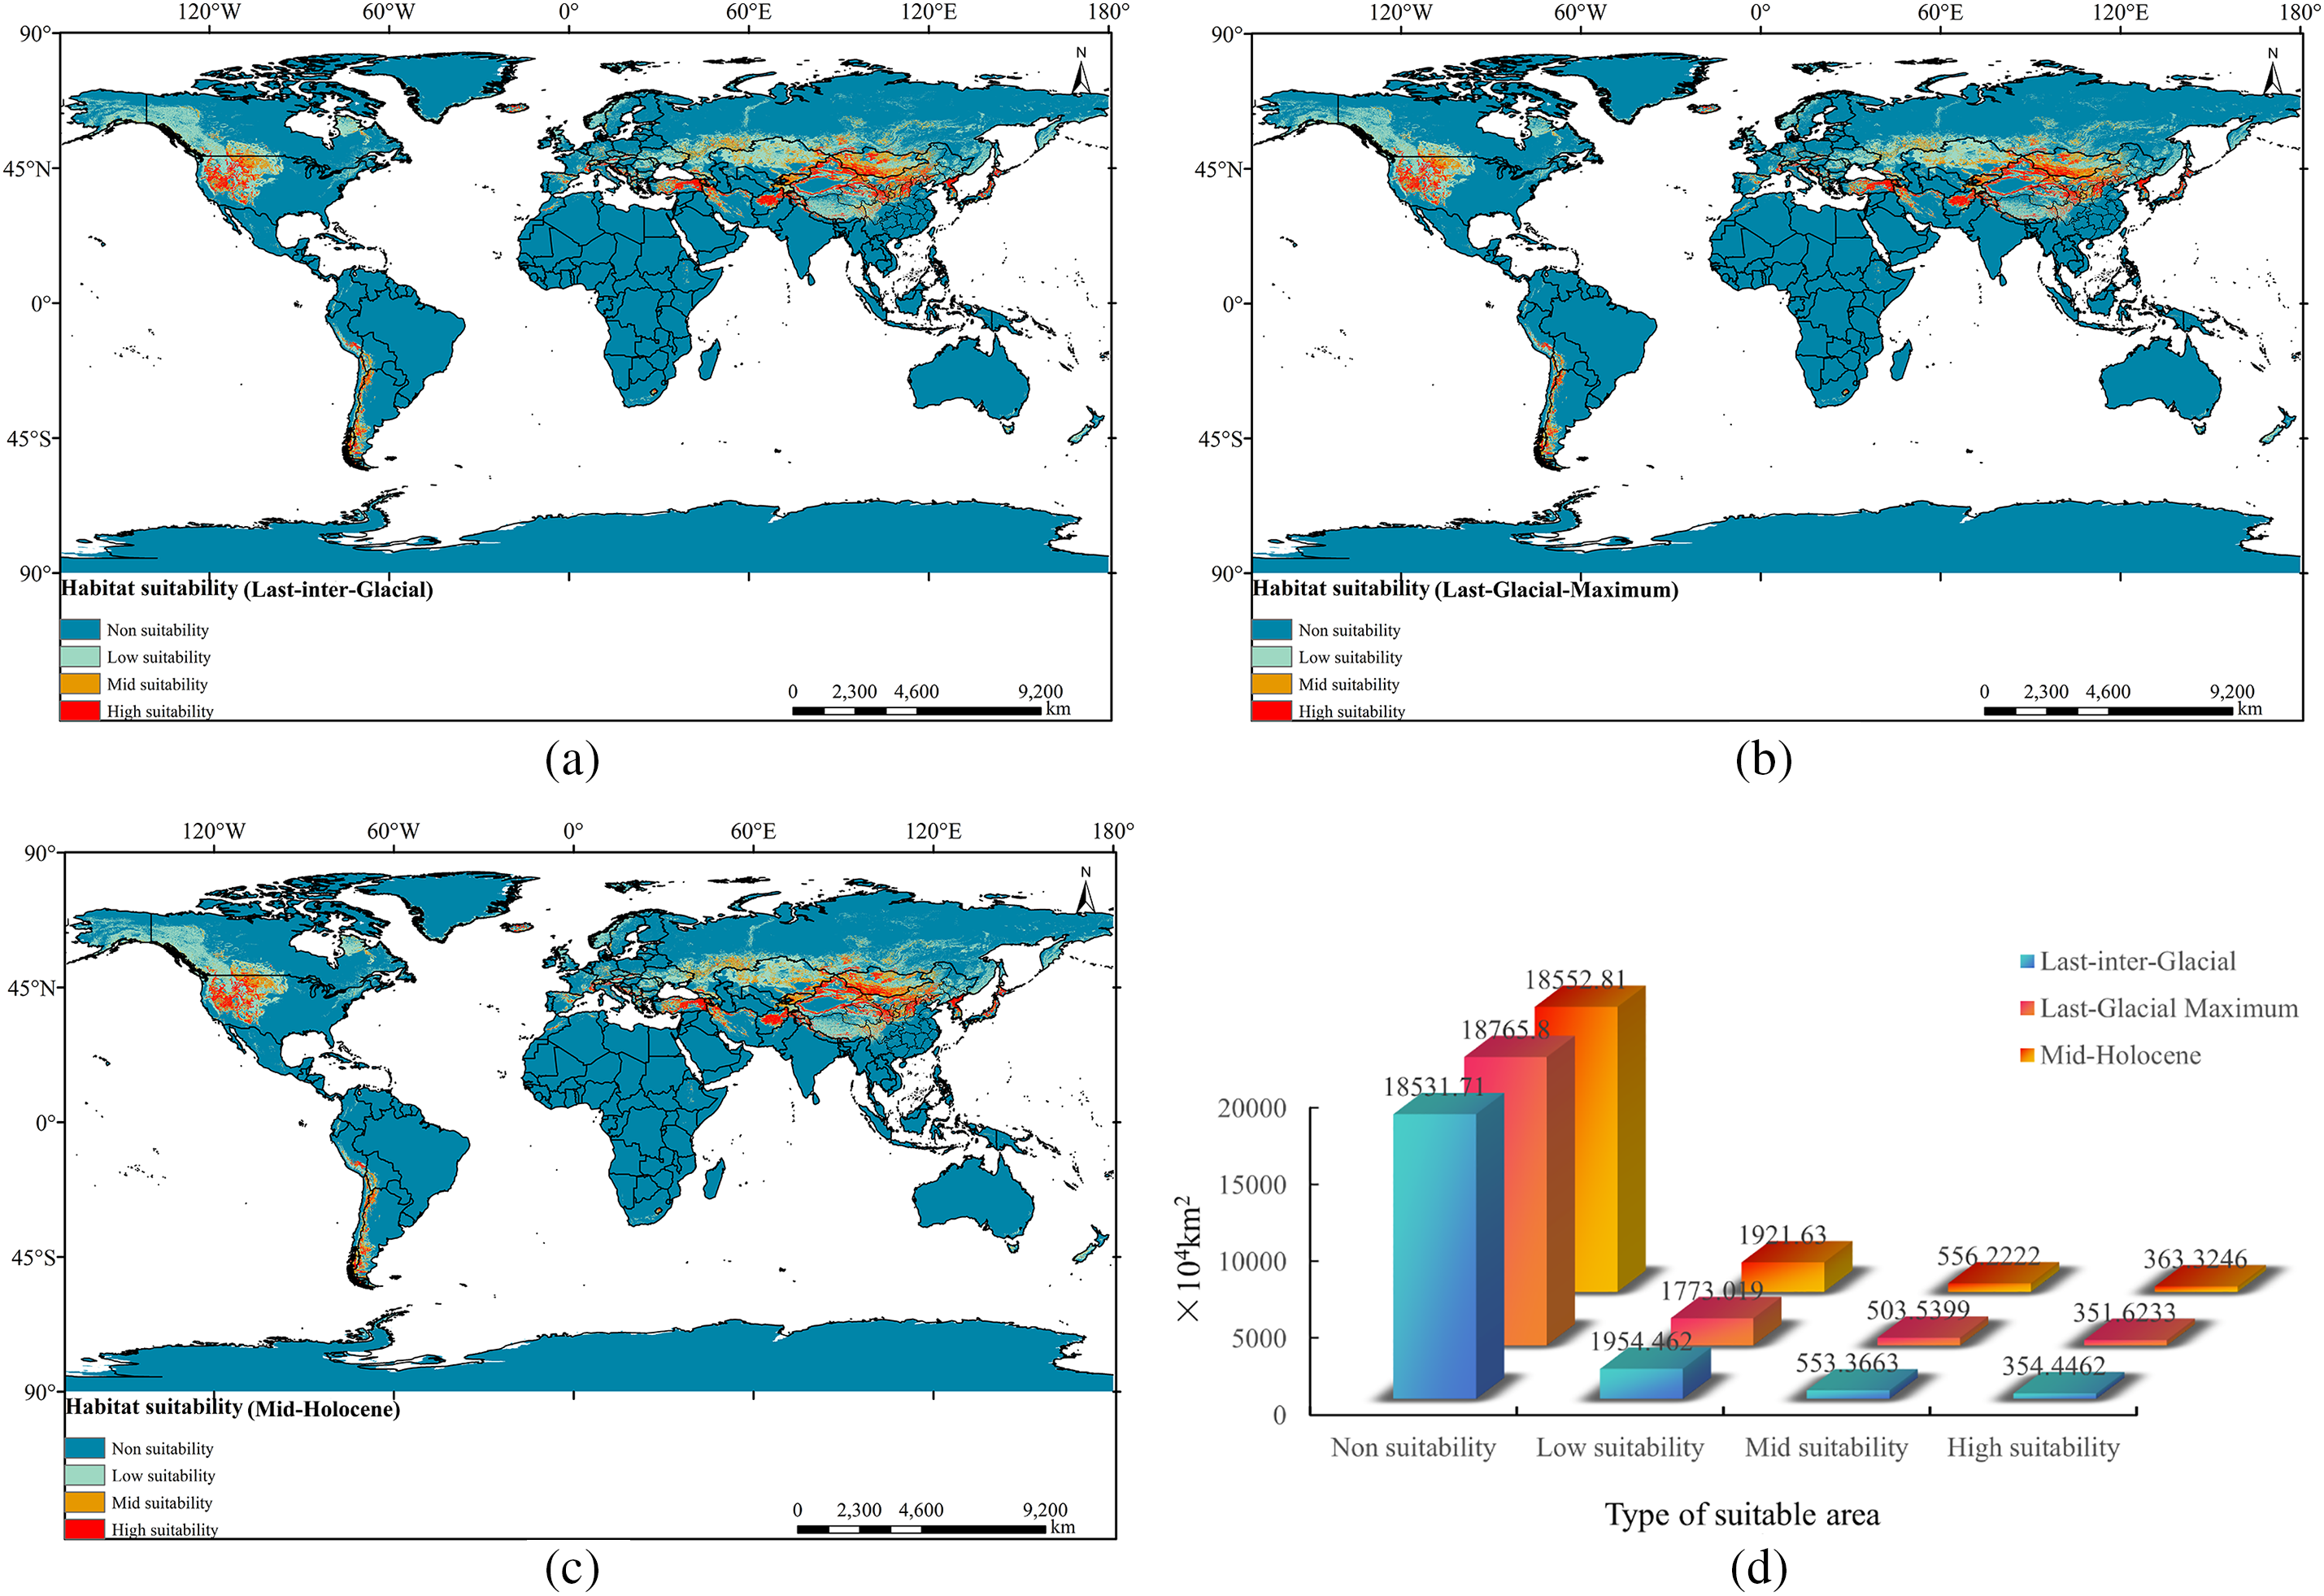
Figure 8: Distribution of suitable areas for Tulipa iliensis under three paleoclimate climate scenarios global. (a). Last-inter-Glacial; (b). Last-Glacial-Maximum; (c). Mid-Holocene; (d). Suitable area of Tulipa iliensis under three paleoclimatic scenarios
In the climate scenarios of Last-inter-Glacial and Mid-Holocene, the area of suitable habitat for the Tulipa iliensis is 354.4462 × 10⁴ km² and 363.3246 × 10⁴ km², respectively, with a small difference. However, under the climate scenarios of the Last-Glacial-Maximum, the High-suitability area of the Tulipa iliensis are 303.5399 × 10⁴ km² and 503.5399 × 10⁴ km², respectively. Compared to the Last-inter-Glacial and Mid-Holocene climate scenarios, the High and Mid-suitability area of the Tulipa iliensis shows a trend of reduction. Throughout the entire paleoclimatic climate period, the area of High and Mid-suitability for the Tulipa iliensis exhibit a trend of high-low-high.
3.7 Global Distribution of Suitable Habitat for Tulipa iliensis under Future Climate Scenarios
In the future, the overall area of appropriate habitat for the Tulipa iliensis will show varying degrees of reduction and expansion under different scenarios of greenhouse gas emissions (Fig. 9). Tulipa iliensis’ overall suitable habitat area is expected to decrease by 2050 under SSP126 scenario. There has been a reduction (12.96%) in the region designated as High-suitability, which is a significant reduction compared to current climate scenarios. The changes in area for Mid and Low-suitability are relatively small, with reductions of 2.96% and 4.80%, respectively. On the other hand, under the SSP245 scenario, the suitable habitat area for the Tulipa iliensis shows a slight expansion in the High-suitability area (2.26%) compared to the current climate scenarios, while the Mid and Low-suitability areas have significantly expanded by 18.35% and 17.59%, respectively. According to the SSP370 scenario, the High-suitability area for 2050 is expected to decrease significantly by 11.24% compared to current climate scenarios, while the expansion of the Mid and Low-suitability areas is relatively small, with a slight increase of 0.36% and 4.86%, respectively. Under the SSP585 scenario, all three suitability areas (High, Mid, and Low-suitability) for 2050 have expanded compared to current climate scenarios, the increase in the High-suitability area is relatively small at 5.09%, while the Mid-suitability area has been a slight increase of 7.57%, however, the Low-suitability area has experienced a significant increase of 12.30% (Fig. S2).
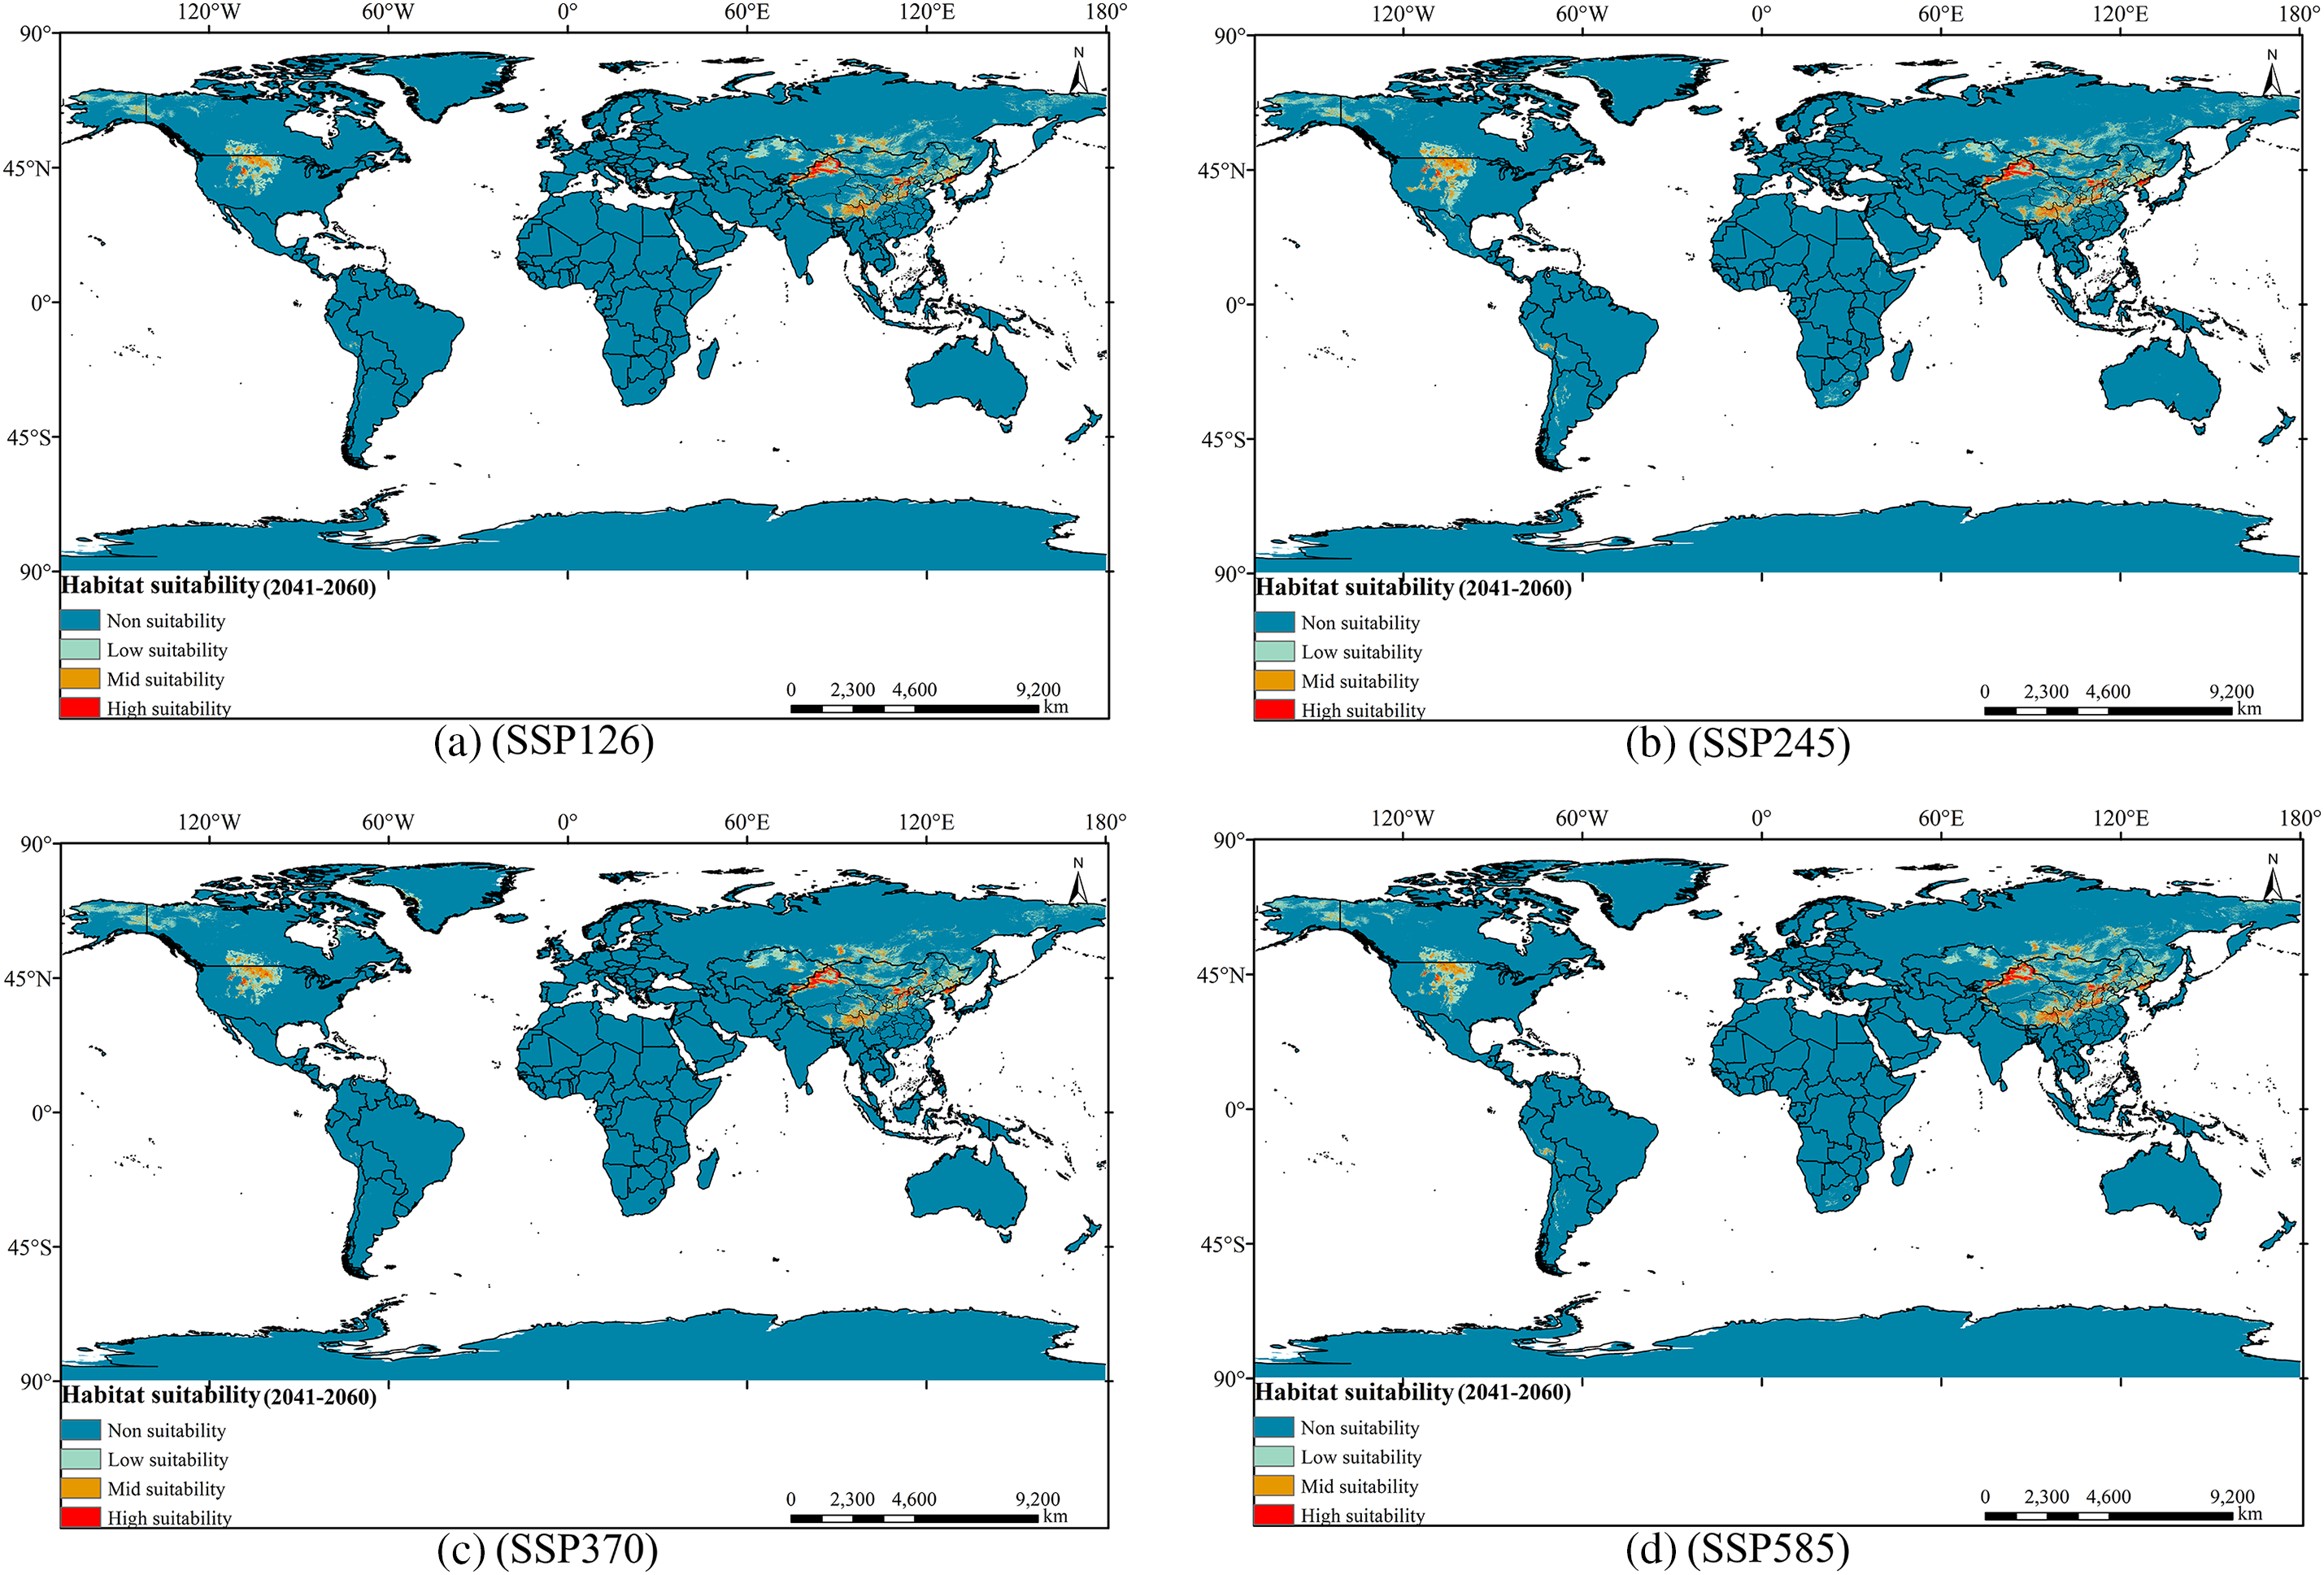
Figure 9: Distribution of suitable areas of Tulipa iliensis under the future climate scenario of 2050. (a). 2050SSP126; (b). 2050SSP245; (c). 2050SSP370; (d). 2050SSP585
In the year 2090, compared to the current climate scenarios, the total suitable area for Tulipa iliensis has slightly decreased under the SSP126 scenario (Fig. 10). The areas of High, Mid, and Low-suitability have decreased by 7.10%, 4.27%, and 7.96%, respectively. Under the SSP245 scenario, the High-suitability area has decreased by 5.94%, the Mid-suitability area has increased by 3.08%, and the Low-suitability area has seen a small increase of 0.18%. In the SSP370 scenario, the High-suitability area in 2080 has decreased by a small margin of 4.84%, while the Mid and Low-suitability area has seen large increases of 15.73% and 45.89%, respectively. Under the SSP585 scenario, the High, Mid, and Low-suitability areas have expanded compared to the current climate scenarios. The expansion rate of the High-suitability area is relatively small, at 7.21%, the area of Mid-suitability has increased significantly, reaching 17.66%, and the area of Low-suitability has experienced rapid growth, reaching 48.98% (Fig. S3).
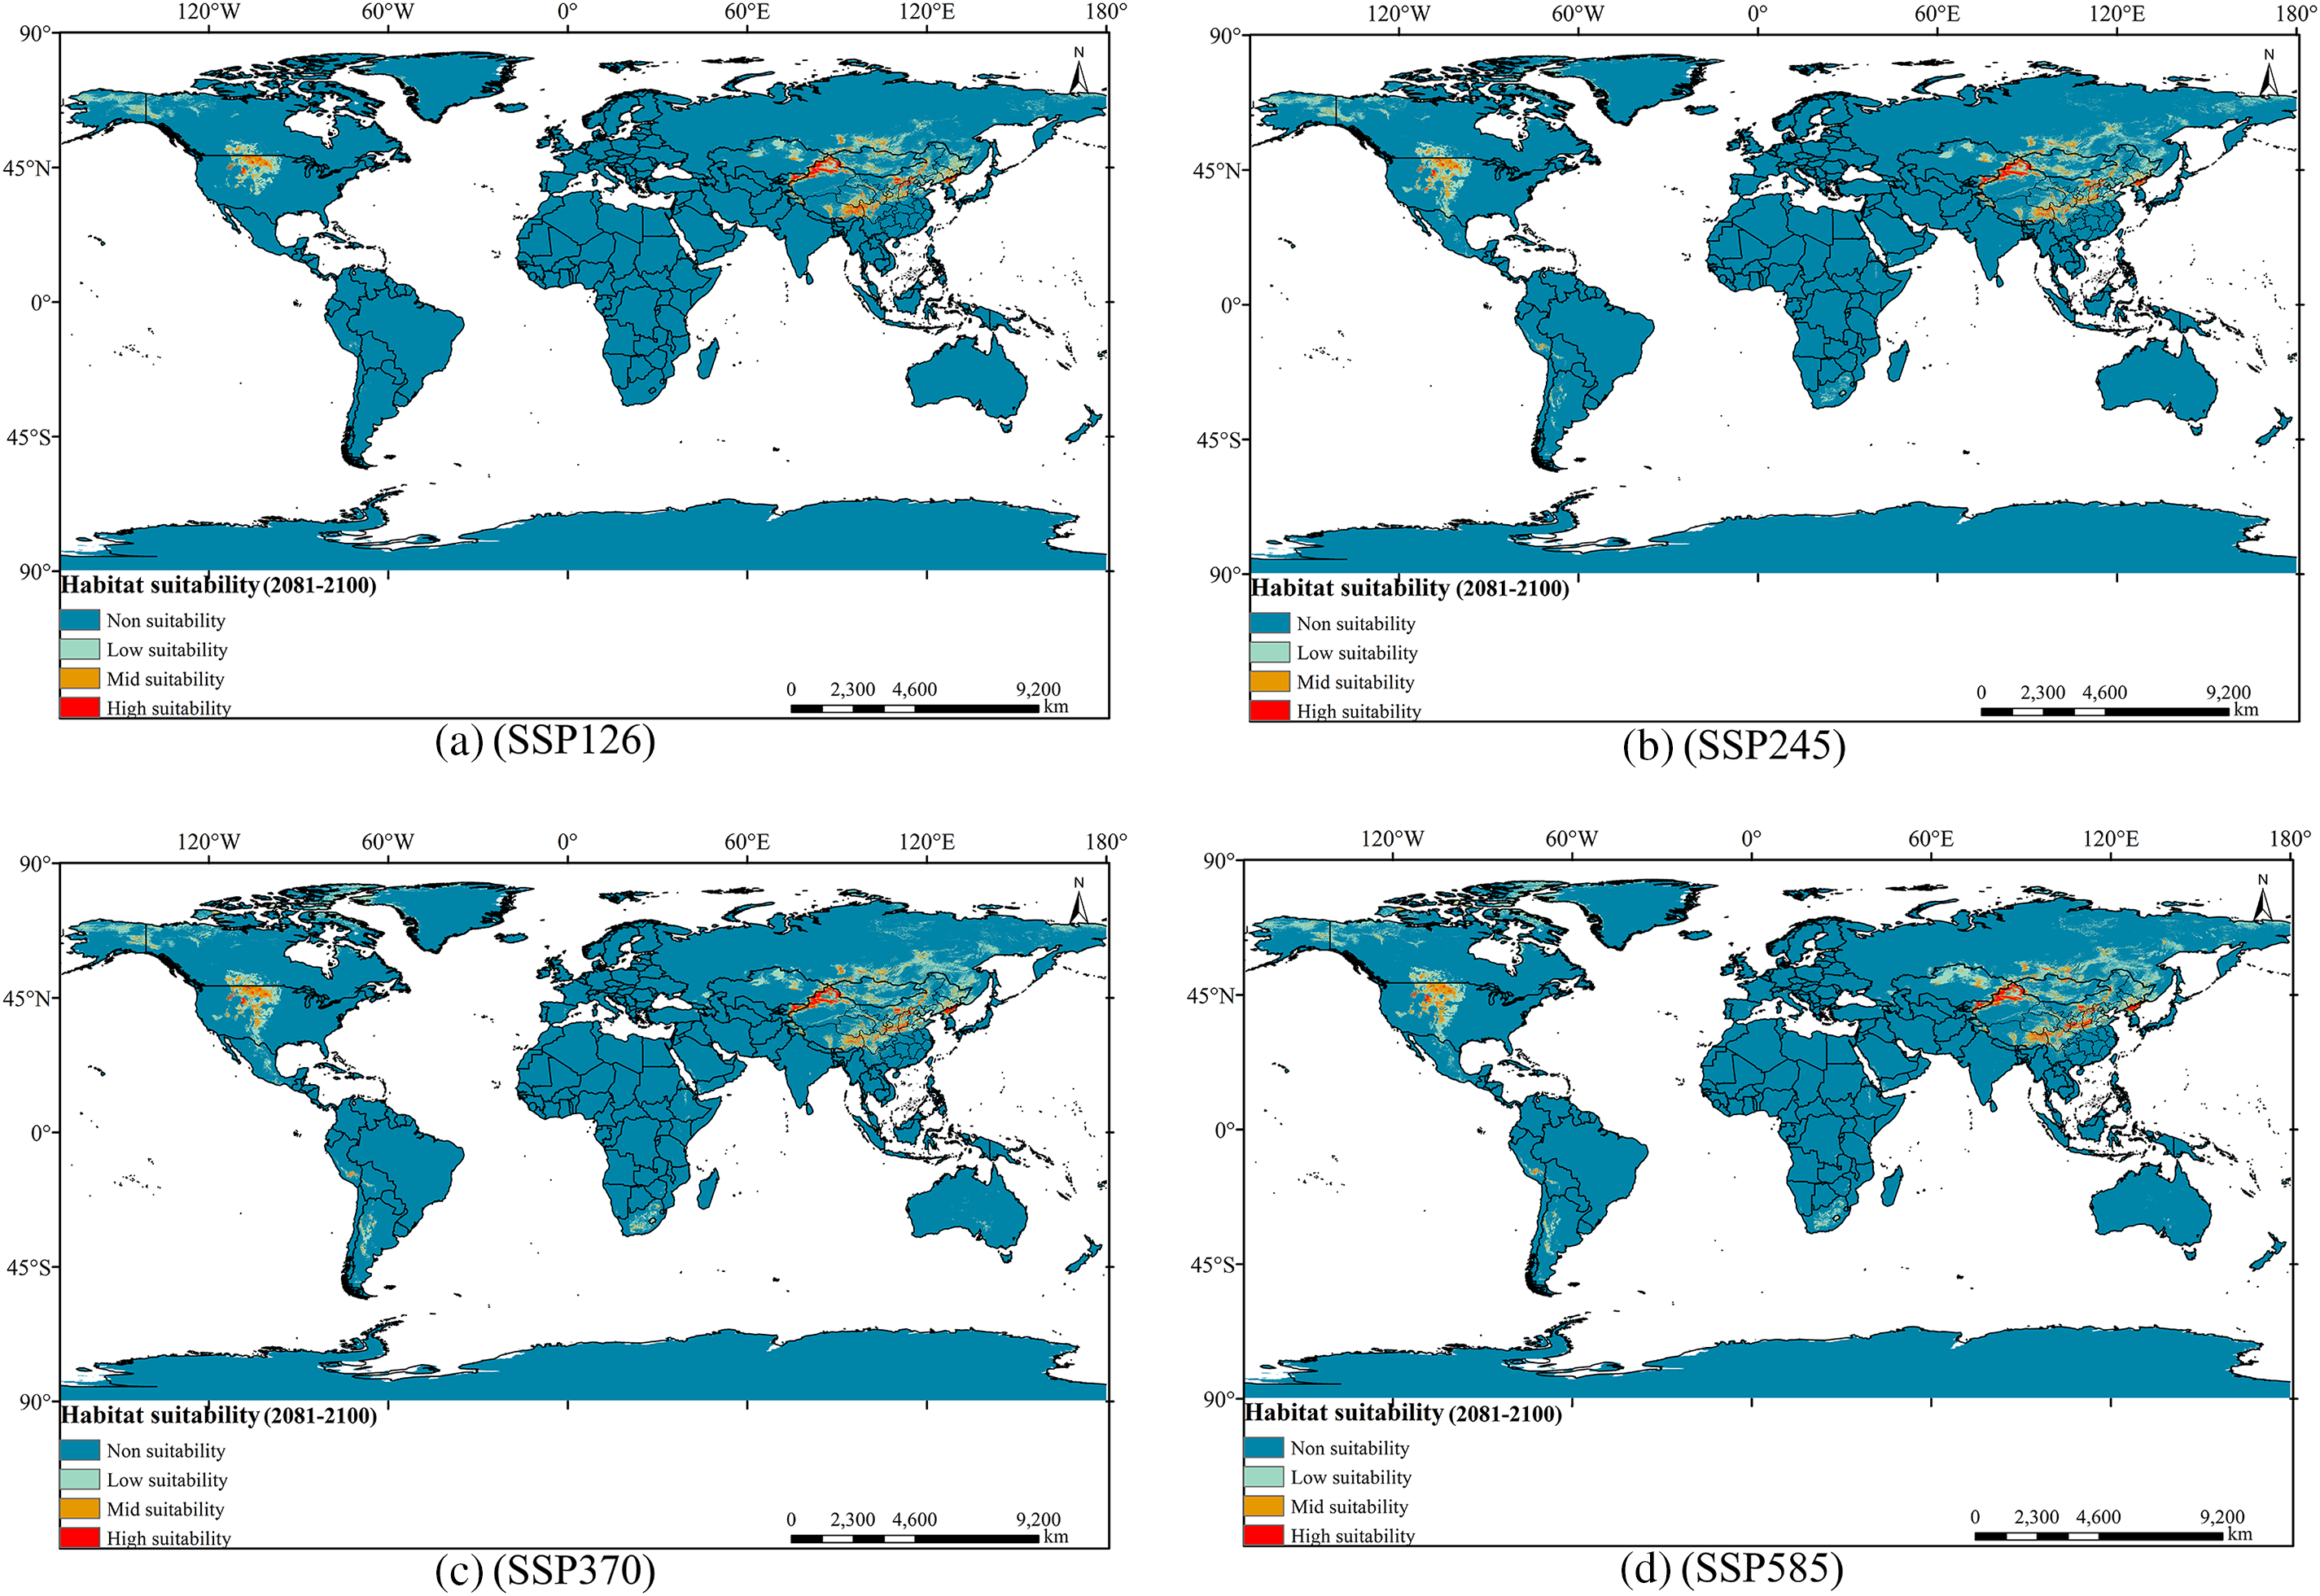
Figure 10: Distribution of suitable areas of Tulipa iliensis under future climate scenarios of 2090. (a). 2090SSP126; (b). 2090SSP245; (c). 2090SSP370; (d). 2090SSP585
In summary, regarding present climatic conditions, the reduction of suitable habitat for Tulipa iliensis under 4 climate scenarios in the future is mainly concentrated in Northeastern China and Northern Kazakhstan. The growth of appropriate habitats is primarily focused in Central North America, the western coast of South America (Peru, Bolivia, Argentina), and the southern part of Africa (South Africa, Saudi Arabia).
3.8 Migration Route of the Centroid of the Suitable Habitat Area
The results of the centroid calculation in ArcGIS (Fig. 11) indicate that Tulipa iliensis is primarily distributed in the central part of Turkey under three paleoclimatic climate scenarios; However, under the current climate scenario, the distribution center of Tulipa iliensis is located in the southern part of Kazakhstan; under the future scenarios for 2050 (SSP126, SSP370, and SSP585), the distribution center of Tulipa iliensis is still expected to be in the southern part of Kazakhstan, but under the SSP245 scenario, the distribution center of Tulipa iliensis is projected to shift to the northwest part of Uzbekistan; by 2090, under the SSP126 scenario, the distribution center of Tulipa iliensis will still be in the southern part of Kazakhstan, under the SSP245 scenario it is expected to be at the border of Uzbekistan and Turkmenistan, and under the SSP370 and SSP585 scenarios, the distribution center is projected to be in the southwestern part of Kazakhstan. In summary, the centroid migration route of Tulipa iliensis is predicted to shift from the southern part of Kazakhstan to the southwest in future climate scenarios, while Kazakhstan will continue to be the main distribution center of Tulipa iliensis.
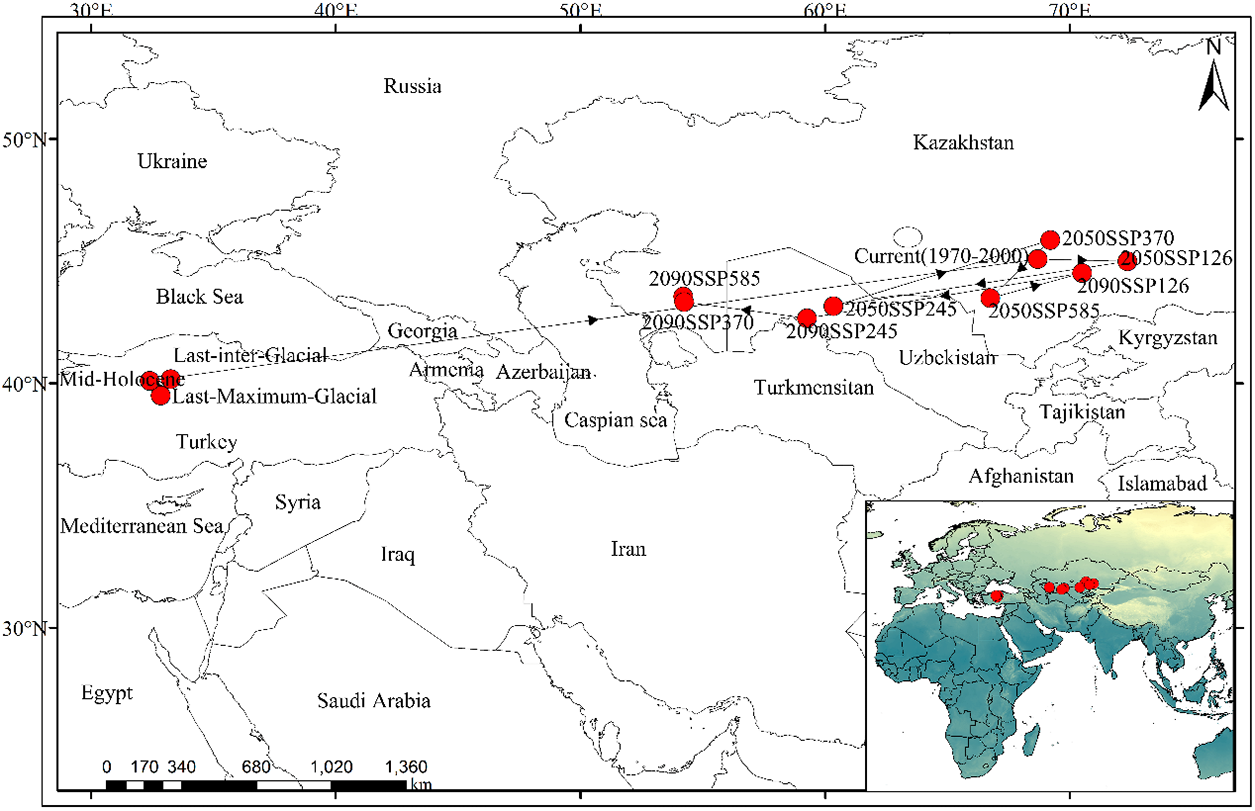
Figure 11: The centroid migration route of Tulipa iliensis under different climate scenarios
4.1 The Impact of Climatic Factors on the Distribution of Suitable Habitats for Tulipa iliensis
Exploring the link regarding the interplay between species distribution and environmental elements is a crucial ecological research subject, focusing on forecasting the geographical spread and abundance trends of species [49]. This research pioneers the use of the MaxEnt model to evaluate how climate change affects the geographical distribution and environmental suitability of Tulipa iliensis’ habitat. The results from the MaxEnt3.4.4 model indicated that climate variables contributed 36.5% to the suitable distribution of Tulipa iliensis, making climate variables the main environmental factor that influences the distribution of Tulipa iliensis. The findings of this research align with key environmental factors influencing the spread of Carex alatauensis [50] and Solanum muricatum [51] on the Qinghai-Tibet Plateau, as explored using the MaxEnt model. Additionally, the discussion on species richness in the Qinghai-Tibet Plateau region using three sets of environmental variables energy, precipitation, and habitat indicates that precipitation and temperature are the most important factors that affect species diversity [52]. This once again emphasizes how climate influences species distribution in high-altitude areas. Tulipa iliensis is primarily found in plain deserts, arid slopes, and gravel grasslands, at elevations ranging from 400 to 2100 meters above sea level. As altitude changes, there will be corresponding changes in the environmental factors of the region, such as light, temperature, moisture, precipitation, etc. [53], all of these factors are considered climate variables. During the field investigation, it was found that there were differences in plant size, leaf edge shape, and seed ball size among Tulipa iliensis populations at different altitudes, different altitudinal gradients also show distinct vertical zonal distribution patterns for Tulipa iliensis populations, which affected the spatial gradient change of Tulipa iliensis species diversity. Mountain vegetation communities are an important part of terrestrial ecosystems, with ecological functions such as climate regulation, diversity protection, and productivity enhancement [54]. Consequently, its importance is immense to clarify the suitable spatial distribution pattern of Tulipa iliensis, understand the main climate factors that control it, and analyze its changing trend in the context of climate change, this will provide an in-depth understanding of the response mechanism of Tulipa iliensis distribution pattern to environmental and altitude changes. To discuss effective protection management of Tulipa iliensis at different altitudes, ecological restoration, etc., to provide a scientific basis.
Some parts of Xinjiang in China are located on the Qinghai-Tibet Plateau and possess a standard temperate continental dry climate, marked by scant rainfall and significant evaporation, resulting in a dry climate [55]. Therefore, precipitation stands as the primary weather element restricting Tulipa iliensis’s spread. Tulipa iliensis is a perennial plant that blooms in early spring and has a short lifespan, its dormancy type is physiological dormancy, and in the wild, it exhibits deep dormancy. Due to the cold climate in early spring, the germination of Tulipa iliensis seeds requires a suitable temperature to break the dormancy. Therefore, temperature, rather than precipitation, is the primary ecological factor that affects the suitable distribution of Tulipa iliensis. The ideal soil for Tulipa iliensis is gray calcareous soil and light chestnut calcareous soil, which indicates a high calcium content in the soil. Among other environmental variables, the contribution rate of the soil variable CaCO3 content (T_CACO3) to the suitable distribution of Tulipa iliensis is 19.2%. Bilias and colleagues conducted a study on the adaptability of wild tulips in different regions of Greece, they investigated the relationship between soil properties, rhizosphere fungal morphology, and plant nutrient content. The study found that the variation coefficient of CaCO3 is the largest (170.4%) compared to other soil physicochemical properties [56], the results are consistent with the findings of the study, suggesting that CaCO3 also plays a significant role in determining the suitable distribution of Tulipa iliensis. The findings of this study have important implications for soil nutrient management when introducing and cultivating Tulipa iliensis.
4.2 Changes in the Spatial Pattern of Tulipa iliensis under Different Climate Conditions
This study simulated and dynamically analyzed the distribution patterns of Tulipa iliensis under different climate scenarios in the past, current, and future using the ecological niche model Maxent. Wilson et al. used the Maxent model to predict the distribution trends of Central Asian wild tulips under future climate change conditions, and the AUC values were all greater than 0.9 [57]. In this study, the model-simulated AUC values under different climate conditions were all greater than 0.965, demonstrating the reliability of the model simulations. By comparing the actual distribution points of Tulipa iliensis in the Xinjiang region of China with the current suitable habitat range obtained from the model simulation, it can be seen that almost all distribution points of Tulipa iliensis fall within the core suitable habitat area, suggesting a considerable level of alignment between the outcomes predicted by the model and the real distribution [58].
The geographical spread of species diversity is not arbitrary, it is shaped by evolutionary, geographical, and climatic occurrences. therefore, it is crucial to determine the priorities for managing and protecting biodiversity [59]. Grasping the diversity in species abundance across their habitats is crucial for both ecological and evolutionary theories and practical conservation science [60]. In general, the distribution of Tulipa iliensis has not reached saturation, it is centered in central Asia and North America and extends towards western and northern Central Asia, as well as southern and northern North America. In the current climate scenarios of SSP126, SSP245, SSP370, and SSP585, the suitable distribution range of Tulipa iliensis shows a trend of expansion-reduction-expansion by the 2050s and 2090s, however, the magnitude of expansion is smaller under future climate scenarios. The emission of greenhouse gases has markedly changed the energy equilibrium within the Earth’s climatic system [61], these changes in environmental conditions caused by climate change affect the suitable distribution range of species. Research on the suitable distribution areas of Paeonia delavayi [62], Rhododendron purdomii [63], and Larix [64] as a reaction to climatic shifts indicates that these species’ suitable distribution ranges are shifting towards higher latitudes and northwest regions due to global climate change.
Within the framework of worldwide climatic shifts, most species on the Tibetan Plateau have a gradual migration trend to the north, mainly because the frequent droughts caused by global warming will lead to the loss of native habitats of local species, and the melting of glaciers will provide a large amount of water for plants and form new habitats [65,66]. Due to global warming, the suitable distribution range of Tulipa iliensis has significantly decreased and shifted to higher altitudes in the northern hemisphere, both presently and in the future. Tulipa iliensis is primarily found on the northern slopes of the Tianshan Mountains in Xinjiang, China, and in Central Asia. As greenhouse gas emissions increase, temperatures rise, snow in the Tianshan Mountains melts, and water sources increase. Consequently, the Tulipa iliensis migrates to higher altitudes. About existing climatic forecasts, it is anticipated that Tulipa iliensis will expand its total viable area to a certain degree by 2050 and 2090. However, under the SSP126 and SSP370 scenarios, the area of highly suitable regions will decrease by approximately 4.84% to 12.96%. This suggests that rising temperatures will worsen drought, desertification, soil erosion, and environmental degradation, leading to a reduction in the highly suitable areas for Tulipa iliensis. On the other hand, under the SSP585 scenario, there is a slight increase in the highly suitable areas of Tulipa iliensis. This indicates that long-term natural selection has improved the adaptability of Tulipa iliensis to the environment, resulting in an expansion of the highly suitable areas. Nevertheless, the prediction results also show that this growth is not stable, and the suitable areas of Tulipa iliensis fluctuate over time. Therefore, the survival and reproduction of Tulipa iliensis, a valuable plant resource, face significant challenges in Xinjiang and Central Asia under the backdrop of global climate change.
4.3 Tulipa iliensis Natural Population Conservation Strategy
The range of Tulipa iliensis is relatively limited, and although there is a potential for expansion in the future, the degree of expansion is small. When compared to the potential distribution range of Tulipa iliensis under three paleoclimatic climate scenarios, the reduction in the current and future climate scenarios is almost half. With the changes in climate conditions, overgrazing, excavation, and habitat destruction, the distribution area of Tulipa iliensis may gradually decrease. Therefore, it is crucial to discuss the conservation strategies for the genetic resources of Tulipa iliensis at present [67,68]. Currently, the Tulipa iliensis is a second-level protected plant in China, the protection of Tulipa iliensis has been strengthened to reduce damage. Additionally, artificial cultivation bases can be established in the Xinjiang area for Tulipa iliensis; other suitable areas for the plant can also be selected for introduction and cultivation, such as Southern Tibet, Qinghai, Gansu, Northeast, Shanxi, and other areas in China [69]; Establishing protected areas in Xinjiang with on-site protection is an effective way to preserve the natural habitat in areas with less human activity [70,71]; at the same time, a tulip germplasm resource bank should be established to preserve the genetic diversity of Tulipa iliensis in fragmented habitats.
How plants react to climate change has always been a popular topic in global change and biogeography research, the worldwide shift in climate significantly affects plant biodiversity and their ecological equilibrium. This study utilized model prediction to analyze the suitable distribution of Tulipa iliensis under three paleoclimatic scenarios, including current and future climate change. The accuracy of the results exceeded 0.965, indicating an excellent simulation effect. Primary environmental factors that influence the distribution of Tulipa iliensis are the mean temperature of the driest quarter (Bio9), calcium content (T_CACO3), slope, precipitation of the driest month (Bio14), basic saturation (T_BS), and precipitation of the coldest quarter (Bio19), among these climate variables, the greatest impact on the suitable distribution of Tulipa iliensis is observed. Relative to the prospective distribution zone of Tulipa iliensis in three paleoclimatic climate scenarios, the appropriate area for distribution of Tulipa iliensis has significantly decreased in both recent and future climate scenarios. However, when comparing the suitable distribution area of Tulipa iliensis in the recent climate scenario to that in the future climate scenario, there is a slight overall expansion, this expansion is mainly observed in high-latitude areas in the southern hemisphere. Findings from this research offer a crucial understanding of the logical safeguarding administration and use of Tulipa iliensis wild genetic assets.
Acknowledgement: We are grateful for the support from the Key Laboratory of Landscape Plants of Qinghai Province.
Funding Statement: This work was supported by the West Light Foundation, Chinese Academy of Science [1–7].
Author Contributions: Douwen Qin: Conceptualization, Data curation, Investigation, Methodology, Software, Writing–original draft, Writing–review & editing. Weiqiang Liu: Data curation, Validation, Visualization. Jiting Tian: Methodology, Software, Visualization. Xiuting Ju: Conceptualization, Formal analysis, Funding acquisition, Software, Validation, Writing–review & editing. All authors reviewed the results and approved the final version of the manuscript.
Availability of Data and Materials: Not applicable.
Ethics Approval: Not applicable.
Conflicts of Interest: The authors declare that they have no conflicts of interest to report regarding the present study.
References
1. Kelemu W, Assefa A, Linger A, Mussie Y. The impacts of climate change on biodiversity loss and its remedial measures using nature-based conservation approach: a global perspective. Biodivers Conserv. 2023;32(12):3681–701. [Google Scholar]
2. Lynn J, Peeva N. Communications in the IPCC’s Sixth assessment report cycle. Clim Change. 2021;169(1–2):18 [Google Scholar] [PubMed]
3. Sala OE, Stuart Chapin III F3rd, Armesto JJ, Berlow E, Bloomfield J, Dirzo R, et al. Global biodiversity scenarios for the year 2100. Science. 2000;287(5459):1770–4. doi:10.1126/science.287.5459.1770 [Google Scholar] [PubMed] [CrossRef]
4. Diffenbaugh NS, Giorgi F. Climate change hotspots in the CMIP5 global climate model ensemble. Clim Change. 2012;114(3–4):813–22 [Google Scholar] [PubMed]
5. Wang Q, Hong DY. Understanding the plant diversity on the roof of the world—a brief review of the flora of Pan-Himalaya. Innovation. 2022;3(2):100215 [Google Scholar] [PubMed]
6. Hu XF, Wei LY, Cheng Q, Wu XQ, Ni J. Adjusting the protected areas on the Tibetan Plateau under changing climate. Glob Ecol Conserv. 2023;45:2351–9894. [Google Scholar]
7. Li L, Wang S, Chen Y, Zhang H, Zhang J, Xu Y, et al. Climate change in the Eastern Xinjiang of China and its connection to northwestern warm humidification. Atmosphere. 2023;14(9):1421. [Google Scholar]
8. Yang DQ, Chen KW, Liu M, Zhang GF, Liu B, Chen SP, et al. Prediction of global range shifts of the invasive giant Lantana camara. J Biosaf. 2023;32(4):362–73. [Google Scholar]
9. Ye XZ. Prediction of potential suitable distribution of Phoebe bournei based on MaxEnt optimization model. Acta Ecol Sin. 2021;41(20):8135–44. [Google Scholar]
10. Zhang Q, Shen X, Jiang X, Fan TT, Liang XZ, Yan WD. MaxEnt modeling for predicting suitable habitat for endangered tree Keteleeria davidiana (Pinaceae) in China. Forests. 2023;14(2):394. [Google Scholar]
11. Lehnen SE, Lombardi JV. Climate envelope modeling for ocelot conservation planning: peering inside the black box. Ecosphere. 2023;14(4):e4477. [Google Scholar]
12. Hurtado C, Hemming V, Burton C. Comparing wildlife habitat suitability models based on expert opinion with camera trap detections. Conserv Biol. 2023;37(5):e14113. doi:10.1111/cobi.14113 [Google Scholar] [PubMed] [CrossRef]
13. Norberto M, Sillero N, Coimbra J, Cunha M. Filling the maize yield gap based on precision agriculture-a MaxEnt approach. Electron Agric. 2023;211:107970. [Google Scholar]
14. Li XL, Wu KN, Hao SH, Zhang Y, Zhao R, Ma JL. Mapping cropland suitability in China using optimized MaxEnt model. Field Crops Res. 2023;302(2):109064. [Google Scholar]
15. Lin Y, Wang H, Chen Y, Tian JR, Hong JP, Yan S, et al. Modelling distributions of Asian and African rice based on MaxEnt. Sustain. 2023;15(3):2765. [Google Scholar]
16. Wu JY, Xiang RW, Shen LQ, Gao HX, Geng S, Meng XX. Assessment of habitat suitability for Chinese goral in mountainous areas of Beijing with MaxEnt model. Russ J Ecol. 2023;54:402–11. [Google Scholar]
17. Alkhalifah DHM, Damra E, Melhem MB, Hozzein WN. Fungus under a changing climate: modeling the current and future global distribution of fusarium oxysporum using geographical information system data. Microorganisms. 2023;11(2):468 [Google Scholar] [PubMed]
18. Jiang X, Liu WJ, Zhu YZ, Cao YT, Yang XM, Geng Y, et al. Impacts of climate changes on geographic distribution of Primula filchnerae, an endangered herb in China. Plants. 2023;12(20):3561 [Google Scholar] [PubMed]
19. Wang G, Xie C, Wei L, Gao ZQ, Yang HG, Jim CY. Predicting suitable habitats for China’s endangered plant Handeliodendron bodinieri (H. Lév.) Rehder. Diversity. 2023;15(10):1033. [Google Scholar]
20. Yang M, Sun L, Yu Y, hang H, Malik I, Wistuba M, et al. Predicting the potential geographical distribution of Rhodiola L. in China under climate change scenarios. Plants. 2023;12(21):3735 [Google Scholar] [PubMed]
21. Aysajia A. Reproductive biology of Tulipa iliensis and its adaptive strategies to the early spring environment (Ph.D. Thesis). Xinjiang Agricultural University: China; 2013. [Google Scholar]
22. Nie XX. Studies on biological characteristics of Tulipa iliensis and introduction experiment of Tulipa gesneriana (Master Thesis). Xinjiang Agricultural University: China; 2015. [Google Scholar]
23. Luan QF, Ou YT, Jiang YC, Wang CX. Tulip RAPD analysis of cultivars and wild species in Xinjiang. Acta Agric Univ Jiangxiensis. 2008;4:656–60 (In Chinese). [Google Scholar]
24. Ju XT, Cai ZJ, Jaing FJ, Hou ZQ. Tulip ISSR analysis of Yili wild species and cultivars. Mol Plant Breed. 2017;15(10):4060–5 (In Chinese). [Google Scholar]
25. Ju XT, Pan EQ, Jiang FJ, Tang N, Hou ZQ. Genetic diversity of tulip germplasm revealed by ISSR markers. Genom Appl Biol. 2019;38(8):3667–74. [Google Scholar]
26. Ma XH, Tang N, Tang DC, Qu LW, Zhang WH. Phenotypic genetic diversity and ornamental value comprehensive evaluation in tulip resources. Mol Plant Breed. 2021;19(4):1320–36. [Google Scholar]
27. Chen F, Liu T, Zhou LL. Research on the biological and germinating characters of wild Tulipa. J Shihezi Univ (Nat Sci). 2001;3:197–200 (In Chinese). [Google Scholar]
28. Zhu XX, Sun L, Le JH. Research on indoor germination of wild tulips. Seed. 2005;24(11):66–7 (In Chinese). [Google Scholar]
29. Guo L, Wu L, Wang SM, Duan C, Zhao WQ. Adaptive evolutions of Tulipa iliensis Regel. Seed characteristics and germination in habitat fragmentation. Seed. 2015;34(9):1–5+10 (In Chinese). [Google Scholar]
30. Nie XX, Kang XS, Lu T, Li W, Li F, Xiong Q. Study on the seed germination characteristics of Tulipa iliensis. Seed. 2016;35(12):70–3. [Google Scholar]
31. Nie XX, Lin XF, Lu T, Liu Y, Wang Y, Li F. Preliminary study on the habit of Tulipa iliensis sleep. Jiangsu Agric Sci. 2017;45(6):121–3 (In Chinese). [Google Scholar]
32. Chen JJ. Studies on seed germination and polyploid induction of two Tulipa species (Master Thesis). Shenyang Agricultural University: China; 2018. [Google Scholar]
33. Mei LJ, Tan DY. Phenological characteristic on different populations of Tulipa iliensis Regel and Tulipa altaica Pall ex Spreng. J Xinjiang Agric Univ. 2006;4:18–21 (In Chinese). [Google Scholar]
34. Huang QH. Optimization of tulip tissue culture technology and application of drought inducible protein TgDi19 (Master Thesis). Huazhong Agricultural University: China; 2022. [Google Scholar]
35. Ju XT, Shi GM, Hou ZQ, Wu CH, Liu GF, Cao CX, et al. Characterization of the complete chloroplast genome of Tulipa iliensis (Liliaceae). Mitochondrial DNA B. 2020;5(3):2362–3. [Google Scholar]
36. Sillero N, Barbosa AM. Common mistakes in ecological niche models. Int J Geogr Inf Sci. 2021;35(2):213–26. [Google Scholar]
37. Burrough PA, McDonnell RA. Principle of geographic information systems. Oxford, UK: Oxford University Press; 1998. [Google Scholar]
38. Wang C, Sheng Q, Zhao R, Zhu Z. Differences in the suitable distribution area between northern and southern China landscape plants. Plants. 2023;12:2710 [Google Scholar] [PubMed]
39. Abolmaali SMR, Tarkesh M, Bashari H. MaxEnt modeling for predicting suitable habitats and identifying the effects of climate change on a threatened species, Daphne mucronata, in central Iran. Ecol Inform. 2018;43:116–23. [Google Scholar]
40. Ninnan OY, Arnold RJ, Chen S, Xie YJ, He S, Liu XF, et al. Prediction of the suitable distribution of Eucalyptus grandis in China and its responses to climate change. New For. 2022;53:81–99. [Google Scholar]
41. Warren DL, Matzke NJ, Cardillo M, Baumgartner JB, Beaumont LJ, Turelli M, et al. ENMTools 1.0: an R package for comparative ecological biogeography. Ecography. 2021;44:504–11. [Google Scholar]
42. Brown JL. SDM toolbox: a python-based GIS toolkit for landscape genetic, biogeographic and species distribution model analyses. Methods Ecol Evol. 2014;5:694–700. [Google Scholar]
43. Lokonon BE, Gbemavo CDSJ, Agounde G, David S, Roeland S, Kakaï RG, et al. Modelling the current and future distribution of Caesalpinia bonduc (L.) Roxb: its implication for future conservation of the species in the southern Benin. Afr J Ecol. 2023;61:389–98. [Google Scholar]
44. Qiu J, Gu X, Li X, Bi JY, Liu Y, Zheng K, et al. Identification of potentially suitable areas for nucleosides of Pinellia Ternata (Thunb.) Breit using ecological niche modeling. Environ Monit Assess. 2023;195(12):1479 [Google Scholar] [PubMed]
45. Zurell D, Franklin J, König C, Bouchet PJ, Dormann CF, Elith J, et al. A standard protocol for reporting species distribution models. Ecography. 2020;43:1261–77. [Google Scholar]
46. Fitzpatrick MC, Lachmuth S, Haydt NT. The ODMAP protocol: a new tool for standardized reporting that could revolutionize species distribution modeling. Ecography. 2021;44:1067–70. [Google Scholar]
47. Tiamiyu BB, Ngarega BK, Zhang X, Zhang HJ, Kuang TH, Huang JY, et al. Estimating the potential impacts of climate change on the spatial distribution of Garuga forrestii, an endemic species in China. Forests. 2021;12:1708. [Google Scholar]
48. Zhang H, Zhao HX, Wang H. Potential geographical distribution of populus euphratica in China under future climate change scenarios based on Maxent model. Acta Ecol Sin. 2020;40(18):6552–63. [Google Scholar]
49. Dawson TP, Jackson ST, House JI, Prentice IC, Mace GM. Beyond predictions: biodiversity conservation in a changing climate. Sci. 2011;332:53–8. [Google Scholar]
50. Xing Y, Shi J, De K, Wang X, Wang W, Ma Y, et al. The current distribution of Carex alatauensis in the Qinghai-Tibet Plateau estimated by MaxEnt. Agronomy. 2023;13(2):564. [Google Scholar]
51. Hou Z, Sun Z, Du G, Shao D, Zhong Q, Yang S. Assessment of suitable cultivation region for Pepino (Solanum muricatum) under different climatic conditions using the MaxEnt model and adaptability in the Qinghai-Tibet plateau. Heliyon. 2023;9(8):e18974 [Google Scholar] [PubMed]
52. Li GY, Zhou YD, Liu F, Liu X, Wang QF. Diversity patterns of wetland angiosperms in the Qinghai-Tibet Plateau, China. Diversity. 2022;14(10):777. [Google Scholar]
53. de Feudis M, Cardelli V, Massaccesi L, Lagomarsino A, Fornasier F, Westphalen DJ, et al. Influence of altitude on biochemical properties of European beech (Fagus sylvatica L.) forest soils. Forests. 2017;8(6):213. [Google Scholar]
54. Zhang SX, Qin RM, Yang XY, Wen J, Xu MH. Patterns of species diversity in herbaceous communities at different altitude gradients and their relationships with environmental factors in Lüliang Mountains in Shanxi Province, China. Guihaia. 2020;40(12):1860–8 (In Chinese). [Google Scholar]
55. Wu X, Zhang C, Dong S, Hu JH, Tong XY, Zheng XZ. Spatiotemporal changes of the aridity index in Xinjiang over the past 60 years. Environ Earth Sci. 2023;82:392. [Google Scholar]
56. Bilias F, Karagianni AG, Ipsilantis I, Samartza I, Krigas N, Tsoktouridis G, et al. Adaptability of wild-growing tulips of Greece: uncovering relationships between soil properties, rhizosphere fungal morphotypes and nutrient content profiles. Biology. 2023;12:605 [Google Scholar] [PubMed]
57. Wilson BN, Dolotbakov A, Burgess BJ, Clubbe C, Lazkov G, Shalpykov K, et al. Central Asian wild tulip conservation requires a regional approach, especially in the face of climate change. Biodivers Conserv. 2021;30(6):1705–30. [Google Scholar]
58. Kang XS, Zhang YZ, Yang WK, Xiong Q, Wang L, Su ZH. Ornamental value of wild Tulipa L. resources and protection in Xinjiang. J Anhui Agric Sci. 2018;46(24):39–41 (In Chinese). [Google Scholar]
59. Murillo-Pérez G, Rodríguez A, Sánchez-Carbajal D, Ruiz-Sanchez E, Carrillo-Reyes P, et al. Spatial distribution of species richness and endemism of Solanum (Solanaceae) in Mexico. Phytotaxa. 2022;558(2):147–77. [Google Scholar]
60. Fristoe TS, Vilela B, Brown JH, Botero CA. Abundant-core thinking clarifies exceptions to the abundant-center distribution pattern. Ecography. 2023;2:e06365. [Google Scholar]
61. Bruhwiler L, Basu S, Butler JH, Chatterjee A, Dlugokenchy ED, Melissa A, et al. Observations of greenhouse gases as climate indicators. Clim Change. 2021;165:12 [Google Scholar] [PubMed]
62. Huang X, Zhao C, Cai K, Huang Y. Climatic changes in the anthropocene have increased the suitable habitat areas of Paeonia delavayi in China. Pol J Environ Stud. 2023;32(5):4051–63. [Google Scholar]
63. Dong H, Zhang N, Shen S, Luo C, Gan L, Lu Y. Effects of climate change on the spatial distribution of the threatened species Rhododendron purdomii in Qinling-Daba mountains of central China: implications for Conservation. Sustainability. 2023;15(4):3181. [Google Scholar]
64. An X, Huang T, Zhang H, Yue JJ, Zhao BJ. Prediction of potential distribution patterns of three Larix Species on Qinghai-Tibet Plateau under future climate scenarios. Forests. 2023;14:1058. [Google Scholar]
65. You J, Qin X, Ranjitkar S, Lougheed SC, Wang M, Zhou W, et al. Response to climate change of montane herbaceous plants in the genus Rhodiola predicted by ecological niche modelling. Sci Rep. 2018;8(1):5879 [Google Scholar] [PubMed]
66. Li ZS, Ma YT, Li YX, Liu Y, Wang YL, Wang XY. Spatial and temporal dynamics of the potential habitat of Asterothamnus centraliasiaticus on the Qinghai-Tibet Plateau under climate change. Chin J Ecol. 2024:1–14 (In Chinese). [Google Scholar]
67. Qazi AW, Saqib Z, Zaman-ul-Haq M, Khan AM, Khan A, Khan I. Modelling impacts of climate change on habitat suitability of three endemic plant species in Pakistan. Pol J Environ Stud. 2023;32(4):3281–90. [Google Scholar]
68. Liu MX, Li L, Wang SY, Xiao SR, Mi JL. Forecasting the future suitable growth areas and constructing ecological corridors for the vulnerable species Ephedra sinica in China. J Nat Conserv. 2023;73(7):126401. [Google Scholar]
69. Tafesse B, Bekele T, Demissew S, Dullo BW, Nemomissa S, Chala D. Conservation implications of mapping the potential distribution of an Ethiopian endemic versatile medicinal plant, Echinops kebericho Mesfin. Ecol Evol. 2023;13(5):e10061 [Google Scholar] [PubMed]
70. Huang S, Zhang W, Hong Z, Zhong JB, Li YC, Liu JL, et al. Geographic distribution and impacts of climate change on the suitable habitats of Glycyrrhiza species in China. Environ Sci Pollut Res. 2023;30:55625–55634. [Google Scholar]
71. Sarıkaya AG, Kavakli SA, Uzun A. Phenological observation of Leucojum aestivum L. and determination to some morphological features and current and future potential distribution areas depending on climate change. Kuwait J Sci. 2023;50(4):639–48. [Google Scholar]
Supplementary Materials
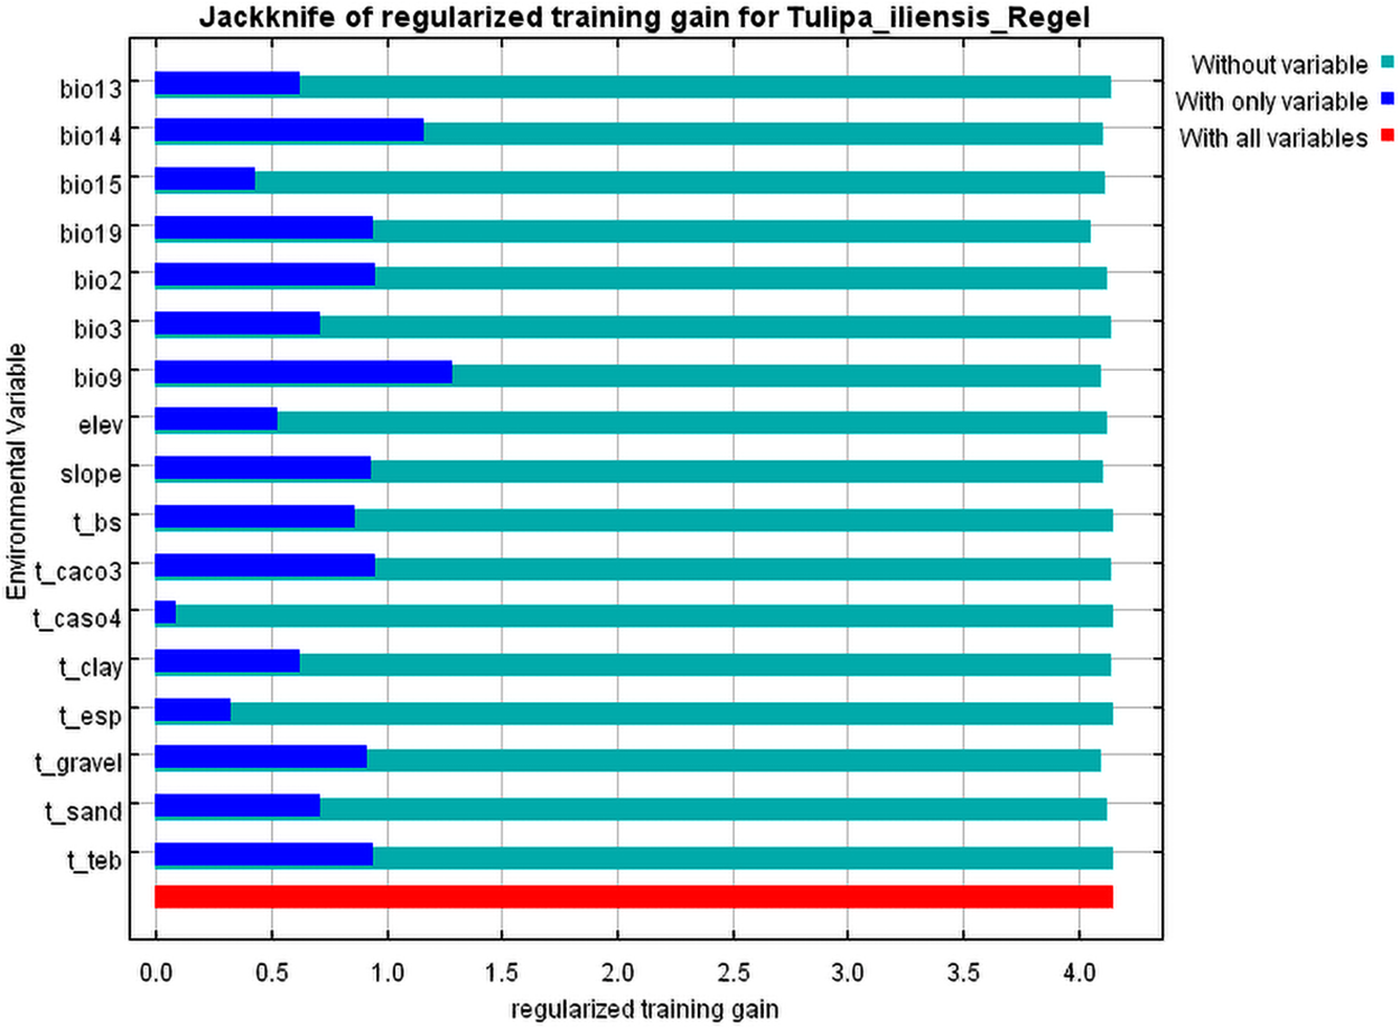
Figure S1: Important ranking of environmental variables for Tulipa iliensis by Jackknife
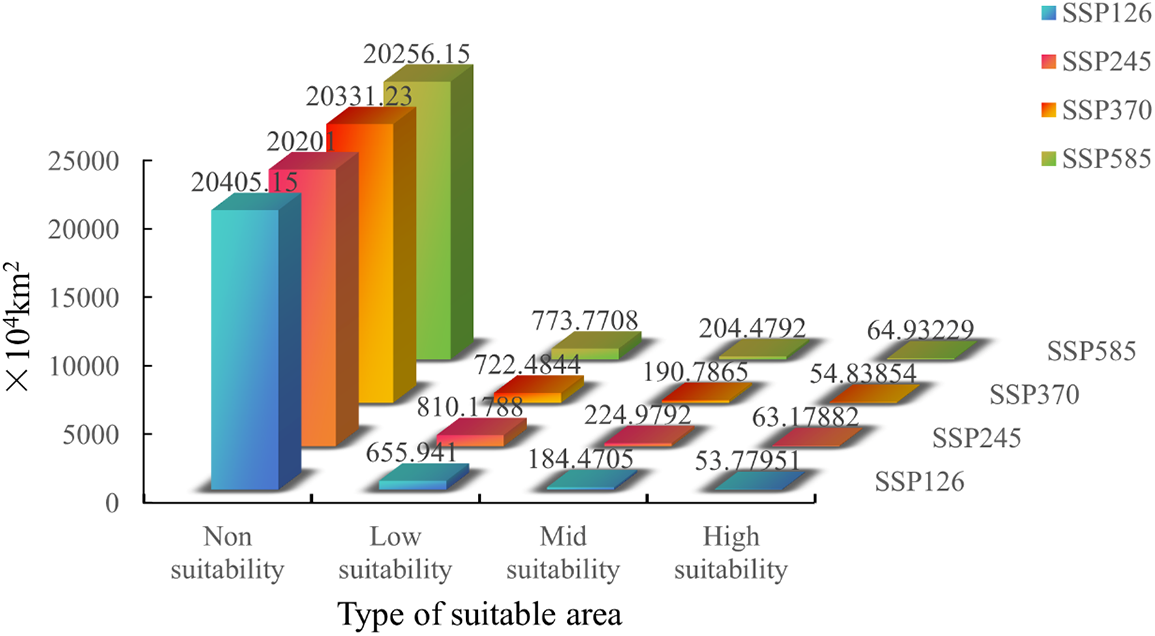
Figure S2: Suitable area of Tulipa iliensis under 2050 climate scenarios of SSP126, SSP245, SSP370, SSP585
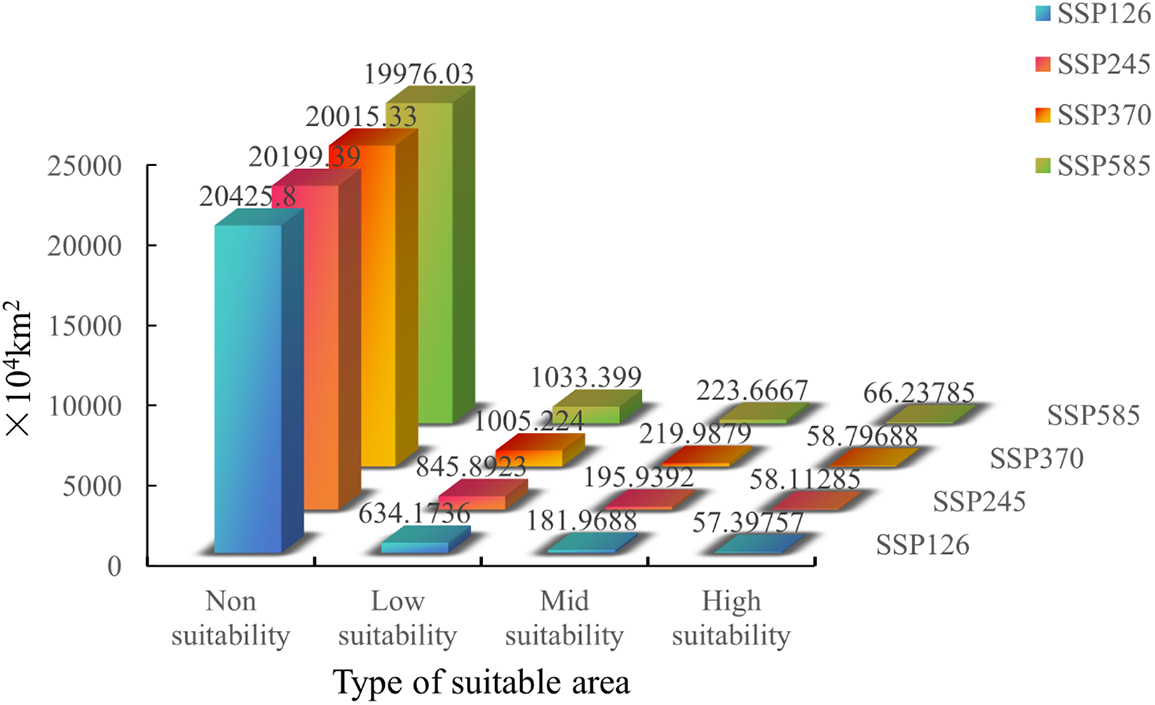
Figure S3: Suitable area of Tulipa iliensis under 2090 climate scenarios of SSP126, SSP245, SSP370, SSP585
Cite This Article
 Copyright © 2024 The Author(s). Published by Tech Science Press.
This work is licensed under a Creative Commons Attribution 4.0 International License , which permits unrestricted use, distribution, and reproduction in any medium, provided the original work is properly cited.
 Downloads
 Citation Tools