 Open Access
ARTICLE
Revealing the Effect of Different Nitrogen Fertilizer Levels on Rice Yield through Metabolite Evaluation
Rice Industry Engineering Technology Research Institute, Yangzhou University, Yangzhou, 225000, China
* Corresponding Author: Hongcheng Zhang. Email:
(This article belongs to the Special Issue: Abiotic Stress Tolerance in Crop Plants: Physio-biochemical and Molecular Mechanisms)
Phyton-International Journal of Experimental Botany 2024, 93(12), 3573-3587. https://doi.org/10.32604/phyton.2024.057690
Received 25 August 2024; Accepted 04 November 2024; Issue published 31 December 2024
Abstract
We investigated the differences in metabolites related to rice yield under different nitrogen fertilizer levels and the regulatory roles of key metabolites in metabolic pathways, in the hope of providing data support from the metabolite level for further regulation of rice yield. This study focused on the rice variety Yangchan 15002 and used non-targeted metabolomics methods to detect the metabolic products of rice leaves under three nitrogen fertilizer levels. The yield of oryza sativa plants under high nitrogen (A3: 315 kg/ha) conditions was significantly higher than that of plants under medium (A2: 270 kg/ha) and low nitrogen (A1: 180 kg/ha) conditions. The number of grains per spike in A3 was 6.53% and 18.03% greater than in A2 and A1, respectively. Furthermore, the seed setting rate and thousand-grain weight of plants subjected to A3 treatment were significantly elevated compared to those treated with A1. Thirty metabolites related to yield components were identified, among which Pipecolic Acid, Trigoncline, and (S)-2-Aceto-2-hydroxybutanoate were negatively correlated with yield. 4-methylcellulose L-glutamic acid, C5-branched dicarboxylic acid metabolism was negatively correlated with grain number per spike. Triglycerides, L-piperidine, and (S)-2-acetone-2-hydroxybutyric acid were negatively correlated with the number of grains per spike.Keywords
Rice is a critical grain crop in China, accounting for 50% of total grain production. Nitrogen nutrition is one of the key factors affecting rice yield and its components [1], and its impact on rice panicle structure is significant [2]. Japanese scholars [3] proposed achieving high rice yield by improving panicle traits as early as 1981. Yuan et al. [4] proposed a new medium to large panicle super-high yield plant type model in China. Research has shown that tillering, inflorescence branching, and small rice flowers are all formed by lateral meristem tissue [5–7]. The development of inflorescence depends on the activity of various meristem tissues, and the structure of inflorescences directly affects the number of grains per panicle and the final yield of rice [8]. Li et al. [9] believe that the main controlling gene of rice panicle type encodes a G protein gamma. When a specific gene mutation occurs, the signal transmission of the G protein will be enhanced, and the activity of meristematic tissue will be increased, promoting cell proliferation and thus increasing the number of grains per spike [10]. NOG1, which stands for “number of grain 1,” encodes the enoyl coenzyme A hydratase/isomerase protein. By upregulating the expression of this gene, one can augment the activity of enoyl CoA hydratase, leading to a reduction in the levels of fatty acids and linolenic acid within plants. Consequently, this enhancement promotes an increase in grains per spike [9,11].
So far, increasing the application of nitrogen fertilizers remains the main agronomic measure to improve rice yield. Studies have shown that with the increase in nitrogen application, rice yield shows a trend of first increasing and then decreasing [12,13]. Applying nitrogen fertilizer in the early stages of rice growth is beneficial for the early growth and rapid development of low tillers [14–16]. The SPAD value of leaves (a relative content reading of chlorophyll, reflecting the “greenness level” of plants) reflects the relative chlorophyll content in the leaves and the greenness of plants [17]. Applying additional panicle fertilizer or nitrogen fertilizer helps to delay the degradation of chlorophyll and soluble proteins in leaves, thereby extending the duration of photosynthesis [18]. The high leaf area index and SPAD values of leaves in the later stage of rice growth are related to the production of photosynthetic products [19], the improvement of grain filling rate, filling duration and filling fullness. The SOD (superoxide dismutase), POD (peroxidase), and CAT (catalase) activities in plant leaves reflect the antiaging ability of plants [20,21]. Adequate application of nitrogen fertilizer during the later growth stage boosts the nitrogen content in leaves during the grain-filling period. This, in turn, enhances the activities of SOD, POD, and CAT enzymes in the flag leaves, which helps to mitigate membrane lipid peroxidation [22] and augments the supply of polysaccharides to seeds, ultimately increasing grain weight [23].
Metabolomics is a prominent field of omics science [24] focused on analyzing the compounds synthesized or degraded within the organism, attempting to reveal the biological functions of the organism from a metabolic perspective to observe various life phenomena. Metabolomics has significantly contributed to analyzing and detecting crop physiological processes with the continuous advancement of omics technology. Metabolomics helps to comprehensively study the metabolites in crops, helping to understand their physiological conditions [25]. Metabolomics can detect changes in small molecule metabolites in crop growth organs at the biological level and provide strong evidence for crop metabolic processes through quantitative detection. Previous studies have extensively investigated the effects and mechanisms of nitrogen on rice yield. However, there is currently relatively little research on the effect of nitrogen fertilizer on rice yield through metabolomics. In this study, three distinct nitrogen fertilizer treatments were established to investigate the variations in metabolites of the rice variety Oryza sativa under varying nitrogen application rates and their correlation with high, medium, and low rice yields. Specifically, non-targeted metabolomics techniques were employed to identify metabolites present in rice leaves during the grain-filling stage. Correlation analysis between these metabolites and yield components was conducted to pinpoint those with significant correlations and screen for crucial differential metabolic pathways. The anticipation was that these results would further elucidate the regulatory mechanism of nitrogen fertilizer on rice yield formation, thereby providing a theoretical foundation for enriching the methods of regulating rice physiological processes.
2.1 Growth Conditions and Plant Materials
During the 2022 rice-growing season, field planting of Oryza sativa plants was carried out at Yangzhou University Farm, located in Yangzhou City, Jiangsu Province (coordinates: 32°39′N, 119°42′E). The soil at this farm consisted of sandy loam, possessing a nitrogen content of 1.5 g kg−1, phosphorus levels of 36.6 mg kg−1, and potassium levels of 90.8 mg kg−1. Rice sowing commenced on 25th May 2022, with manual simulation used for transplantation. The seedlings, aged 25 days, were planted at a density of four seedlings per hole.
2.2 Experimental Treatments and Design
According to the soil nutrient content in this area and the general requirements for rice yield, we set the following three nitrogen fertilizer gradients: respectively are low nitrogen treatment (A1: 180 kg/ha), medium nitrogen treatment (270 kg/ha), and high nitrogen treatment (315 kg/ha). The spacing between plants and rows was 28 cm × 12 cm, repeated three times. The area allocated for each rice community was 15 square meters. Ridges were installed between these communities and covered with black film, serving to manage weeds effectively and facilitating independent irrigation and drainage systems. Traditional high-yield rice cultivation techniques were employed for disease, pest, and weed management. As the nitrogen source, urea with a concentration of 46.4% was utilized. The basal fertilizer to tillering fertilizer to panicle fertilizer ratio was 3.5:3.5:3. Phosphate fertilizer (12%) was applied at a one-time base rate of 135 kg/ha. In comparison, potassium fertilizer (60%) was applied at a 1:1 ratio of 135 kg/ha during the base and panicle stages. The experimental field was managed according to local high-yield standards after transplantation.
2.3 Determination of the Leaf Area Index (LAI) and Leaf Color Values (SPAD)
Six representative plants were collected randomly from each treatment, and the leaf area of green leaves was measured using an LI-3100 (LI-COR, Lincoln, NE, USA) leaf area meter, which was used to calculate the leaf area index (LAI). Measure the chlorophyll content of leaves using the SPAD-502 chlorophyll meter and measure it every five days between the heading and maturity stages. Take the average SPAD value of the upper, middle, and lower one-third of each blade and measure 20 blades per sample.
2.4 Determination of Grain Yield and Yield Components
Before harvesting, 15 hills were surveyed, and effective panicle numbers were noted and averaged. Ten hills from each plot were selected to count spikelets per panicle. The 1000-grain weight and the grain filling percentage were noted. The plot yield was determined at 50 hills harvest with two replications, followed by threshing using a threshing machine to measure yield, which was converted to actual yield at 14% moisture content.
2.5 Sample Metabolite Extraction
For the metabolite extraction, we followed the method described by Zhou et al. [26]. Accurately weighed head-milled leaf samples (50 mg) were transferred to centrifuge tubes of 2 mL volume, and a bead of 6 mm diameter was added to each tube. Then, to each centrifuge tube, a 400 µL of extract (methanol: water = 4:1 (v:v)) containing a 0.02 mg mL−1 internal standard (L-2-chlorophenyl alanine) was added. The samples were ground in a frozen tissue grinder for six minutes at −10°C and 50 Hz. Subsequently, a low-temperature ultrasonic extraction process was carried out for thirty minutes at 5°C and 40 kHz. Following a holding period of thirty minutes at −20°C, the samples were then centrifuged for fifteen minutes at a speed of 13,000× g and a temperature of 4°C. The supernatant was transferred to sample vials with inner cannulas for subsequent analysis. Additionally, 20 µL of the supernatant was pooled from each sample to create a quality control (QC) sample.
2.6 Differential Metabolites and Statistical Analysis
The recognition of DM was achieved by applying the criterion of projected variable importance (VIP), which necessitates values exceeding 1 and a statistical significance level with p-values less than 0.05. To conduct a comprehensive multivariate statistical analysis, the ropls software (version 1.6.2) within the R package was utilized. Subsequently, leveraging a curated database, metabolic enrichment and pathway analysis were performed through KEGG to map and summarize the distinctions in DM between the two groups onto biochemical pathways. These metabolites were categorized according to their specific pathway involvement or functional roles. Enrichment analysis was conducted to ascertain whether the metabolite groups were concentrated within specific functional nodes. This process initially zeroed in on individual metabolites before broadening its scope to encompass groups of metabolites. For statistically significant enrichment pathway determination, the Scipy.stats module (Python package, version 1.0.0; accessed on 15 December 2022, at https://docs.scipy.org/doc/scipy/, specifically Fisher’s exact test, was employed.
Data analysis involved sorting and calculating the average values using Excel 2021 software. SPSS 18.0 statistical software was utilized for the variance analysis of rice quality data, and Adobe illustrator CS6 software was employed to generate consolidated figures. To verify the credibility of the data, we conducted a multivariable statistics using PCA (principal component analysis) and PIS-DA (partial least squares discriminant analysis).
3.1 Yield and Yield Components
Significant variations were observed in the rice yield of Oryza sativa plants subjected to diverse nitrogen fertilizer treatments. The yield of plants in the A3 treatment was the highest at 8.61 t hm−1, which was 6.88% and 27.60% higher than the A2 and A1 treatments, respectively (Table 1). The yield composition factors showed that the number of grains per spike of Yangchan 1500 plants significantly increased with the increase in nitrogen application. The plants in the A3 treatment were 6.53% and 18.03% higher than those in the A2 and A1 treatments. respectively. Respectively, no significant differences were discernible in the seed setting rate and thousand-grain weight between plants in the A2 and A3 treatments; however, both treatments demonstrated significantly higher values than those of the A1 treatment. there were insignificant variations in the number of panicles per unit area across the different nitrogen fertilizer treatments. Elevated nitrogen fertilizer levels were found to markedly enhance the number of grains per panicle, seed setting rate, and thousand-grain weight, albeit with a minor impact on the number of panicles per unit area.

3.2 SPAD Was Increased by Applying Nitrogen Fertilizer
The nitrogen fertilizer treatment had a pronounced effect on the SPAD value. with the highest readings recorded in plants subjected to the A3 treatment across all leaf positions of the final three leaves. Elevated nitrogen fertilizer application rates resulted in delayed leaf senescence and an extended green leaf duration. The transient decline in SPAD values observed between 13th September and 23rd September in the second and third leaves could potentially be attributed to nitrogen translocation, facilitating efficient photosynthesis in the primary leaf (Fig. 1).
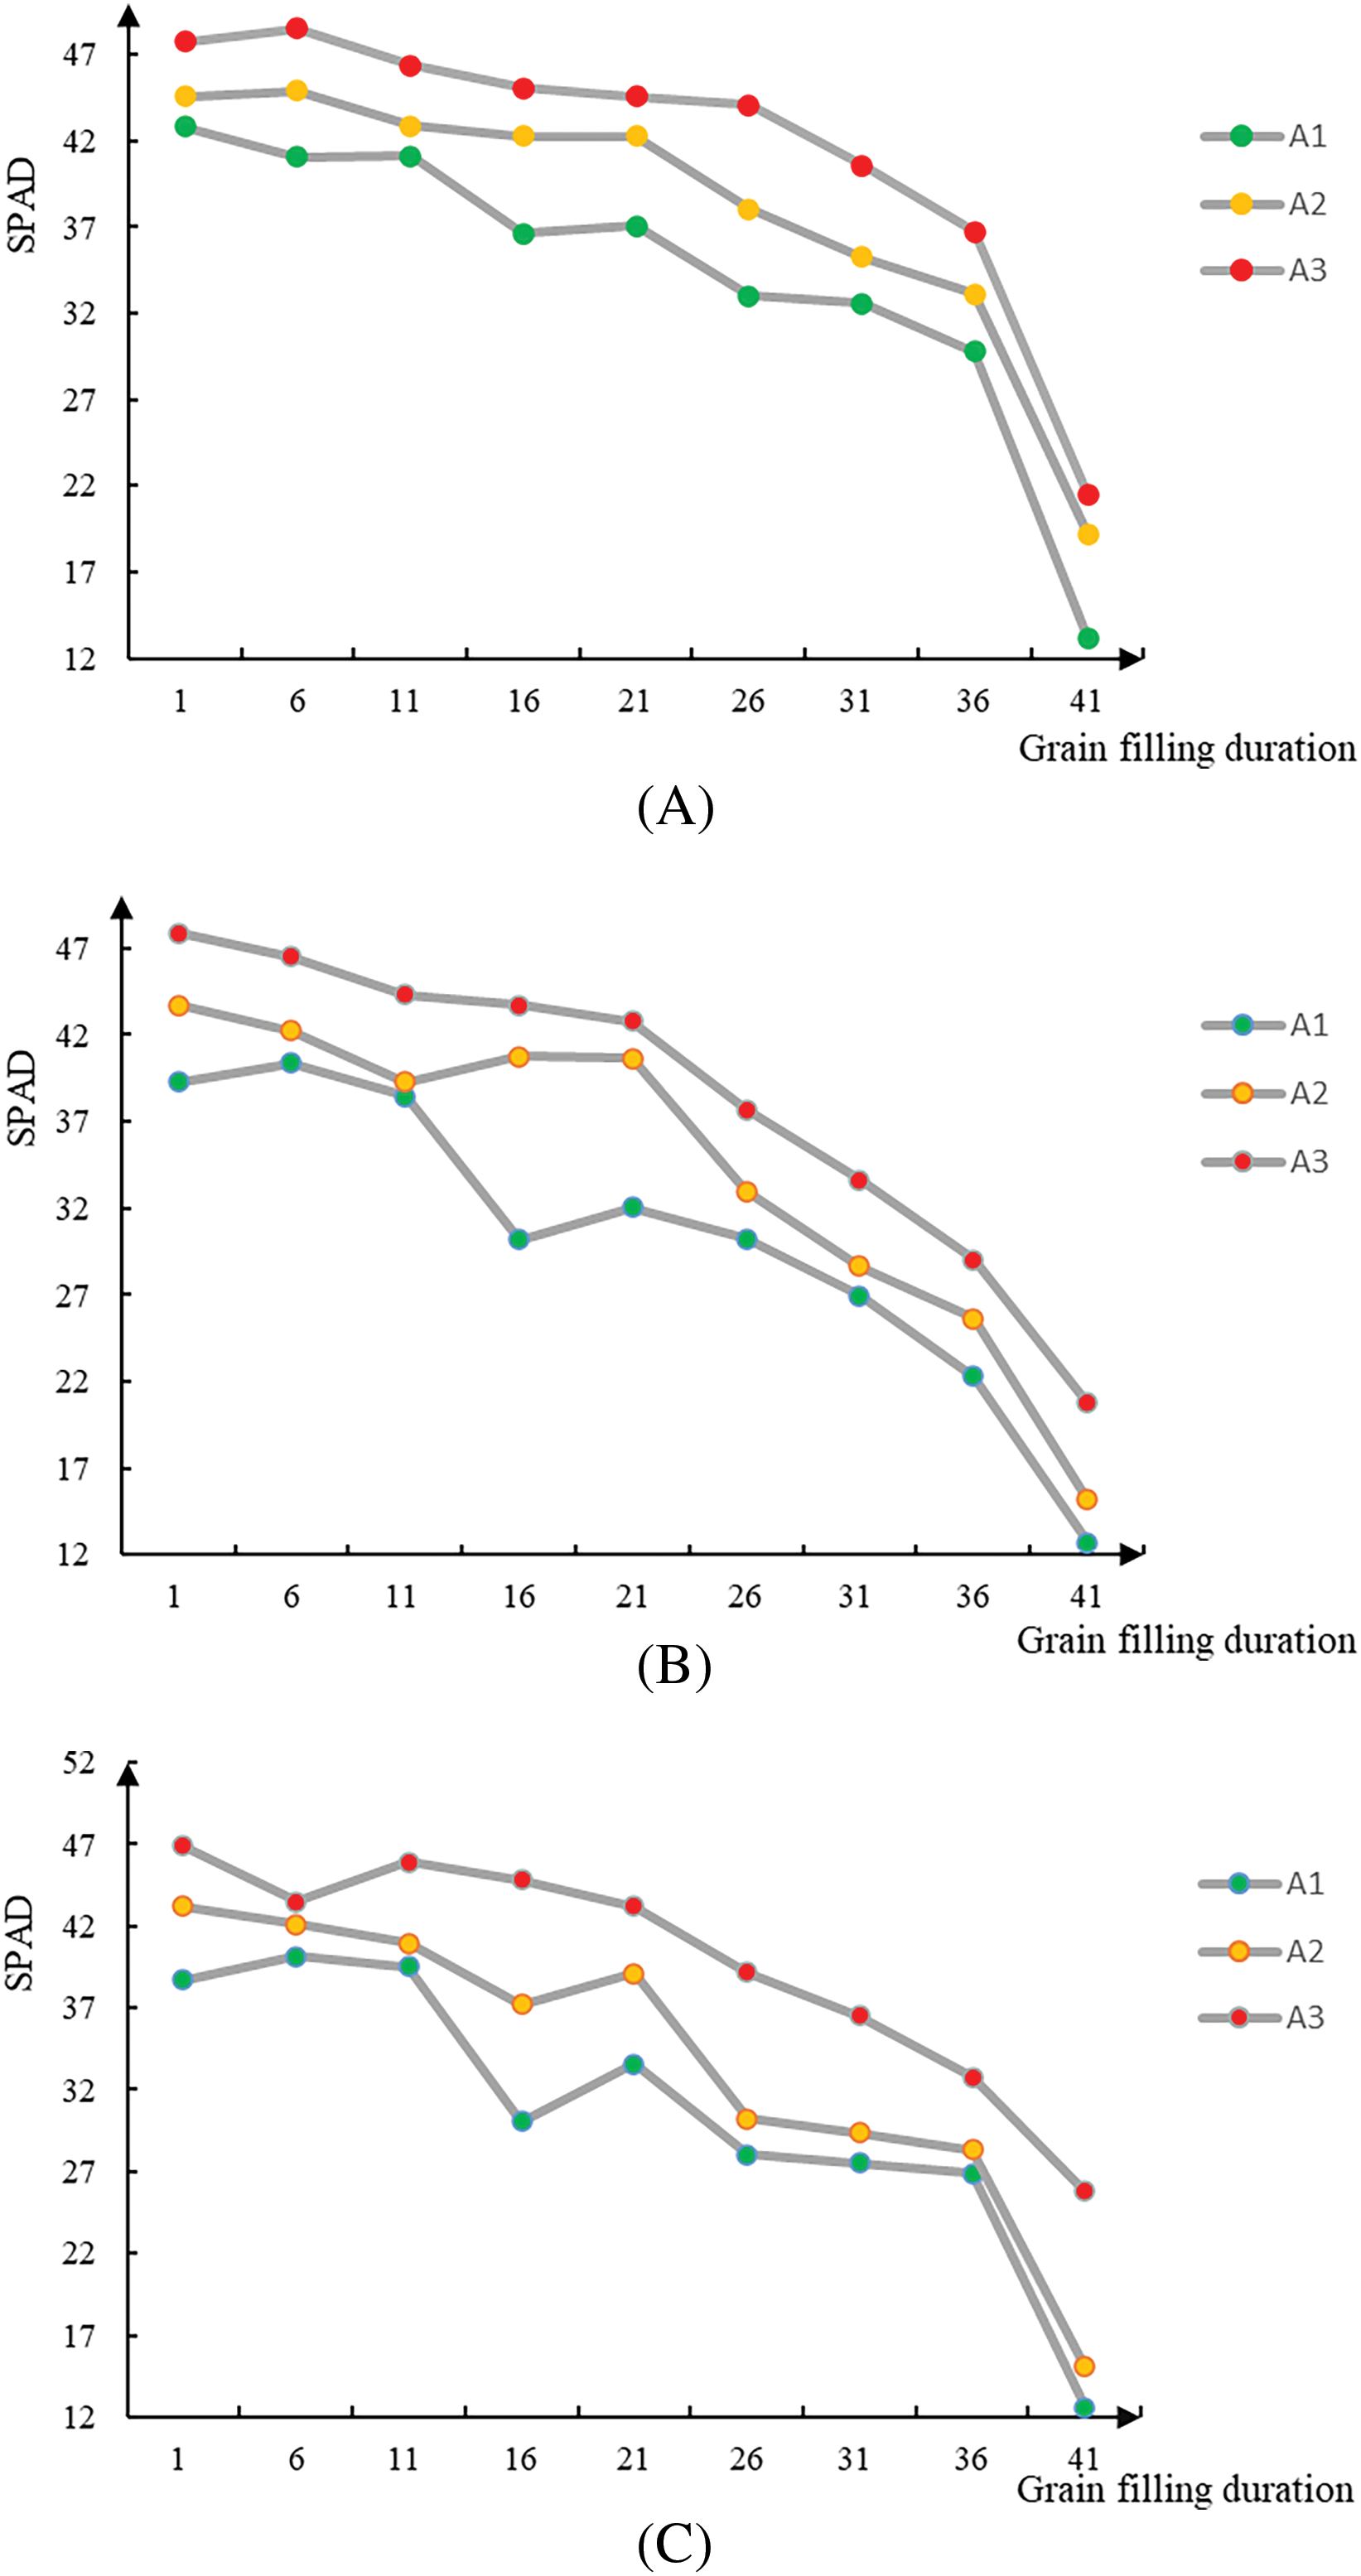
Figure 1: Changes in leaf SPAD values over time under different nitrogen fertilizer conditions. Note: (A) SPAD value of inverted leaf of rice under different nitrogen fertilizer gradients at filling stage; (B) SPAD value of inverted two-leaf rice under different nitrogen fertilizer gradients at filling stage; (C) SPAD value of inverted three-leaf rice under different nitrogen fertilizer gradients at filling stage
3.3 The Leaf Area Index Was Increased by Applying Nitrogen Fertilizer
The application of nitrogen fertilizerhad a significant impact on the leaf area index (LAI) of Oryza sativa plants at various growth stages. During the jointing stage, the leaf area index of plants in the A3 and A2 treatments was notably higher than those in the A1 treatment, showing increases of 15.03% and 20.77%. The heading period of plants in the A3 treatment was significantly higher than in the A1 and A2 treatments, with increases of 8.29% and 4.84%. At maturity, the LAI of plants in the A3 treatment was 25.55% and 11.76% higher than that of plants in the A1 and A2 treatments, respectively (as shown in Table 2). When comparing the leaf area attenuation rate from the heading stage to the mature stage, it was observed that the attenuation rates decreased with increasing nitrogen fertilizer application, the attenuation rate in the A3 treatment was significantly lower than that in the A1 and A2 treatments.

3.4 Correlation Analysis with Yield
This article conducted a correlation analysis of the yield, SPAD value, and leaf area index (LAI) during key growth periods of Oryza sativa (rice). The yield of rice was positively correlated with the LAI during a critical growth stage (such as tillering or heading) and the SPAD value measured on 23rd September, as shown in Table 3. These findings indicate that both the LAI during a pivotal growth stage and chlorophyll content at a specific point in time are influential factors in determining rice yield.

The heatmap generated through cluster analysis offered a comprehensive insight into the accumulation patterns of diverse metabolites across various nitrogen fertilizer treatments (as illustrated in Fig. 2A). Notable disparities were evident in the metabolite profiles of the different nitrogen fertilizer treatments, while the biological replicates within each group demonstrated a high degree of similarity (as depicted in Fig. 2B).
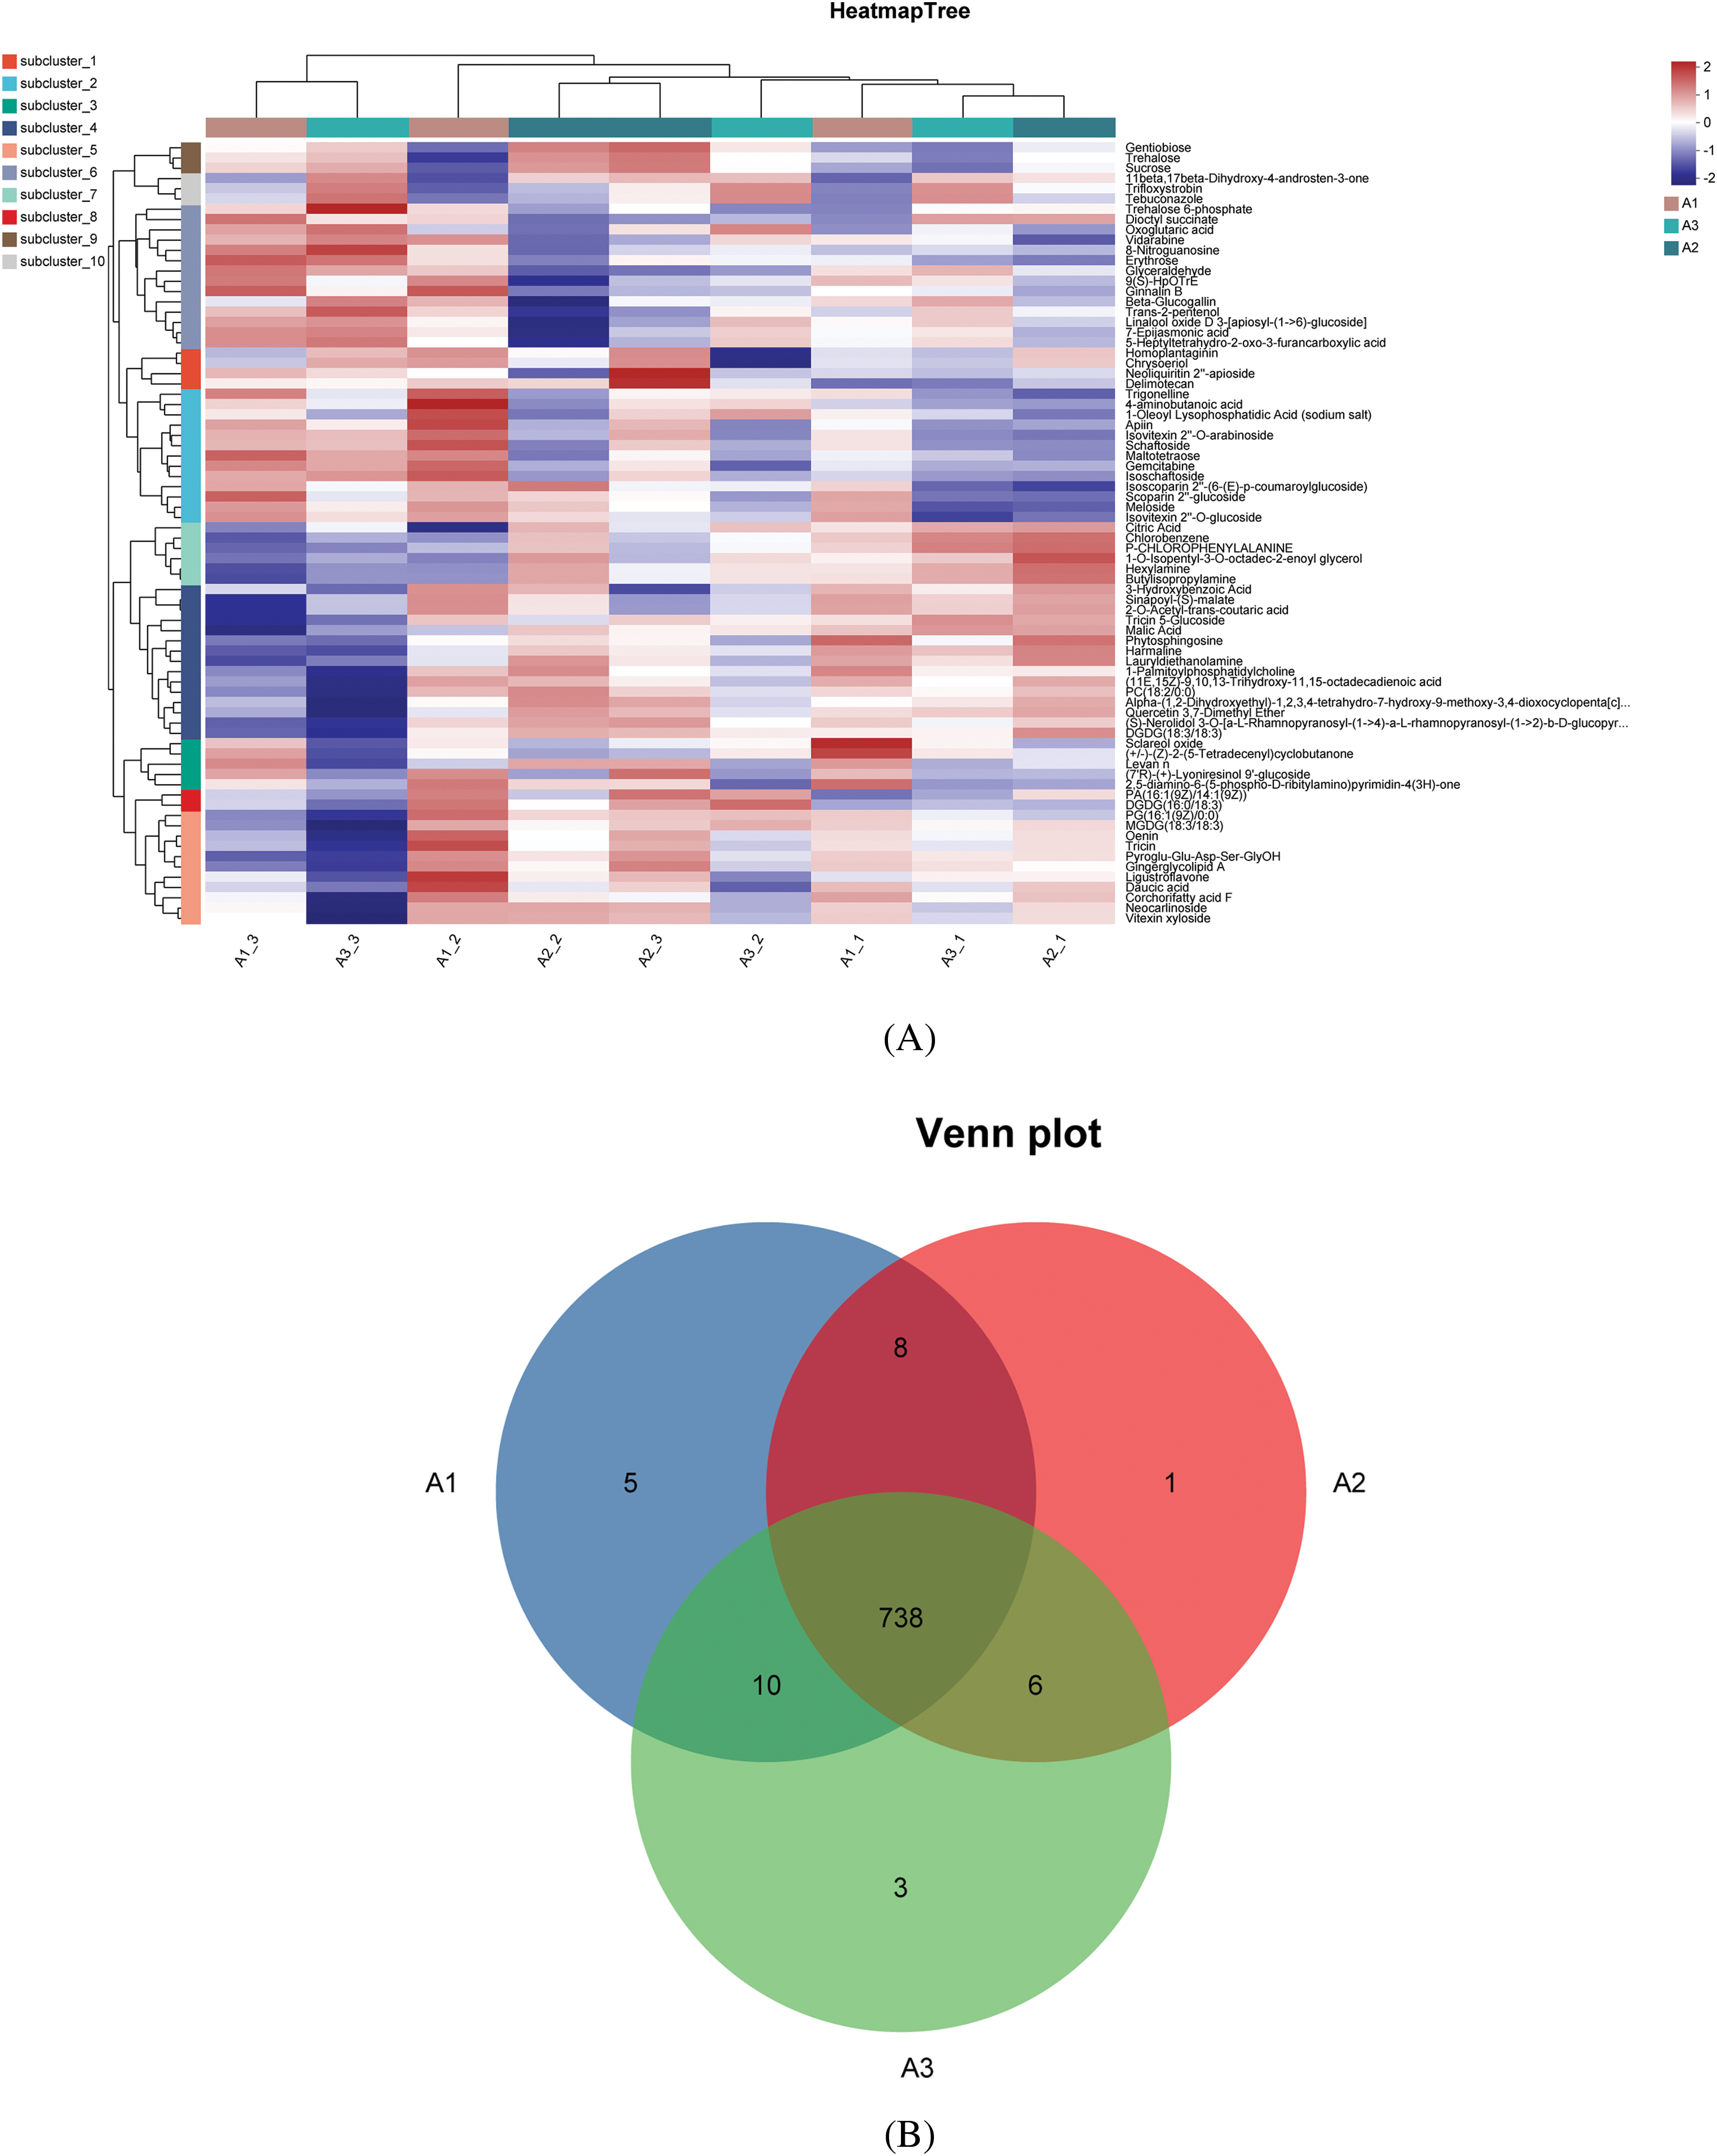
Figure 2: Hierarchical clustering heatmap and metabolite analysis. Note: (A) Hierarchical clustering heatmaps of three nitrogen fertilizer treatments. (B) Metabolite Wayne distribution map
3.6 Multivariate Statistics and Volcano Charts
In the A1-VS-A2 control group (as depicted in Fig. 3), a total of 98 differential metabolites (DMs) were identified, with 14 showing increased levels and 84 decreased levels. We have presented the names of the selected HMDB levels (superclass) and have organized the percentage of metabolites in descending order based on their quantity. Each pie chart within Fig. 4 represents different HMDB subtypes, where the colors signify distinct categories, and the area of each segment indicates the proportion of that category to the total metabolites. Specifically, lipids and lipid-like molecules comprised 43.26% of the metabolites, followed by organic acids at 13.48%, phenylpropanoids and polyketides at 11.8%, organic oxygen compounds at 10.67%, organic heterocyclic compounds at 7.87%, benzene ring compounds at 4.49%, and alkaloids and their derivatives at 1.12%.
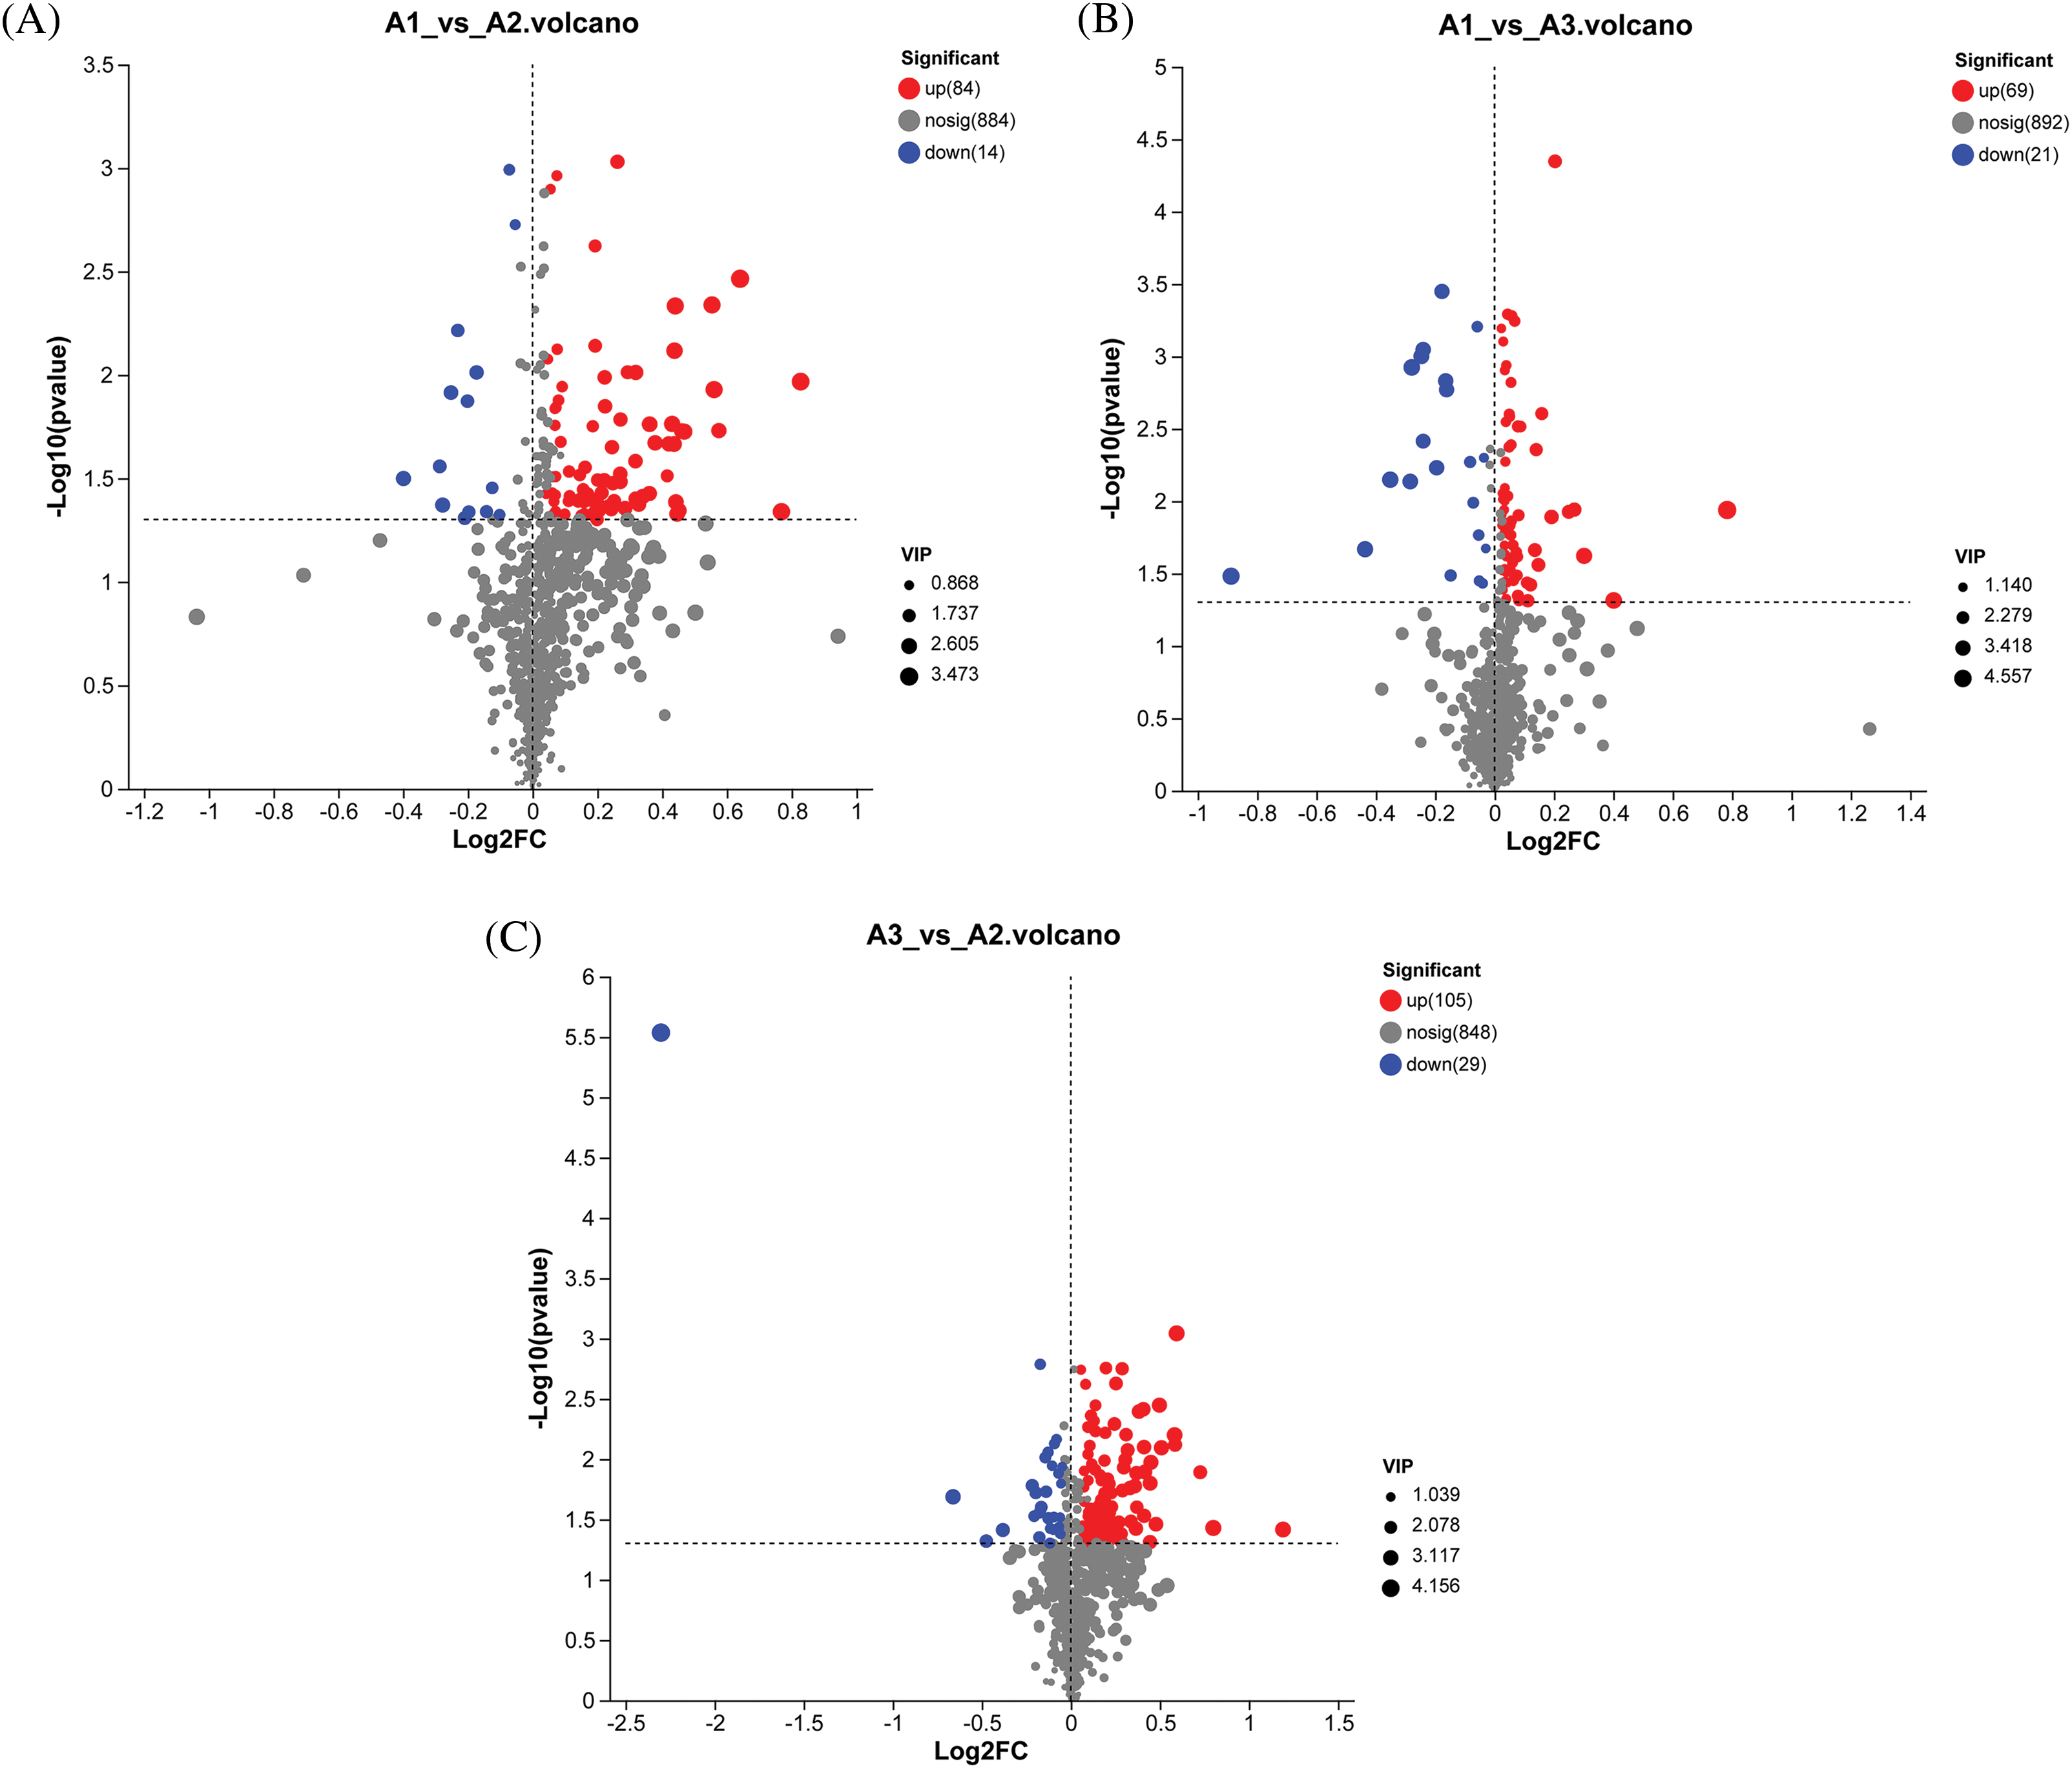
Figure 3: DMS volcano map. Note: Each point represents a specific metabolite, and the size of the points corresponds to the VIP value. VIP > 1, fold change = 1, and p < 0.05 are metabolites with significant differences. The downregulated metabolite is on the left, while the upregulated metabolite is on the right. The closer the point is to the edge, the higher the significance of the differential expression. (A) A1 and A2 processing comparison. (B) A1 and A3 processing comparison. (C) A3 and A2 processing comparison
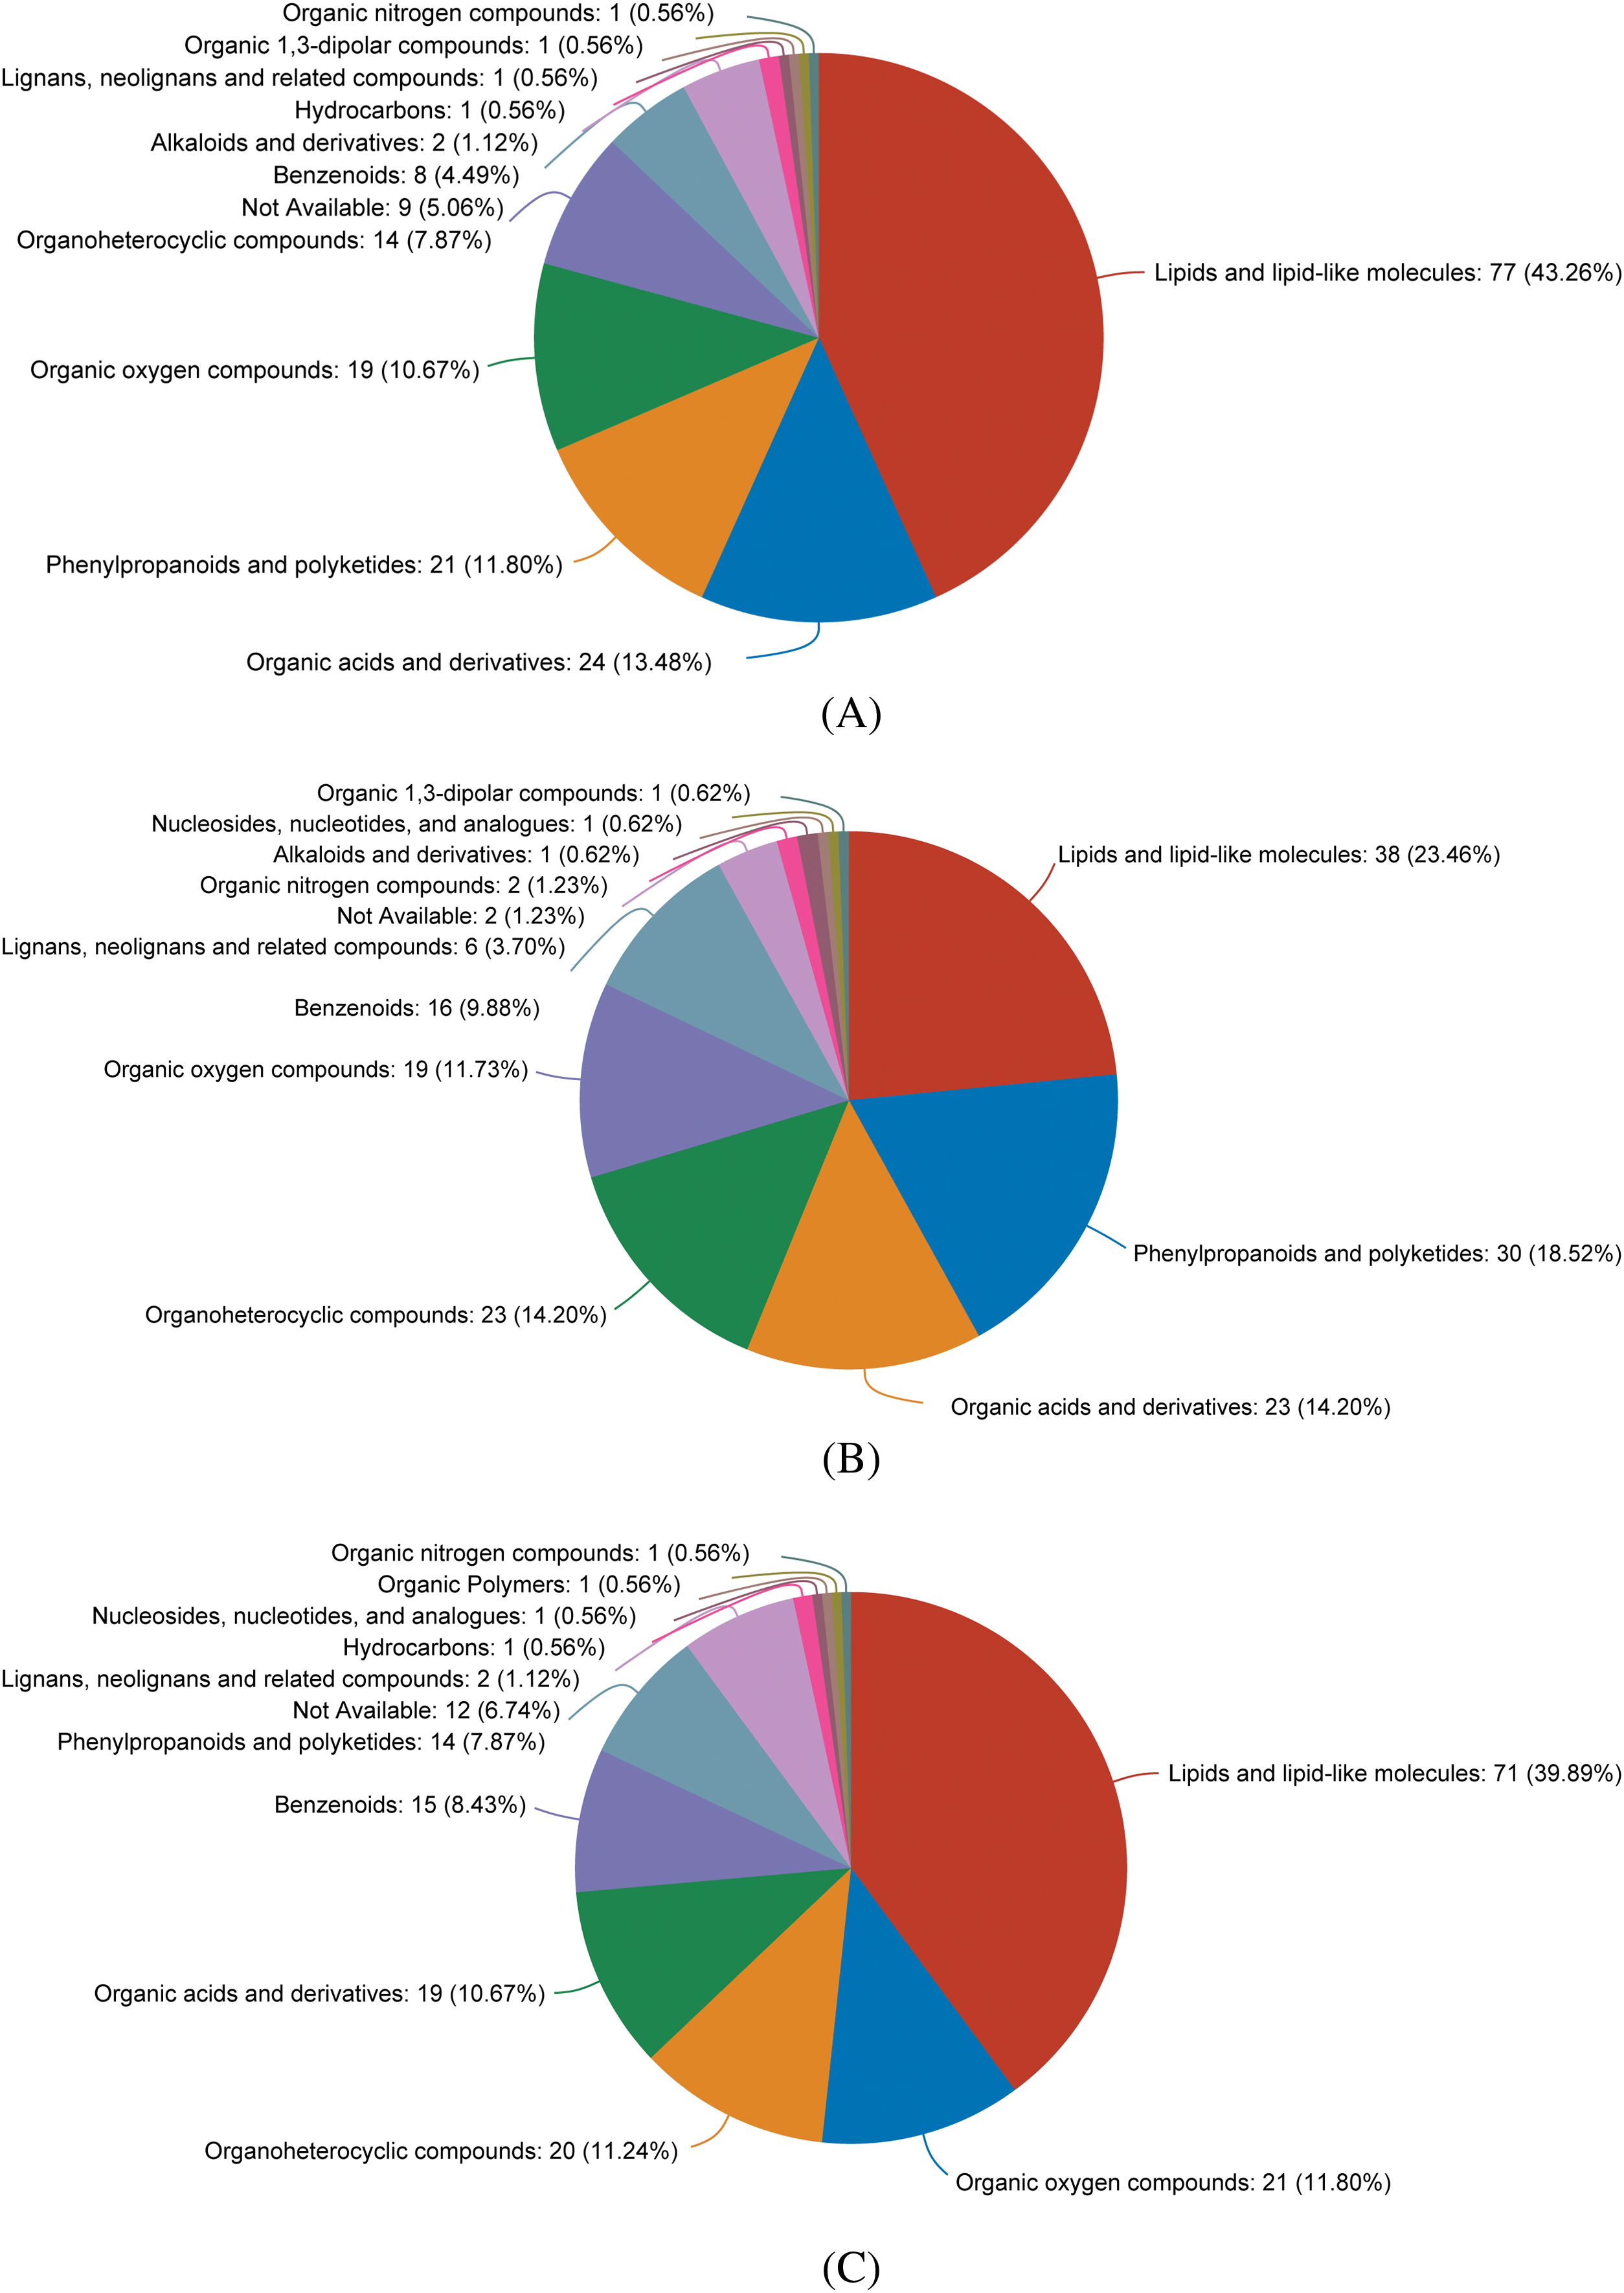
Figure 4: Compound statistical diagram (class) based on HMDB hierarchical structure. Note: (A) The comparison between treatments A1 and A2 shows that the categories of metabolites are arranged in a decreasing abundance manner. (B) Comparison between the A3 and A1 treatments, displaying metabolite categories in descending abundance order. (C) Comparison between the A3 and A2 treatments, displaying metabolite categories in descending abundance order
In the A3-VS-A2 control group, a total of 138 differential metabolites (DMs) were identified, with 29 showing increased levels and 105 decreased levels. The composition of these metabolites included lipids and lipid-like molecules accounting for 39.89%, organic oxides at 11.8%, organic heterocyclic compounds at 11.24%, organic acids and their derivatives at 10.67%, benzene ring compounds at 8.43%, phenylpropanoids and polyketones at 7.87%, and lignin, new signal elements, and related compounds at 1.12%.
In the A1-VS-A3 control group, a total of 90 differential metabolites (DMs) were identified, with 21 showing increased levels and 69 decreased levels. The composition of these metabolites was as follows: lipids and lipid-like molecules accounted for 23.46%, phenylpropanoids and polyketones for 18.52%, organic acids and their derivatives for 14.20%, organic heterocyclic compounds for 14.20%, organic oxygen compounds for 11.73%, benzene ring compounds for 9.88%, lignin, new signaling elements, and related compounds for 3.7%, and organic nitrogen compounds for 1.23%. A comparison among the three treatments revealed 738 common metabolites, suggesting similar metabolic characteristics across the treatments. Each treatment exhibited a unique metabolic profile, underscoring the distinct metabolic features of each. Furthermore, each comparative metabolome was visualized through a volcano plot, offering a comprehensive perspective on the metabolites and their statistical significance (as depicted in Fig. 3).
3.7 Correlation Analysis between Rice Yield Indicators and Metabolic Product Levels
A correlation analysis was performed to investigate the correlation and potential associations between specific yield components and varying metabolite levels, aiming to elucidate the relationship between yield and metabolite concentrations (as depicted in Fig. 5). Notably, 11β,17β-dihydroxy-4-androsten-3-one and succindifuran exhibited positive correlations with yield, the number of grains per spike, and the SPAD value measured on 23rd September. Azoxystrobin and methylcellulose demonstrated significant positive correlations with both the number of grains per spike, the SPAD value on September 23rd, and the SPAD value recorded on September 8th. Additionally, tebuconazole showed a significant correlation with the SPAD value on September 8th and the leaf area index. Furthermore, 11β and 17β-dihydroxy-4-androsten-3-one were positively associated with 1000-grain weight and the seed setting rate.
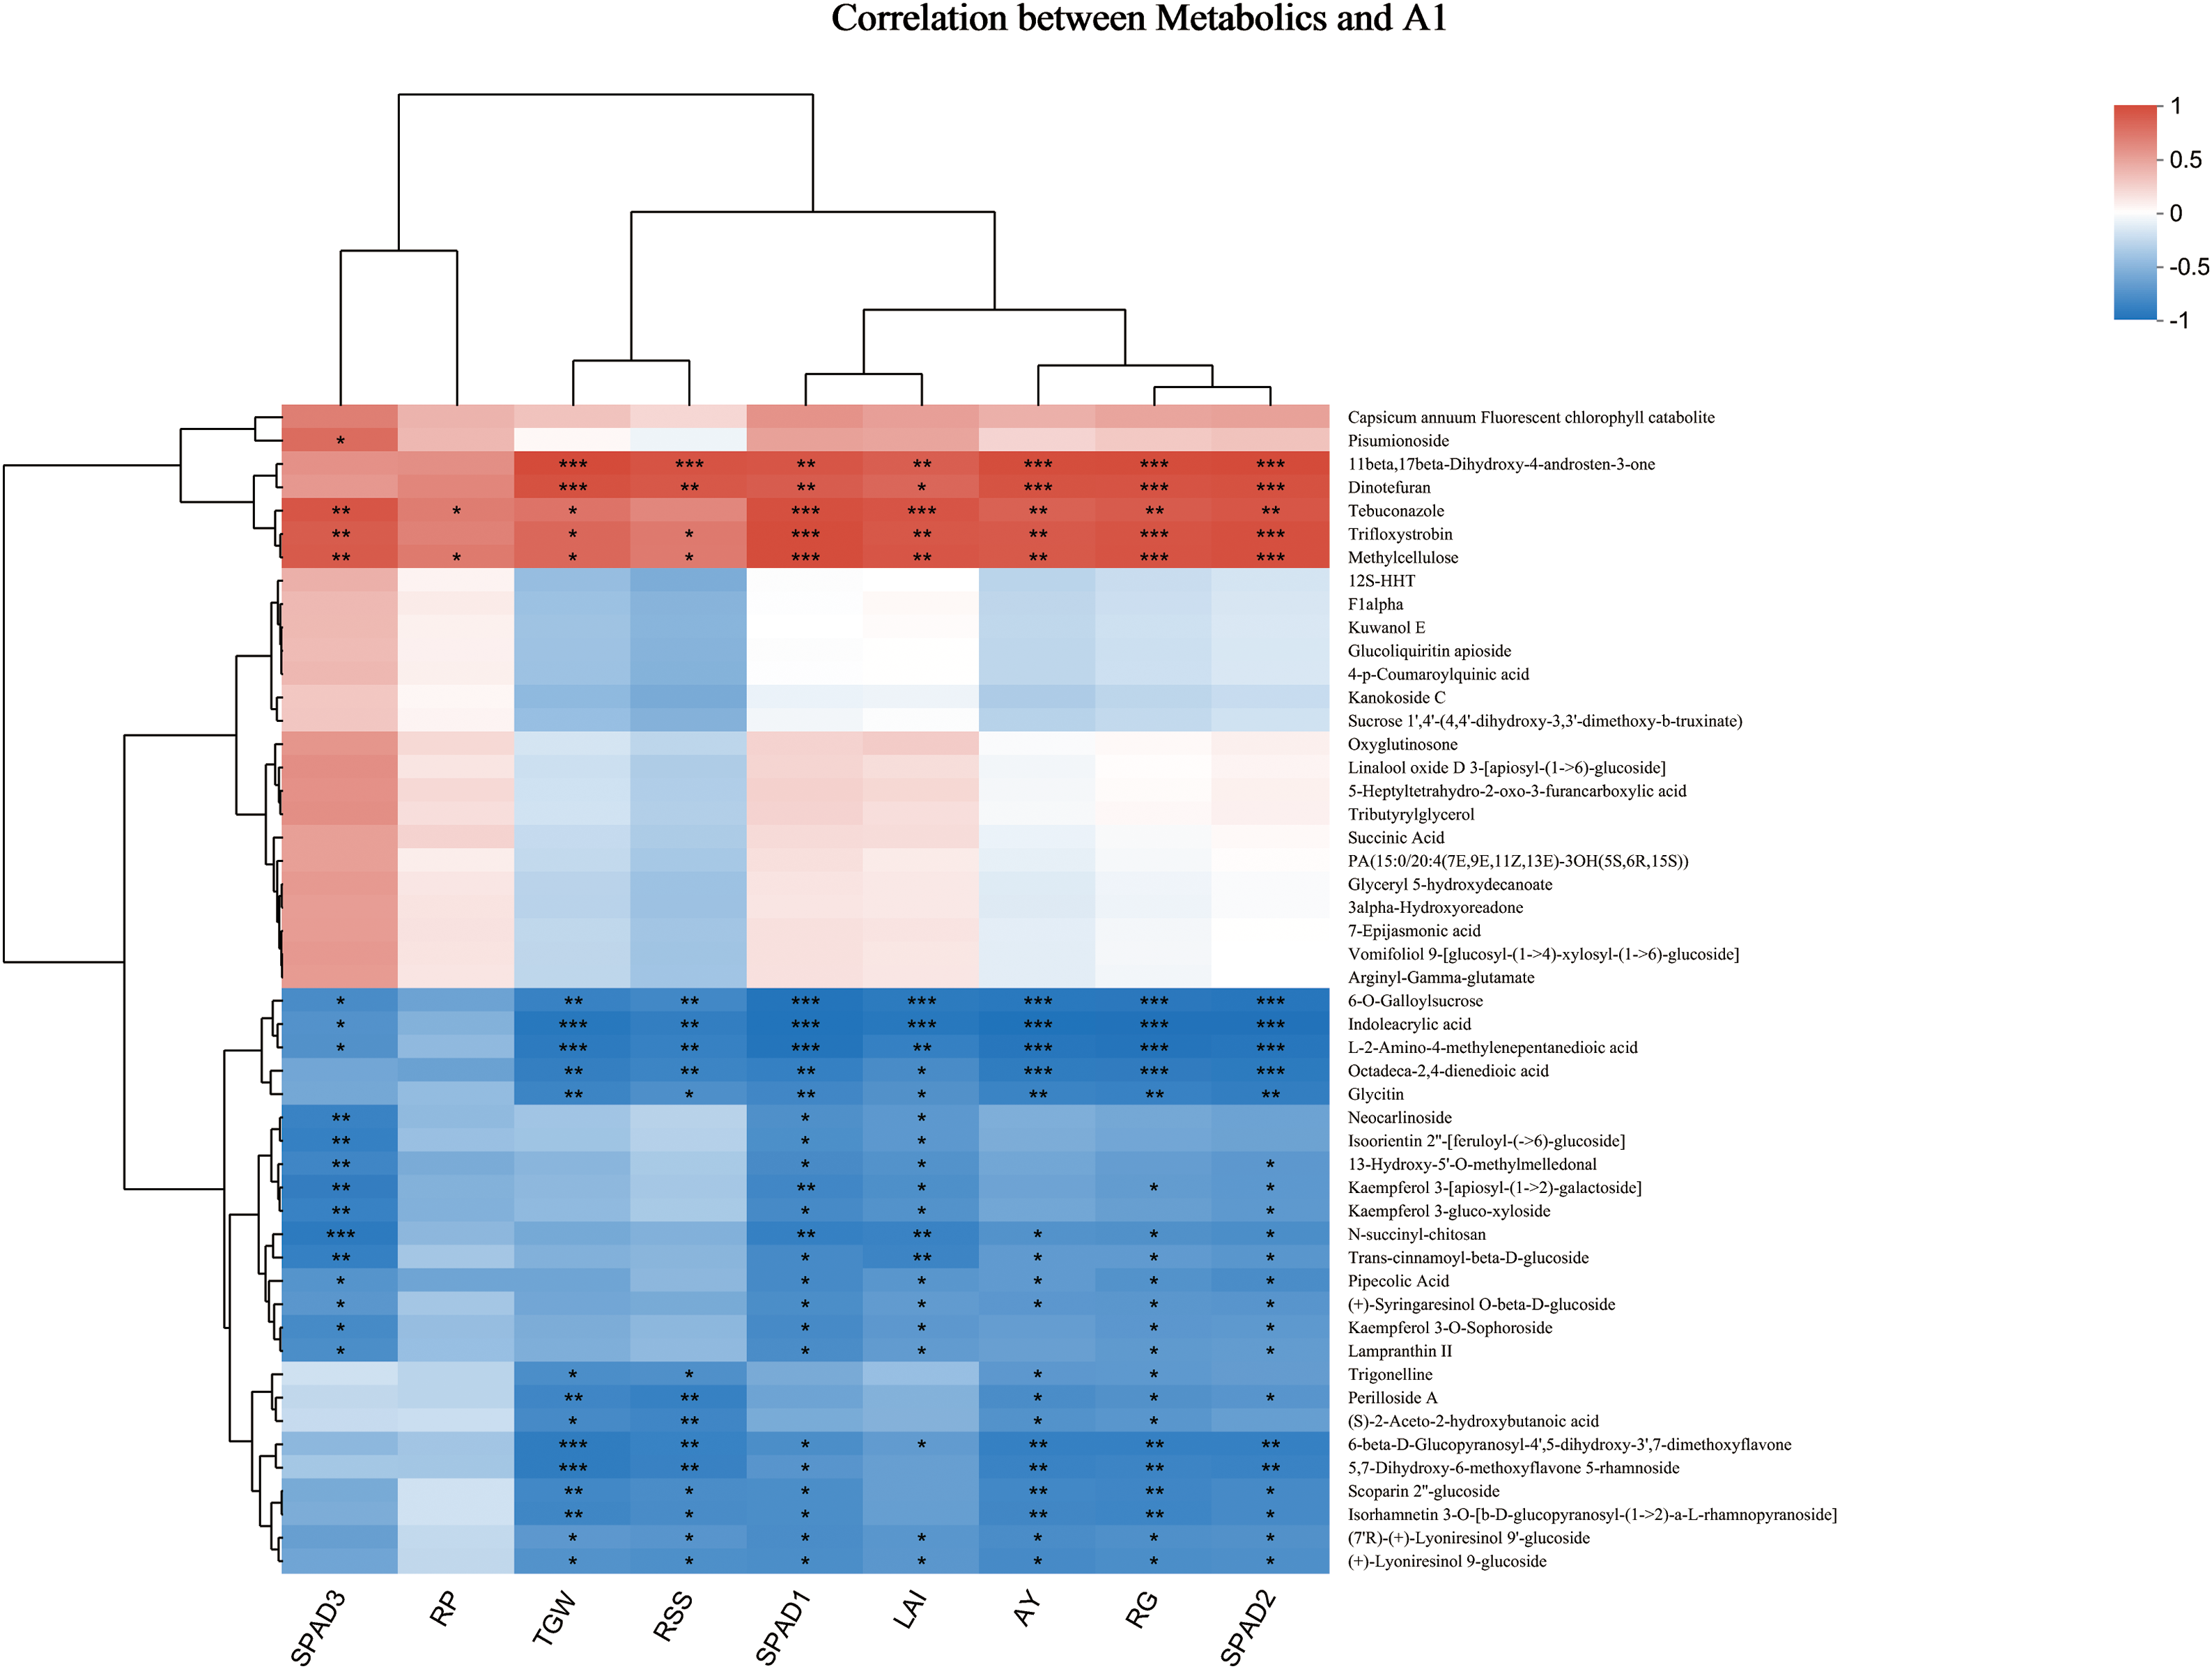
Figure 5: Correlation analysis between rice yield composition and DMS. Note: Each cell represents the correlation between two attributes (metabolites and related features), and different colors indicate the size of the correlation coefficient between the attributes. * represents statistical significance at the p = 0.05 level, ** represents statistical significance at the p = 0.01 level, and *** represents statistical significance at the p = 0.001 level. RP: number of ears; RG: number of particles; RSS: seed setting rate; TGW: thousand-grain weight; LAI: leaf area index; SPAD1: SPAD value on 4th September; SPAD value on 18th September; SPAD3: SPAD value on 14th October; AY: Production
Dinotefuran displayed a significant positive correlation with 1000-grain weight. Conversely, 6-O-glyceryl sucrose, indole acrylic acid, L-2-amino-4-methylenedicarboxylic acid, and octadecane-2,4-methylenedicarboxylic acid exhibited significant negative correlations with yield, the number of grains per spike, and the SPAD value measured on 23rd September. Additionally, both 6-O-sucrose gallate and indole acrylic acid showed negative correlations with the SPAD value on 8th September and the leaf area index. Notably, L-2-amino-4-methylenedioic acid was significantly negatively correlated with the SPAD value on 8th September. Furthermore, indomethacin, L-2-amino-4-methylenedioic acid, 6-β-D-glucopyranose-4,5-dihydroxy-3,7-dimethylflavone, 5,7-dihydroxy-6-methoxyflavone-5-rhamnoside demonstrated negative correlations with 1000-grain weight. N-succinyl chitosan was negatively correlated with the SPAD value recorded on 14th October.
Utilizing metabolites associated with yield components as our starting point, we conducted a search for pertinent metabolite cycles and, based on a thorough metabolite correlation analysis, constructed a pathway diagram, which is illustrated in Fig. 6.
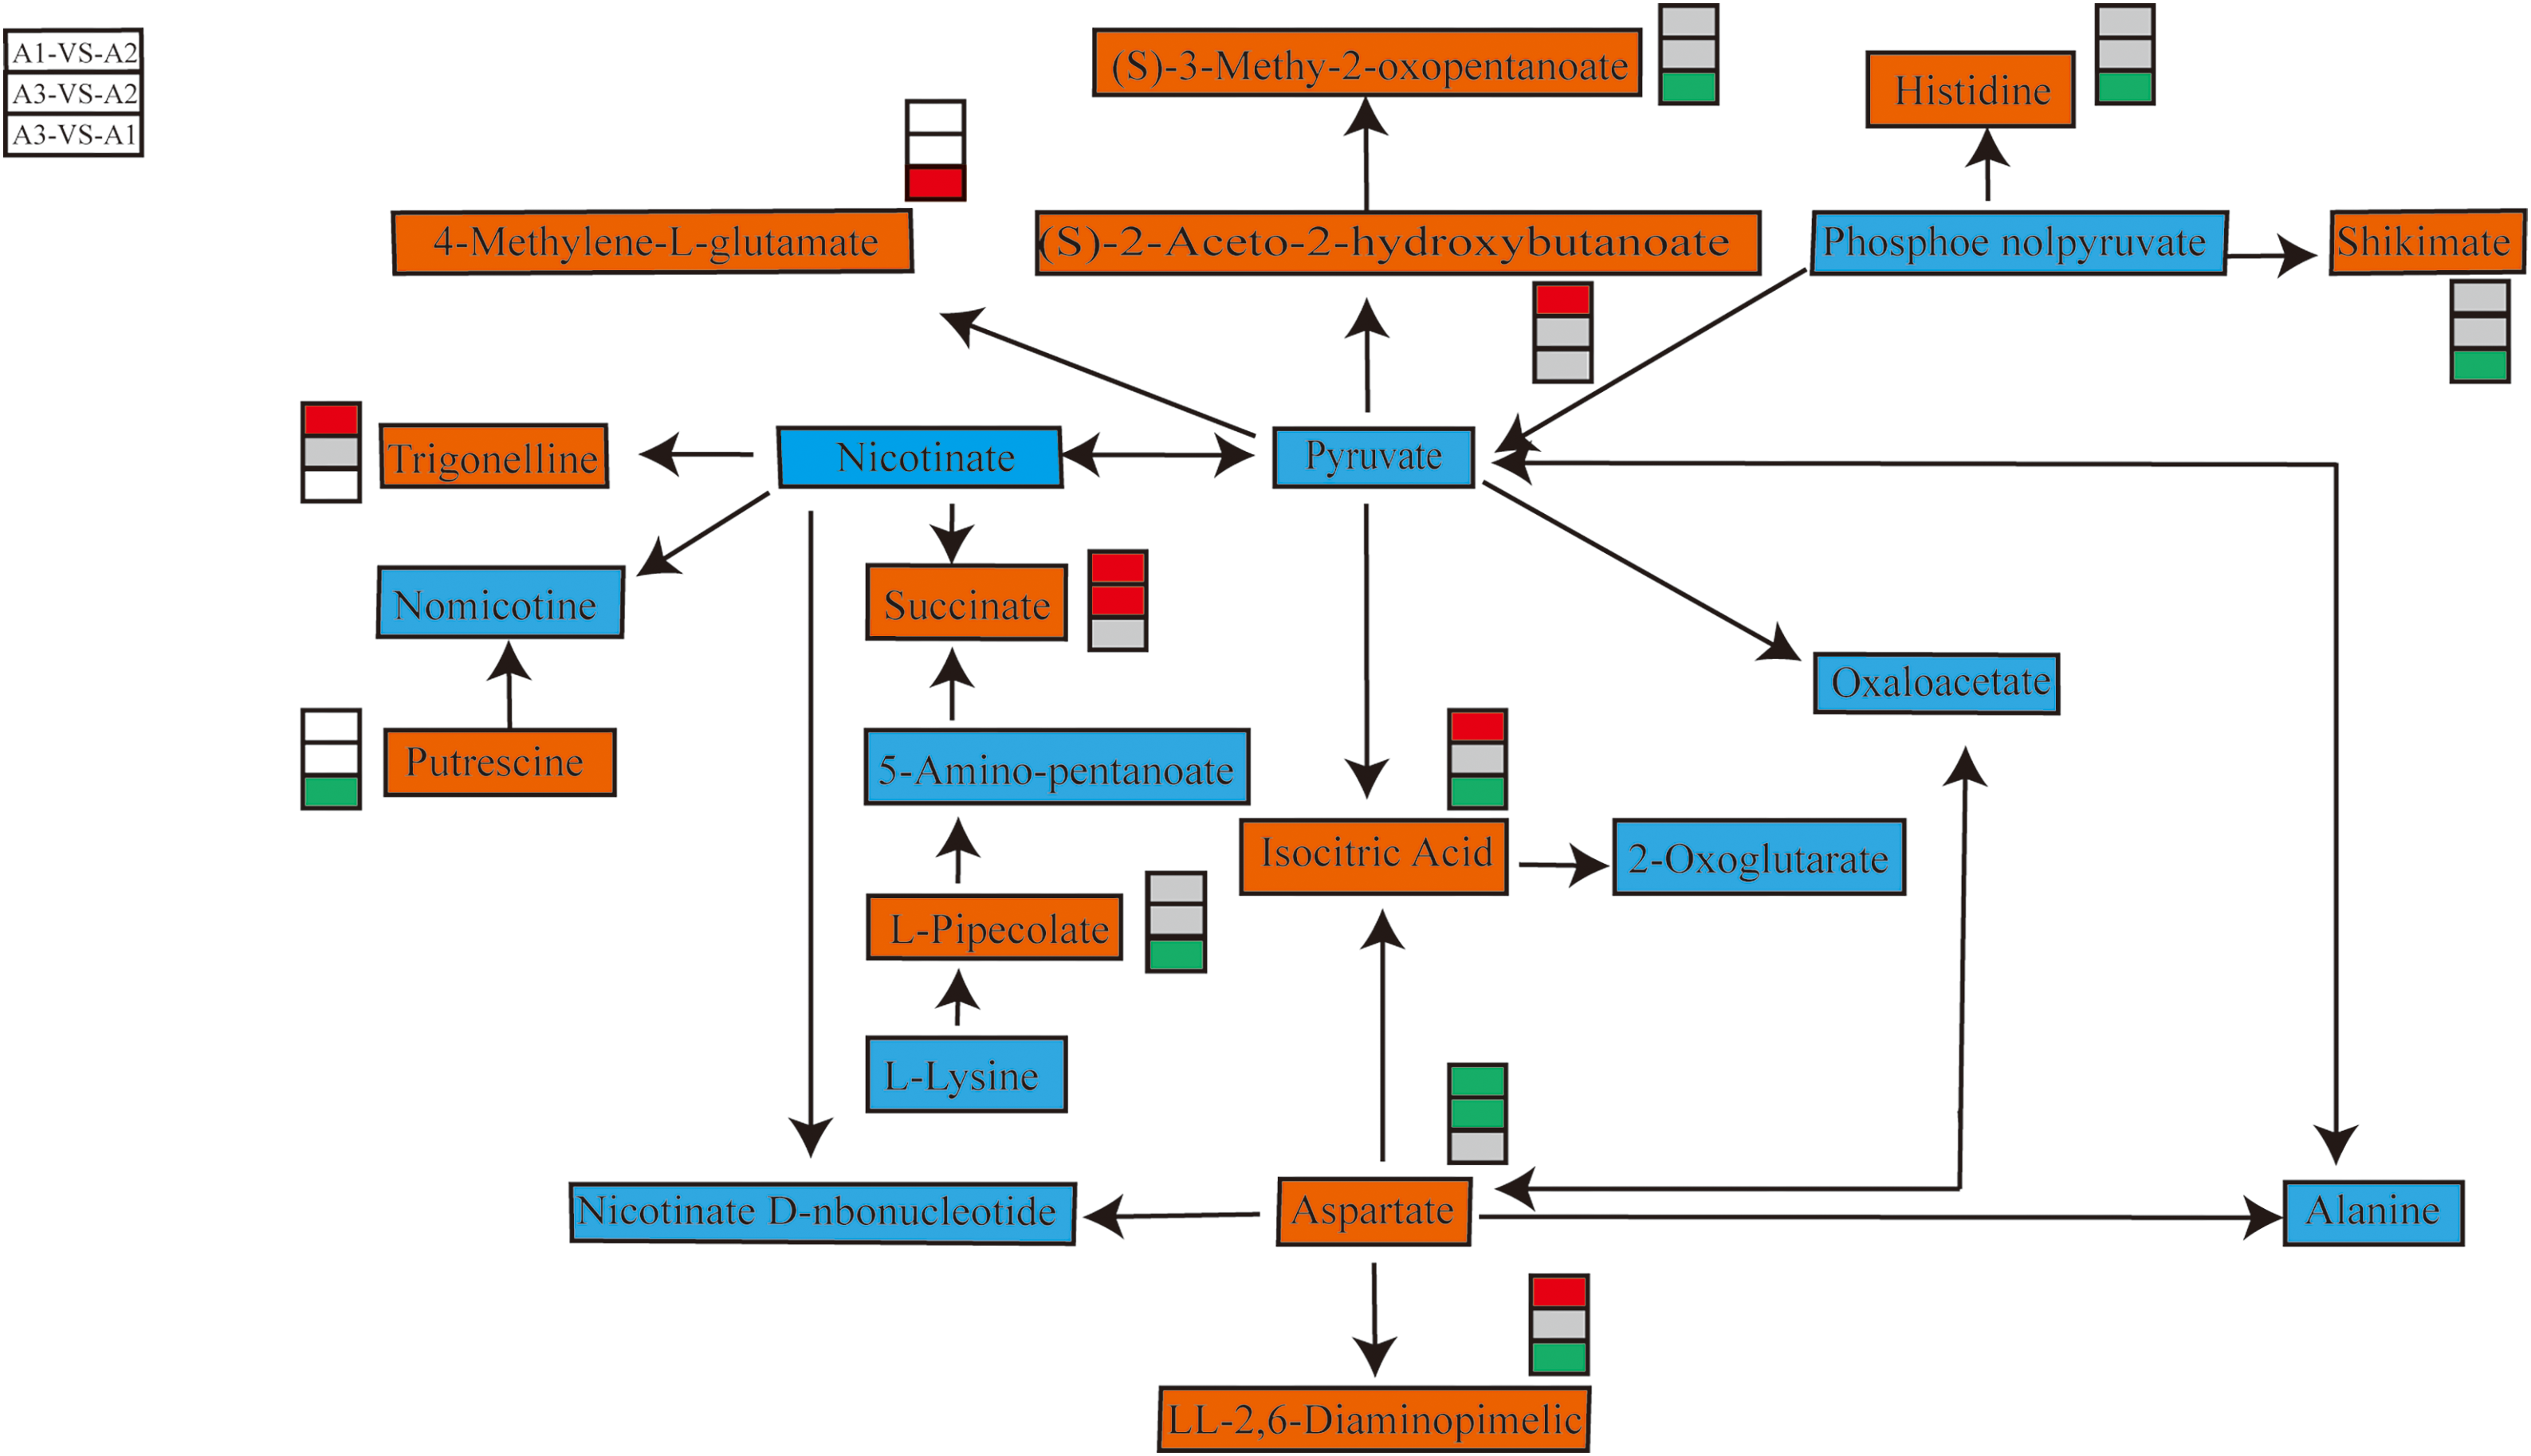
Figure 6: Overview of key metabolites in the metabolic pathways of three nitrogen fertilizer treatments. Note: Key metabolites are displayed in an orange rectangle. The red square indicates a significant increase in metabolite content. The green box indicates a significant decrease in metabolite content. Gray squares indicate no significant difference in metabolite content
Nitrogen serves as a constituent of chlorophyll and numerous enzymes, enabling it to directly regulate crop photosynthesis [27,28] as well as the transformation of various substances within plants [29]. In general, the effective number of panicles in rice exhibits the most pronounced response to nitrogen application, with the number of grains per panicle, seed setting rate [16], and thousand-grain weight following suit. As the rate of nitrogen application increases, the overall grain setting rate and thousand-grain weight of rice display a tendency to initially rise and subsequently decline [30]. Unlike previous observations, in this experiment, the number of spikes in Oryza sativa plants did not undergo notable variations with the elevation of nitrogen fertilizer levels. This outcome may be attributed to the fact that large panicle rice varieties allocate a greater proportion of nutrients towards panicle development during the process of energy distribution [31].
As the nitrogen application rate escalated, the number of grains per spike, seed setting rate, and thousand-grain weight exhibited an upward trend. Notably, the number of grains per spike in plants subjected to the A3 treatment was markedly higher compared to those in the A1 and A2 treatments. Under the experimental conditions, augmenting nitrogen fertilizer enhanced the yield of the variety by optimizing the ear structure. Furthermore, elevating the total nitrogen application rate could potentially exert a significant influence on the reproductive growth stage [32]. Physiologically, before the differentiation of young panicles, reducing nitrogen levels can accelerate the differentiation of bract primordia and promote the transfer of nutrient growth to reproductive growth. In contrast, increasing nitrogen levels have the opposite effect [33]. Therefore, appropriately reducing the application of base fertilizers can enhance the nitrogen utilization efficiency of this variety.
Given the relatively consistent yet excessive differentiation of small flowers per panicle in rice, minimizing the degeneration of these small flowers is also crucial for boosting the grain count per panicle [34]. The correlation analysis revealed a strong positive relationship between yield and both the leaf area index during the jointing stage and the SPAD value recorded on October 14th. This outcome can be attributed to the fact that a more abundant leaf area during the jointing stage provides a robust material foundation for partial panicle initiation, thereby enhancing the number of grains per panicle and augmenting storage capacity. Higher SPAD values in the later growth stages facilitate superior photosynthesis in plants, which in turn promotes grain filling and increases thousand-grain weight.
Due to their inability to move freely, plant tissues accumulate more organic acids compared to other organisms as a mechanism to adapt to complex and constantly changing environments [35]. If the organic acid content within the tissue fluctuates over time, it could be indicative of extensive metabolic activities occurring within the plant body [36]. In this study, we observed distinct metabolites in various control groups, as illustrated in Fig. 3. Furthermore, Fig. 4 delineates the variations in the quantity and proportion of metabolites under differing nitrogen fertilizer treatments, furnishing evidence of the discrepancies in metabolite composition and diversity under these conditions. We have pinpointed several metabolites that exhibit significant differences and are correlated with yield. We have also identified the physiological cycling processes encompassing these distinct metabolites: amino acid biosynthesis, alkaloid biosynthesis (such as trypane, piperidine, and pyridine biosynthesis, as well as the biosynthesis of valine, leucine, and isoleucine), lysine degradation, niacin and niacinamide metabolism, and 2-oxocarbonoic acid and C5-branched dicarboxylic acid metabolism. Notably, the biosynthesis of valine, leucine, and isoleucine yields branched chain amino acids in plants, which are crucial for protein and DNA synthesis, cell division, and growth [37]. A significant correlation was evident between the four metabolites, with a particular emphasis on methylcellulose, and the number of grains per spike. This correlation was mirrored by a substantial increase in grain count per spike when nitrogen was applied in the experiment. Methylcellulose, specifically, is a linear polymer constructed by linking glucose molecules, where methyl and hydrogen atoms substitute the hydroxyl functional groups on glucose, thereby classifying it as an organic oxygen compound [38]. Furthermore, it plays an integral role in the metabolism of C5-branched dicarboxylic acids. Methylcellulose may play a pivotal role in specific chemical reactions within rice, aiding in the delay of senescence, mitigating the degeneration of floral organs, and ultimately enhancing the number of grains per panicle. This process is influenced by gene regulation, where the epigenetic landscape is modulated through the regulation of organic acid content [39]. Hence, chemical regulation techniques can be implemented to adjust the yield components of rice, particularly focusing on increasing the number of grains per panicle, thereby enhancing its storage capacity and maximizing its yield potential.
The application rate of nitrogen fertilizer exerts a considerable influence on the yield of Oryza sativa. With the increase in nitrogen application rate, the number of grains per spike, seed setting rate, and thousand-grain weight of oryza sativa all increased. Maximum yields are attained when high levels of nitrogen fertilizer are applied. Metabolomics research has revealed that specific metabolites present in leaves are correlated with amino acid biosynthesis, alkaloid biosynthesis, lysine degradation, niacin and nicotinamide metabolism, as well as the metabolic pathways of 2-oxocarboxylic acids and C5-branched dicarboxylic acids under varying nitrogen fertilizer conditions. These key metabolites may be regulated by nitrogen fertilizer and play an important role in regulating the yield of oryza sativa.
Acknowledgement: None.
Funding Statement: The Key Research and Development Program of Jiangsu Province (BE2022338), Earmarked Fund for Jiangsu Agricultural Industry Technology System (JATS [2023]485), the Project Funded by the Priority Academic Program Development of Jiangsu Higher Education Institutions.
Author Contributions: The authors confirm contribution to the paper as follows: study conception and design: Yanhong Zhang, Hongcheng Zhang; data collection: Tong Sun, Nianbing Zhou; analysis and interpretation of results: Jinyan Zhu, Jinlong Hu; draft manuscript preparation: Qiangqiang Xiong, Haipeng Zhang. All authors reviewed the results and approved the final version of the manuscript.
Availability of Data and Materials: The raw data supporting the conclusions of this article will be made available by the authors, without undue reservation.
Ethics Approval: Not applicable.
Conflicts of Interest: The authors declare no conflicts of interest to report regarding the present study.
References
1. Hua KJ, Yang P, Zhou JY, Liao W, He J, Zheng JL, et al. Enhancing rice yield, quality, and resource utilization with slow-release fertilizer in alternate wetting and drying irrigation. Plant Soil and Environ. 2024;70(5):253–62. doi: 10.17221/450/2023-PSE. [Google Scholar] [CrossRef]
2. Qi HJ, Wang Z, Jiang YJ. The effect of nitrogen fertilizer application on the yield and composition factors of quanzao excellent silk seedlings. J Anhui Agric Sci. 2021;49:149–50. [Google Scholar]
3. Xiao YH, Zhou QQ, Luo LH. Research progresses on the genetics of the grains number per panicle and its related traits in rice. J Hunan Agri Univ (Nat Sci). 2013;39(3):221–7. doi:10.3724/SP.J.1238.2013.00221. [Google Scholar] [CrossRef]
4. Yuan LP. Hybrid rice breeding for ultra-high yield. Hybrid Rice. 1997;12(6):1–6. [Google Scholar]
5. Cui L, Zheng FY, Wang JF, Zhang CL, Xiao FM, Ye J, et al. miR156a-targeted SBP-Box transcription factor SlSPL13 regulates inflorescence morphogenesis by directly activating SFT in tomato. Plant Biotechnol J. 2020;18(8):1670–82. doi:10.1111/pbi.13331. [Google Scholar] [PubMed] [CrossRef]
6. Chen F. Molecular regulation of lateral meristem differentiation and morphogenesis in rice. In: The 13th National Medical Genetics Academic Conference of the 2014 Global Chinese Genetics Conference, 2014; Changsha, China. [Google Scholar]
7. Komatsu K, Maekawa M, Ujiie S, Satake Y, Furutani I, Okamoto HLAX, et al. Major regulators of shoot branching in rice. Proc Natl Acad Sci U S A. 2003;100(20):11765–70. doi:10.1073/pnas.1932414100. [Google Scholar] [CrossRef]
8. Wu LH, Chen WF. Research progress in regulation mechanism of rice inflorescence structure. Guangdong Agri Sci. 2022;49(9):42–5. [Google Scholar]
9. Li Q, Jiang X. Genetic studies on rice related traits. J Anhui Agri Sci. 2022;50(13):10–13 20. [Google Scholar]
10. He GS. Analysis of important agronomic characters of Japonica rice with different panicle types between China and Japan under high and low nitrogen conditions by using recombinant inbred lines (Ph.D. Thesis). Shenyang Agricultural University: China; 2022. [Google Scholar]
11. Niu XJ. Genetic effect of qG S5.1 and qGS5.2 on grain weight and grain size in rice (Ph.D. Thesis). Huazhong Agricultural University: China; 2022. [Google Scholar]
12. Zhao C, Liu GM, Chen Y, Jiang Y, Shi Y, Zhao LT, et al. Excessive nitrogen application leads to lower rice yield and grain quality by inhibiting the grain filling of inferior grains. Agriculture. 2022;12(7):96. [Google Scholar]
13. Bhargavi G, Sundari A. Effect of nano urea on the growth and yield of rice (Oryza sativa) under SRI in the Cauvery delta zone of Tamil Nadu. Crop Res. 2023;58(1–2):12–7. [Google Scholar]
14. Li YY, Shao XH, Li DX, Xiao MH, Hu XJ, He J. Effects of water and nitrogen coupling on growth, physiology and yield of rice 2019. Int J Agri Bio Eng. 2019;12(3):60–6. doi:10.25165/j.ijabe.20191203.4060. [Google Scholar] [CrossRef]
15. Chen XB, Rao MD. Analysis of yield components of high-yield cultivation of super hybird rice II Youhang No.1. J Sichuan Agr Univ. 2012;30(2):130–133 189. [Google Scholar]
16. Xiao DK, Hu R, Han TF, Zhang WF, Hou J, Ren KY. Effects of nitrogen fertilizer consumption and operation on rice yield and its components in China: a meta-analysis. Chin J Rice Sci. 2023;37(5):529–42. [Google Scholar]
17. Kim DS, Yoon YH, Shin JC, Kim JK, Kim SD. Varietal difference in relationship between SPAD value and chlorophyll and nitrogen concentration in rice leaf. Korean J Crop Sci. 2002;47(2):263–7. [Google Scholar]
18. Zhang QW, Yang ZL, Zhang AP, Wang M. Responses of rice (Oryza sativa L.) nitrogen status indicators to nitrogen rates during the different rice growth stages. Adv Mat Res. 2013:726–31. [Google Scholar]
19. Liu JZ, Yuan JC, Zhou K, Liang Y, Yan XG, Zhang HX, et al. Effect of different nitrogen fertilizer application rates on photosynthetic characteristics and yield of spring maize. J Maize Sci. 2019;27(5):151–7. [Google Scholar]
20. Ye XF, Liu GS, Guo ZW, Li XL, Si H, Wang HF. The effect of different potassium fertilizer application rates on several enzyme activities during the growth process of tobacco. Acta Agr Boreali-Sinica. 2004;19(3):88–91. [Google Scholar]
21. Liu Y, Wang R, Hua LM, Xie ZJ. Effect of N application rates on leaf senescence and protective enzyme system at later stage of maize. J Maize Sci. 2012;20(2):124–7. [Google Scholar]
22. Kang LY, Chang GZ, Ma ZH, Li XH, Gao NN, Liang S. Effects of different nitrogen and potassium application amounts on physiological characteristics of fruiting node leaf of melon. Soil Fertil Sci China. 2019;4:96–104. [Google Scholar]
23. Niu QL, Cao GY, Du J, Su DW, Wan P, Tian XP. Effects of nitrogen fertilizer on yield and enzyme efficiency of leaves in spring maize. Acta Agr Boreali-Sinica. 2017;32(1):187–92. [Google Scholar]
24. Salek RM, Neumann S, Schober D, Hummel J, Billiau K, Kopka J, et al. Coordination of Standards in MetabOlomicS (COSMOSfacilitating integrated metabolomics data access. Metabolomics. 2015;11(6):1598–9. doi:10.1007/s11306-015-0822-7. [Google Scholar] [CrossRef]
25. Yan M, Xu GW. Current and future perspectives of functional metabolomics in disease studies—A review. Anal Chimical Acta. 2018;1037(4):41–54. doi:10.1016/j.aca.2018.04.006. [Google Scholar] [PubMed] [CrossRef]
26. Zhou NB, Zhang YH, Sun T, Zhu JY, Hu JL, Xiong QQ. Unveiling the Impact of different nitrogen fertilizer levels on rice’s eating quality through metabolite evaluation. Agronomy. 2023;13(8):2123. doi:10.3390/agronomy13082123. [Google Scholar] [CrossRef]
27. Shi DD, Li L, Ning W, Ji MN, Ouyang X, Chang SQ. Effects of nitrogen on photosynthetic physiology of canopy leaves and matter production of early super rice. Hybrid Rice. 2023;38(1):28–34. [Google Scholar]
28. Ding XY, Wang H. Effects of nitrogen fertilizer basal-topdressing ratio on photosynthesis characteristics of winter wheat flag leaf under drip irrigation. Chin Agri Sci Bullet. 2019;35(20):1–5. [Google Scholar]
29. Wu LL, Tian C, Zhang L, Huang J, Zhu LF, Zhang JH. Research advance in the roles of water-nitrrogen-oxygen factors in mediating rice growth, photosynthesis and nitrogen utilization in paddy soils. Chin J Appl Ecol. 2021;32(4):1498–508. [Google Scholar]
30. Yang XL, Fang JJ, Wang BF, Wang HB, Cheng JP, Zhou HC. Effects of different nitrogen amounts on yield and agronomic characters of Taoyouxiangzhan. Hubei Agri Sci. 2021;60(15):34–7. [Google Scholar]
31. Zhang Q, Zhang HC, Chang Y, Dai QG, Huo ZY, Xu K. Advantages of yield formation and the characteristics of large panicle type japonica hybrid rice machine-transplanted with young seedling. China Rice. 2014;20(2):11–5. [Google Scholar]
32. Jia Y, Wang J, Qu Z, Zou D, Sha H, Liu H, et al. Effects of low water temperature during reproductive growth on photosynthetic production and nitrogen accumulation in rice. Field Crops Res. 2019;242:107587. doi:10.1016/j.fcr.2019.107587. [Google Scholar] [CrossRef]
33. Zhao CH, Ding YF. Progress in physiological and biochemical research on the formation of rice panicle number. Tillage and Cultiv. 2001;1:5–9. [Google Scholar]
34. Wen TG, Wang WZ, Yang WF, Gu DL, Qian XM, Shi HQ. Effects of exogenous plant growth regulator treatment on rice spikelet differentiation and degeneration during panicle initiation stage. Jiangsu J Agri Sci. 2019;35(3):514–52. [Google Scholar]
35. Wang LL, Song XH, Yang D, Li Q, Li M, Wang JY. Progress of the effects of environmental conditions on organic acide in plants. J Shenyang Norm Univ (Nat Sci Ed). 2019;37(3):236–23. [Google Scholar]
36. Wang N. Study on metabolites mediated plant resistance against diseases and drought during interaction between bacillus cereus AR156 and tomato (Ph.D. Thesis). Nanjing Agricultural University: China; 2019. [Google Scholar]
37. Liu CY. Transgenic rice for nicosulfuron tolerance (Ph.D. Thesis). Zhejiang University: China; 2011. [Google Scholar]
38. Zhou JP, Deng QH, Wu XJ, Zhang LN. Synthesis, structure and performance characterization of methylcellulose. In: Proceedings of the 4th National Symposium on Polymer Molecular Characterization, 2004; Wuhan, China; p. 2004–10. [Google Scholar]
39. Schaefke, Bernhard, Sun W, Li YS, Fang L, Chen W. The evolution of posttranscriptional regulation. Wires RNA. 2018;9(5):e1485. doi: 10.1002/wrna.1485. [Google Scholar] [PubMed] [CrossRef]
Cite This Article
 Copyright © 2024 The Author(s). Published by Tech Science Press.
This work is licensed under a Creative Commons Attribution 4.0 International License , which permits unrestricted use, distribution, and reproduction in any medium, provided the original work is properly cited.


 Submit a Paper
 Propose a Special lssue
 View Full Text
 Download PDF
 Downloads
 Citation Tools