 Open Access
ARTICLE
Assessment of Tolerance of Different Varieties of Hulless Barley Seedlings to Low-Temperature Stress
1 Academy of Agricultural and Forestry Sciences, Qinghai University, Xining, 810016, China
2 State Key Laboratory of Plateau Ecology and Agriculture, Qinghai University, Xining, 810016, China
3 Qinghai Key Laboratory of Hulless Barley Genetics and Breeding, Xining, 810016, China
4 Qinghai Subcenter of National Hulless Barley Improvement, Xining, 810016, China
* Corresponding Author: Kunlun Wu. Email:
# These authors have contributed equally to this study
Phyton-International Journal of Experimental Botany 2024, 93(11), 2755-2766. https://doi.org/10.32604/phyton.2024.055852
Received 08 July 2024; Accepted 09 October 2024; Issue published 30 November 2024
Abstract
In this study, we analyzed the agronomic and physiological indicators of the leaves and roots of 60 hulless barley varieties under low-temperature treatment, identified the crucial indicators that can reflect the ability of hulless barley to tolerate low-temperature, and evaluated the ability of different hulless barley varieties to tolerate low-temperature. The results indicated significant differences in the agronomic and physiological indicators of 60 hulless barley varieties subjected to low-temperature treatment. Most of the agronomic indicators significantly decreased, whereas most of the physiological indicators significantly increased. However, the magnitude of changes in each agronomic and physiological indicator differed among the varieties. A comprehensive analysis of the agronomic and physiological indicators revealed that the antioxidant enzyme activity, soluble sugar (SSC) and free proline (FPRO) could be used as a crucial indicator to evaluate the low-temperature tolerance of hulless barley. Compared with those of agronomic indicators, the physiological indicators of the hulless variety barley better reflected its resistance to low-temperature stress. The final comprehensive evaluation showed that Himalaya 22 was the most tolerant to low-temperature, whereas Changmanglan qingke was the most sensitive to low-temperature. In this study, we assessed various agronomic and physiological indicators of hulless barley plants under low-temperature stress. We also identified essential agronomic and physiological indicators for screening low-temperature-tolerant varieties. The research results thus provide a reference for screening low-temperature-tolerant hulless barley resources.Keywords
Supplementary Material
Supplementary Material FileGlossary/Nomenclature/Abbreviations
| PH | Plant height |
| RL | Root length |
| PFW | Plant fresh weight |
| RFW | Root fresh weight |
| PDW | Plant dry weight |
| RDW | Root dry weight |
| RCR | Root-crown ratio |
| RAD | Root average diameter |
| SPAD | Soil and plant analyzer development |
| LSS | Leaf soluble sugar |
| RSS | Root soluble sugar |
| LFP | Leaf proline |
| RFP | Root proline |
| LMDA | Leaf malondialdehyde |
| RMDA | Root malondialdehyde |
| LSOD | Leaf superoxide dismutase |
| RSOD | Root superoxide dismutase |
| LPOD | Leaf peroxidase |
| RPOD | Root peroxidase |
| LCAT | Leaf catalase |
| RCAT | Root catalase |
| RF | Random forest |
| LASSO | Least absolute shrinkage and selection operator |
| ROC | Receiver operating characteristic |
| AUC | Area under the curve |
| PLS-DA | Partial least-squares discrimination analysis |
| PCA | Principal component analysis |
Hulless barley is a crop unique to the Qinghai–Xizang Plateau and other high-altitude regions. Hulless barley is an ancient crop that originated from cultivated barley and entered the Qinghai–Xizang Plateau from western Asia [1,2]. Through long-term evolution, hulless plants have gradually adapted to the high-altitude climate and have now become staple crops that are widely cultivated in the area [3]. Long-term artificial cultivation has helped hulless barley plants adapt to extreme climatic conditions such as low-temperature, drought, barrenness, and strong ultraviolet rays [4,5]. Hulless barley is the only crop on the Qinghai–Xizang Plateau, and it can also be used for fodder, brewing, and food processing [6]. Hulless barley is the staple food and main source of economic income for the Tibetan people, and its production directly affects local food security and agricultural economic development [7]. Low-temperature is the main factor affecting hulless barley production, and the frequent occurrence of extremely low-temperature climates seriously affects the survival of hulless barley plants. Low-temperature inhibits hulless barley photosynthesis, destroys cell structure and membrane system, inhibits enzyme activity, thus inhibiting hulless barley growth, and also inhibits bud and root development, inducing physiological disorders. These effects together inhibit the growth and development of hulless barley and resilience [8,9].
Although hulless barley has adapted to extreme stress on the Qinghai–Xizang Plateau, different hulless barley varieties exhibit variations in low-temperature stress adaptability at relatively high altitudes and low-temperature in the region, seriously affecting the production of some of the best hulless barley varieties [10,11]. As global temperature change intensifies, the climate of the Qinghai–Xizang Plateau region becomes more unstable, and extremely low-temperature are frequently encountered in the region; as a result, hulless barley production is more susceptible to freezing, frost, snow, hail, and other adverse factors [12,13]. At present, the screening and evaluation of low-temperature-resistant resources for hulless barley seedlings to establish relevant research are limited. Seedlings are most affected by low-temperature stress. Therefore, it is highly important to establish an evaluation system to screen and select hulless barley varieties that are tolerant to low-temperature.
In this study, the following agronomic and physiological indicators of hulless barley plants under low-temperature stress were measured (Table S1) in 60 varieties of hulless barley. Comprehensive evaluation of the agronomic and physiological indicators of different hulless barley varieties under low-temperature stress and their ability to tolerate stress was carried out using multiple statistical methods.
The results for the 60 hulless barley varieties are shown in Table S1; these hulless barley resources are preserved in the laboratory for research and utilization of Qinghai–Xizang Plateau germplasm resources, Xining, China. This experiment was carried out at Qinghai University from April to August 2023. Hulless barley seeds were placed onto Petri dishes for germination. After germination, seedlings of similar growth were selected and fixed on floating plates. For each type of hullless barely, six plants were placed in black plastic boxes (600 mm × 500 mm × 160 mm) in duplicate. The culture was carried out in modified Hoagland’s solution (20 L in each box), which was changed every 3 days. The light intensity was 20000 lx for 16 h of light and 8 h of darkness per day, and the average relative humidity was 50%. Air was introduced into the solution for 24 h, and the pH was stabilized at 7.0 with 1 mol/L KOH every day. The temperatures during the light and dark periods were 28°C and 22°C for normal-temperature culture. Two groups were set up, one for low-temperature treatment and the other for normal-temperature culture as a control. When the plants reached the 3-leaf stage, the low-temperature treatment group were subjected to low-temperature treatment for 7 days, and the temperatures during the light and dark periods were 8°C and 2°C, respectively.
2.2 Determination and Measurement
The following agronomic traits and physiological indicators of qingke were measured: PH, RL, PFW, RFW, PDW, RDW, RCR, RAD, SPAD, LMDA, RMDA, LSS, RSS, LFP, RFP, and the activities of LSOD, RSOD, LCAT, RCAT, LPOD and RPOD [12]. Hulless barley leaves and roots were collected and processed according to the instructions of the Nanjing Jiancheng Institute of Biological Engineering Co., Ltd., Nanjing, China. All the indicators were determined by using the US Thermo Scientific MultiskanFC, Waltham, MA, USA and all the indicators were determined in three replicates. SPAD values were measured using KONICA MINOLTA’s SPAD-502Plus, Tokyo Metropolis, Japan.
The indicators of qingke were detected under the different temperature treatments, and a t-test was used to obtain statistically significant signals by comparing different temperature conditions (p < 0.05). Statistical indices, including the coefficient of variation and correlation coefficient, were applied to better understand the data distribution. SPSS 22.0 (Umetrics, Umea, Sweden) was used for these analyses. For the low-temperature tolerance index, coefficient of variation, Pearson correlation coefficient and membership function analysis, refer to Wang et al. [14].
Principal component analysis (PCA) was used to analyze agronomic and physiological indicators (R package, “factoextra”). Subsequently, various supervised methods were utilized to identify the crucial indicators associated with low-temperature tolerance. Partial least squares discrimination analysis (PLS-DA) analysis was used to select crucial indicators after calculating the VIP (VIP > 1). Then, a random forest (RF) was used to assess the contributions of the indicators to the low-temperature treatment (importance > 1). The least absolute shrinkage and selection operator (LASSO) was used to confirm indicators associated with low-temperature tolerance (coefficient! = 0). These analyses were conducted using RStudio (Boston, MA, USA, v4.0). Finally, Boruta analysis, a specific feature selection technique, was used to identify the most relevant variables. This analysis was conducted to determine which features were essential for distinguishing between the low-temperature treatment groups. The final panel was constructed with crucial indicators by combining the above metrics. Then, receiver operating characteristic (ROC) analysis was employed to evaluate the performance of the panel, and the area under the curve (AUC) was calculated to quantify the power of growth indicators linked to low temperature. By default, the visualizations were drawn by the “ggplot2” package.
3.1 Coefficient of Variation Analysis
We detected a series of agronomic and physiological indicators to represent the growth situation of different hulless barley varieties; compared with those under normal temperature, several indicators, including PH, RL, RFW, PFW, PDW, RDW, RCR, RAD, and SPAD, significantly decreased under low-temperature stress. The other indicators significantly increased, including LMDA, RMDA, LSS, RSS, LFP, RFP, LSOD, RSOD, LPOD, RPOD, LCAT and RCAT, under low-temperature stress (Table S2). After computing the coefficient of variation, the fluctuations in the indicators under distinct treatments were compared. The analysis revealed a significant disparity in the variation in all the indicators between the normal and low-temperature stress conditions. This outcome strongly suggests that low-temperature stress profoundly influences both agronomic and physiological indicators. Notably, the variation coefficient of the RCR low-temperature tolerance index was the highest, underscoring its potential as a pivotal indicator for assessing the sensitivity of hulless barley varieties to low-temperature stress (Table S3). This observation emphasized the robust impact of low-temperature stress on the various parameters measured in this study.
3.2 Correlation and PCA Analysis of the Indicators of Hulless Barley under Low-Temperature Stress
The Pearson correlation results showed that a majority of the indicators exhibited robust associations, with the exception of RAD, which exhibited weak correlations with the other indicators. This correlation analysis revealed a synergistic relationship among these indicators in response to low-temperature stress in qingke seedlings (Fig. 1). PCA revealed three principal components, the first of which was Factor 1, which collectively explained 75.40% of the variance (Table S4). Factor 1 predominantly included PH, PFW, RDW, PDW, RDW, SPAD, LMDA, RMDA, LSS, RSS, LFP, RFP, LSOD, RSOD, LPOD, LCAT, RPOD, and RCAT. Factor 2 was mainly characterized by RL, RFW, and RDW. Moreover, Factor 3 was primarily represented by RAD (Table S5, Fig. 2A,B). This comprehensive analysis sheds light on the interplay and importance of specific indicators within each principal component, providing a nuanced understanding of the complex relationships among various agronomic and physiological traits under low-temperature stress conditions in hulless barley seedlings.
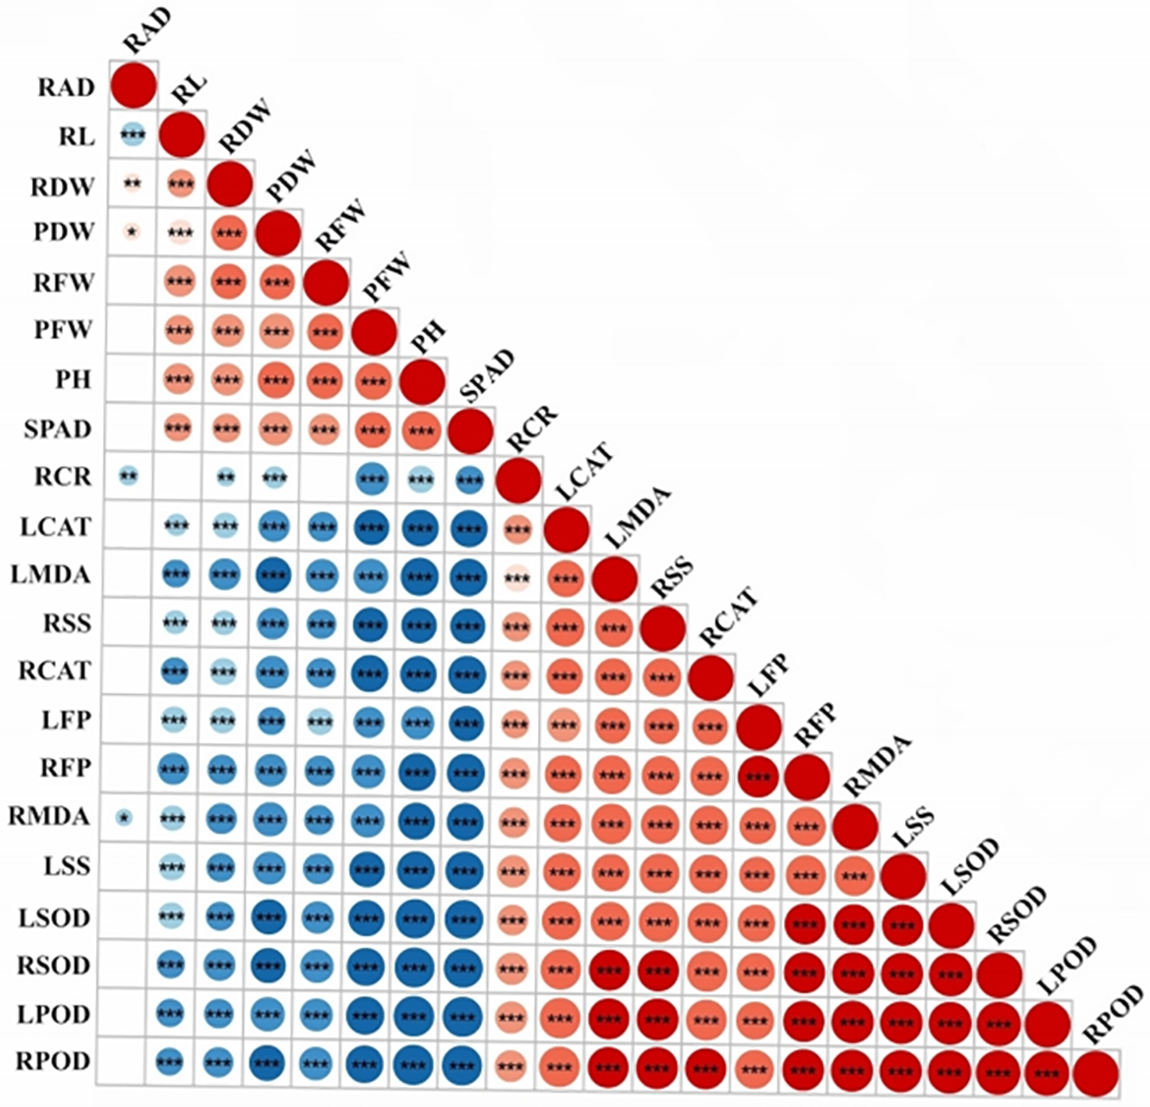
Figure 1: Pearson correlation coefficient analysis between agronomic and physiological indicators.
Note: *p < 0.05, **p < 0.01, ***p < 0.001.
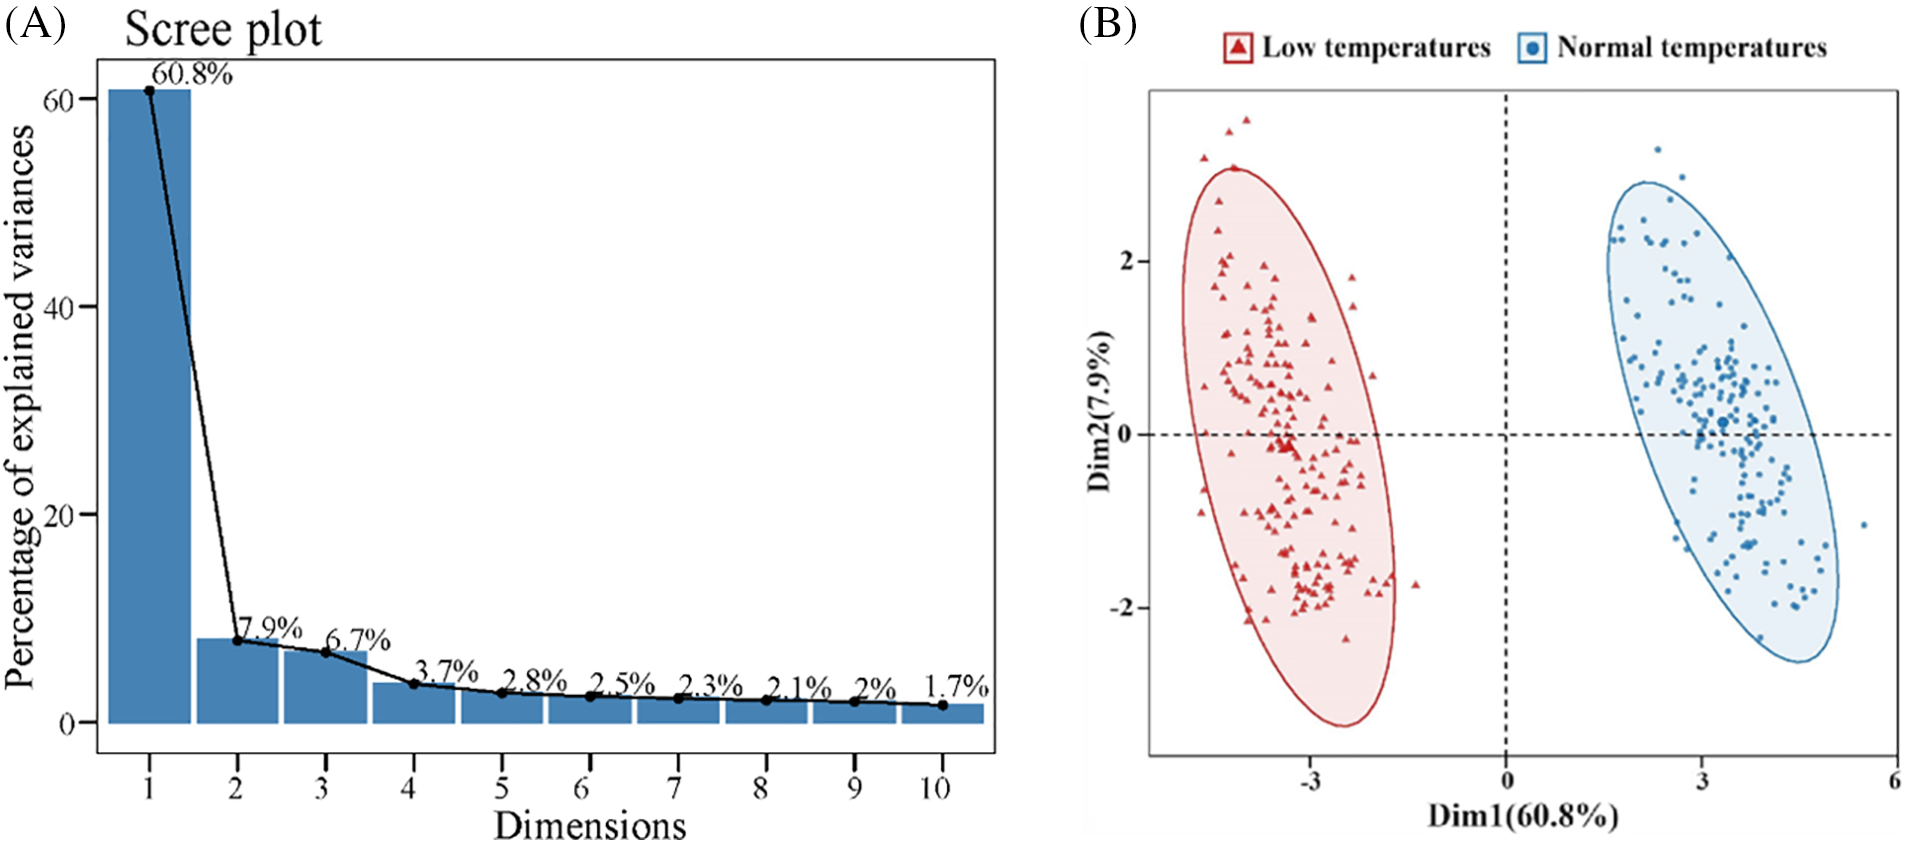
Figure 2: Principal component analysis (PCA) gravel plots and scatter plots of agronomic and physiological indicators. (A) Scree test; (B) Scatter plot
3.3 Multiple Machine Learning Algorithms for Identifying Key Indicators Related to Low-Temperature Stress
The PLS-DA analysis showed that RPOD, LPOD, RSOD, LSOD, LSS, RMDA, RSS, RFP, RCAT, LMDA and LCAT significantly contributed to distinguishing hulless barley seedlings under normal and low-temperature conditions (VIP > 1) (Fig. 3A). Subsequently, these crucial indicators were further confirmed through random forest analysis, which reinforced the significance of RPOD, LPOD, RSOD, LSOD, LSS, RMDA, RSS, RFP, RCAT, LMDA, and LCAT as the top-ranked agronomic traits and physiological indicators (importance > 1) (Fig. 3B). Furthermore, a comprehensive analysis using Boruta to assess the importance of these indicators under low-temperature treatment reaffirmed the prominence of LPOD, RSOD, RPOD, LSOD, LSS, RSS, LMDA, and RMDA as crucial indicators of low-temperature tolerance in hulless barley (Fig. 3C). This integrated approach ensures the robustness and reliability of the identified indicators, laying the foundation for their application in evaluating low-temperature tolerance in qingke seedlings.
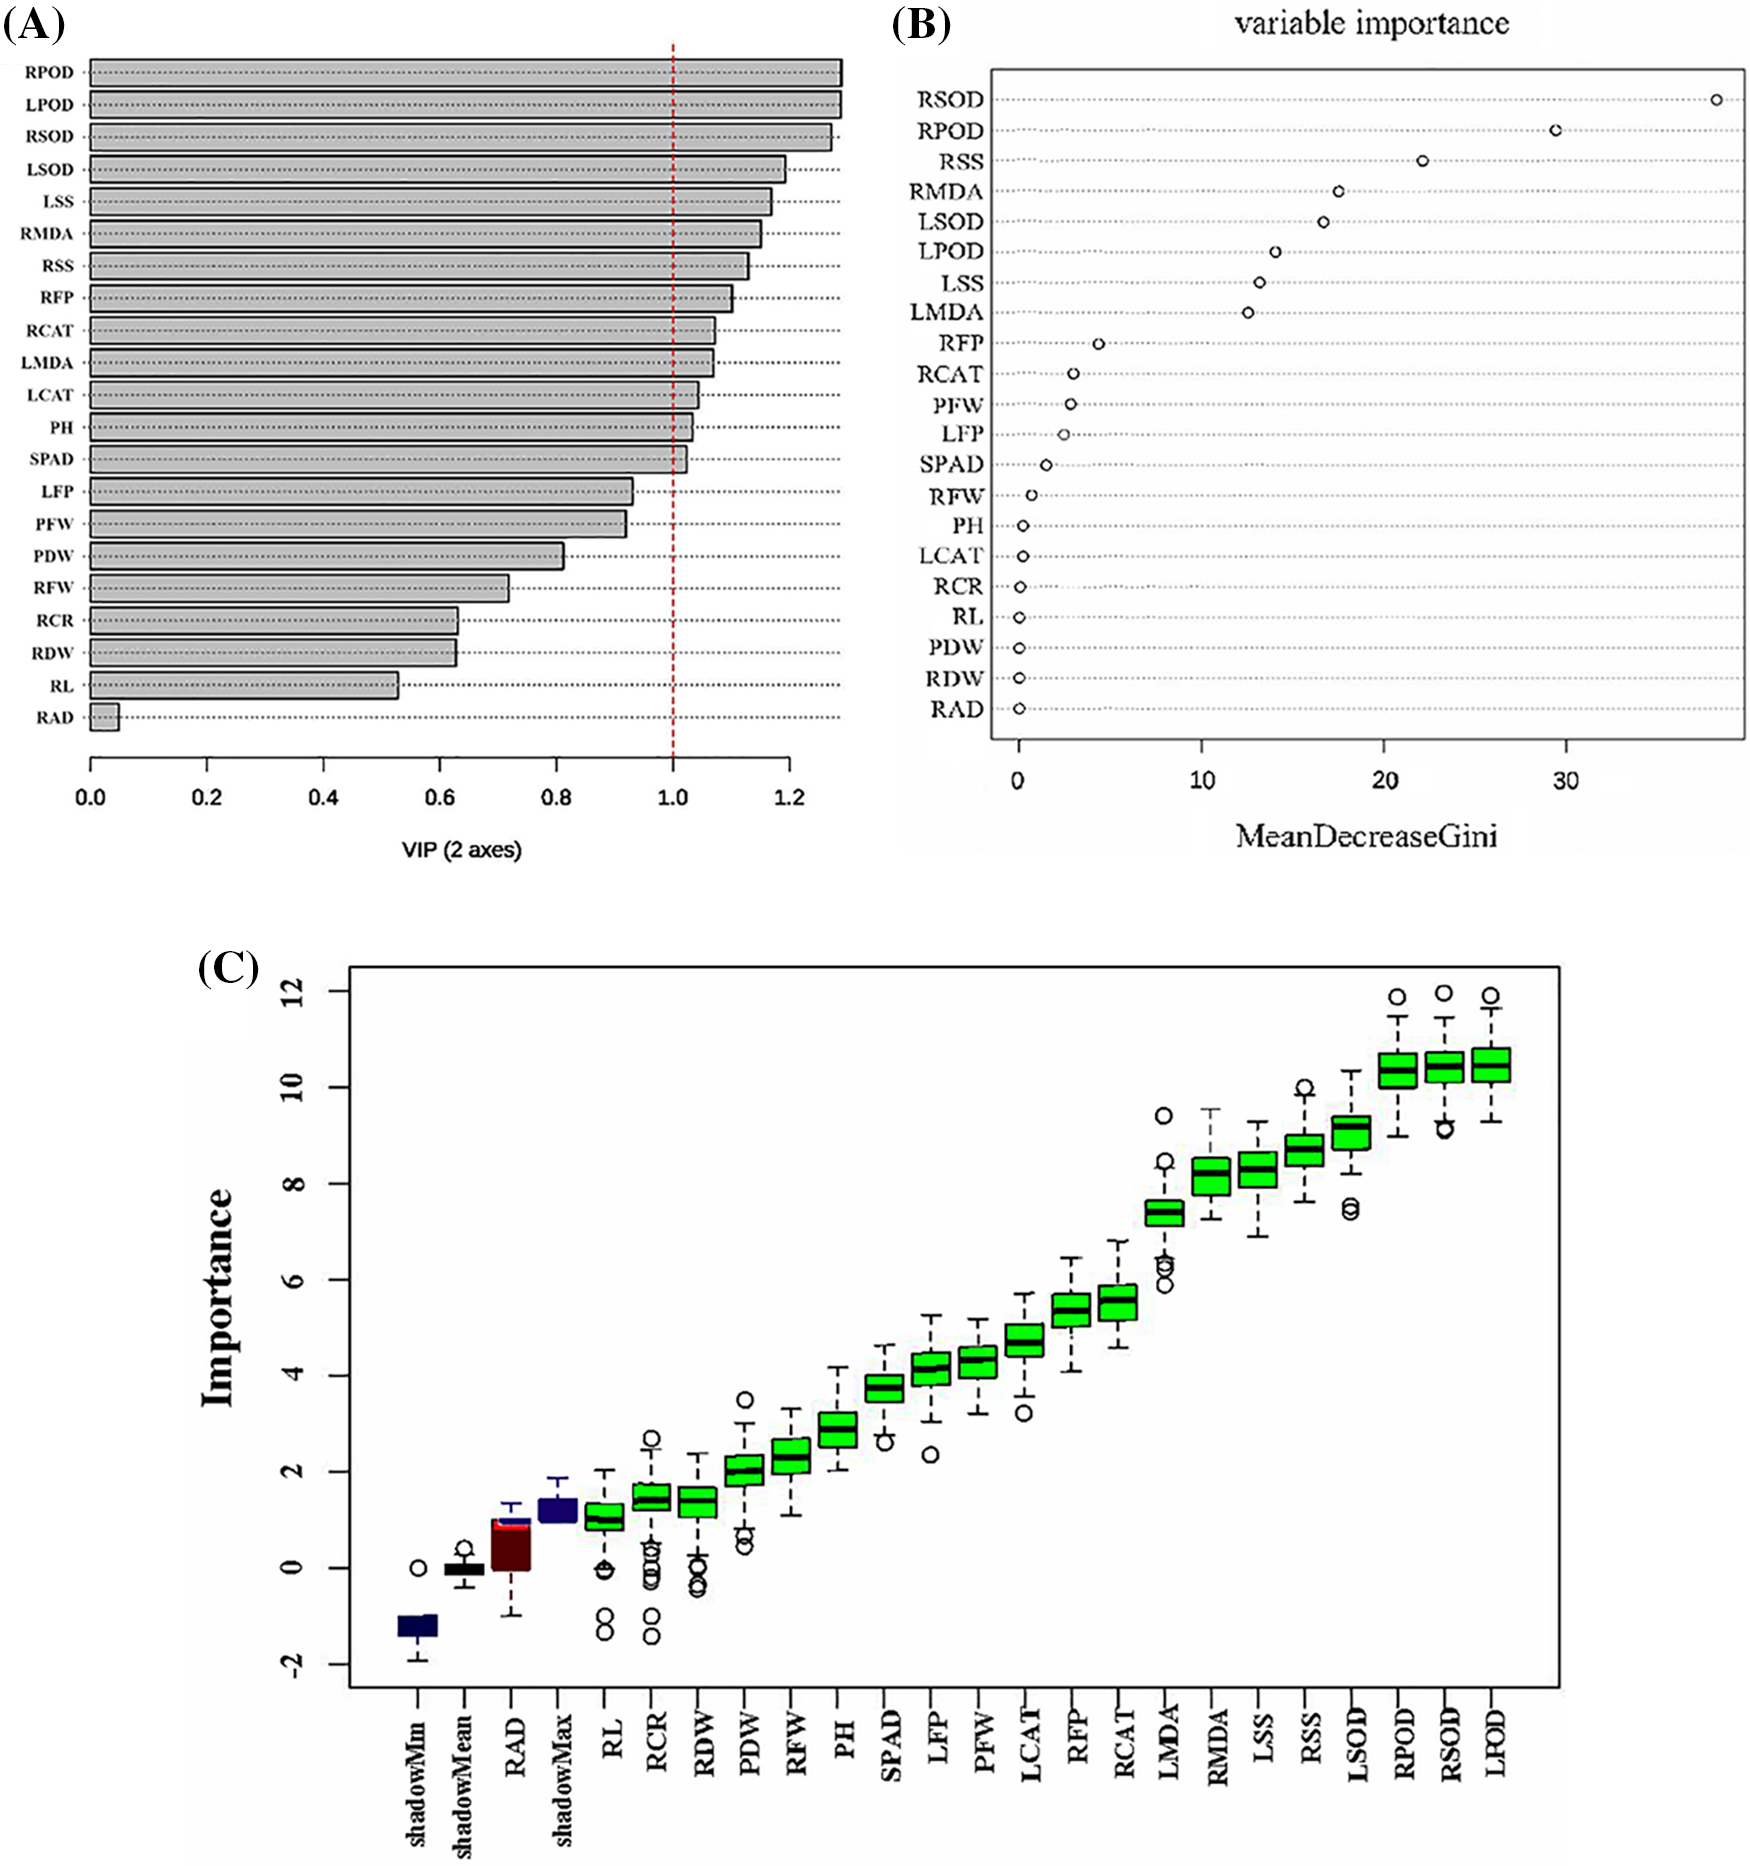
Figure 3: Ranking the importance indicators of low-temperature tolerance in hulless barley based on multiple machine learning algorithms: (A) Bar plot of VIP values in PLS-DA; (B) Importance scores of random forest; (C) Box plot of importance in Boruta analysis
3.4 LASSO Analysis and Model Evaluation
Considering the sample quantity and specific goals, LASSO analysis was used to evaluate the crucial indicators of hulless barley under low-temperature coercion (Fig. 4, Table S6). The LASSO program, which minimizes values in the range of 0 to 0.2, is the key to identifying the most influential indicators (Fig. 4A). After completing the cross-verification, β = 18, and the coefficient of the indicators is calculated. The greater the absolute values of these coefficients are, the stronger the correlation with low-temperature stress (Table S6 and Fig. 4B). Based on these indicators, a growth temperature prediction model was built based on the original data, and ROC analysis was used to evaluate the diagnostic performance of the model (Fig. 4C). This model had good predictive ability for 60 hulless barley varieties in the normal treatment group and low-temperature treatment group (AUC = 0.901, sensitivity = 1.000, and specificity = 0.944). The bee chart intuitively shows that the model built using these indicators has the ability to effectively distinguish between different treatment groups (Fig. 4D). This comprehensive method consolidates the practicality of the model on the low-temperature stress of qingke.
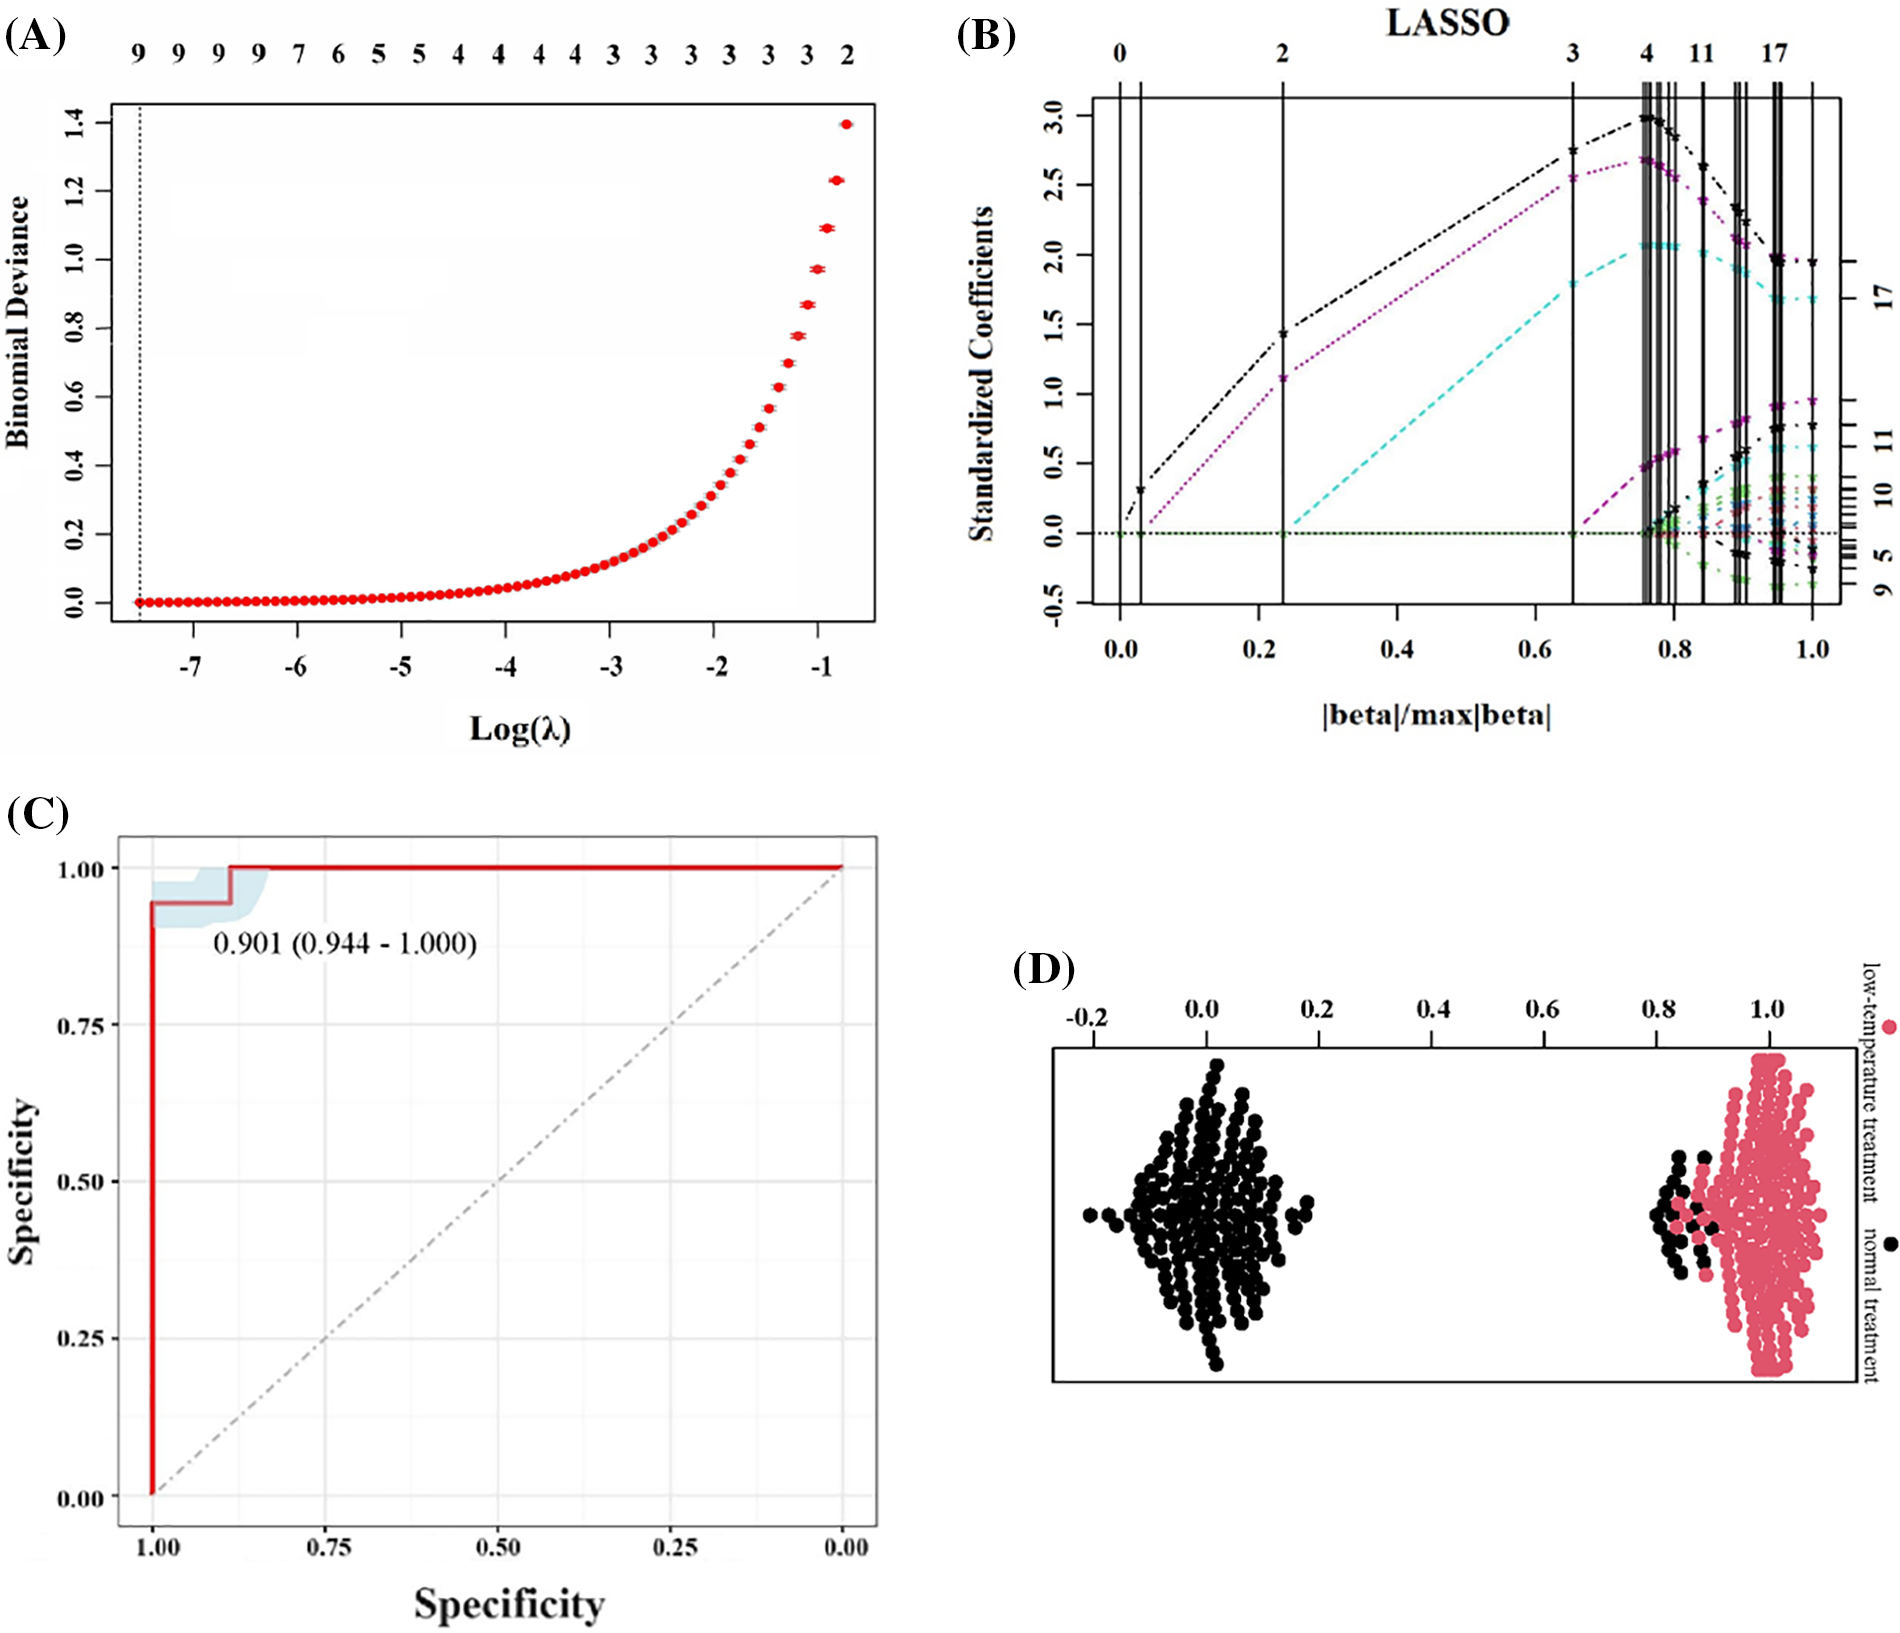
Figure 4: LASSO regression analysis and model evaluation of different agronomic and physiological indicators of hulless barley seedlings under low-temperature stress: (A) LASSO regression model convergence results; (B) LASSO regression distribution results; (C) Model-predicted ROC; (D) Beeswarm plot, black dots: normal temperature treatment groups, red dots: low-temperature treatment groups
3.5 Ranking of Low-Temperature Tolerances of Different Hulless Barley Varieties
After comprehensively considering the above agronomic and physiological indicators, the affiliation values were calculated to carry out fuzzy affiliation function analysis for the 60 varieties. A higher value indicated that the qingke had the capacity to withstand low-temperature conditions (Fig. 5). Finally, the ranking of all hulless barley varieties for low-temperature tolerance was determined through membership function analysis. Himalayan 22 was the most low-temperature-tolerant hulless variety (Fig. 6). This comprehensive analysis provided valuable insights into the relative resilience of different hulless barley varieties to low-temperature stress, with Himalayan 22 emerging as a robust contender in terms of tolerance.
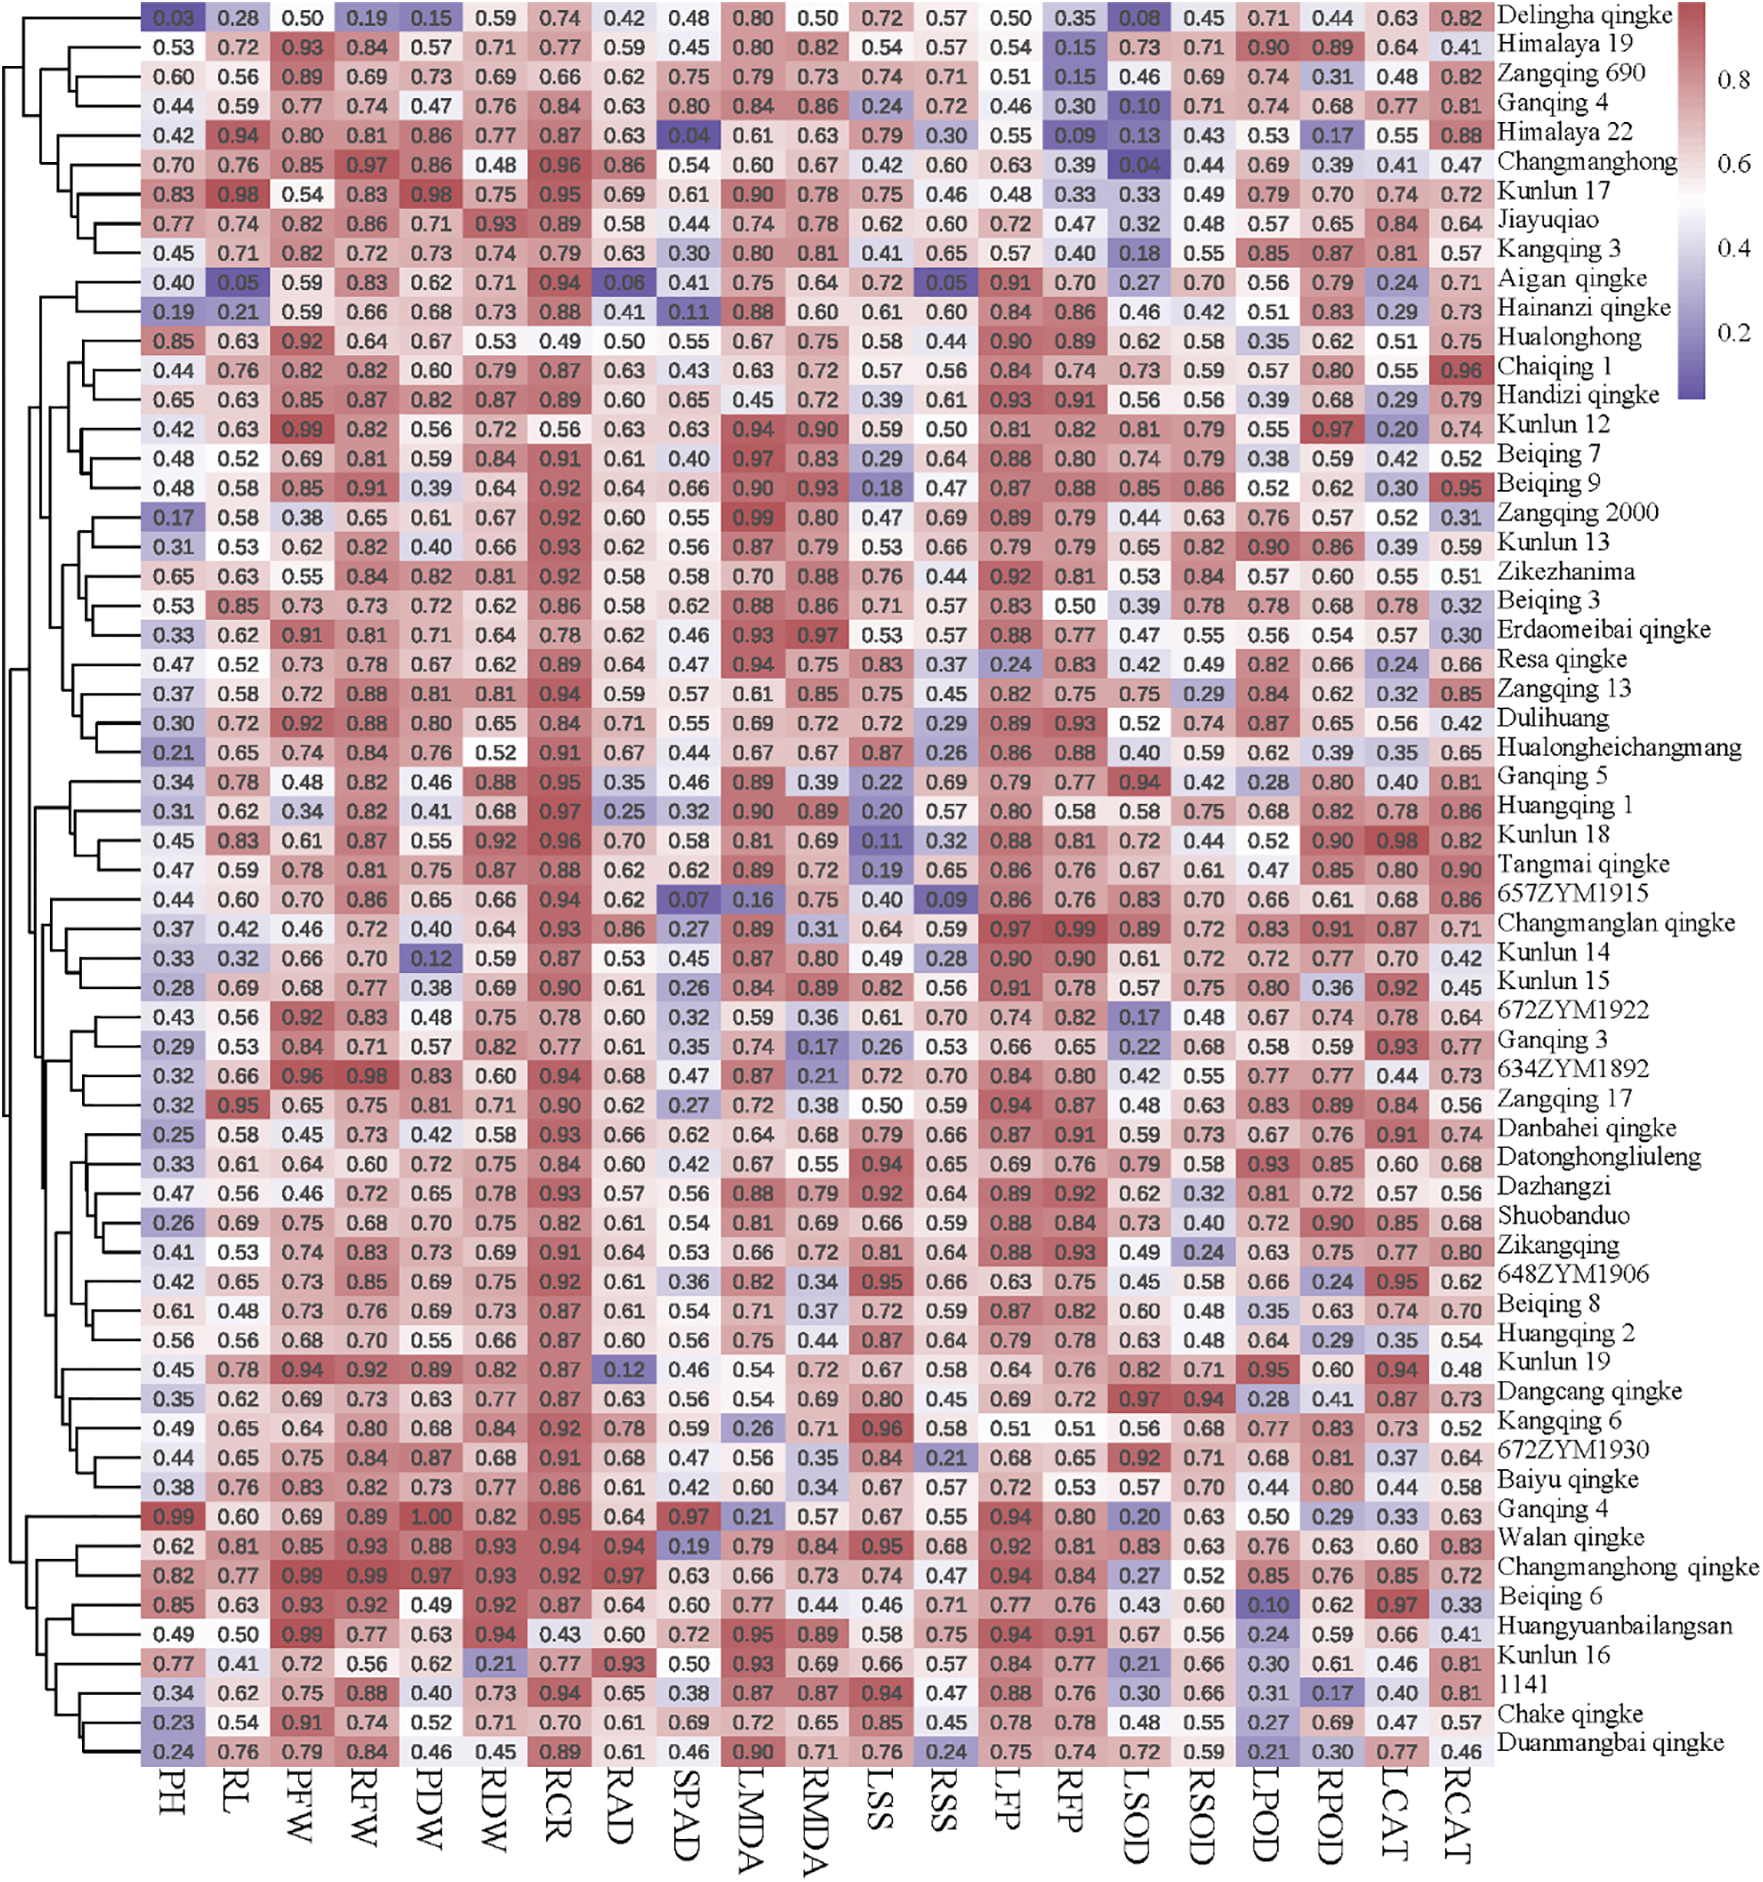
Figure 5: Heatmap depicting the membership values and clustering of different hulless barley seedlings
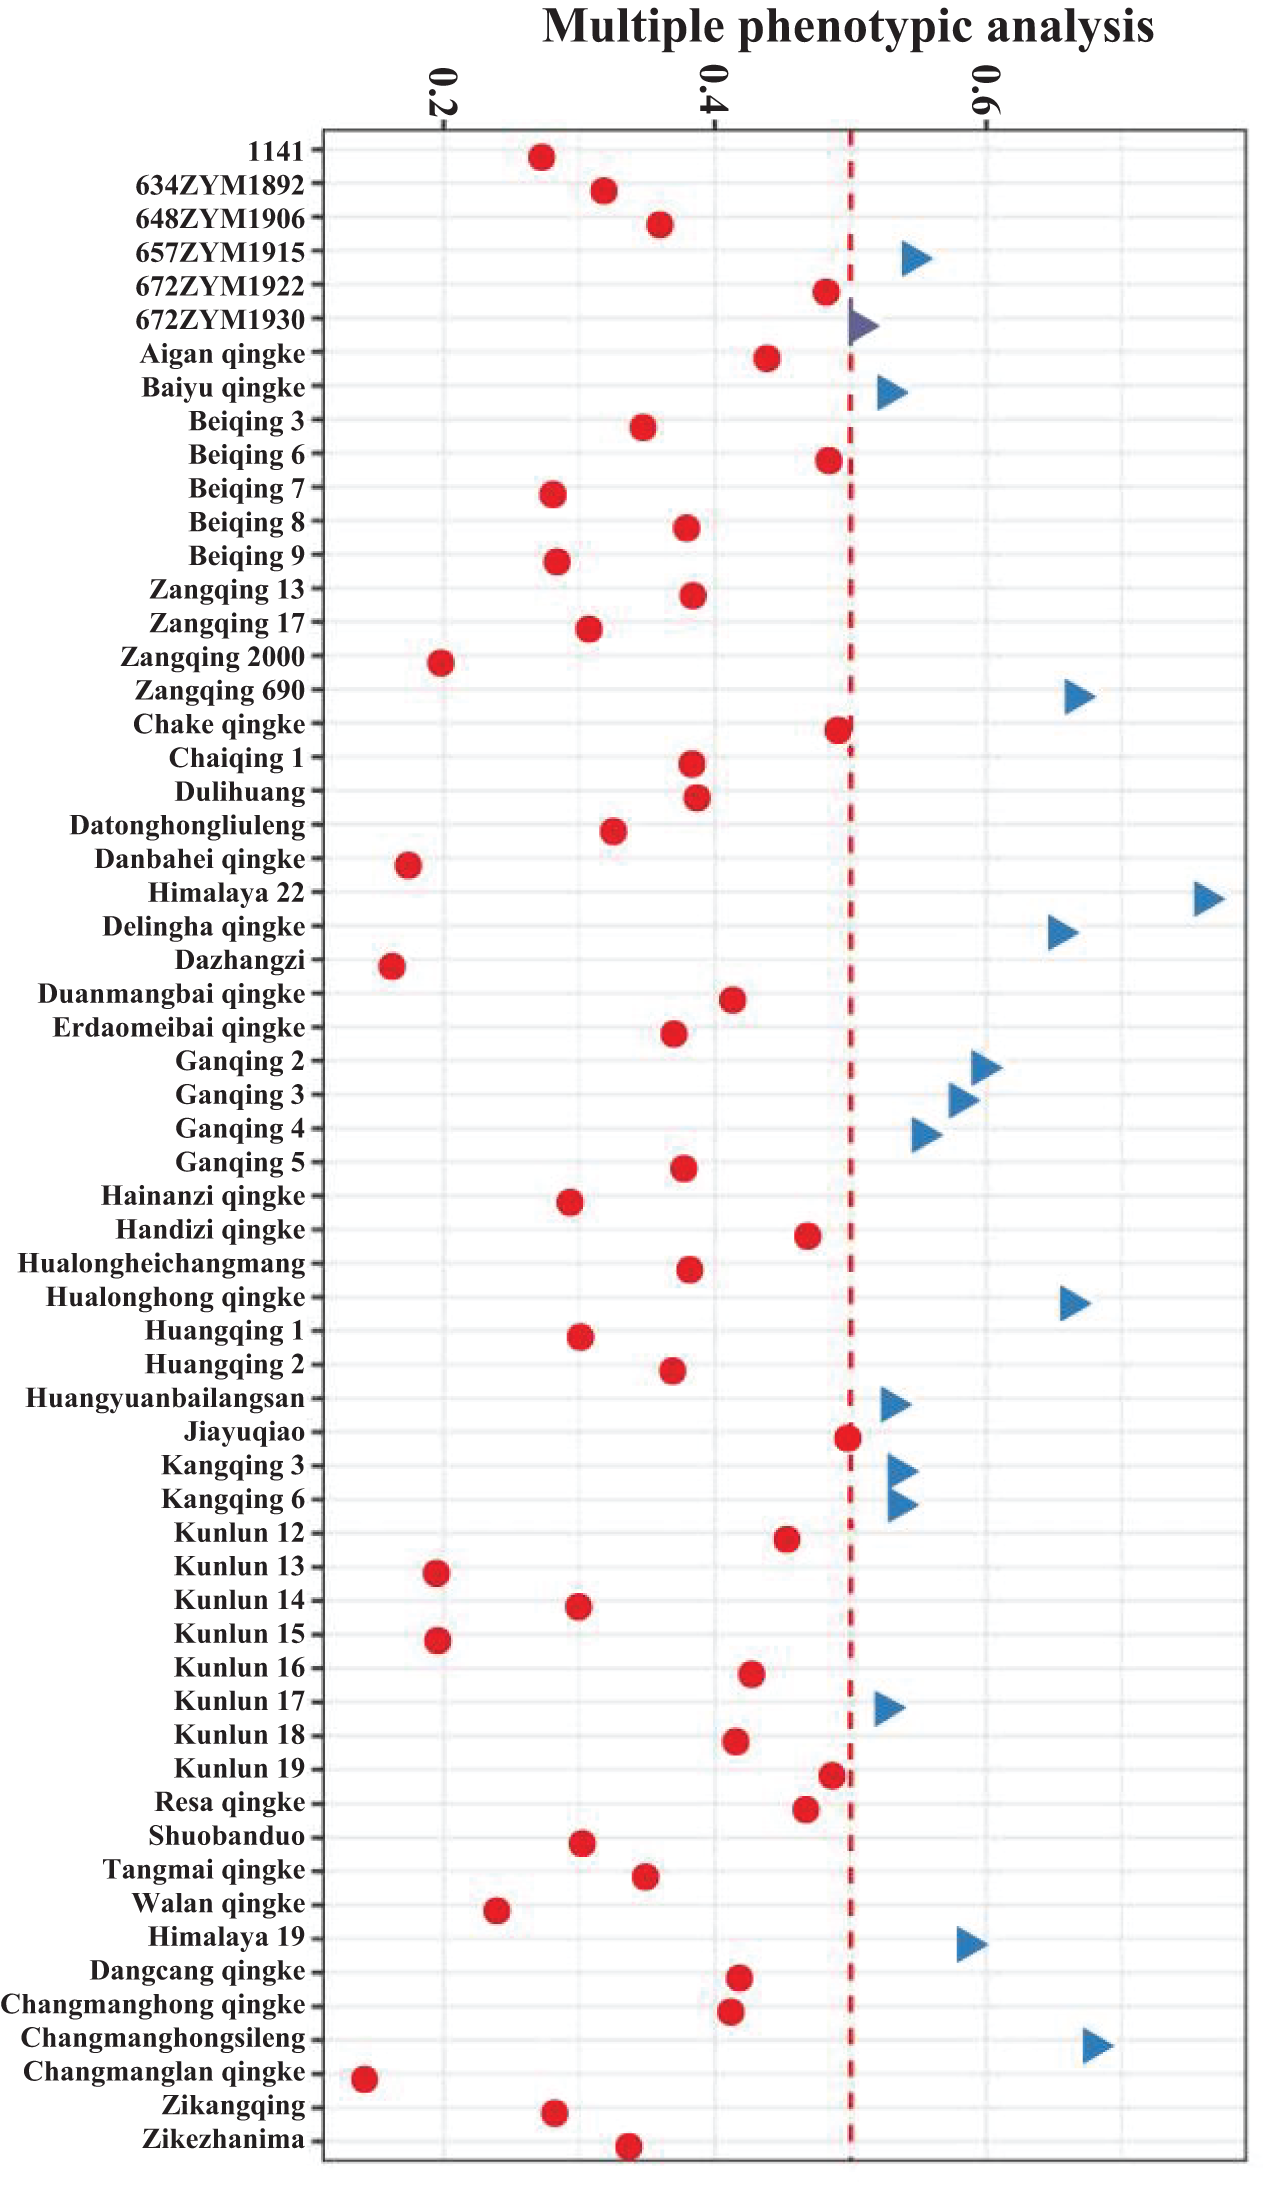
Figure 6: Bubble plot illustrating membership analysis among various hulless barley seedlings
The frequent occurrence of extremely low-temperature stress is the most common stress suffered by qingke seedlings, often leading to frostbite and seedling death, resulting in reduced yields [15]. Therefore, exploring the agronomic and physiological indicators of hulless barley plants under low-temperature stress and establishing an evaluation system for low-temperature-tolerant hulless barley plants are highly important for hulless barley breeding. Hence, studying crucial agronomic and physiological indicators has been a common approach in low-temperature tolerance research [16,17]. Reports on the screening of low-temperature-tolerant genotypes and agronomic and physiological studies on low-temperature tolerance in hulless barley are rare. Research on the agronomic and physiological indicators of hulless barley plants under low-temperature stress is crucial for screening low-temperature-tolerant barley resources. All these findings are conducive to the large-scale and rapid screening of low-temperature-tolerant hulless barley resources and their precise breeding programs.
The crucial indicators of 60 hulless barley varieties under low-temperature stress were analyzed. Significant differences were observed in the agronomic and physiological indicators of the leaves and roots. Compared with the screening and evaluation system of other crop low-temperature resistance resources, this study not only adopts PCA and other analytical methods commonly used in the screening of crop resilience resources, but also applies statistical methods such as PLS-DA, random forest, LASSO, Boruta analysis and other statistical methods to the screening of low-temperature resistance resources in hulless barley. A comprehensive analysis of the agronomic and physiological indicators revealed that the activity of the antioxidant enzyme SSC FPRO could be crucial for evaluating low-temperature tolerance and that the RAD of hulless barley plants was not affected by low-temperature stress. The physiological indicators of hulless barley under low-temperature stress better reflect its resistance to low-temperature stress than do the agronomic indicators. SOD, POD and CAT are essential antioxidant enzyme systems in plants, and their enzymatic activities are closely related to plant stress tolerance [18]. Low-temperature stress significantly increased the SOD, POD, and CAT activities of all the hulless barley varieties, counteracting oxidative damage to cell membranes. This indicated that the antioxidant enzyme system was one of the significant mechanisms for coping with low-temperature stress in hulless barley. MDA is the end product of the oxidative reaction between reactive oxygen radicals and the cell membrane system [19]. MDA causes structural changes in proteins, nucleic acids, and other macromolecules; is toxic to cells; and is an essential indicator of oxidative damage to the cell membrane [20]. The MDA content increased significantly under low-temperature stress, indicating that it caused oxidative damage to the cell membrane system of leaves and roots. FPRO and SSC are broad-spectrum stress-resistant substances in plants that can act as intracellular osmoregulatory substances under various adverse conditions [21]. They stabilize the intracellular biofilm system and macromolecular structure, improve the antioxidant capacity of cells, and provide a large amount of energy for cells to cope with adversity; usually, more stress-resistant crop varieties tend to accumulate more proline [14]. The significance test, coefficient of variation, Pearson correlation coefficient, PCA, PLS-DA, Boruta, random forest, LASSO and membership function were used to analyze the agronomic and physiological indicators of 60 qingke varieties under low-temperature stress. These integrated analytical approaches allow for more precise screening of crop stress tolerance resources and identification of crucial agronomic traits and physiological indicators related to stress tolerance. The final comprehensive evaluation showed that the antioxidant enzyme activity, SSC FPRO, could be used as a crucial indicator to evaluate low-temperature tolerance. Himalaya 22 was the most tolerant to low temperature, whereas Changmanglan qingke was the most sensitive to low temperature. ‘Himalaya 22’ is an excellent qingke variety cultivated in 1988 in Xigaze area of Xizang Autonomous Region, where the average altitude is above 4000 m, and it has more than 30 years of cultivation and promotion history in high altitude and extremely cold area, which explains the variety’s strong resistance to low temperatures.
Low-temperature stress is one of the most important stresses faced by crops in the Qinghai–Xizang Plateau region, and qingke is mainly faced with extreme low-temperature climate in the seedling stage, which leads to yield reduction and lower economic benefits. Differences in low-temperature tolerance also limits the promotion of some excellent hulless barley to higher altitudes and higher cold areas. Therefore, it is important to establish a qingke seedling low-temperature tolerance evaluation system and screen low-temperature tolerance hulless resources for the cultivation of low-temperature tolerance qingke and the promotion of excellent qingke to higher altitude and higher cold areas to improve the agricultural economy is of great significance! This study comprehensively analyzed the agronomic and physiological indicators of 60 qingke varieties under low-temperature stress and clarified the crucial indicators reflecting the ability of low-temperature tolerance of qingke seedlings. Meanwhile, the low-temperature tolerance of different qingke was evaluated, which provides a reference for screening and breeding low-temperature tolerant qingke, and the statistical analysis method in this study also provides an important reference for the future screening and utilization of qingke stress tolerance resources.
Acknowledgement: Authors are thankful to the National Natural Science Foundation of China (NSFC) (32060423).
Funding Statement: This research was supported by National Natural Science Foundation of China (NSFC) (32060423), the Open Project of State Key Laboratory of Plateau Ecology and Agriculture, Qinghai University (2023-ZZ-01), National Natural Science Foundation of China (NSFC), Key Program of Regional Innovation and Development Joint Fund (U22A20453), Qinghai University Natural Science Foundation for Young Scholars (2022-QNY-3), Innovation Fund of Qinghai Academy of Agricultural and Forestry Sciences (2022-NKY-04).
Author Contributions: Data curation, Likun An and Ziao Wang; formal analysis, Likun An and Ziao Wang; funding acquisition, Likun An; investigation, Yongmei Cui and Ziao Wang; methodology, Likun An, Kunlun Wu; project administration, Likun An and Kunlun Wu; software, Likun An and Guangping Du; writing—original draft, Likun An and Ziao Wang; writing—review and editing, Likun An, Ziao Wang and Yixiong Bai. All authors reviewed the results and approved the final version of the manuscript.
Availability of Data and Materials: All data generated or analyzed during this study are included in this published article (and its supplementary information files).
Ethics Approval: Not applicable.
Conflicts of Interest: The authors declare that they have no conflicts of interest to report regarding the present study.
Supplementary Materials: The supplementary material is available online at https://doi.org/10.32604/phyton.2024.055852.
References
1. Legzdina L, Mezaka I, Beinarovica I. Hulless barley resistance to pre-harvest sprouting: diversity and development of method for testing of breeding material. Agron Res. 2010;8(3):645–52. [Google Scholar]
2. Zha S, Yang CB, Zeng XQ, Li ZQ, Wang YL, Yuan HJ, et al. Comparative analysis of H3K4 and H3K27 trimethylations in two contrasting Tibetan hulless barely varieties on powdery mildew infection. J Plant Pathol. 2012;103(1):117–26. [Google Scholar]
3. Zeng XQ, Yuan HJ, Dong XK, Peng M, Jing XY, Xu QJ, et al. Genome-wide dissection of co-selected UV-B responsive pathways in the UV-B adaptation of qingke. Mol Plant. 2020;13(1):112–27. doi:10.1016/j.molp.2019.10.009. [Google Scholar] [PubMed] [CrossRef]
4. Zeng XQ, Guo Y, Xu QJ, Mascher M, Guo GG, Li SC, et al. Origin and evolution of qingke barley in Tibet. Nat Commun. 2018;9(1):1–11. [Google Scholar]
5. Xu QJ, Huang SM, Guo GG, Yang CB, Wang M, Zeng XQ, et al. Inferring regulatory element landscapes and gene regulatory networks from integrated analysis in eight hulless barley varieties under abiotic stress. BMC Genom. 2022;23:843. doi:10.1186/s12864-022-09070-x. [Google Scholar] [PubMed] [CrossRef]
6. Xie Y, Liu QQ, Liu HB, Fan ZP, Shi J, Liu X. Effect of various thermal processing on the structural and in vitro prebiotic characteristics of β-glucan from hulless barley. Food Hydrocolloid. 2023;142:108818. doi:10.1016/j.foodhyd.2023.108818. [Google Scholar] [CrossRef]
7. Liang LJ, Li WB, Tian M, Pan JJ, Feng ZY. Metabolomic profiling of five hulless barley (Hordeum vulgare L.) with different. Genet Resour Crop Evol. 2022;5:1–11. [Google Scholar]
8. Liu WY, Yu KM, He TF, Zhang DX, Liu JX. The low temperature induced physiological responses of Avena nuda L. a cold-tolerant plant species. The Sci World J. 2013;658(793):1–7. [Google Scholar]
9. Du JB, Yuan S, Chen YE, Sun X, Zhang ZW, Xu F. Comparative expression analysis of dehydrins between two barley varieties, wild barley and Tibetan hulless barley associated with different stress resistance. Acta Physiol Plant. 2011;33:567–74. doi:10.1007/s11738-010-0580-0. [Google Scholar] [CrossRef]
10. Chang TL, Xi QQ, Wei XY, Xu L, Wang QQ, Fu JY, et al. Rhythmical redox homeostasis can be restored by exogenous melatonin in hulless barley (Hordeum vulgare L. var. nudum Hook. f.) under cold stress. Environ Exp Bot. 2022;194:104756. doi:10.1016/j.envexpbot.2021.104756. [Google Scholar] [CrossRef]
11. Hong QY, Chen GJ, Wang ZR, Chen XH, Kan JQ. Effects of different thermal processing methods on bioactive components, phenolic compounds, and antioxidant activities of Qingke (highland hullless barley). Food Sci Hum Wellness. 2023;12:119–29. doi:10.1016/j.fshw.2022.07.030. [Google Scholar] [CrossRef]
12. An LK, Wang ZA, Cui YM, Bai YX, Yao YH, Yao XH, et al. Comparative analysis of hulless barley transcriptomes to regulatory effects of phosphorous deficiency. Life. 2024;14(7):17. [Google Scholar]
13. Wang YL, Xu QJ, Yuan HJ, Zeng XQ, Tashi NM. Construction and analysis of SSH library of tibetan hulless barley (Hordeum vulgare L. var. nudum HK. f.) Ximalaya 8 under low temperature treatment. J Wheat Crops. 2017;37(8):1025–30. [Google Scholar]
14. Wang Y, Liu KQ, Liang GL, Jia ZF, Ju ZL, Ma X, et al. Comprehensive evaluation of low nitrogen tolerance in oat (Avena sativa L.) seedlings. Agronomy. 2023;136(4):2–13. [Google Scholar]
15. Yuan HJ, Zeng XQ, Ling XQ, Wei ZX, Wang ZX, Zhuang YL, et al. Transcriptome profiles reveal cold acclimation and freezing tolerance of susceptible and tolerant hulless barley genotypes. Acta Physiol Plant. 2017;39:1–13. [Google Scholar]
16. Yang CB, Yang HZ, Xu QJ, Wang YL, Zha S, Yuan HJ, et al. Comparative metabolomics analysis of the response to cold stress of resistant and susceptible Tibetan hulless barley (Hordeum distichon). Phytochemistry. 2020;174:112–346. [Google Scholar]
17. Santos OJAP, Gonccalves LSA, Scapim CA, Sousa DSM, Castro CR, Baba V, et al. Screening of inbred popcorn lines for tolerance to low phosphorus. Genet Mol Res. 2016;15:1–9. [Google Scholar]
18. Yan QJ, Cai J, Li Y, Liu ZB. The different physiological responses of natural and stationary low temperature on white clover (Trifolium repens L.). In: Proceeding of the International Conference on Materials Engineering, Manufacturing Technology and Control, 2016; Taiyuan, Shanxi, China, vol. 16, p. 507–14. [Google Scholar]
19. Wang L. Characterization and physiological and genetic analysis of phosphorus efficiency in winter wheat germplasms (Master Thesis). China Agricultural University: China; 2009. [Google Scholar]
20. Cui G, Xiao X, Zhang WJ, Lang DY, Li ZX, Zhang XH. Exogenous silicon relieve drought stress and salt stress of Glycyrrhiza uralensis seedlings by regulating proline metabolism and nitrogen assimilation. J Horticultural Sci and Biotechnol. 2021;10:1–10. [Google Scholar]
21. Fedotova MV, Dmitrieva OA. Proline hydration at low temperatures: its role in the protection of cell from freeze-induced stress. Amino Acids. 2016;48(7):1685–94. doi:10.1007/s00726-016-2232-1. [Google Scholar] [PubMed] [CrossRef]
Cite This Article
 Copyright © 2024 The Author(s). Published by Tech Science Press.
This work is licensed under a Creative Commons Attribution 4.0 International License , which permits unrestricted use, distribution, and reproduction in any medium, provided the original work is properly cited.


 Submit a Paper
 Propose a Special lssue
 View Full Text
 Download PDF
 Downloads
 Citation Tools