 Open Access
ARTICLE
MA-Res U-Net: Design of Soybean Navigation System with Improved U-Net Model
Heilongjiang Bayi Agricultural University, College of Engineering, Daqing, 163316, China
* Corresponding Author: Jun Zhao. Email:
Phyton-International Journal of Experimental Botany 2024, 93(10), 2663-2681. https://doi.org/10.32604/phyton.2024.056054
Received 12 July 2024; Accepted 18 September 2024; Issue published 30 October 2024
Abstract
Traditional machine vision algorithms have difficulty handling the interference of light and shadow changes, broken rows, and weeds in the complex growth circumstances of soybean fields, which leads to erroneous navigation route segmentation. There are additional shortcomings in the feature extractFion capabilities of the conventional U-Net network. Our suggestion is to utilize an improved U-Net-based method to tackle these difficulties. First, we use ResNet’s powerful feature extraction capabilities to replace the original U-Net encoder. To enhance the concentration on characteristics unique to soybeans, we integrate a multi-scale high-performance attention mechanism. Furthermore, to do multi-scale feature extraction and capture a wider variety of contextual information, we employ atrous spatial pyramid pooling. The segmented image generated by our upgraded U-Net model is then analyzed using the CenterNet method to extract key spots. The RANSAC algorithm then uses these important spots to delineate the soybean seedling belt line. Finally, the navigation line is determined using the angle tangency theory. The experimental findings illustrate the superiority of our method. Our improved model significantly outperforms the original U-Net regarding mean Pixel Accuracy (mPA) and mean Intersection over Union (mIOU) indices, showing a more accurate segmentation of soybean routes. Furthermore, our soybean route navigation system’s outstanding accuracy is demonstrated by the deviation angle, which is only 3° between the actual deviation and the navigation line. This technology makes a substantial contribution to the sustainable growth of agriculture and shows potential for real-world applications.Keywords
In current agricultural production, due to changes in farmland tillage systems and the long-term use of chemical herbicides, the weed structure in China’s farmland is complex and the harm is serious [1,2]. Weeds in the field compete with crops for water, sunlight, nutrients, etc., which limits crop growth and reduces yields [3]. The yield of crops under weed interference will gradually decrease with the increase of soil fertility [4], and the residual time of herbicides is long, which will harm the next crop and affect the adjustment of planting structure [5]. The machine vision-based mechanical weeding method is an environmentally friendly and safe agricultural weeding method that does not produce harmful residues and does not endanger human health. At the same time, it can better protect the ecological environment and avoid the damage caused by chemical weed control to the environment. Traditional machine vision algorithms struggle to handle the complex light and shadow changes, broken rows, and weed interference in the soybean field’s complex growth environment, leading to segmentation errors in navigation routes. To address these issues, this study proposes a neural network-based machine vision technology for path navigation in soybean environments. This technology can be applied to critical agricultural operations such as weeding and pesticide spraying during soybean mid-season cultivation, thereby enhancing efficiency, and precision, and reducing labor costs. By implementing this technology, agricultural production can achieve a higher level of mechanization and precision agriculture, significantly improving the utilization of agricultural resources and promoting sustainable agricultural development. Furthermore, the application of this technology aligns with the development requirements and promising future of modern agriculture. We envision that this technology will play an increasingly significant role in future agricultural production, contributing positively to the modernization and sustainability of agriculture.
After reviewing the literature, it is evident that previous methods for inter-row extraction faced challenges such as low robustness and limited adaptability in machine vision navigation. Huang et al. addressed these issues by proposing a convolutional neural network-based algorithm for field path navigation [6]. They modified the mainstream semantic segmentation model FCNVGG16 to obtain an improved segmentation network, FCNVGG14, which served as a preprocessing step for crop row segmentation in the field. Following segmentation, an enhanced Hough transform (PKPHT) was employed to fit the navigation line, achieving a detection accuracy of no less than 92%. Peng et al. introduced an improved orchard navigation line detection method based on the YOLOv7 model. They integrated an attention mechanism module (CBAM) into the detection head network of the original YOLOv7 model to enhance fruit tree target features and mitigate background interference [7]. Han et al. proposed a visual navigation path recognition method for orchards based on the U-Net network, addressing issues like complex image backgrounds and numerous interfering factors in orchard environments [8]. The semantic segmentation model achieved a segmentation intersection-over-union ratio of 86.45%. Yang et al. introduced a navigation line detection method for potato machines. By replacing the backbone feature extraction structure of U-Net with VGG16, they improved image segmentation, particularly in handling shape variations of potato crops at different growth stages and field noise. Additionally, by introducing a feature midpoint-adaptive fitting method, the method could adaptively adjust the position of the visual navigation line based on potato growth shapes [9]. Experimental results demonstrated that this method accurately detected the navigation line throughout various potato growth stages, exhibiting higher crop row segmentation accuracy and smaller average deviations in fitted navigation lines compared to the original U-Net model. Gao et al. introduced a novel navigation line detection algorithm, YOLOv4-HR, which incorporates enhanced Haar-like features for image enhancement [10]. This augmentation enriches the semantic information of training images and enhances the network’s generalization ability. Experimental results indicate that compared to the original YOLOv4 network, YOLOv4-HR significantly improves both AP value and recall rate, thereby reducing the impact of environmental factors on navigation line detection performance. Gong et al. achieved real-time and high-precision detection of corn crop rows using an improved MobileNetv3 and YOLOv5s network model (YOLOv5-M3) combined with CBAM and DIoU-NMS algorithms. This method not only achieves fast speed (39 FPS) but also high accuracy (mAP 92.2%), enabling real-time determination of the relative position of corn seedlings and weeders, effectively preventing damage to seedlings [11]. Cheng et al. presented a visual navigation line extraction method based on the DeepLabV3+ architecture. Combining the MobileNetV2 module, the sensitivity of DeepLabV3+ to illumination in the deep convolutional neural network part was improved. Experimental results show that this method can quickly and accurately identify navigation lines under different sunlight conditions, outperforming traditional methods and the improved U-Net network [12]. Gong et al. proposed an improved YOLOv7-tiny network model for target detection of crop seedlings in infrared images. This model combines ShuffleNet v1 to reduce computational complexity, enhance feature extraction, and integrate the coordinate attention (CA) mechanism to improve detection performance. An Expected Intersection over Union loss (EIOU) function is used to accelerate model convergence and improve positioning accuracy. Experiments show that the model achieves 94.21% detection accuracy and 32.4 frames per second at night, accurately identifying corn seedlings with positioning reference point errors that meet navigation requirements, providing an effective solution for mobile device deployment [13]. Cao et al. introduced an improved ENet semantic segmentation network model for visual navigation line extraction in farmland environments using unmanned aerial vehicles (UAVs). Based on a residual network design, this model effectively extracts low-dimensional boundary information through a shunting process, improving the accuracy of crop boundary positions and inter-row segmentation in farmland. An improved random sample consensus algorithm and least squares method are used to extract and fit navigation lines, achieving accurate and efficient farmland navigation line extraction [14]. Liang et al. introduced a navigation line detection algorithm that integrates edge detection and Nobuyuki Otsu thresholding method (OTSU), specifically tailored to address the issue of navigating line extraction in seedlings grown in wide and narrow rows. Experimental results demonstrate the algorithm’s high accuracy in cotton, corn, and soybean seedlings, coupled with its fast processing speed, satisfying the requirements for real-time navigation [15].
Previous studies have achieved promising results in identifying and extracting crop row lines using various neural networks, yet the YOLO and VGG models are deemed unsuitable for soybean seedlings. The basic YOLO model has limitations in precisely recognizing and segmenting fine features and textures, making it unsuitable for dense soybean seedlings. The VGG network [16,17], on the other hand, has fewer layers, limited feature extraction ability, and large Number of parameters, which is not conducive to the subsequent application in the actual soybean path navigation system design. The traditional U-Net architecture employs a simplified backbone network, lacking effective communication between different channels in feature maps and the efficient utilization of spatial information [18,19], thus exhibiting limitations in feature extraction. To address these challenges, we propose an enhanced U-Net-based method. Given the challenges posed by factors such as light and shadow variations, broken rows, and weeds in soybean planting environments [20], where traditional machine vision algorithms often fail to extract navigation lines effectively, and if these effects are not properly differentiated, the segmented images will become larger or smaller, and this result will be biased for the extraction of the later navigation paths, so in order to address these effects, we introduce a navigation line extraction approach based on an improved U-Net network. This approach leverages image segmentation results and employs the CenterNet algorithm to segment and extract centroids from the binary images. Subsequently, the navigation line is obtained by fitting the extracted feature points, employing the tangent principle of included angles.
The key contributions of this study are as follows:
1. We present the MA-Res U-Net model, a novel architecture tailored specifically for soybean navigation path segmentation.
2. The ResNet network is integrated to facilitate deeper extraction of soybean feature and detail information.
3. A Multi-scale High-performance Attention Mechanism (MHA) is introduced, enabling efficient extraction of target semantic and feature information with minimal computational overhead.
4. The Atrous Spatial Pyramid Pooling (ASPP) module is employed to prevent information loss after convolution, achieving multi-scale feature extraction and enhancing the model’s edge segmentation accuracy.
5. The practical application of the proposed MA-Res U-Net model, coupled with hardware integration, demonstrates its superior performance and efficiency.
2 Based on the Improved U-Net Network
U-Net is a specialized convolutional neural network (CNN) architecture designed for image segmentation tasks [21]. Initially proposed by Ronneberger and colleagues in 2015, this network was primarily developed to address the challenge of segmenting cells in biomedical images. A distinctive feature of U-Net is its encoder-decoder structure, complemented by skip connections that link corresponding layers between the encoder and decoder stages. The encoder of U-Net performs a series of convolutions and downsampling operations to reduce the spatial dimensions of the input while increasing the number of feature channels, thereby learning higher-level abstract features. Conversely, the decoder stage upsampling to gradually restore the resolution of the feature maps while reducing the number of feature channels, culminating in a segmentation output that matches the size of the input image [22,23]. To fully leverage information across different scales and preserve fine details, U-Net incorporates skip connections. These connections enable the decoder to not only access high-level semantic information but also directly utilize low-level features from earlier stages of the encoder. This mechanism is critical for maintaining edge and texture details, which are essential for accurate segmentation. This design enables U-Net to handle objects at various scales and achieve good segmentation performance even with limited training data. The robustness and versatility of U-Net have led to its widespread adoption not only in biomedical image analysis but also in diverse applications such as remote sensing [24], perception systems for autonomous vehicles [25], and environmental monitoring [26]. As a result, U-Net has become a seminal model in the field of image segmentation. The success of U-Net can be attributed to its effective combination of feature extraction and restoration, along with its ability to handle small datasets through the utilization of skip connections and a symmetrical architecture. These attributes have made it a benchmark for segmentation tasks across multiple domains.
The U-Net network employs a U-shaped architecture, consisting of four encoder modules for downsampling [27,28]. Each encoder module is composed of two 3 × 3 convolutional layers followed by a 2 × 2 max pooling layer, progressively reducing the feature map size. Conversely, the decoder section comprises four upsampling modules, each containing a 2 × 2 deconvolutional layer, a skip connection, and two 3 × 3 convolutional layers, gradually increasing the feature map size. The network utilizes the ReLU function for activation. Fig. 1 depicts the overall framework of the network’s architecture.

Figure 1: U-Net structure diagram
2.2.1 Residual Network Structure Module
The traditional U-Net network exhibits certain limitations in feature extraction for soybean path segmentation. To enhance its performance, the encoder section of the U-Net network is improved by employing ResNet as the feature extractor. ResNet, a convolutional neural network with deep residual connections, is effective in capturing both detailed and semantic information from images, while effectively preventing gradient vanishing and explosion [29]. This allows the network to better capture the fine-grained and semantic details in soybean images, thereby improving segmentation accuracy. Additionally, the deep network structure and residual connections of ResNet enhance the network’s expressive power and gradient propagation, further boosting the performance of the U-Net network. Fig. 2 illustrates the architecture of the ResNet module.
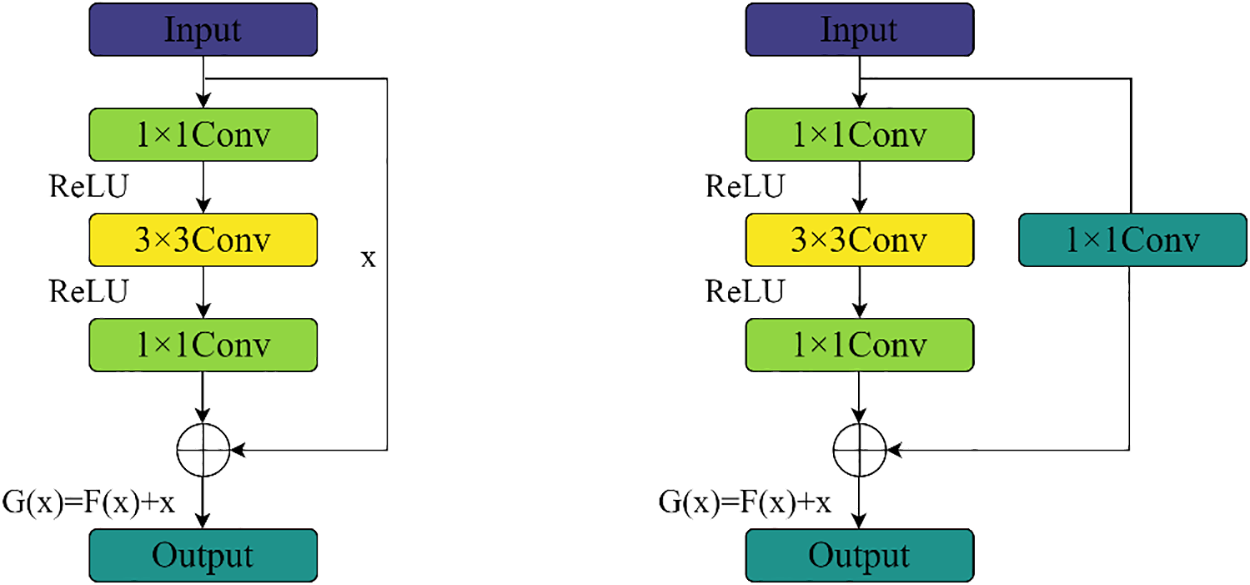
Figure 2: ResNet module diagram
Choosing an appropriate backbone network depth is crucial. There are two types of ResNet module variants. As shown in Fig. 2a,b, when the input channels differ from the output channels, a 1 × 1 convolution is employed for adjustment. Each residual module consists of three convolutional layers: 1 × 1, 3 × 3, and 1 × 1, stacked sequentially. The residual block introduces the input data x directly into the output part of the subsequent layer by skipping F(X), thus preserving the feature information from the previous layer in the final feature map H(X). This process safeguards information integrity and reduces the loss of soybean seedling strip feature information caused by traditional convolution and downsampling operations. Consequently, ResNet is adopted as the backbone extraction network in the encoding region to enhance the accuracy of soybean seedling strip segmentation.
2.2.2 Multi-Scale High-Performance Attention Mechanism
The traditional U-Net approach encounters a semantic gap in feature fusion, where low-level features extracted by the encoder are fused with high-level features via skip connections. This fusion can lead to discrepancies due to the disparity in detail and abstraction levels of the integrated features. Additionally, the current attention mechanisms for soybean path segmentation tend to be complex and heavily nested, resulting in high computational loads and resource-intensive models. To address these issues, we introduce a multi-scale high-performance attention mechanism (MHA), as illustrated in Fig. 3. First, MHA focuses on highlighting specific areas in soybean images by assigning different weights to each location through the spatial attention mechanism, then focuses on the importance difference between soybeans and weeds in the feature map through the channel attention mechanism, and finally, the channel prior spatial attention (CPSA) module dynamically assigns attention weights in channel and spatial dimensions. By introducing a multi-scale depthwise convolution module, it effectively captures spatial relationships. Specifically, it performs max pooling and average pooling on the input feature maps to generate spatial feature information at two different scales. These are then fed into a shared multi-layer perceptron and summed to obtain a channel attention map that incorporates contextual information. The design of MHA aims to preserve critical information throughout the processing pipeline and bridge the semantic gap between low-level and high-level features, especially after pooling operations. This ensures that no information is lost during upsampling and fusion. By incorporating the multi-scale depthwise convolution module, MHA maintains channel prior information while effectively capturing spatial relationships and dynamically allocating attention in both spatial and channel dimensions, resulting in reduced computational complexity and improved focus on soybean features.
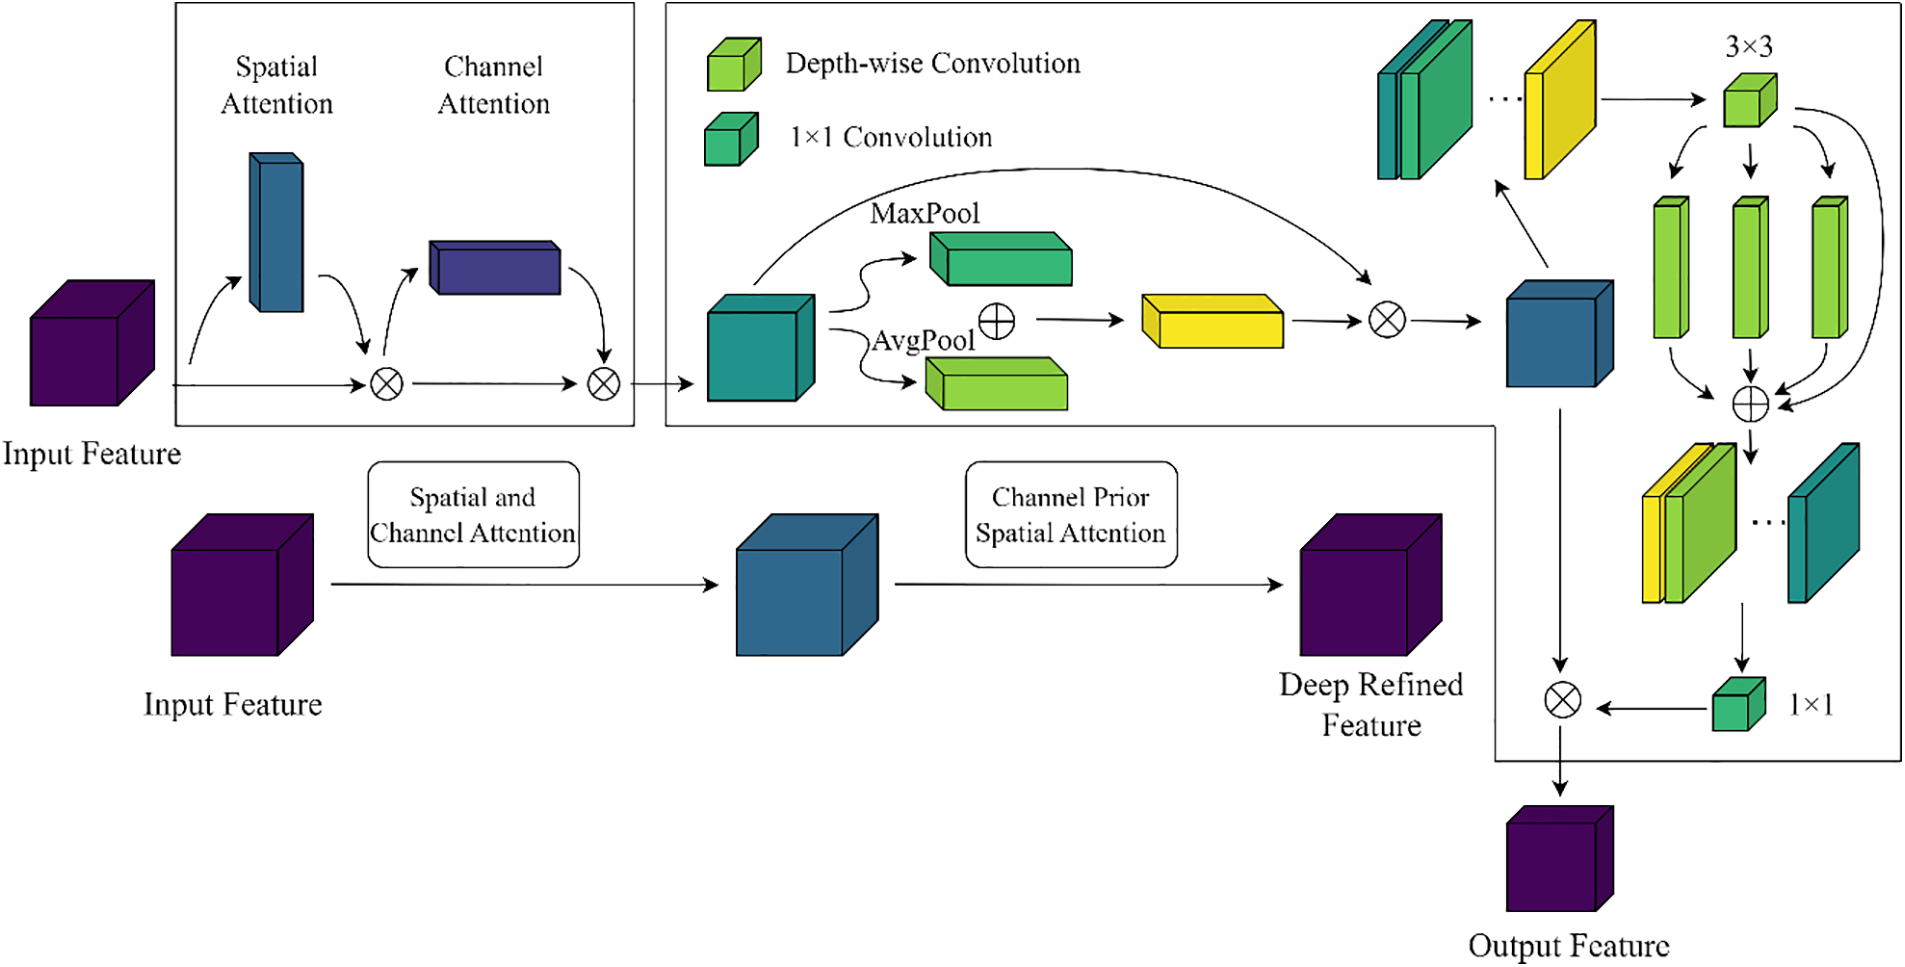
Figure 3: MHA structural diagram
2.2.3 Atrous Spatial Pyramid Pooling
To enhance the accuracy of soybean path segmentation, we introduce the ASPP into the U-Net decoder to prevent information loss after convolution, enabling multi-scale feature extraction and improving the precision of model edge segmentation [30]. ASPP utilizes Dilated Convolutions with varying dilation rates to extract multi-resolution feature responses from a single-resolution branch. Dilated Convolutions is a special convolution operation that enlarges the receptive field by inserting cavities into the filter while keeping the number of parameters constant. This means that the model’s receptive field can be significantly increased without adding additional parameters, which in turn captures a greater range of context. This multi-resolution analysis-based feature extraction enhances the network’s multi-scale descriptive capability, broadening its receptive field and focusing on contextual information surrounding the soybean path. ASPP comprises multiple parallel dilated convolutional layers that perform convolution and pooling operations on the input feature maps at four sampling rates of 1, 6, 12, and 18. The results are then concatenated to fuse multi-scale semantic information and expand the number of channels to form a comprehensive feature representation. Subsequently, a 1 × 1 convolution is applied to alter the number of output channels, extending the perceptual range of the feature maps while maintaining high resolution and allowing each convolutional output to incorporate a wide range of feature information. This complements the information missed after convolving the soybean path edges, enhancing the accuracy and completeness of edge segmentation (Fig. 4).
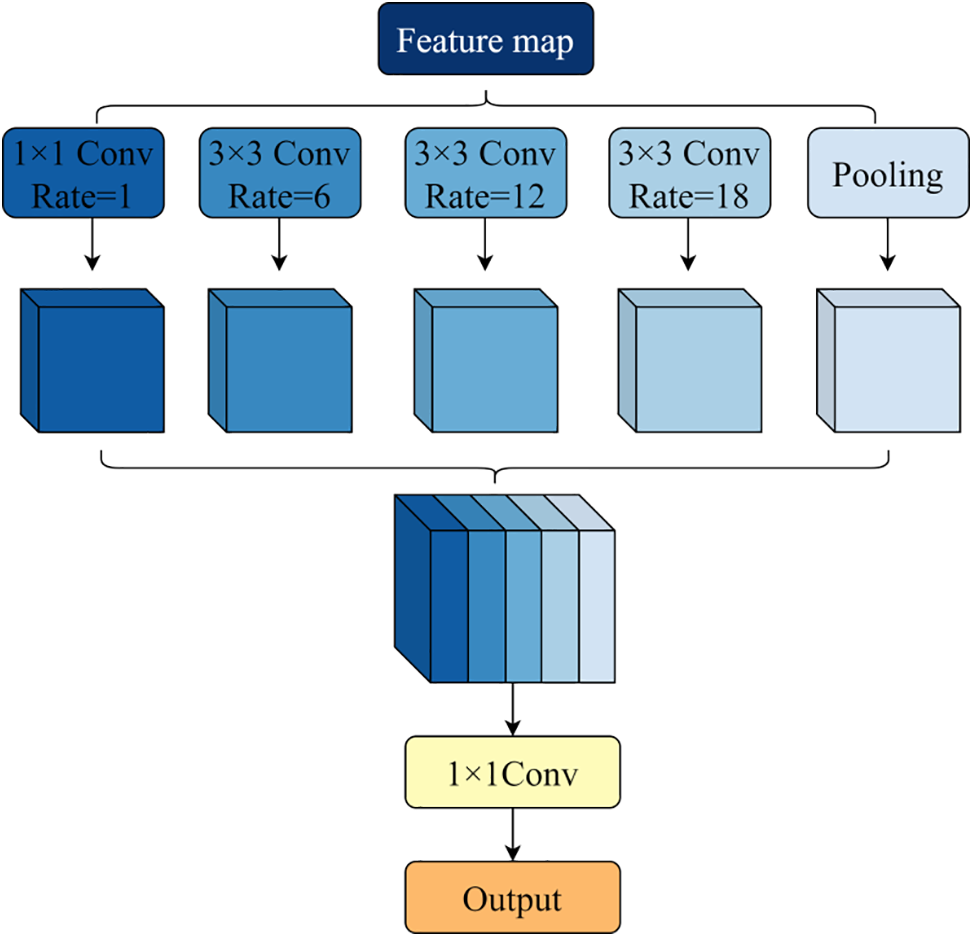
Figure 4: ASPP structural diagram
Given its numerous advantages, the U-Net semantic segmentation model often achieves superior image segmentation results. However, soybean path segmentation poses greater challenges compared to the phenotypic segmentation of pedestrians or animals, as soybeans are prone to confusion with weeds and are affected by light and shadow, resulting in suboptimal segmentation of soybean paths or missed detections of small-sized soybeans. To address these issues, the U-Net network requires further enhancement to bolster its phenotypic feature extraction capabilities and improve detection accuracy. The refined network, named MA-Res U-Net, is illustrated in Fig. 5. The specific improvements are as follows:
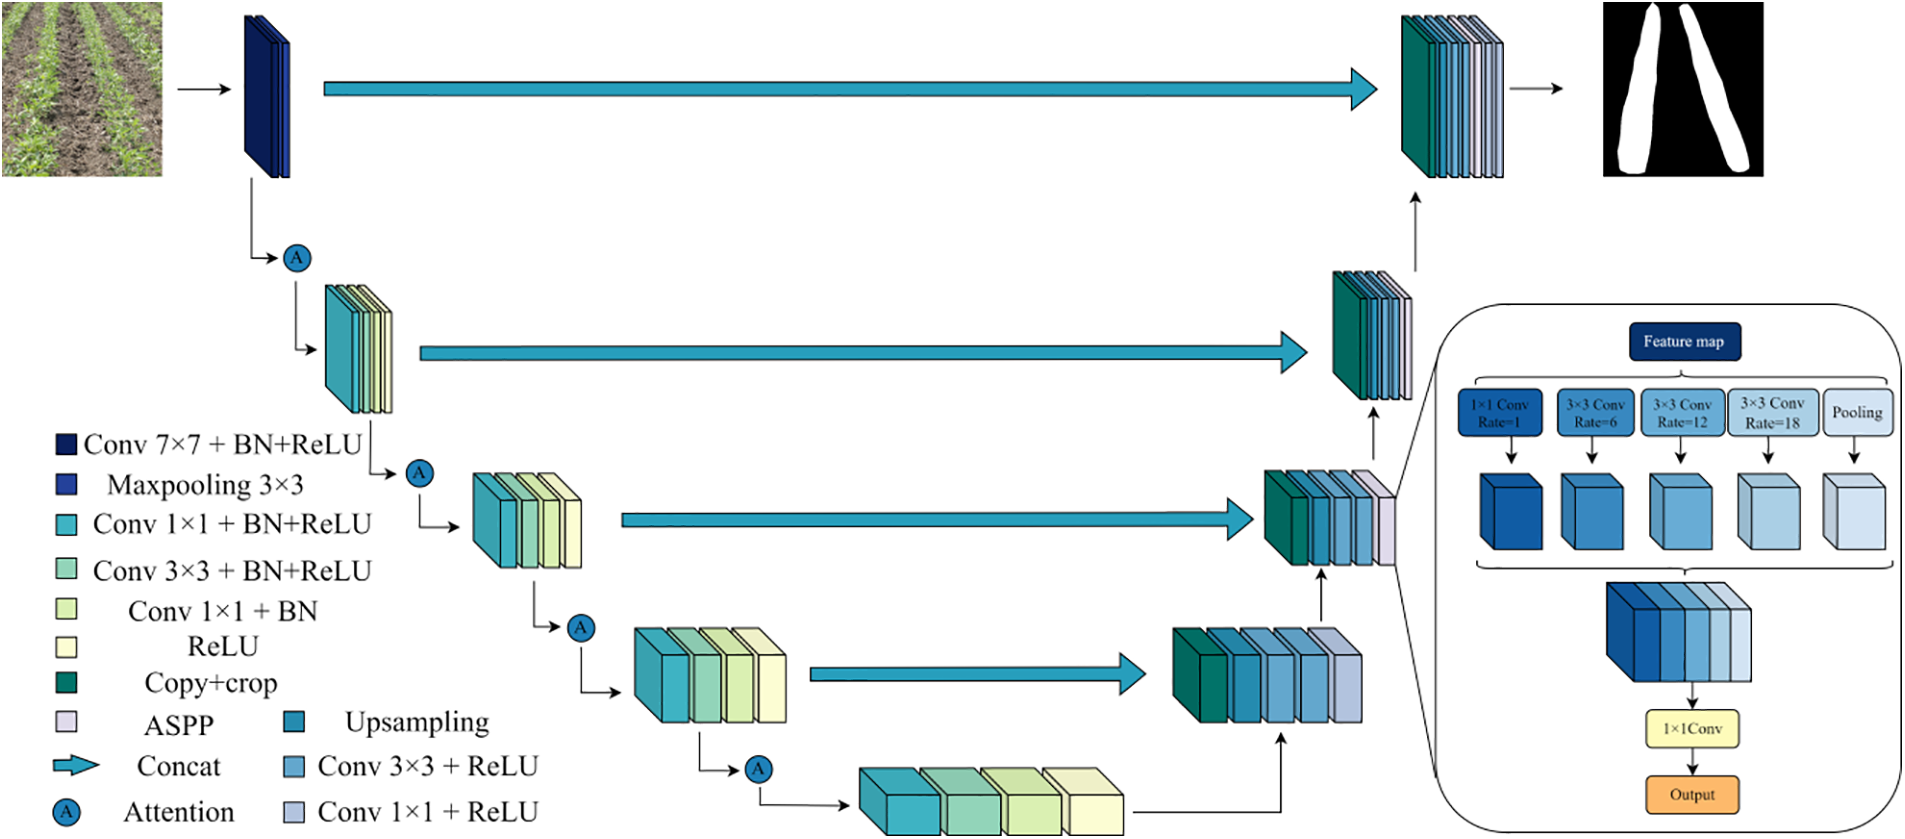
Figure 5: Improved U-Net model
The adoption of ResNet50 as the backbone feature extraction network deepens the network and enhances its ability to extract fine-grained information for more precise soybean path segmentation. Additionally, the output layers of each ResNet module are concatenated with the corresponding levels of the decoder through skip connections, ensuring the integration of shallow and deep network information, and thereby improving segmentation accuracy.
To ensure robust initial feature extraction from the backbone network, the MHA module is utilized to effectively bridge the semantic gap between different feature scales.
After each upsampling stage, the ASPP module is introduced in the latter half of the U-Net, enabling atrous convolution with four distinct sampling rates of 1, 6, 12, and 18. The features extracted from each sampling rate are processed in separate branches and fused to maintain the feature map’s resolution while capturing different scale perceptual fields. This approach facilitates the localization of small-sized phenotypes and edge recognition of large-sized phenotypes, thereby addressing issues such as inaccurate boundary predictions caused by weeds, light, and shadow in soybean path segmentation and enhancing the model’s edge segmentation precision.
In MA-Res U-Net, its loss function uses the sum loss of binary cross entropy loss and Dice loss. In this way, the U-Net model can optimize both the accuracy of the segmentation contour and the overall quality of the segmentation during training, resulting in better segmentation results. The total loss is defined below:
where LBCE represents the binary cross entropy loss and LDice represents the Dice loss.
The Dice loss function is a variant based on the Dice similarity coefficient (DSC) that is used to measure the similarity between two sets. In image segmentation, the Dice loss function can help the model learn better to predict the overlapping parts between predicted and true contours. The Dice loss function can be defined as:
where Pij represents the value of the predicted segmentation result at the position of column j in row I, Gij represents the value of the true split result at the position of column j in row i, ∑i, jPijGij represents the sum of the product of the elements that represent the intersection of the predicted result and the true result,
The Binary Cross Entropy (BCE) loss function is primarily used for binary classification problems, and it is particularly useful when dealing with imbalanced datasets. It ensures that the model not only focuses on the correct prediction of the foreground class but also on the prediction of the background class. For each pixel i, j, the binary cross entropy loss function can be defined as:
where
The mean Intersection over Union (mIoU) and mean Pixel Accuracy (mPA) were utilized as objective evaluation metrics to assess the segmentation performance of various semantic segmentation models. Specifically, mIoU represents the averaged intersection ratio (IoU) between the actual and predicted values for each category, while mPA denotes the sum of correctly classified pixels’ proportions relative to the total pixels for each category, and the Dice coefficient is used to calculate the similarity between two samples. By calculating and averaging these mean values, the accuracy of classification for each category is precisely determined [31].
where k + 1 denotes the predicted category plus a background, and pij denotes the number of pixels in category i that are predicted to be in category j. Therefore, pii is a positive sample, pij is a false negative sample, and pji is a false positive sample.
where TP (true positives) represents the number of correctly identified pixels as being part of an object, FN (false negatives) represents the number of incorrectly identified pixels as being not part of an object, TN (true negative) represents the number of correctly identified pixels as being not part of an object, and FP (false positives) represents the number of incorrectly identified pixels as being part of an object.
3 Data Set Production and System Design
This paper’s data sets were collected at the Agricultural Science and Technology Park of Anda City, Heilongjiang Province. In the middle of the soybean growing season, we took 500 images of the soybean growing environment under different weed densities and light conditions. The captured image is in JPG format with an initial size of 3024 × 2048 pixels, subsequently adjusted to 256 × 256 pixels. The photos are divided into training and test sets with a ratio of 5:1. We selected several pictures with representative values, such as line breaks, light and shadow changes, weeds, etc. The data set is shown in Fig. 6.

Figure 6: Part of the dataset picture
Because there are many similar targets in crop and non-crop row areas, the segmentation results of a single target cannot accurately reflect the overall trend of the soybean seedling zone. In addition, tagging individual objects is challenging. Therefore, this paper focuses on the labeling and segmenting of soybean seedling belts. We used LabelMe software to annotate the soybean images collected. The labeled samples are classified into a separate category, labeled “LINE.” The tagging tool uses a rectangular box to mark the soybean seedling belt, covering the entire visible area within the camera’s field of view, ensuring that the rectangular box completely covers the soybean seedling belt. By manual labeling, the soybean seedling zone was marked as a positive example and the soil zone as a negative example. Fig. 7 shows an example of labeling soybean images using LabelMe software.
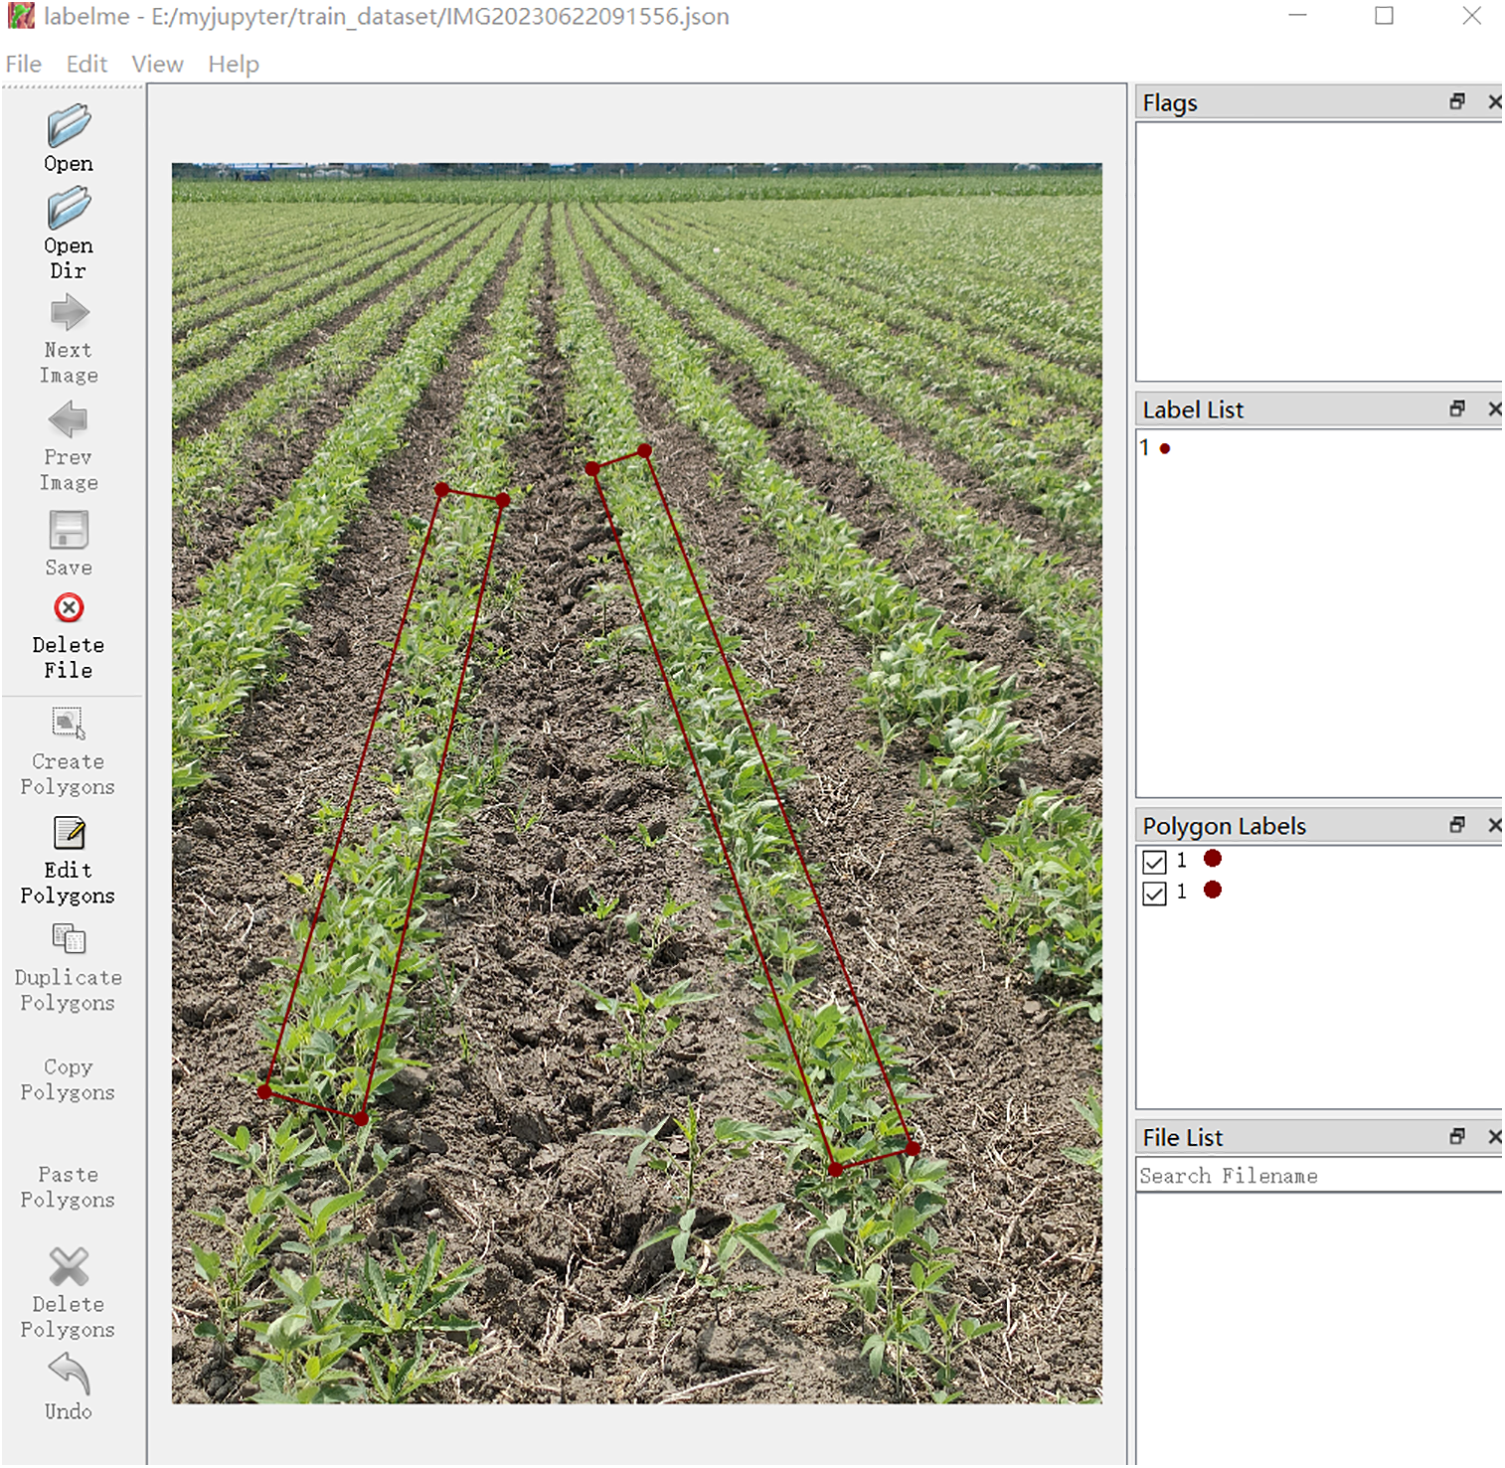
Figure 7: Labeling process
3.2 Experimental Configuration and Experimental Results
Our system configuration includes 16 GB RAM, an i5-7300 processor, and a GTX-1050 graphics card. We use Python 3.9 as the programming language and TensorFlow 2.1 as the deep learning framework.
We used the original dataset of 450 labeled images as the training dataset and 50 images as the test dataset. Before training, we will apply data enhancement techniques such as rotation, translation, scaling, and other methods to the training data set. The enhanced data set is then input into the MA-Res U-Net model for training. In the training model phase, we select the Adam optimizer as the optimization function, set the learning rate to 0.001, and run 200 training epochs. To ensure the integrity of the model training process, we save the model training parameters every 10 epochs.
To validate the effectiveness of the proposed modules in enhancing the segmentation performance of U-Net, we conduct ablation experiments to test the efficacy of the ResNet network, MHA module, and ASPP module. We conducted five sets of experiments to validate the individual contributions of each module, and the experimental results are presented in Table 1.

Compared to the classical U-Net model, the modified U-Net model achieved improved values in both mean Intersection over Union (mIoU) and mean Pixel Accuracy (mPA), as indicated in Table 1. Overall, the modified model exhibits significant advantages over the original model in soybean segmentation. By replacing the encoder, the mIoU increased by 1%, and the mPA improved by 0.8%. The addition of the Multi-Head Attention (MHA) module enhanced the mIoU by 1.6% and the mPA by 1.6%. Furthermore, incorporating the Atrous Spatial Pyramid Pooling (ASPP) module resulted in a 1.1% increase in mIoU and a 1% rise in mPA. Through ablation experiments, it is evident that all three proposed modifications, including the replacement and additions, have contributed to notable improvements. Fig. 8 depicts the segmentation prediction results of our proposed MA-Res U-Net model. It can be seen from the segmentation results that the improved U-Net neural network has achieved satisfactory results in soybean path navigation segmentation, effectively dealing with discontinuity and missing problems, and ensuring the continuity of soybean seedling belt. This plays a very important role in the subsequent navigation line extraction.

Figure 8: Segmentation results for selected datasets
3.3 Performance Comparison of Different Segmentation Methods
This paper compares MA-Res U-Net with traditional PSPNet, SegNet and Deeplab. The comparison results of different segmentation algorithms are shown in Table 2 and Fig. 9, and the changes of mIoU in the training process are shown in Fig. 10. This paper compares MA-ResU-Net with traditional PSPNet, SegNet, and Deeplab. The comparison results of different segmentation algorithms are shown in Table 2. As shown in the table, the mIoU of the improved method in this paper is 82.9%, which is 3.4%, 5.3%, and 2.7% higher than the traditional PSPNet algorithm, SegNet algorithm, and Deeplab algorithm, respectively. For mPA, the improved method obtained a value of 92.1%. In terms of mPA, it is 6.5%, 8.9%, and 3.8% higher than the traditional PSPNet algorithm, SegNet algorithm and Deeplab algorithm, respectively. In terms of Dice evaluation indexes, Dice was 6.1%, 6.9% and 2.2% higher than the traditional PSPNet algorithm, SegNet algorithm and Deeplab algorithm, respectively. The experimental results show that the improved U-Net algorithm proposed in this paper not only captures fine granularity and semantic details in soybean images better, but also improves the accuracy and integrity of edge segmentation, and significantly improves the accuracy of grape semantic segmentation. The visualization of the segmentation result is shown in Fig. 9. In Fig. 11, the first column shows the segmentation results of the PSPNet model, the second column shows the segmentation results of the SegNet model, the third column shows the segmentation results of the Deeplab model, and finally, the fourth column shows the segmentation results from the MA-Res U-Net model proposed in this paper. It can be seen from the visualization results that the segmentation accuracy of the PSPNet model is poor, and weeds and soybeans are misdetected. The SegNet model is not accurate enough to detect the edge of the soybean path. The Deeplab model is poor in processing soybean path details, while the MA-Res U-Net model can segment soybean path edge details more accurately and obtain better precision results.

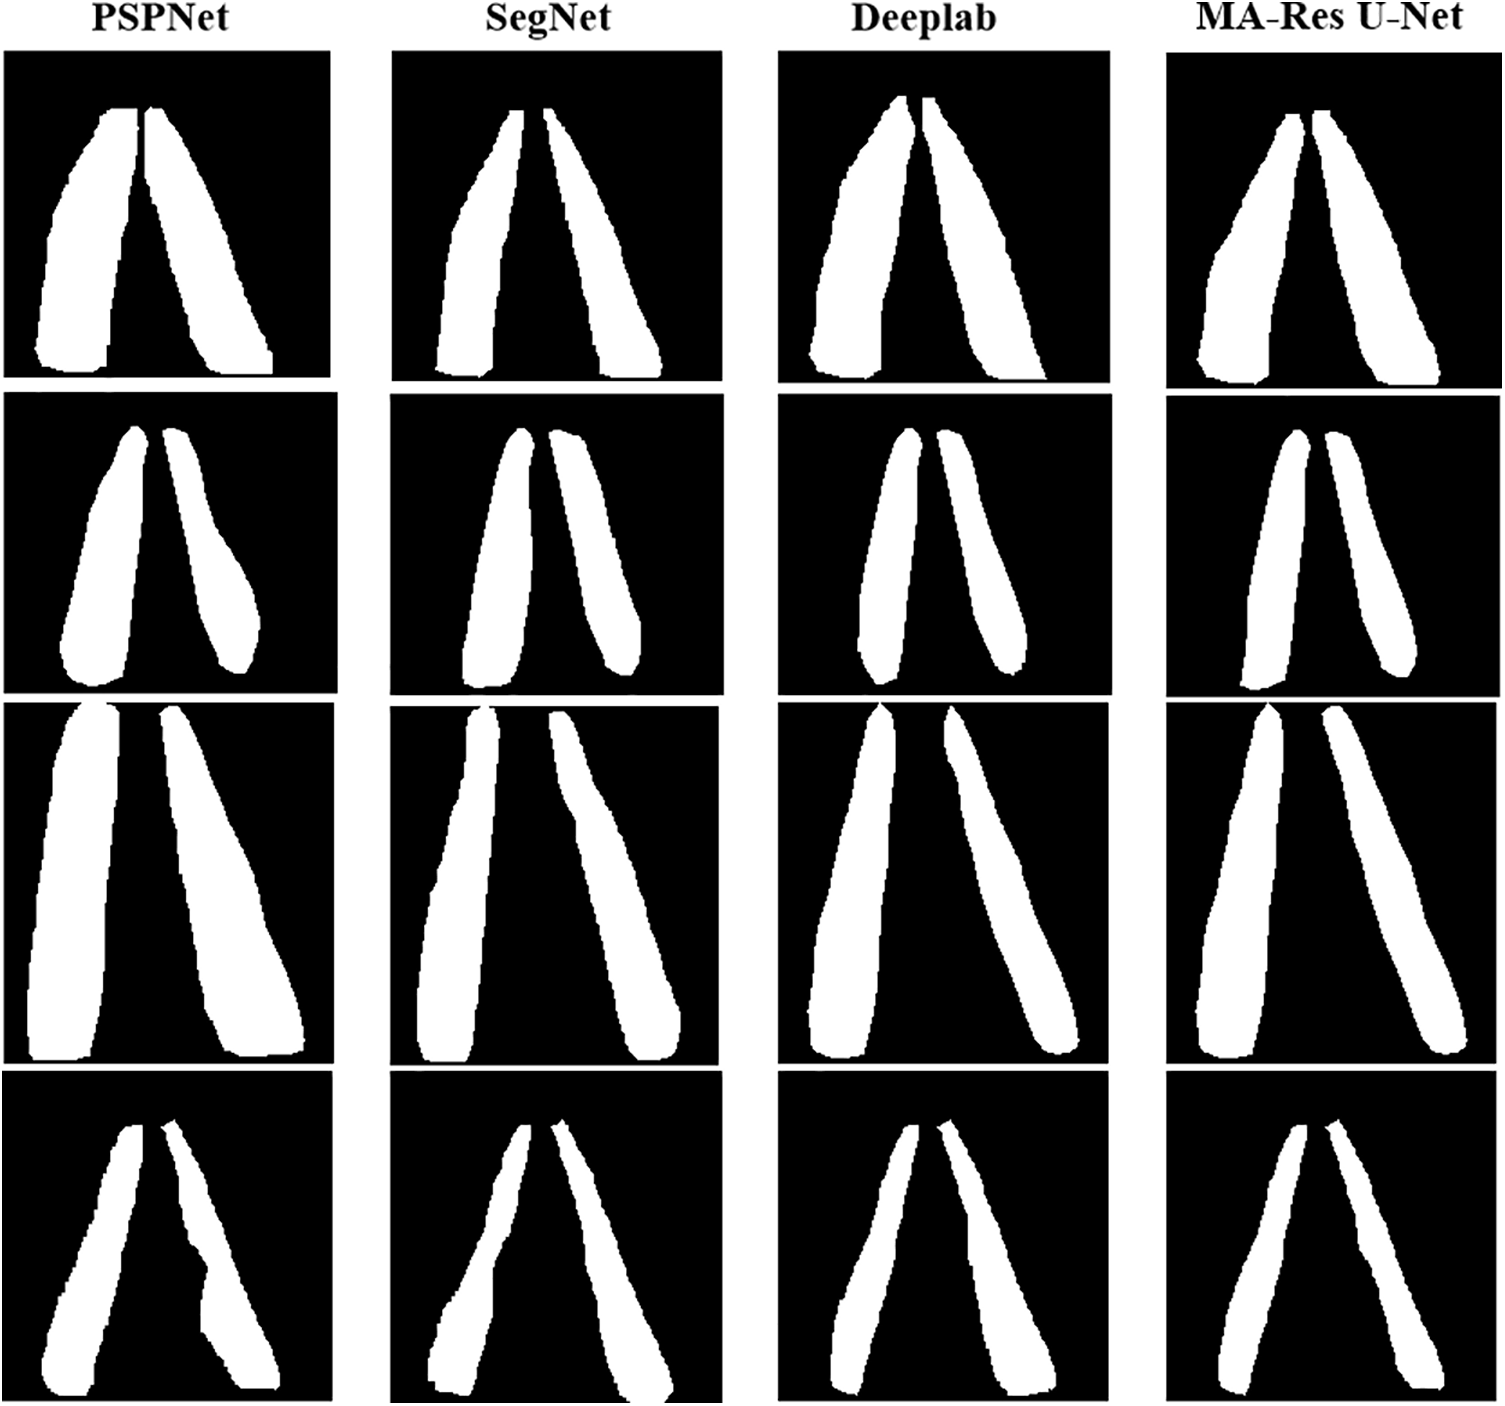
Figure 9: Results of different models
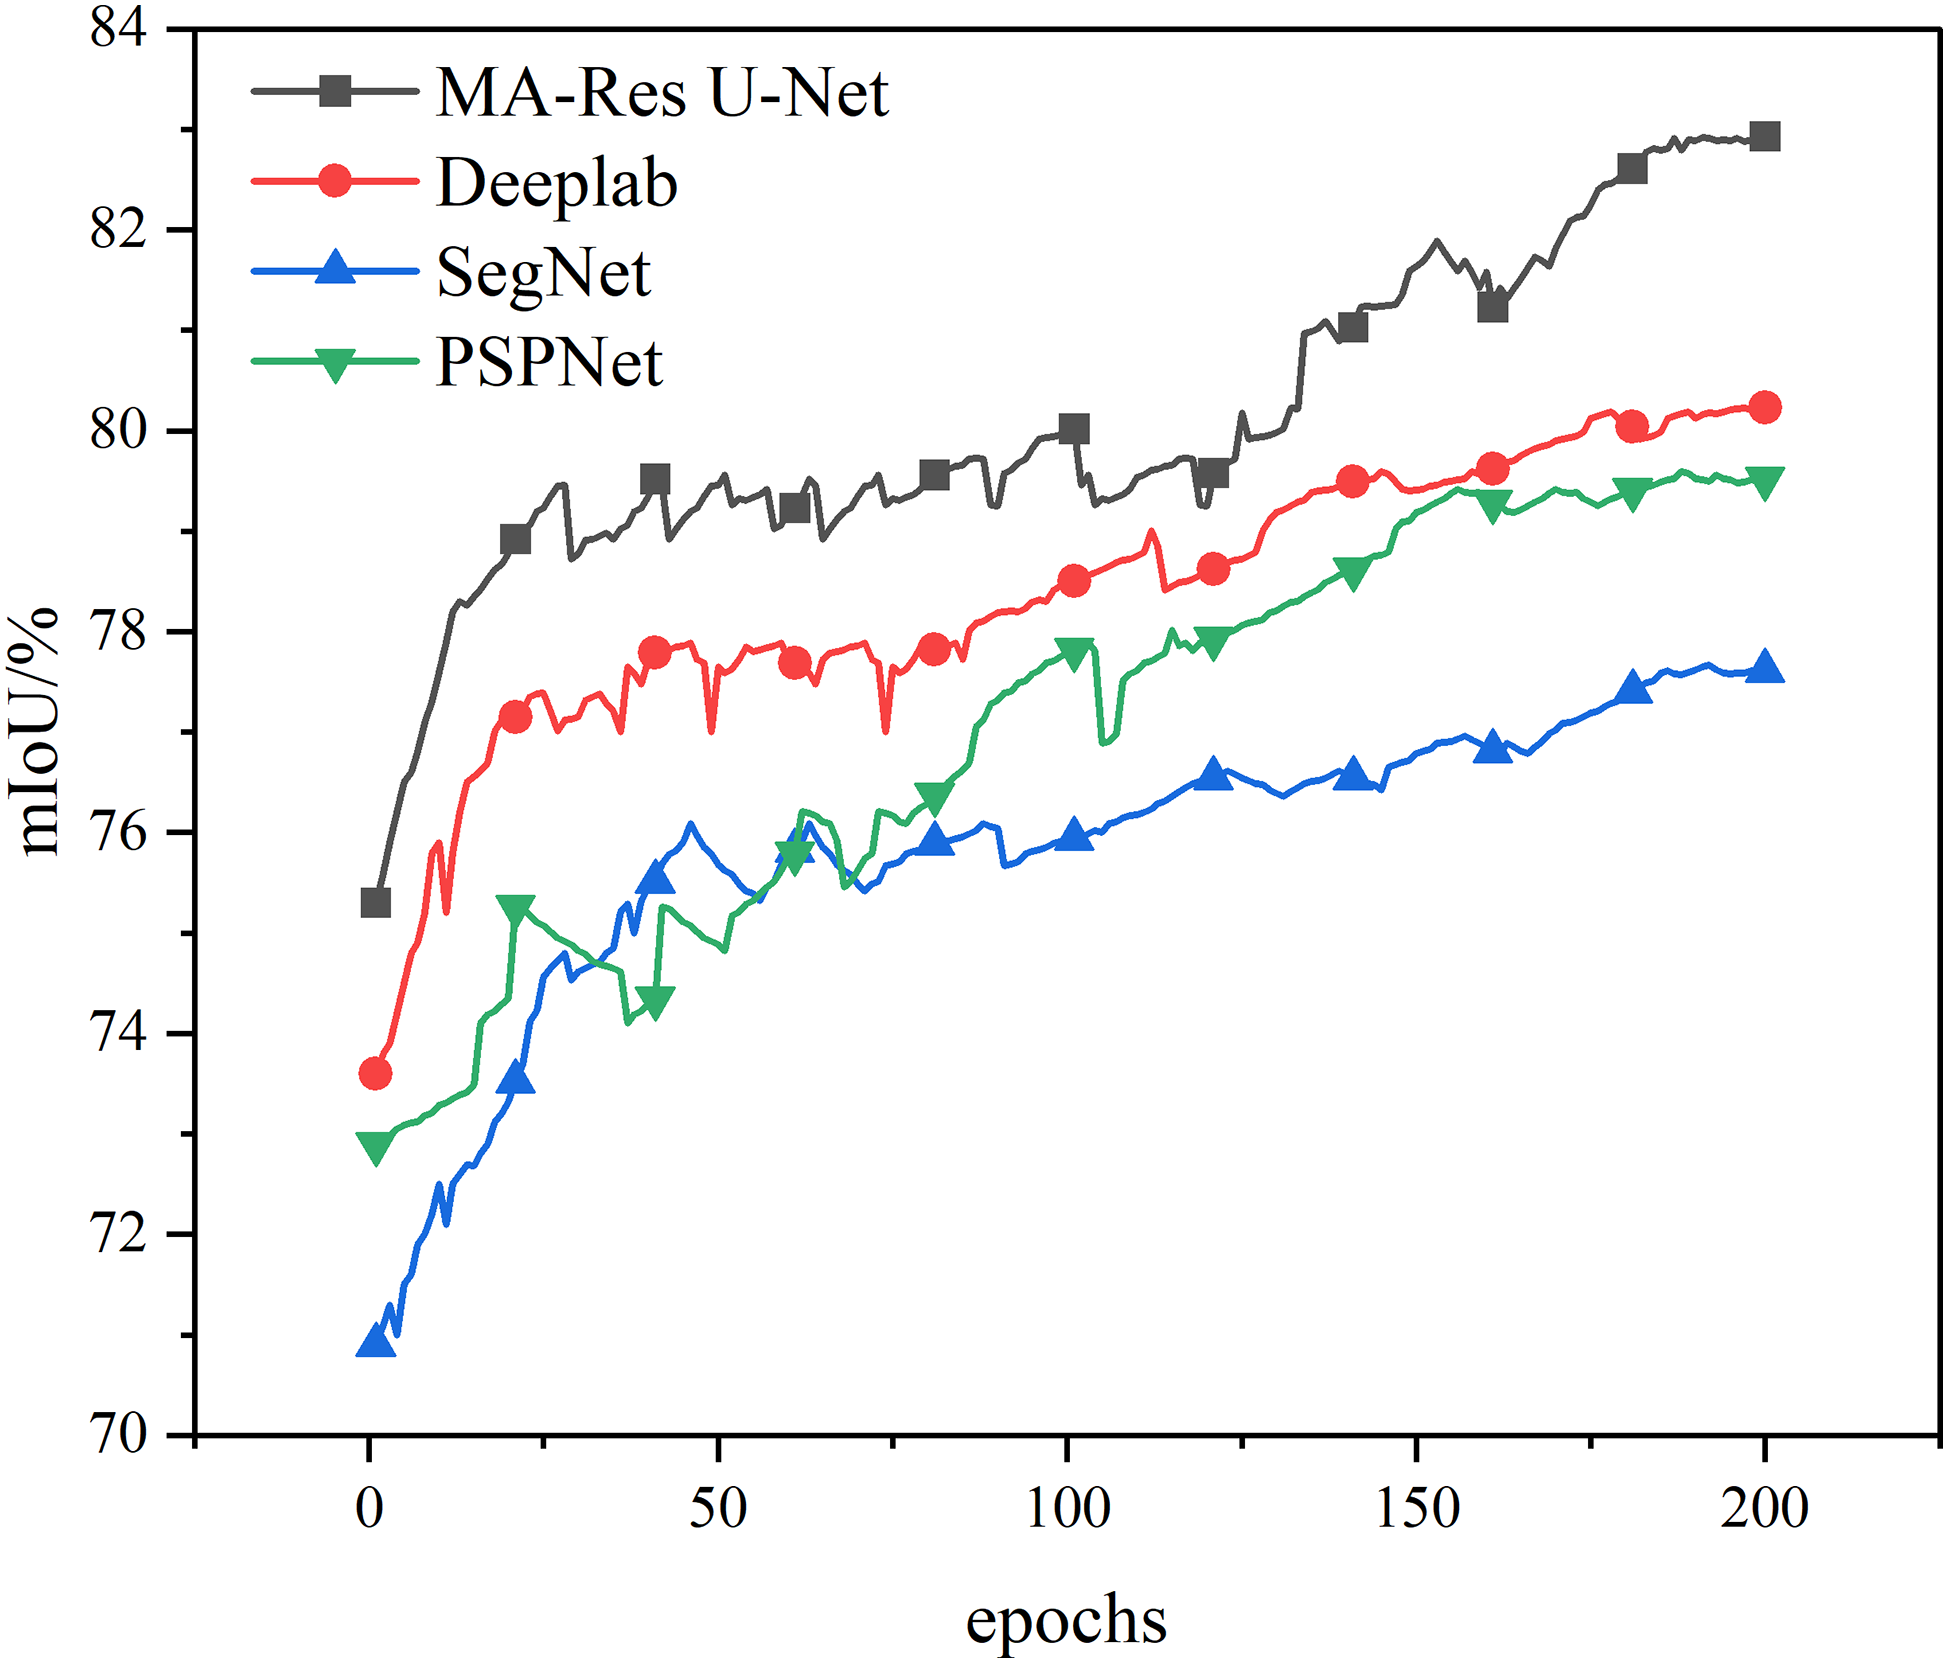
Figure 10: Changes of different models during mIoU training

Figure 11: Feature point extraction
For soybean navigation line extraction, the initial step involves the extraction of soybean seedling belt lines. In this process, we utilize the RANSAC algorithm to extract the soybean seedling belt lines [32,33]. Firstly, the feature points of the seedling belt are extracted. Secondly, the image is segmented into strip-shaped regions for further feature point extraction. Then, the Canny algorithm is applied to detect the edges of the soybean seedling belt. Finally, the CenterNet algorithm is used to identify centroid points, and these centroids are obtained after edge detection. After the edge detection of the soybean seedling belt, the contour vector size is calculated, and a threshold is set to filter out small noises in the image. Subsequently, the moments of the contour are computed to determine the centroid, which serves as the characteristic point of the soybean seedling belt. We selected several pictures from different angles in the data set, and Fig. 11 shows the extraction process of these feature points.
The RANSAC algorithm, through random sampling and consistency checking, can effectively remove outliers, resulting in more accurate seedling belt lines. In determining the seedling belt lines of soybeans, the parameters of the straight lines can be calculated based on the coordinates of the centroid points. Then, the RANSAC algorithm is applied to filter out the centroid points that best fit the seedling belt lines [34]. By selecting the most suitable centroid points as the initial sample set and fitting a straight line through these characteristic points, the lines can be represented by their slopes (k) and intercepts (b), i.e., y = kx + b. This ultimately yields the parameters of the seedling belt lines. The obtained seedling belt lines are depicted in Fig. 12.

Figure 12: Linear extraction of soybean seedlings
Based on the two seedling belt lines as references, the navigation line is calculated using the tangent principle between the angles of the two lines. Here, k represents the slope of the navigation line, while k1 and k2 are the slopes of the seedling belt lines [35].
Utilizing the tangent principle equation of the included angle, the soybean navigation line is derived. As depicted in Fig. 13, in different experimental scenarios and angles, navigation lines are obtained and used as guides for farming machines. Based on the extracted navigation line information, the cultivating machine can automatically adjust its heading and position, achieving precise cultivation operations. This approach enhances the efficiency and accuracy of the cultivation process [36].
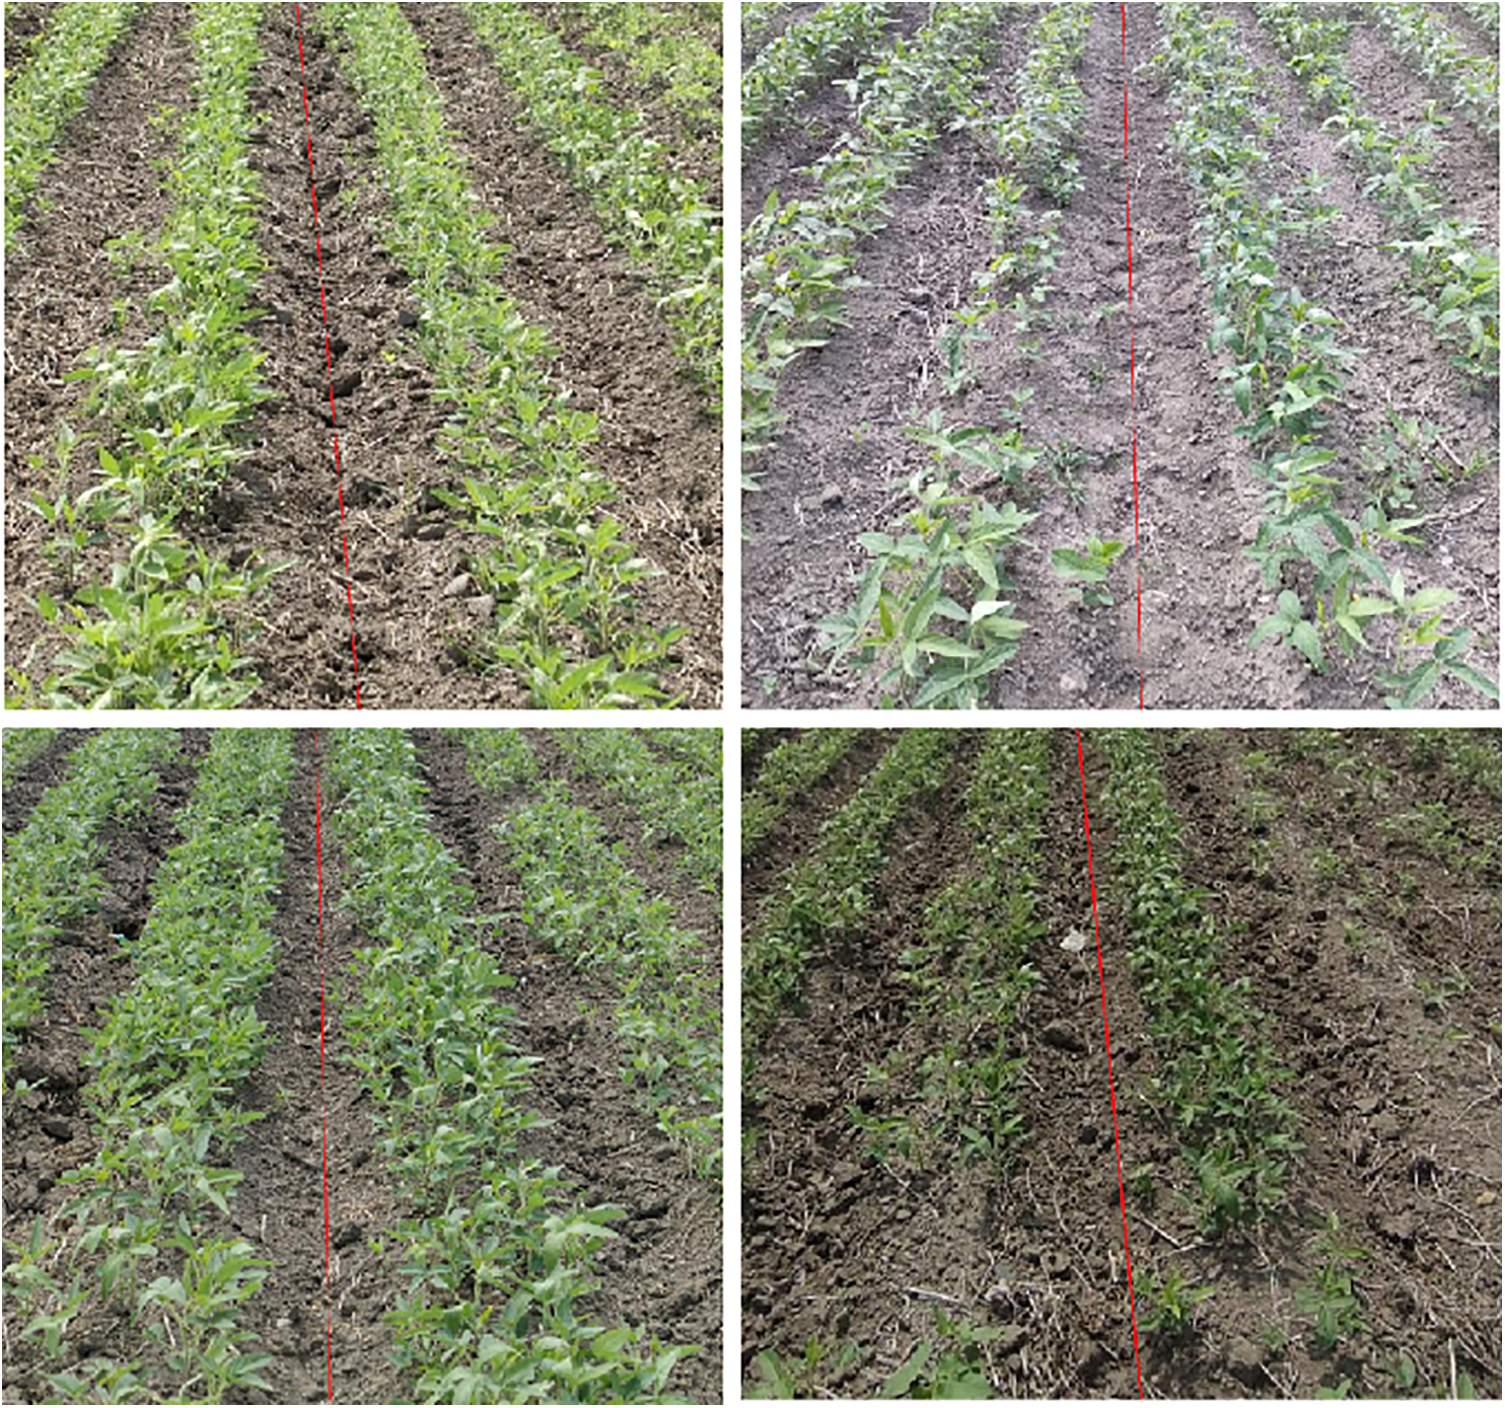
Figure 13: Navigation line extraction
Our primary focus is on conducting operations in soybean fields during the cultivation period. Based on the soybean cultivation practices in Northeast China, we have designed a hydraulic control system for tractors. This system facilitates row-following control by controlling the steering of the tractor’s front wheels. The soybean navigation line control system can be broadly divided into three components: image acquisition, navigation line extraction, and tractor steering control.
The steering system comprises an upper computer system, a single-chip microcomputer, a communication system, and a steering system. The upper computer processes the crop row image information captured by the vision sensor, while the communication system facilitates communication between the upper computer and the STM32F103RCT6 microcontroller. The microcontroller analyzes the navigation line angle information and controls the electromagnetic directional control valve accordingly. The microcontroller outputs signals through GPIO pins to control the relay, which further manipulates the electromagnetic directional control valve [37]. The tractor’s steering angle is obtained using an angle sensor, the ATK-IMU901. The experimental setup is depicted in Fig. 14. The navigation communication system’s program is written in MDK5, with a serial port baud rate set at 9600. Fig. 15 illustrates a communication simulation test.
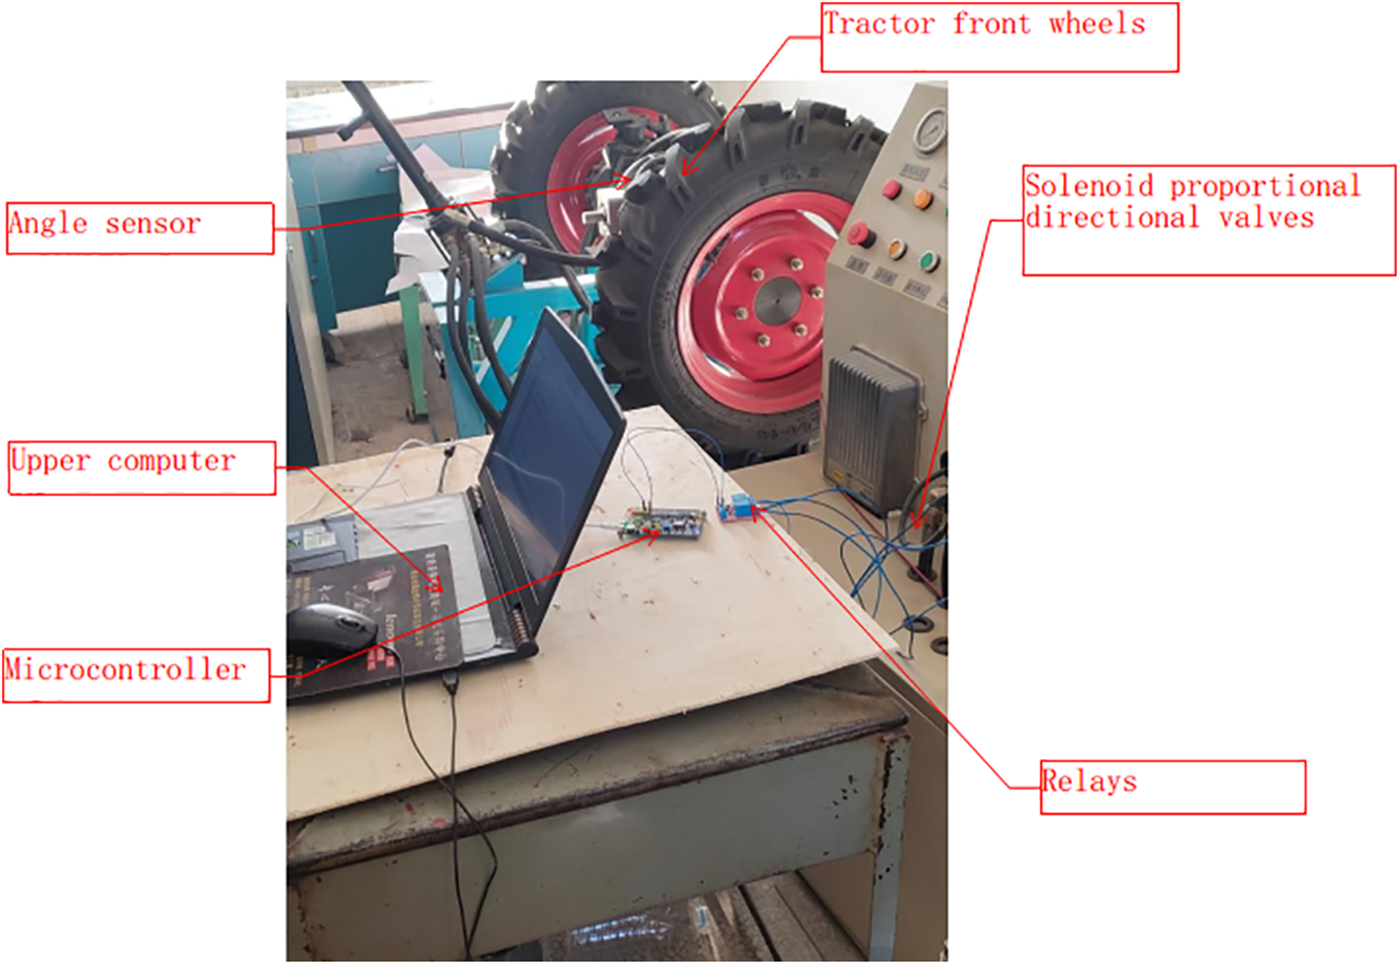
Figure 14: Test verification
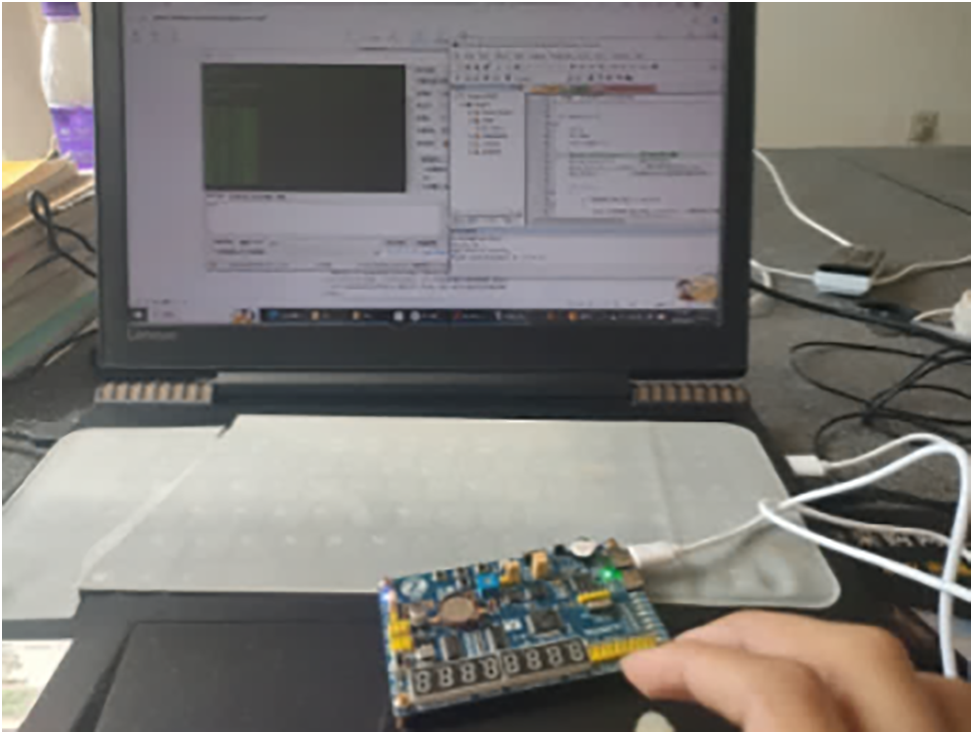
Figure 15: Communication verification
We have developed a tractor visual navigation system software using the QT development environment and the OpenCV image processing library. This software primarily achieves real-time detection of soybean navigation lines, acquires navigation line heading deviations and offsets, and enables communication between the upper computer and the STM32 microcontroller. It also incorporates the ability to switch between automatic and manual tractor steering. We carry out practical operations in different angles and scenarios, and the software interface is shown in Fig. 16.
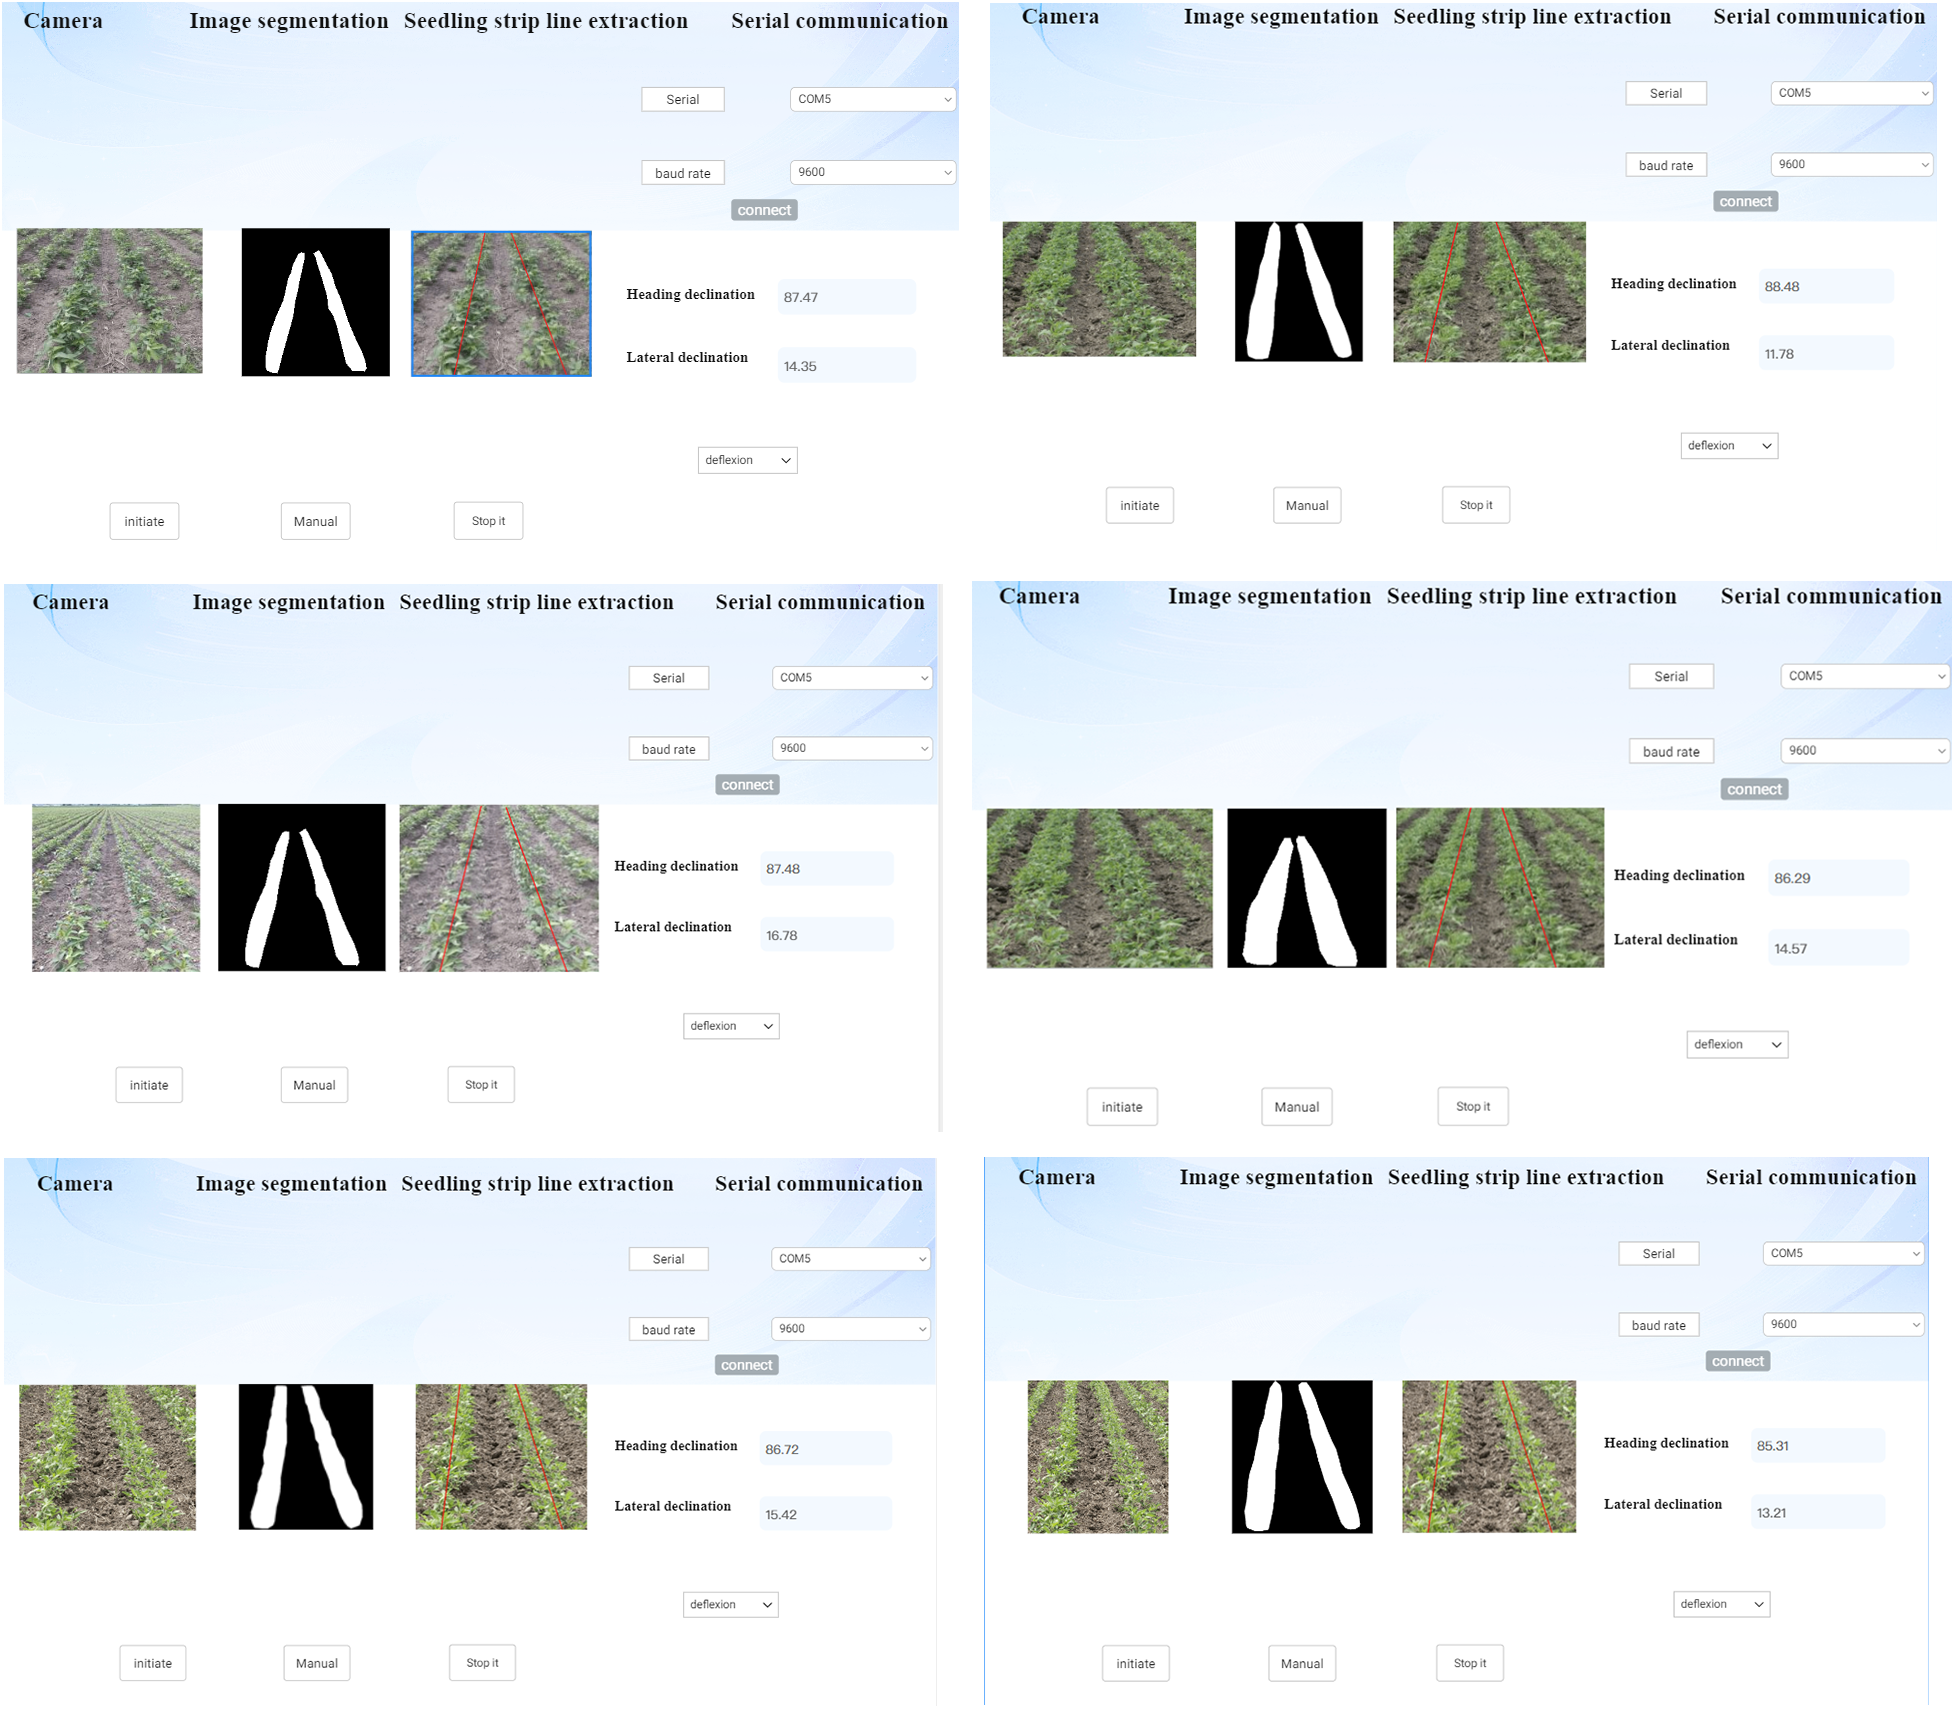
Figure 16: Software interface
Control execution errors are inevitable in tractor visual autonomous navigation, necessitating correction through the navigation system. Determining whether the navigation deviation angle and the actual tractor deviation angle meet the error requirements is crucial. Real-time data acquisition of the navigation line deviation angle is performed through software, and the actual tractor steering angle is tested. The experimental data is presented in Table 3.

As evident from Table 3, the error between the navigation line deviation angle and the actual deviation angle is within 3 degrees. Therefore, in the subsequent field test, the calculated navigation parameters will be used to represent the steering angle of the current tractor to achieve accurate path navigation.
This paper investigates and implements a soybean crop row navigation line system design based on an improved U-Net neural network. The enhancement involves replacing the backbone feature extraction network to optimize the extraction of soybean feature points. Additionally, an MHA mechanism is introduced to preserve crucial information throughout the entire processing pipeline and bridge the semantic gap between low-level and high-level features. The ASPP module is also incorporated to prevent information loss after convolution, enabling multi-scale feature extraction and enhancing the precision of model edge segmentation.
(1) The utilization of the enhanced U-Net neural network for soybean image segmentation achieves an accuracy of 92.1%, enabling effective extraction of navigation lines while mitigating the impacts of factors such as weeds and sunlight.
(2) Navigation line extraction is performed using neural network-based image segmentation, followed by the RANSAC algorithm, resulting in high-accuracy navigation lines.
(3) The upper computer transmits the image recognition results to the lower computer, which then conveys the angle information to the microcontroller via a communication system. The microcontroller promptly controls the electromagnetic valve to execute the corresponding actions.
This research employs deep learning and image algorithms to address soybean visual navigation challenges. By applying these technologies in the agricultural domain, we can enhance agricultural production efficiency and quality, while reducing reliance on manual labor. This holds significant importance for achieving sustainable agricultural development and fine-grained management.
Acknowledgement: None.
Funding Statement: Heilongjiang Bayi Agricultural University “Three Vertical” Plan Support Project (ZRCPY201805); 2023 Heilongjiang Province Key Research and Development Plan “Open the List” (2023ZXJ07B02).
Author Contributions: Qianshuo Liu: Writing—Original Draft, Validation, Formal Analysis, Software, Methodology. Jun Zhao: Methodology, Writing—Review & Editing, Funding Acquisition, Supervision, Resources. All authors reviewed the results and approved the final version of the manuscript.
Availability of Data and Materials: The data that support the findings of this study are available from the corresponding author upon reasonable request.
Ethics Approval: None.
Conflicts of Interest: The authors declare that they have no conflicts of interest to report regarding the present study.
References
1. Wan GZ, Sun Z, Xiao L, Zhou YM, Du FY. Herbicidal Polyketides and Diketopiperazine derivatives from Penicillium viridicatum. J Agric Food Chem. 2019;67(51):14102–9. doi:10.1021/acs.jafc.9b06116. [Google Scholar] [PubMed] [CrossRef]
2. Ulloa SM, Owen MDK. Response of Asiatic dayflower (Commelina communis) to Glyphosate and alternatives in Soybean. Weed Sci. 2009;57(1):74–80. doi:10.1614/WS-08-087.1. [Google Scholar] [CrossRef]
3. Skiba D, Sawicka B, Pszczółkowski P, Barbaś P, Krochmal-Marczak B. The impact of cultivation management and weed control systems of very early potato on weed infestation, biodiversity, and health safety of tubers. Life. 2021;11(8):826. doi:10.3390/life11080826. [Google Scholar] [PubMed] [CrossRef]
4. Otto S, Masin R, Casari G, Zanin G. Weed–corn competition parameters in late-winter sowing in Northern Italy. Weed Sci. 2009;57(2):194–201. doi:10.1614/WS-08-133.1. [Google Scholar] [CrossRef]
5. Samson-Brais E, Lucotte M, Moingt M, Tremblay G, Paquet S. Impact of weed mana gement practices on soil biological activity in corn and soybean field crops in Quebec (Canada). Canadian J Soil Sci. 2021;101(1):12–21. doi:10.1139/cjss-2020-0023. [Google Scholar] [CrossRef]
6. Huang L, Li S, Tan Y, Wang S. Research on farmland route navigation based on an improved convolutional neural network algorithm. J Chin Agric Mech. 2022;43(4):146–52 (In Chinese). doi:10.13733/j.jcam.issn.20955553.2022.04.021. [Google Scholar] [CrossRef]
7. Peng S, Chen B, Li J, Fan P, Liu X, Fang X, et al. Detection of the navigation line between lines in orchard using improved YOLOv7. Trans Chin Soc Agric Eng (Trans CSAE). 2023;39(16):131–8 (In Chinese). doi:10.11975/j.issn.1002-6819.202305207. [Google Scholar] [CrossRef]
8. Han Z, J. Li, Yuan Y, Fang X, Zhao B, Zhu L. Path recognition of orchard visual navigation based on U-Net. Trans Chin Soc Agric Mach. 2021;52(1):30–9. doi:10.6041/j.issn.1000-1298.2021.01.004. [Google Scholar] [CrossRef]
9. Yang R, Zhai Y, Zhang J, Zhang H, Tian G, Zhang J, et al. Potato visual navigation line detection based on deep learning and feature midpoint adaptation. Agriculture. 2022;12(9):1363–3. doi:10.3390/agriculture12091363. [Google Scholar] [CrossRef]
10. Gao S, Wang S, Pan W, Wang M, Song G. Based on Haar-like feature and improved YOLOv4 navigation line detection algorithm in complex environment. Int J Comput Commun Control. 2022;17(6). doi:10.15837/ijccc.2022.6.4910. [Google Scholar] [CrossRef]
11. Gong H, Wang X, Zhuang W. Research on real-time detection of maize seedling navigation line based on improved YOLOv5s lightweighting technology. Agriculture. 2024;14(1):124. doi:10.3390/agriculture14010124. [Google Scholar] [CrossRef]
12. Cheng G, Jin C, Chen M. DeeplabV3+-based navigation line extraction for the sunlight robust combine harvester. Sci Prog. 2024;107(1):368504231218607. doi:10.1177/00368504231218607. [Google Scholar] [PubMed] [CrossRef]
13. Gong H, Zhuang W. An improved method for extracting inter-row navigation lines in nighttime maize crops using YOLOv7-tiny. IEEE Access. 2024;12:27444–55. doi:10.1109/ACCESS.2024.3365555. [Google Scholar] [CrossRef]
14. Cao M, Tang F, Ji P, Ma F. Improved real-time semantic segmentation network model for crop vision navigation line detection. Front Plant Sci. 2022;1:13898131. doi:10.3389/fpls.2022.898131. [Google Scholar] [PubMed] [CrossRef]
15. Liang X, Chen B, Wei C, Zhang X. Inter-row navigation line detection for cotton with broken rows. Plant Methods. 2022;18(1):90. doi:10.1186/s13007-022-00913-y. [Google Scholar] [PubMed] [CrossRef]
16. Sun Y, Li X, Zhang X. HRT-YOLO: a transformer-based high-resolution representation model for face flaw detection. J Phys: Conf Series. 2022;2258(1):12032. [Google Scholar]
17. Xu Q, Lin R, Yue H, Huang H, Yang Y, Yao Z. Research on small target detection in driving scenarios based on improved yolo network. IEEE Access. 2020;8:27574–83. doi:10.1109/Access.6287639. [Google Scholar] [CrossRef]
18. Karshiev S, Olimov B, Jaeil K, Jaesoo K, Anand P, Jeonghong K. Improved U-Net: fully convolutional network model for skin-lesion segmentation. Appl Sci. 2020;10(10):3658. doi:10.3390/app10103658. [Google Scholar] [CrossRef]
19. Zhang Y, Chen J, Ma X, Wang G, Bhatti U, Huang M. Interactive medical image annotation using improved Attention U-net with compound geodesic distance. Expert Syst Appl. 2024;237:121282. doi:10.1016/j.eswa.2023.121282. [Google Scholar] [CrossRef]
20. Catherine G, Nicolas M. Using agro-ecological zones to improve the representation of a multi-environment trial of soybean varieties. Front Plant Sci. 2024;15:1310461. doi:10.3389/fpls.2024.1310461. [Google Scholar] [PubMed] [CrossRef]
21. Ronneberger O, Fischer P, Brox T. U-Net: convolutional networks for biomedical image segmentation. In: Medical Image Computing and Computer-Assisted Intervention—MICCAI 2015, 2015; Munich, Germany; p. 234–41. [Google Scholar]
22. Chen T, Zheng S, Lin Y. Semantic segmentation of remote sensing images based on improved deep neural network. Comput Simul. 2021;38(12):27–32. [Google Scholar]
23. Wang Z, Xie X, Wang X, Zhao Y, Ma L, Yu P. A robot foreign object inspection algorithm for transmission line based on improved YOLOv5. In: International Conference on Machine Learning for Cyber Security, 2023; Cham: Springer. doi:10.1007/978-3-031-20102-8_11. [Google Scholar] [CrossRef]
24. Song Y, Zou Y, Li Y, He Y, Wu W, Niu R, et al. Enhancing landslide detection with SBConv-optimized U-Net architecture based on multisource remote sensing data. Land. 2024;13(6):835–5. doi:10.3390/land13060835. [Google Scholar] [CrossRef]
25. Lee DH. Efficient perception, planning, and control algorithm for vision-based automated vehicles. Appl Intell. 2024;2024(54):8278–95. [Google Scholar]
26. Ghaznavi A, Saberioon M, Brom J, Itzerott S. Comparative performance analysis of simple U-Net, residual attention U-Net, and VGG16-U-Net for inventory inland water bodies. Appl Comput Geosci. 2024;21:100150. doi:10.1016/j.acags.2023.100150. [Google Scholar] [CrossRef]
27. Chen Z, Niu R, Wang J, Zhu H, Yu B. Navigation line extraction method for ramie combine harvester based on U-Net. In: 2021 6th Asia-Pacific Conference on Intelligent Robot Systems (ACIRS), 2021; Tokyo, Japan. doi:10.1109/ACIRS52449.2021.9519315. [Google Scholar] [CrossRef]
28. Ji S, Zhang Y, Gong J. Corn row navigation line extraction method based on the adaptive edge detection algorithm. Int J Eng Res Afr. 2023;64:133–46. doi:10.4028/www.scientific.net/JERA. [Google Scholar] [CrossRef]
29. Adhikari P, Kim G, Kim H. Deep neural network-based system for autonomous navigation in paddy field. IEEE Access. 2020;8:71272–8. doi:10.1109/Access.6287639. [Google Scholar] [CrossRef]
30. Hong Q, Zhu Y, Liu W, Ren T, Shi C, Lu Z, et al. A segmentation network for farmland ridge based on encoder-decoder architecture in combined with strip pooling module and ASPP. Front Plant Sci. 2024;15:1328075. doi:10.3389/fpls.2024.1328075. [Google Scholar] [PubMed] [CrossRef]
31. Garcia A, Orts-Escolano S, Oprea S, Villena-Martinez V, Garcia-Rodriguez J. A review on deep learning techniques applied to semantic segmentation. arxiv Preprint arxiv:1704.06857. 2017. [Google Scholar]
32. Liu R, Francisco Y, George K. LiDAR-based crop row detection algorithm for over-canopy autonomous navigation in agriculture fields. arxiv Preprint arxiv:2403:17774. 2024. [Google Scholar]
33. Zhang B, Wang Y, Yao W, Sun G. HTSR-VIO: real-time line-based visual-inertial odometry with point-line hybrid tracking and structural regularity. IEEE Sens J. 2024;24(7):11024–35. doi:10.1109/JSEN.2024.3369095. [Google Scholar] [CrossRef]
34. Masood V, Maryam S, Saied P, Armin M. Automated two-step seamline detection for generating large-scale orthophoto mosaics from drone images. Remote Sens. 2024;16(5):903. doi:10.3390/rs16050903. [Google Scholar] [CrossRef]
35. Zhang S, Wang H, Wang C, Wang Y, Wang S, Yang Z. An improved RANSAC-ICP method for registration of SLAM and UAV-LiDAR point cloud at plot scale. Forests. 2024;15(6):893–3. doi:10.3390/f15060893. [Google Scholar] [CrossRef]
36. Flanigen P, Atkins E, Sarter N. Modular approach for online vertical obstacle detection. J Aerosp Inf Syst. 2024;21:1–19. doi:10.2514/1.I011244. [Google Scholar] [CrossRef]
37. Wang Q, Chen J, He Z, Han F, Liu J. An infrared obstacle avoidance car based on STM32. Acad J Sci Technol. 2024;10(1):146–8. doi:10.54097/vg434579. [Google Scholar] [CrossRef]
Cite This Article
 Copyright © 2024 The Author(s). Published by Tech Science Press.
This work is licensed under a Creative Commons Attribution 4.0 International License , which permits unrestricted use, distribution, and reproduction in any medium, provided the original work is properly cited.


 Submit a Paper
 Propose a Special lssue
 View Full Text
 Download PDF
 Downloads
 Citation Tools