
 Submit a Paper
 Propose a Special lssue
 Open Access
ARTICLE

Comparative Non Participating Transcriptome Analysis Response to Low Phosphorus by CmPht1;2 in Chrysanthemum
1
State Key Laboratory of Crop Genetics and Germplasm Enhancement, College of Horticulture, Nanjing Agricultural University,
Key Laboratory of Flower Biology and Germplasm Innovation, Ministry of Agriculture and Rural Affairs, Key Laboratory of Biology
of Ornamental Plants in East China, National Forestry and Grassland Administration, Nanjing, 210095, China
2
Nanjing Institute of Agricultural Sciences, Jiangsu Academy of Agricultural Sciences, Nanjing, 210046, China
* Corresponding Author: Sumei Chen. Email:
(This article belongs to the Special Issue: Identification of Genetic/Epigenetic Components Responding to Biotic and Abiotic Stresses in Crops)
Phyton-International Journal of Experimental Botany 2023, 92(5), 1391-1404. https://doi.org/10.32604/phyton.2023.027231
Received 20 October 2022; Accepted 28 November 2022; Issue published 09 March 2023
 View Full Text
 Download PDF
Abstract
Chrysanthemum morifolium Ramat is one of the four major cut flowers in the world. Pht1 family is focus on the uptake and transport of phosphate in plants. In our previous studies, CmPht1;2 overexpression line (Oe1) had higher phosphate contents both in roots and shoots, and its root development was significantly enhanced than wild type (WT) at low phosphorus conditions in chrysanthemum. Metabolomics analysis showed that several metabolites had a change in pyruvate metabolism and tricarboxylic acid (TCA) cycle pathway. To explore the gene difference expression and the change of metabolic pathway between CmPht1;2-Oe1 and WT, we conducted the transcriptome analysis. A total of 617,681 and 207,271 unigenes were obtained from roots and shoots, respectively. They were classified into biological process, cellular component and molecular function by Gene Ontology (GO). In addition, 450 different expression genes (DEGs) were found in the roots after 2 d treatment, and 1,787 DEGs were identified in shoots after 7 d treatment under LP condition between Oe1 and WT. From the top 20 pathways of DEGs assigned by Kyoto Encyclopedia of Genes and Genomes (KEGG), TCA cycle and pyruvate metabolism pathways mostly affected by overexpression of CmPht1;2 attracted our attention. This research will be helpful for elucidating the mechanism of effects by CmPht1;2 overexpression on growth, development and stress tolerance.Keywords
Supplementary Material
Supplementary Material FilePhosphorus (P) is one of the 17 essential nutrients needed for plant growth which is involved in the entire life of plants [1]. Phosphorus efficient utilization plants can use more soil contact area to obtain phosphate (Pi) by producing a larger root system [2]. Some of them will release a variety of organic acids such as citric acid, malic acid and other organic anions, or phosphatase and phytase to increase the solubility of phosphorus [3]. To overcome low Pi availability, plants also evolved some complex mechanisms to maintain P homeostasis as remobilization of internal Pi within the plant [4].
PHOSPHATE TRANSPORTER1 (Pht1) family are plasma membrane proteins that play a pivotal role on the uptake of inorganic phosphate (Pi) from soil [5]. These family members were originally obtained by homologous cloning from the yeast PHO84 [6]. Most Arabidopsis PHT1 transporters are expressed in roots and induced by low phosphorus, consistent with their primary function of phosphorus uptake from the rhizome [7]. Pht1;1 or Pht1;4 played a significant role on the uptake of Pi both under Pi-sufficient and deficient soil in Arabidopsis [8]. Most of the OsPTs were induced by Pi-deprivation in rice roots. OsPT1;3 acts as an uptake and translocation protein in rice under low Pi conditions [9]. However, overexpression of OsPT8 in rice under high phosphorus environment resulted in excessive accumulation of phosphorus and phosphorus toxicity symptoms [10]. Here in our previous researches, CmPT1 [11] and CmPht1;2 [12] were all involved in Pi uptake in chrysanthemum and up-regulated in the P-starvation roots. However, it is not clear the transcriptional regulatory network of phosphate absorption and low phosphorus adaptation by CmPht1;2 in chrysanthemum.
Transcriptomic sequences were widely applied to functional genomics research in the non-model plant [13]. Transcriptome response to phosphorus starvation had already been analyzed in kinds of plants. Affymetrix Gene-Chip rice genome arrays were used to analyze the dynamics of rice transcriptome under P starvation [14]. Low P-tolerant line and the low P-sensitive line were used to generate strand-specific RNA libraries subjected to P stress in the roots and shoots of maize, respectively [15]. Transcriptome datasets were acquired from roots and leaves of the low-phosphorus tolerant soybean variety both under phosphorus-deficient and -sufficient conditions for further analysis [16]. Nevertheless, there were few reports about the transcription reprogramming after Pht1 overexpression. How phosphate transporters regulate gene expression and metabolic changes after transformation is still unclear.
Chrysanthemums (Chrysanthemum morifolium Ramat.) is an important plant due to its ornamental, edible and medicinal value in the world’s flower industry. CmPht1;2 is involved in phosphorus starvation response and impacted the metabolism of chrysanthemum in our previous studies [12]. CmPht1;2-Oe1 showed a higher Pi content both in roots and shoots, and a higher root biomass compared to WT in the Pi-starvation conditions. Moreover, Oe1 may enhance glycolysis metabolic (pyruvate metabolism), TCA and other metabolic pathways in response to P starvation stress. However, the reason of metabolic changes still needs further study. Whether there were corresponding changes at transcriptional level? How did CmPht1;2 overexpression cause these series of changes? To date, the molecular mechanisms of Pht1 transgene plants response to low phosphorus stress at the transcriptional level were rarely reported, especially in chrysanthemum. We describe here the transcriptome study of CmPht1;2 overexpression line responses to phosphorus limitation in chrysanthemum, rather than investigating immediate responses to P availability of chrysanthemum. The effects of response to low phosphorus stress by CmPht1;2 overexpression were discussed from the level of gene expression and metabolic pathways in chrysanthemum.
2.1 Plant Material and Growing Conditions
The wild type chrysanthemum cultivar ‘Jinba’ was obtained from the Chrysanthemum Germplasm Resource Preserving Centre, Nanjing Agricultural University, China. The CmPht1;2 overexpression line-Oe1 was generated by our group [12]. The cuttings of chrysanthemum cultivated in a greenhouse at 25°C, a 16-h photoperiod with an irradiance of 2000 Lux, and a relative humidity of 70%. The rooting process was cultured in deionized water for 14 days. They were then transferred to hydroponic solutions consisting of diluted Hoagland solutions (1:4) and (1:2) for 3 d [17]. The nutrient solution renewal was carried out every 3 d. After a week of curing in total nutrient solution, the plants were respectively treated in normal phosphate concentration (HP, 300 μM Pi) or low phosphate concentration (LP, 15 μM Pi) hydroponic solution for phosphorus sufficient and deficiency treatment, respectively. The roots and shoots were harvested at 0, 2, and 7 d after the phosphate treatment, snap-frozen in liquid nitrogen, and kept at −80°C. The shoots selected here were the aboveground part including shoots and leaves. Experiments included three replicates. Each replicate contained nine seedlings.
2.2 Isolation of Total RNA and RT-PCR
The total RNA from the above samples was extracted using Quick RNA isolation Kit (Huayueyang Biotech Co., Ltd., Beijing, China) according to the manufacturer’s instructions. First strain cDNA was carried out by SPARKscript II RT Kit (With gDNA Eraser) (Shandong Sparkjade Biotechnology Co., Ltd., China). 500 ng·μL−1 RNA was used for cDNA synthesis.
After the RNA samples were qualified, eukaryotic mRNAs were enriched with Oligo(dT) magnetic beads. Then, mRNA was fragmented into short fragments by adding fragmentation buffer. The mRNA was used as template and 6 base random primer was used as random hexamers to synthesize first strand cDNA. Then buffer, dNTPs, DNA polymerase I and RNase H were added to synthesize two strands cDNA. Then last PCR amplification was performed after cDNA modification. AMPure XP beads were used to purify double strand cDNA to obtain the final product Library. After library construction, Qubit2.0 was first used for preliminary quantification, and the library was diluted to 1.5 ng·uL−1. Agilent 2100 was then used to detect the insert size of the library. The qPCR method was used after the insert size met the expectation. The effective concentration of the library was accurately quantified (Library effective concentration >2 nM) to ensure the quality of the library. The standard Illumina protocol was followed thereafter to develop mRNA-seq libraries. Subsequently, the library preparations were sequenced on an Illumina HiSeq2000 platform at Beijing Novogene Bioinformatics Technology Corporation and paired-end reads were generated. The screening criteria for the differential genes were: padj <0.05.
2.4 Differential Gene Expression Verification
The verification of differential expression genes was performed using SYBR Green I Real Time PCR. 2 × SYBR qPCR Mix (5.0 μL, Shandong Sparkjade Biotechnology Co., Ltd., China), forward/reverse primer (10 μM, 0.5 μL each), cDNA template (1.0 μL) and ddH2O (3.0 μL) were added into a 384-well plate. The reference sequence, a 151 bp fragment of EF-1α, which amplified with the primers EF1α-F/-R and the specific primers of c137909_g1 and c183919_g1 were shown in Supplementary Table S1. The experiment was performed on ROCHE (LightCycler® 480 II, Switzerland) real time fluorescence quantitative PCR instrument with 94°C 2 min; 94°C 20 s, 55°C 20 s, 72°C 30 s, 40 cycles. Finally, add the dissociation curve stage. Relative transcription levels were estimated using the 2−ΔΔCt method [18].
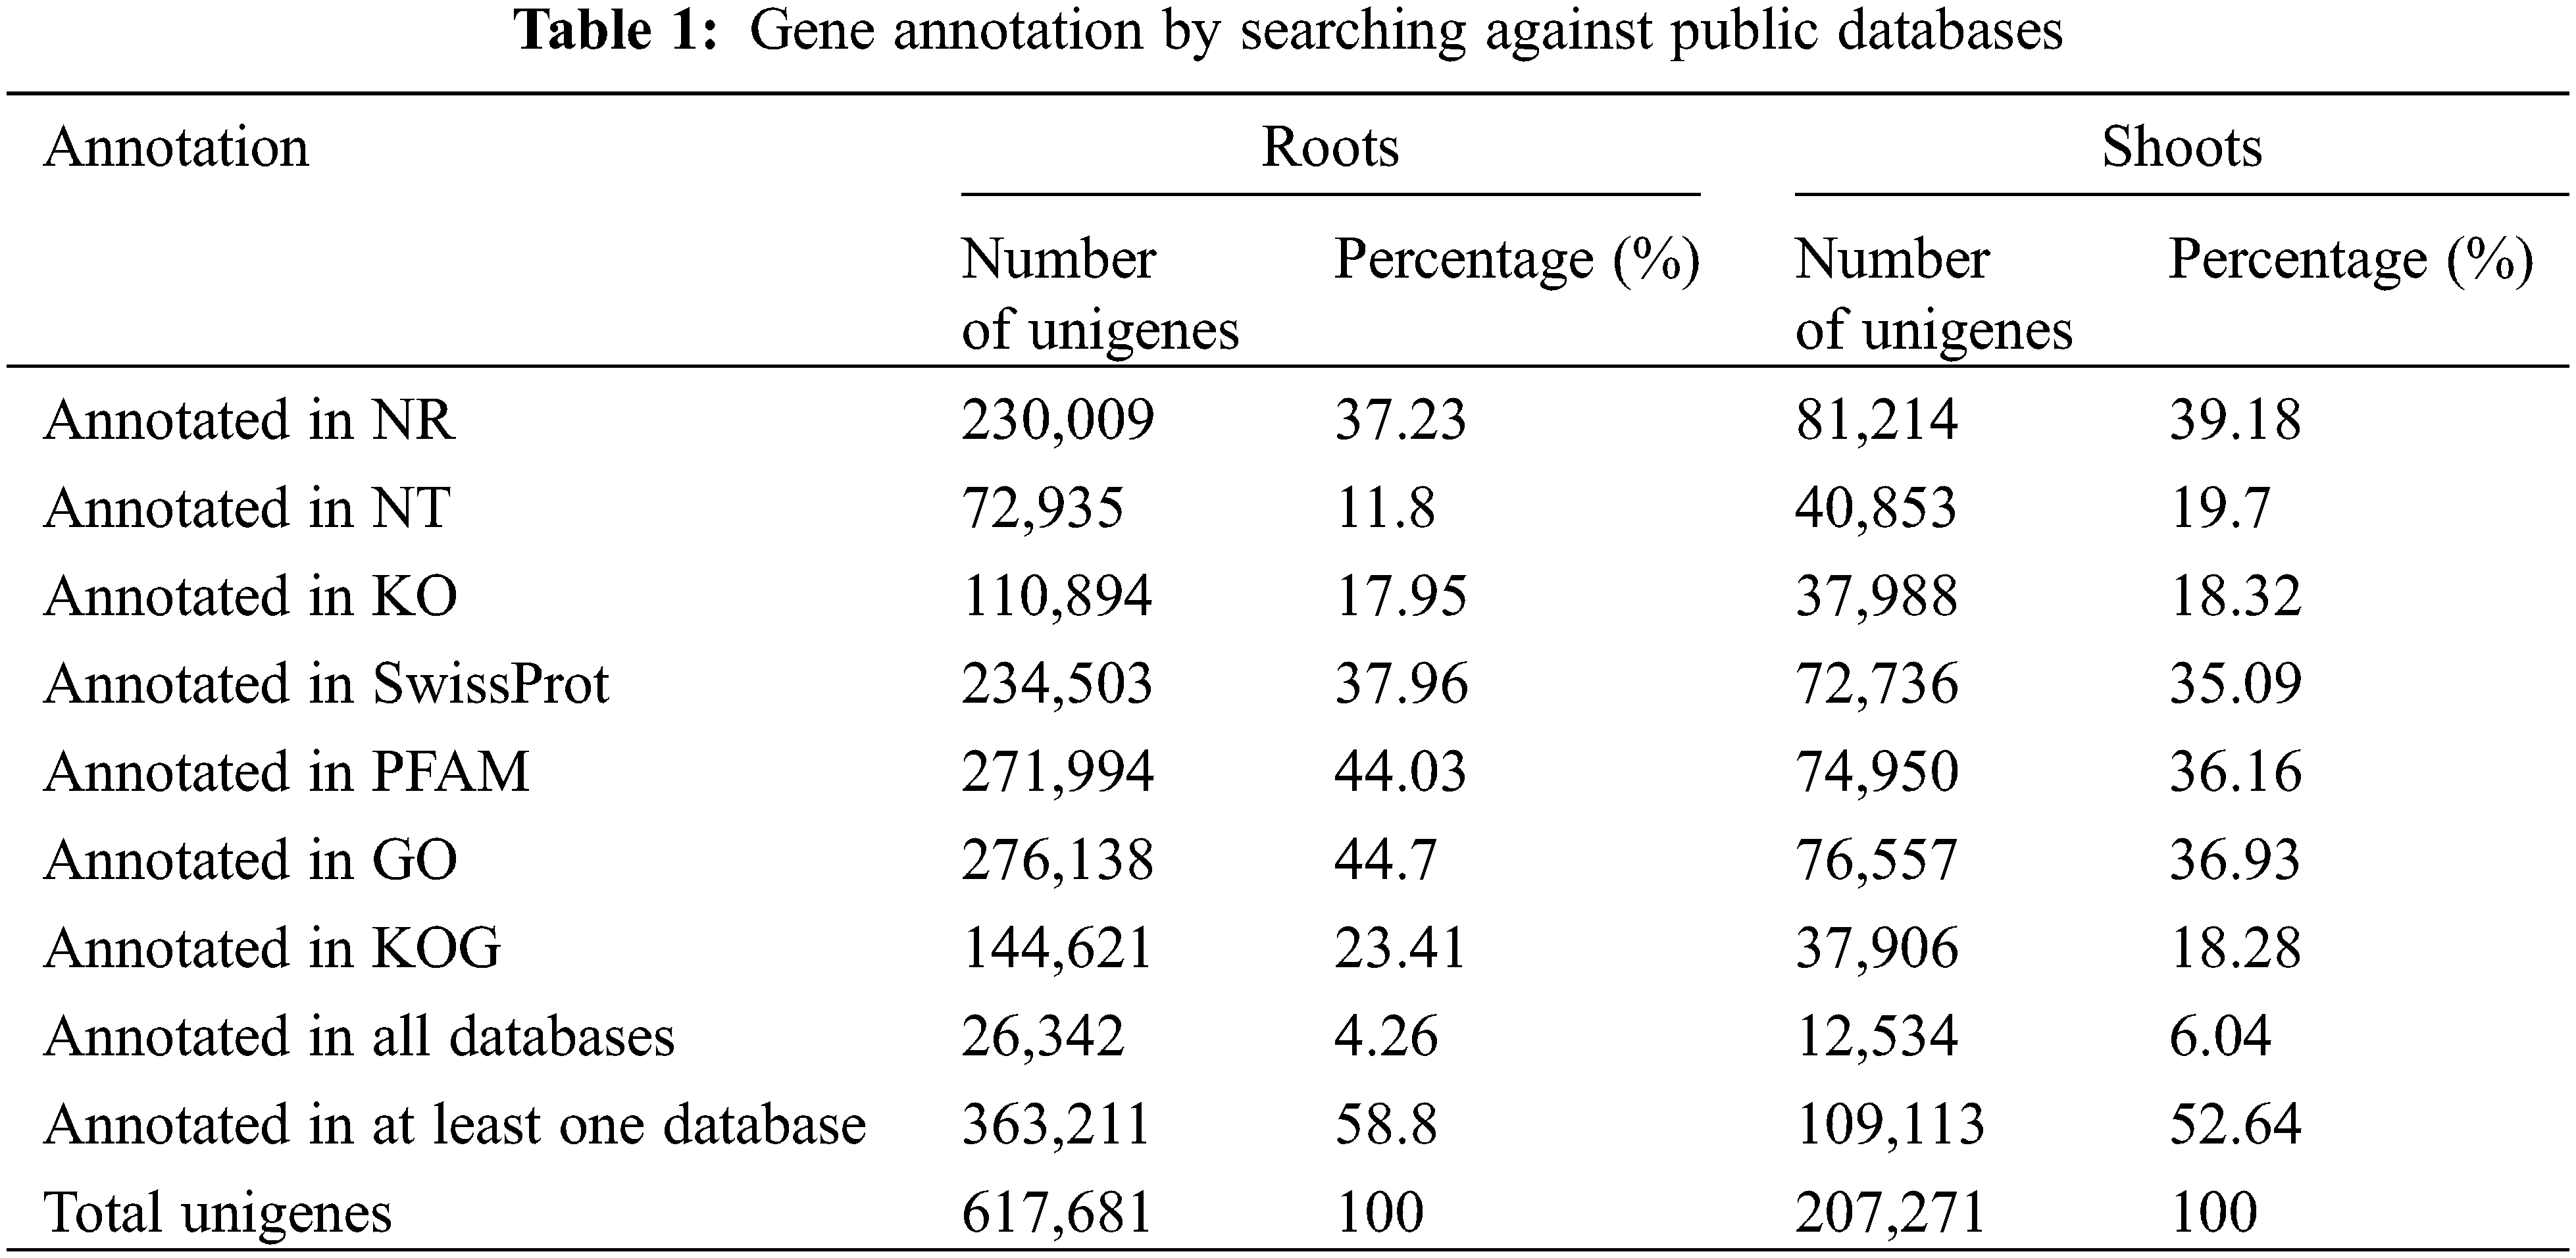
The genome-wide research was investigated in the roots and shoots of Oe1 and WT under LP treatment for 0, 2, and 7 d. The reads from roots or shoots were pooled together for more comprehensive reconstruction of transcripts. In roots, 617,681 unigenes was compared and annotated in seven functional databases: 230,009 (NCBI non-redundant protein sequences (NR): 37.23%), 72,935 (NCBI nucleotide sequences (NT): 11.80%), 110,894 (euKaryotic Ortholog (KO): 17.95%), 234,503 (A manually annotated and reviewed protein sequence database (SwissProt): 37.96%), 271,994 (Protein family (PFAM): 44.03%), 276,138 (GO: 44.70%) and 144,621 (euKaryotic Ortholog Groups (KOG): 23.41%). In shoots, 207,271 unigenes were compared and annotated: 81,214 (NR: 39.18%), 40,853 (NT: 19.70%), 37,988 (KO: 18.32%), 72,736 (SwissProt: 35.09%), 74,950 (PFAM: 36.16%), 76,557 (GO: 36.93%) and 37,906 (KOG: 18.28%) (Table 1).
GO assignments were used to predict the functions of unigenes obtained above by classifying them into various biological processes. The unigenes annotated in the GO database were categorized into 56 functional groups which belong to Biological processes, Cellular component, and Molecular function. Among them, there were 25 subclasses of biological processes, 21 cellular components and 10 molecular functions. Most of these unigenes were classified into the cellular process, metabolic process and binding both in roots and shoots (Fig. 1). The unigenes were aligned to the 26 KOG classifications to classify potential functions in roots, while 25 KOG classifications in shoots. Both in roots and shoots, assignments to (J) translation, ribosomal structure and biogenesis, (O) posttranslational modification, protein turnover, and chaperones, and (R) general function prediction were all over 10.0% (Fig. 2). (T) Signal transduction mechanism was also accounted for a large proportion in roots rather than shoots (Fig. 2A). To further identify the biological pathways of Oe1 and WT, the unigenes were annotated by KEGG database. The unigenes were mainly focused on translation, folding sorting and degradation, carbohydrate metabolism, transport and catabolism, and amino acid metabolism both in roots and shoots (Fig. 3).
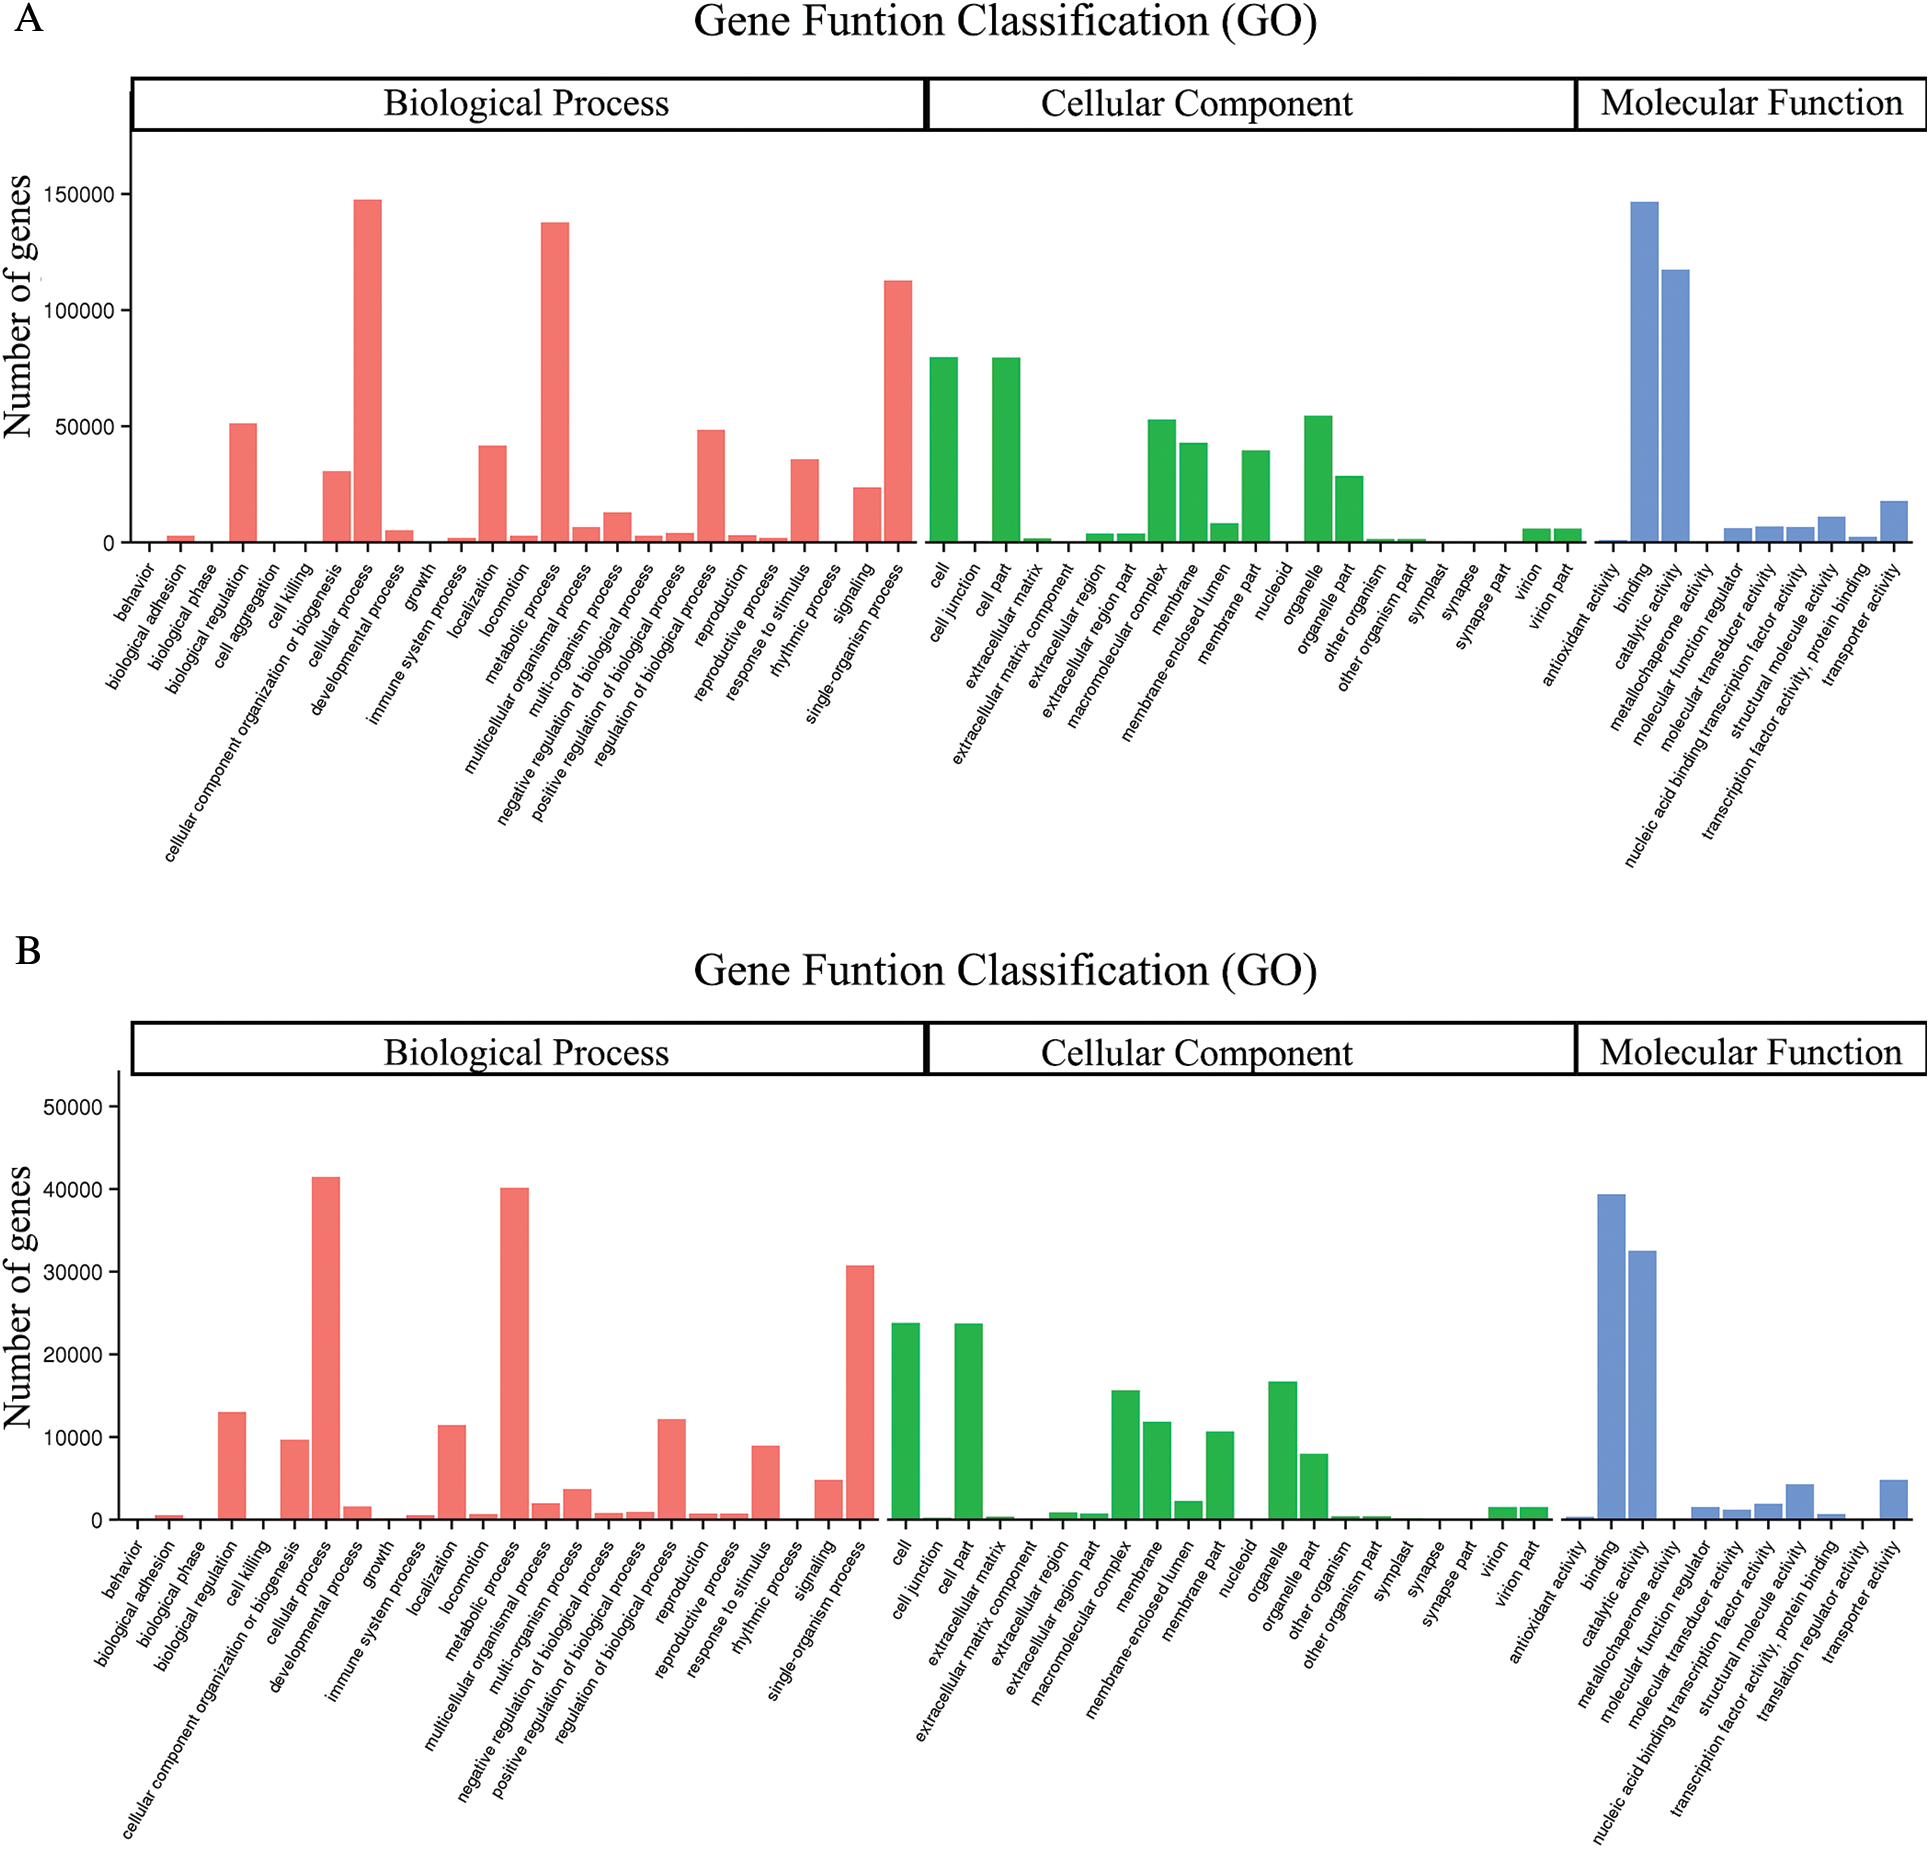
Figure 1: Gene ontology classifications of assembled unigenes. (A) Roots; (B) Shoots
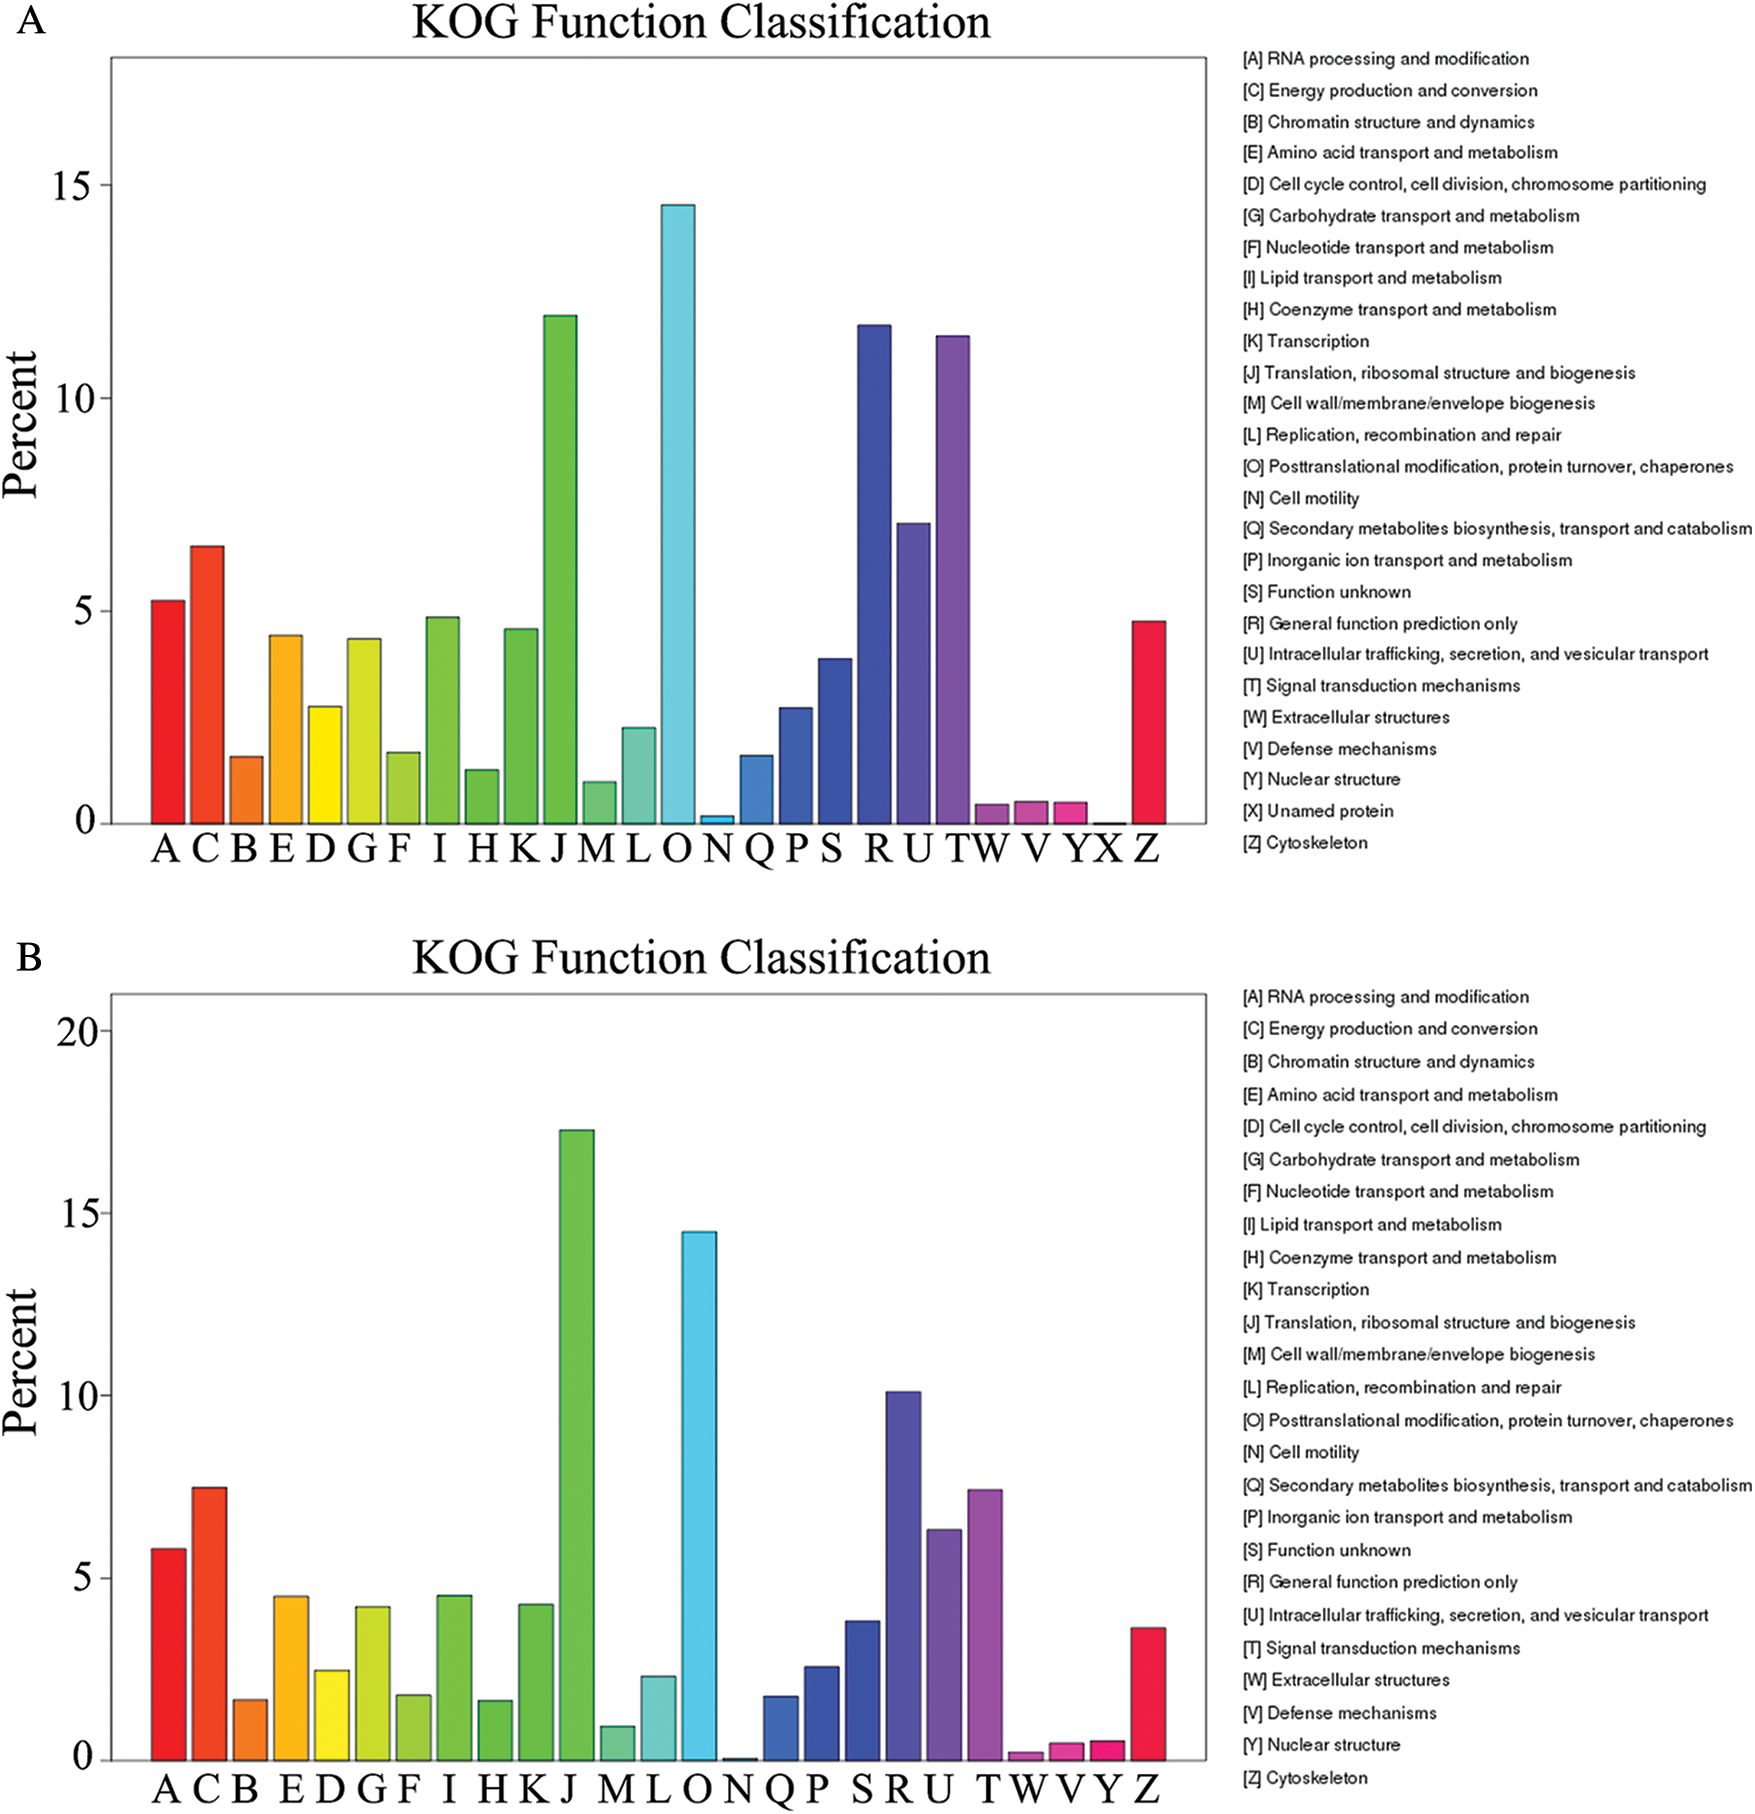
Figure 2: KOG classification of assembled unigenes. (A) Roots; (B) Shoots
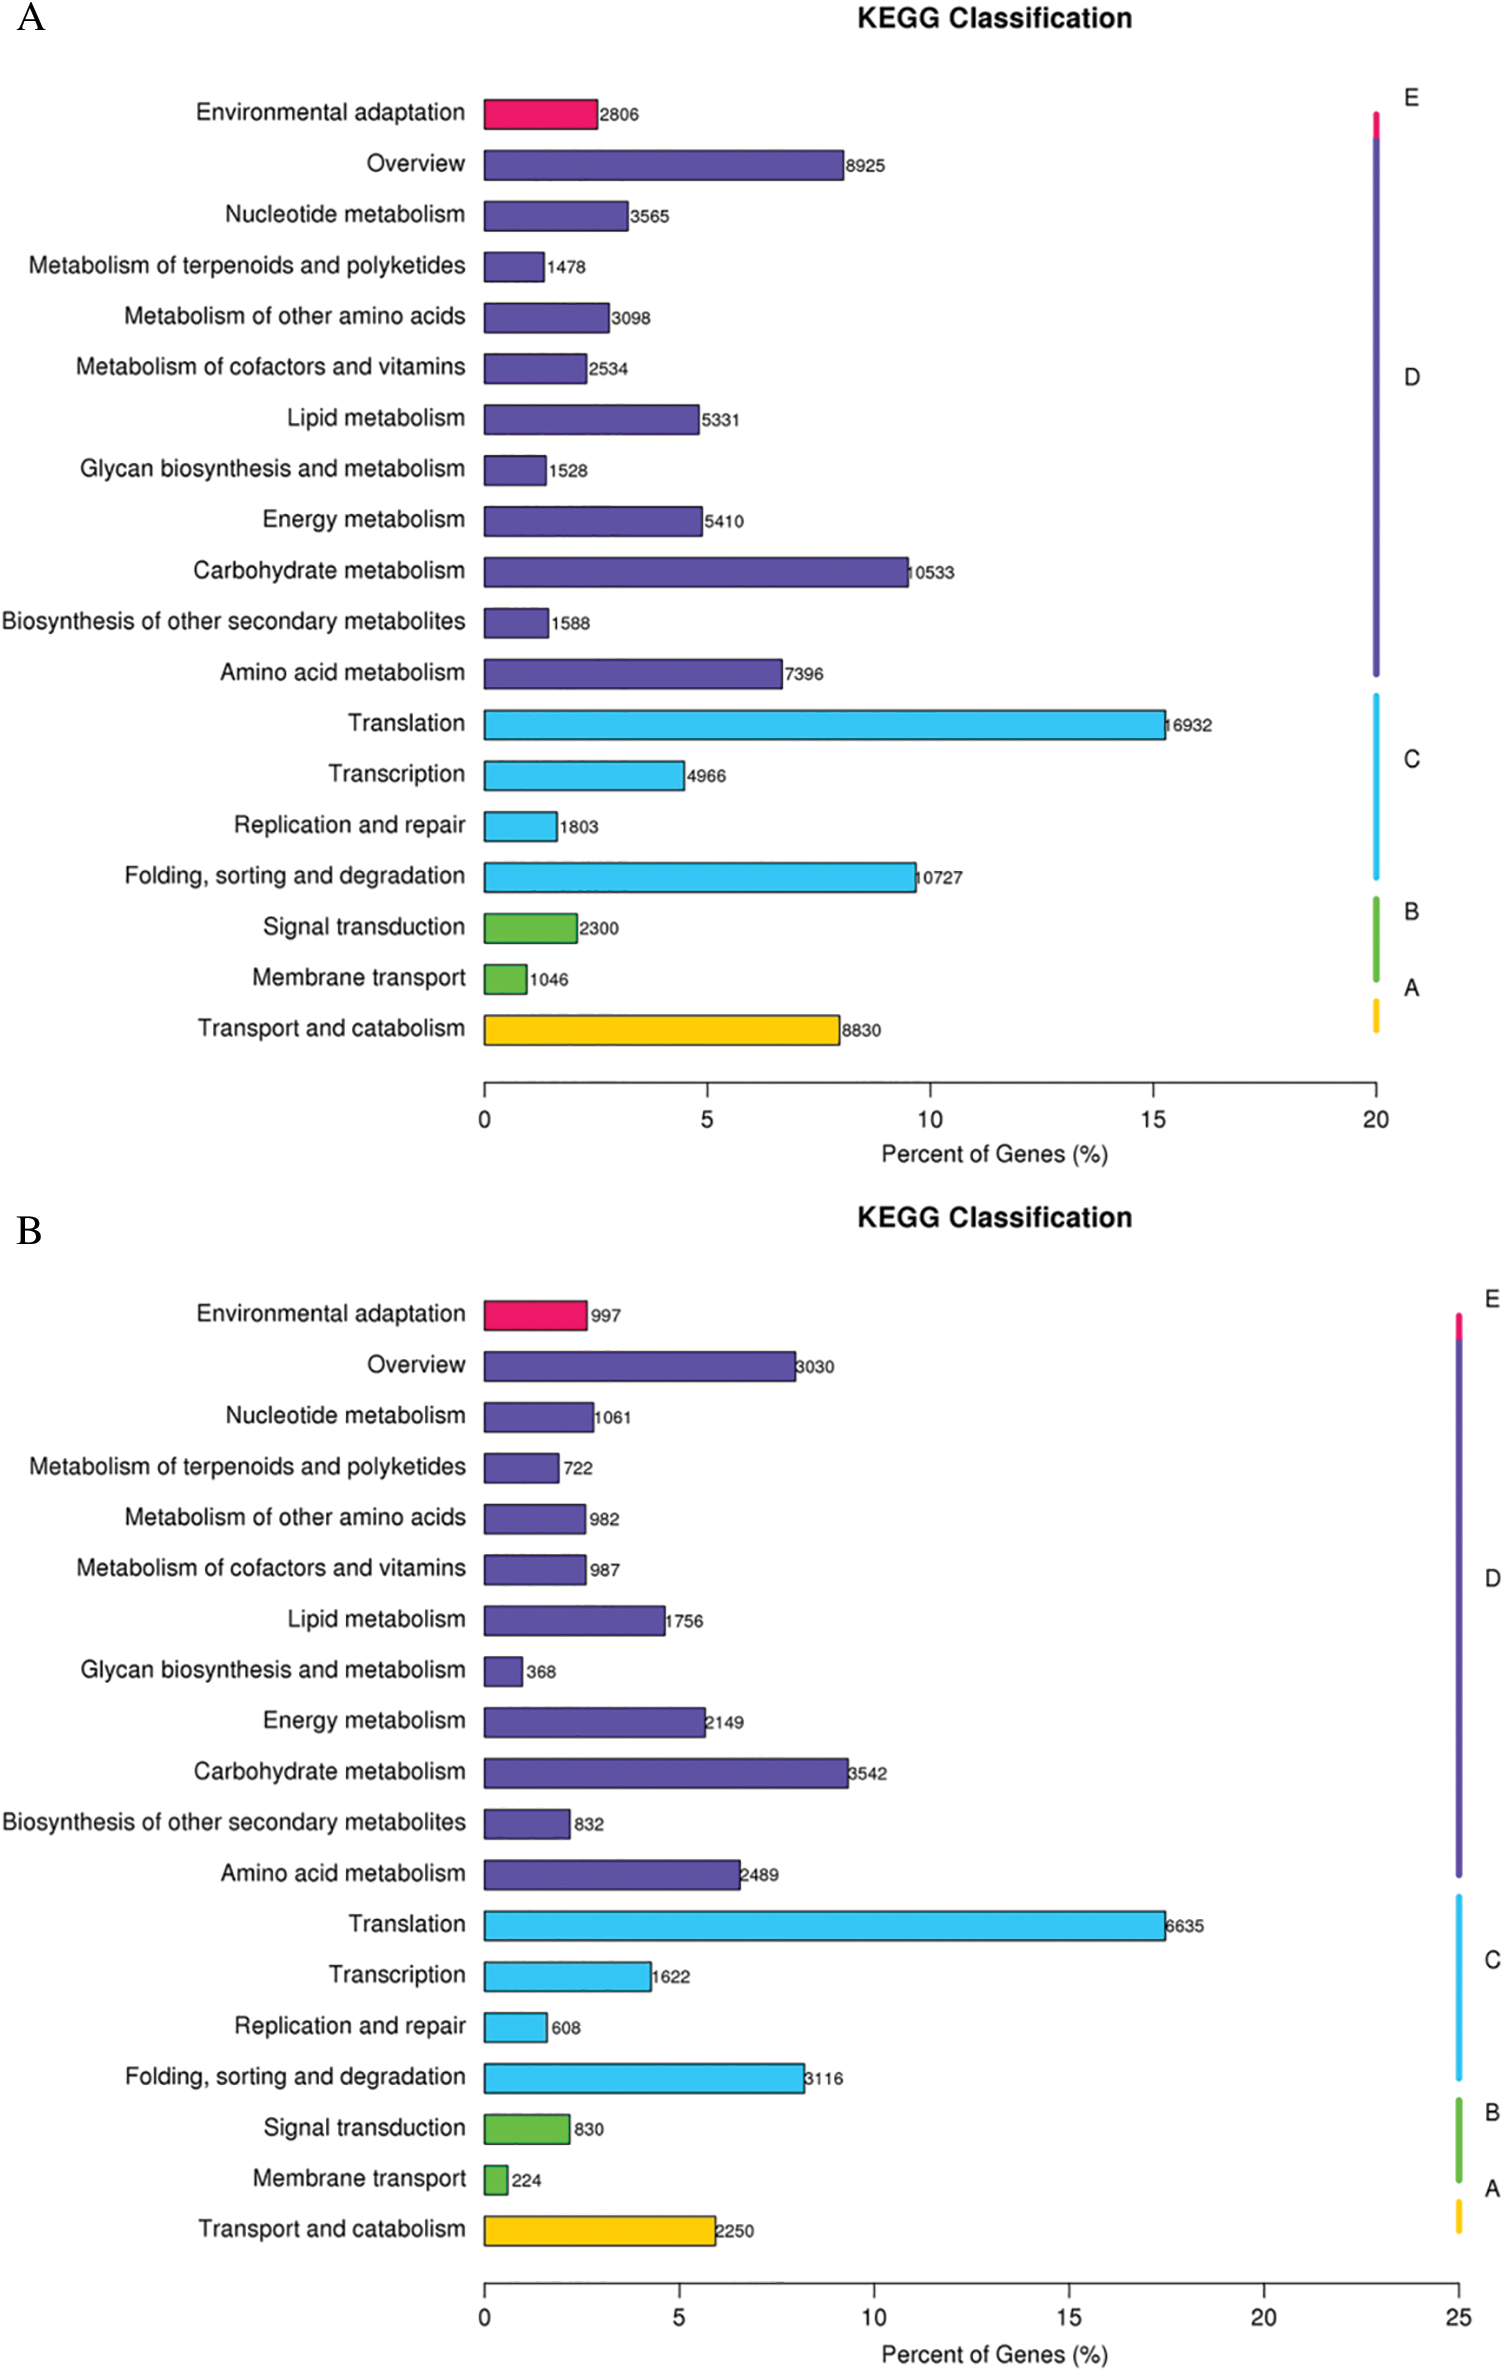
Figure 3: KEGG classification results. (A) Roots; (B) Shoots
3.2 Gene Different Expression Analysis between Oe1 and WT
The significant DEGs were then identified with the applied criteria (p < 0.05) (Fig. 4). In roots, 94 DEGs (88 up-regulated genes and 6 down regulated genes) were identified between Oe1 and WT at 0 d (Fig. 4A). After 2 d LP-treatment, the number of DEGs (450 DEGs, 359 up-regulated genes and 91 down regulated genes) was increased immediately (Fig. 4B). However, only 27 DEGs (20 up-regulated genes and 7 down regulated genes) were identified between Oe1 and WT at 7 d (Fig. 4C). Meanwhile, in shoots, only 19 genes (11 up-regulated genes and 8 down-regulated gene) and 9 genes (2 up-regulated genes and 7 down-regulated gene) showed significant difference in expression levels in 0 and 2 d, respectively (Figs. 4D, 4E). In addition, reach up to 1,787 DEGs (716 up-regulated genes and 1,071 down regulated genes) were identified between Oe1 and WT at 7 d (Fig. 4F).
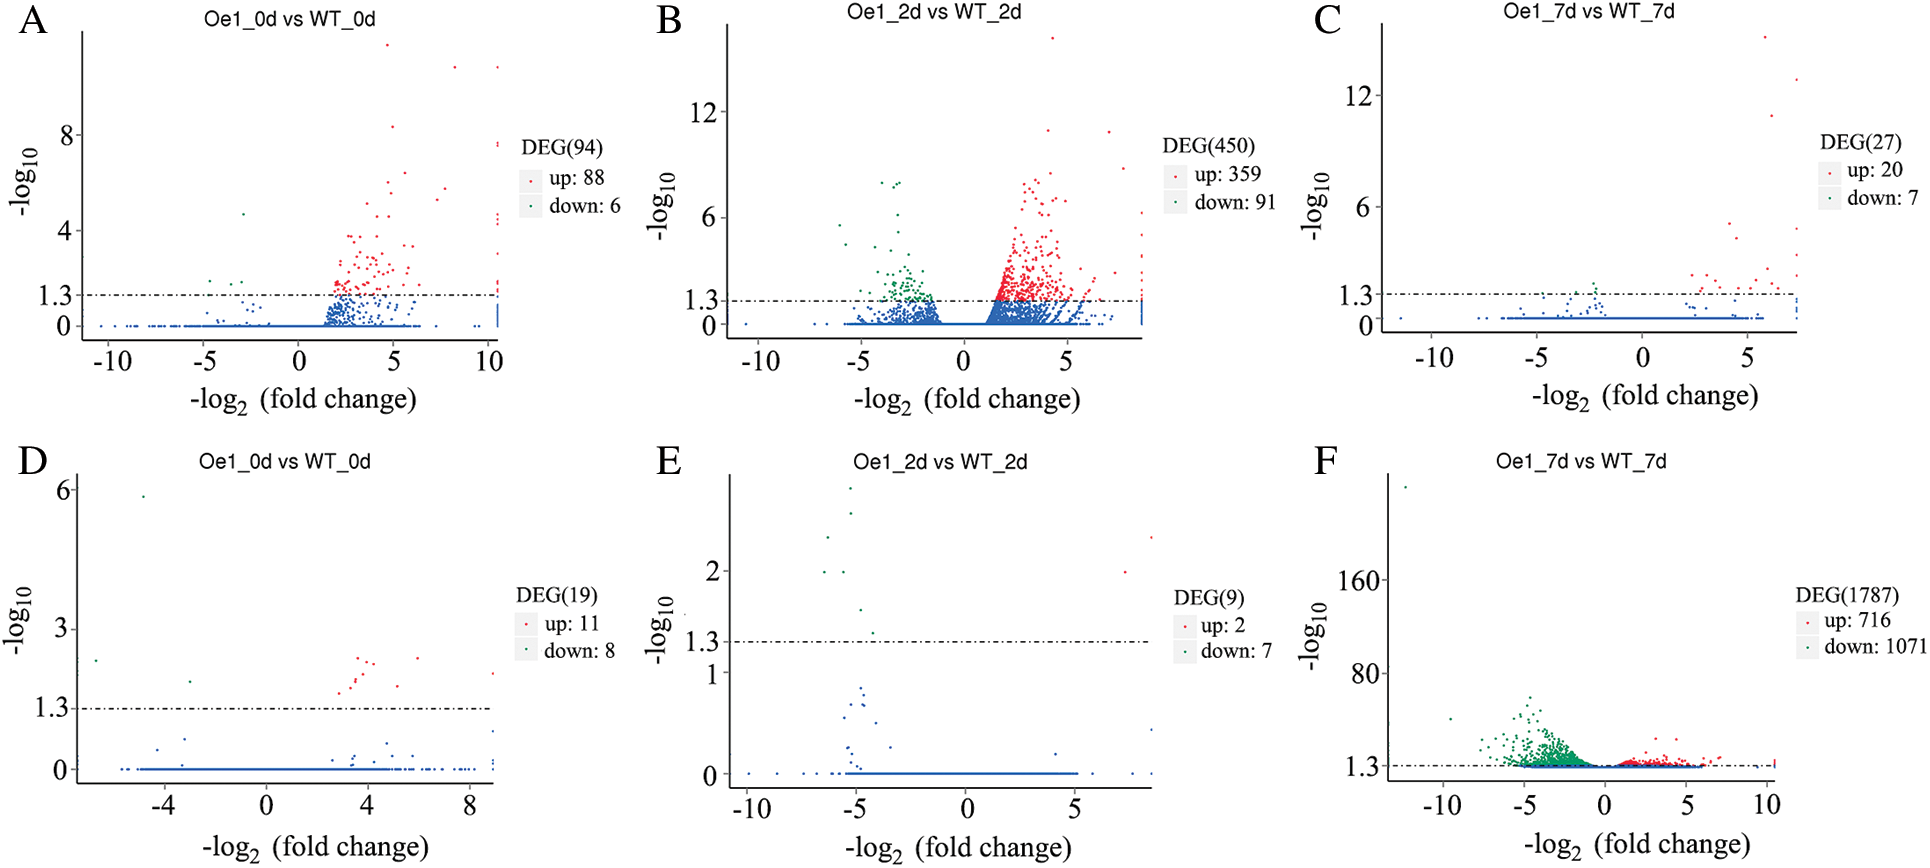
Figure 4: Genes expressed differentially in Oe1 and WT. The parameters (p < 0.05) were used as thresholds to determine the significance of the difference in gene expression. Red dots represent transcripts more prevalent in the Oe1 library compared with WT. Green dots show those present at a lower frequency in the Oe1 library and blue dots indicate transcripts that did not change significantly. (A–C) Roots; (D–F) Shoots
3.3 Pathways Influenced by LP Stress between Oe1 and WT
The influence of LP stress on biological pathways was evaluated via enrichment analysis of DEGs in KEGG between Oe1 and WT. The DEGs were assigned into 14 pathways in 0 and 7 d in roots, respectively. However, only 1 or 2 DEGs were found in every pathway (Figs. 5A, 5C). After 2 d LP-treatment, the DEGs were assigned into 63 pathways in roots. We selected the top 20 pathways that were most significant in the enrichment process to be shown in this diagram (Fig. 5B). Among these pathways, the ribosome (37 DEGs), phenylpropanoid biosynthesis (6 DEGs), Glycolysis/Gluconeogenesis (6 DEGs), oxidative phosphorylation (6 DEGs) and plant-pathogen interaction (5 DEGs) pathway showed a significant degree of enrichment by DEGs. In addition, it was important to note that phenylpropanoid biosynthesis (6 DEGs) and flavonoid biosynthesis (2 DEGs) showed a significant degree of enrichment by DEGs in roots (Supplementary Table S2).
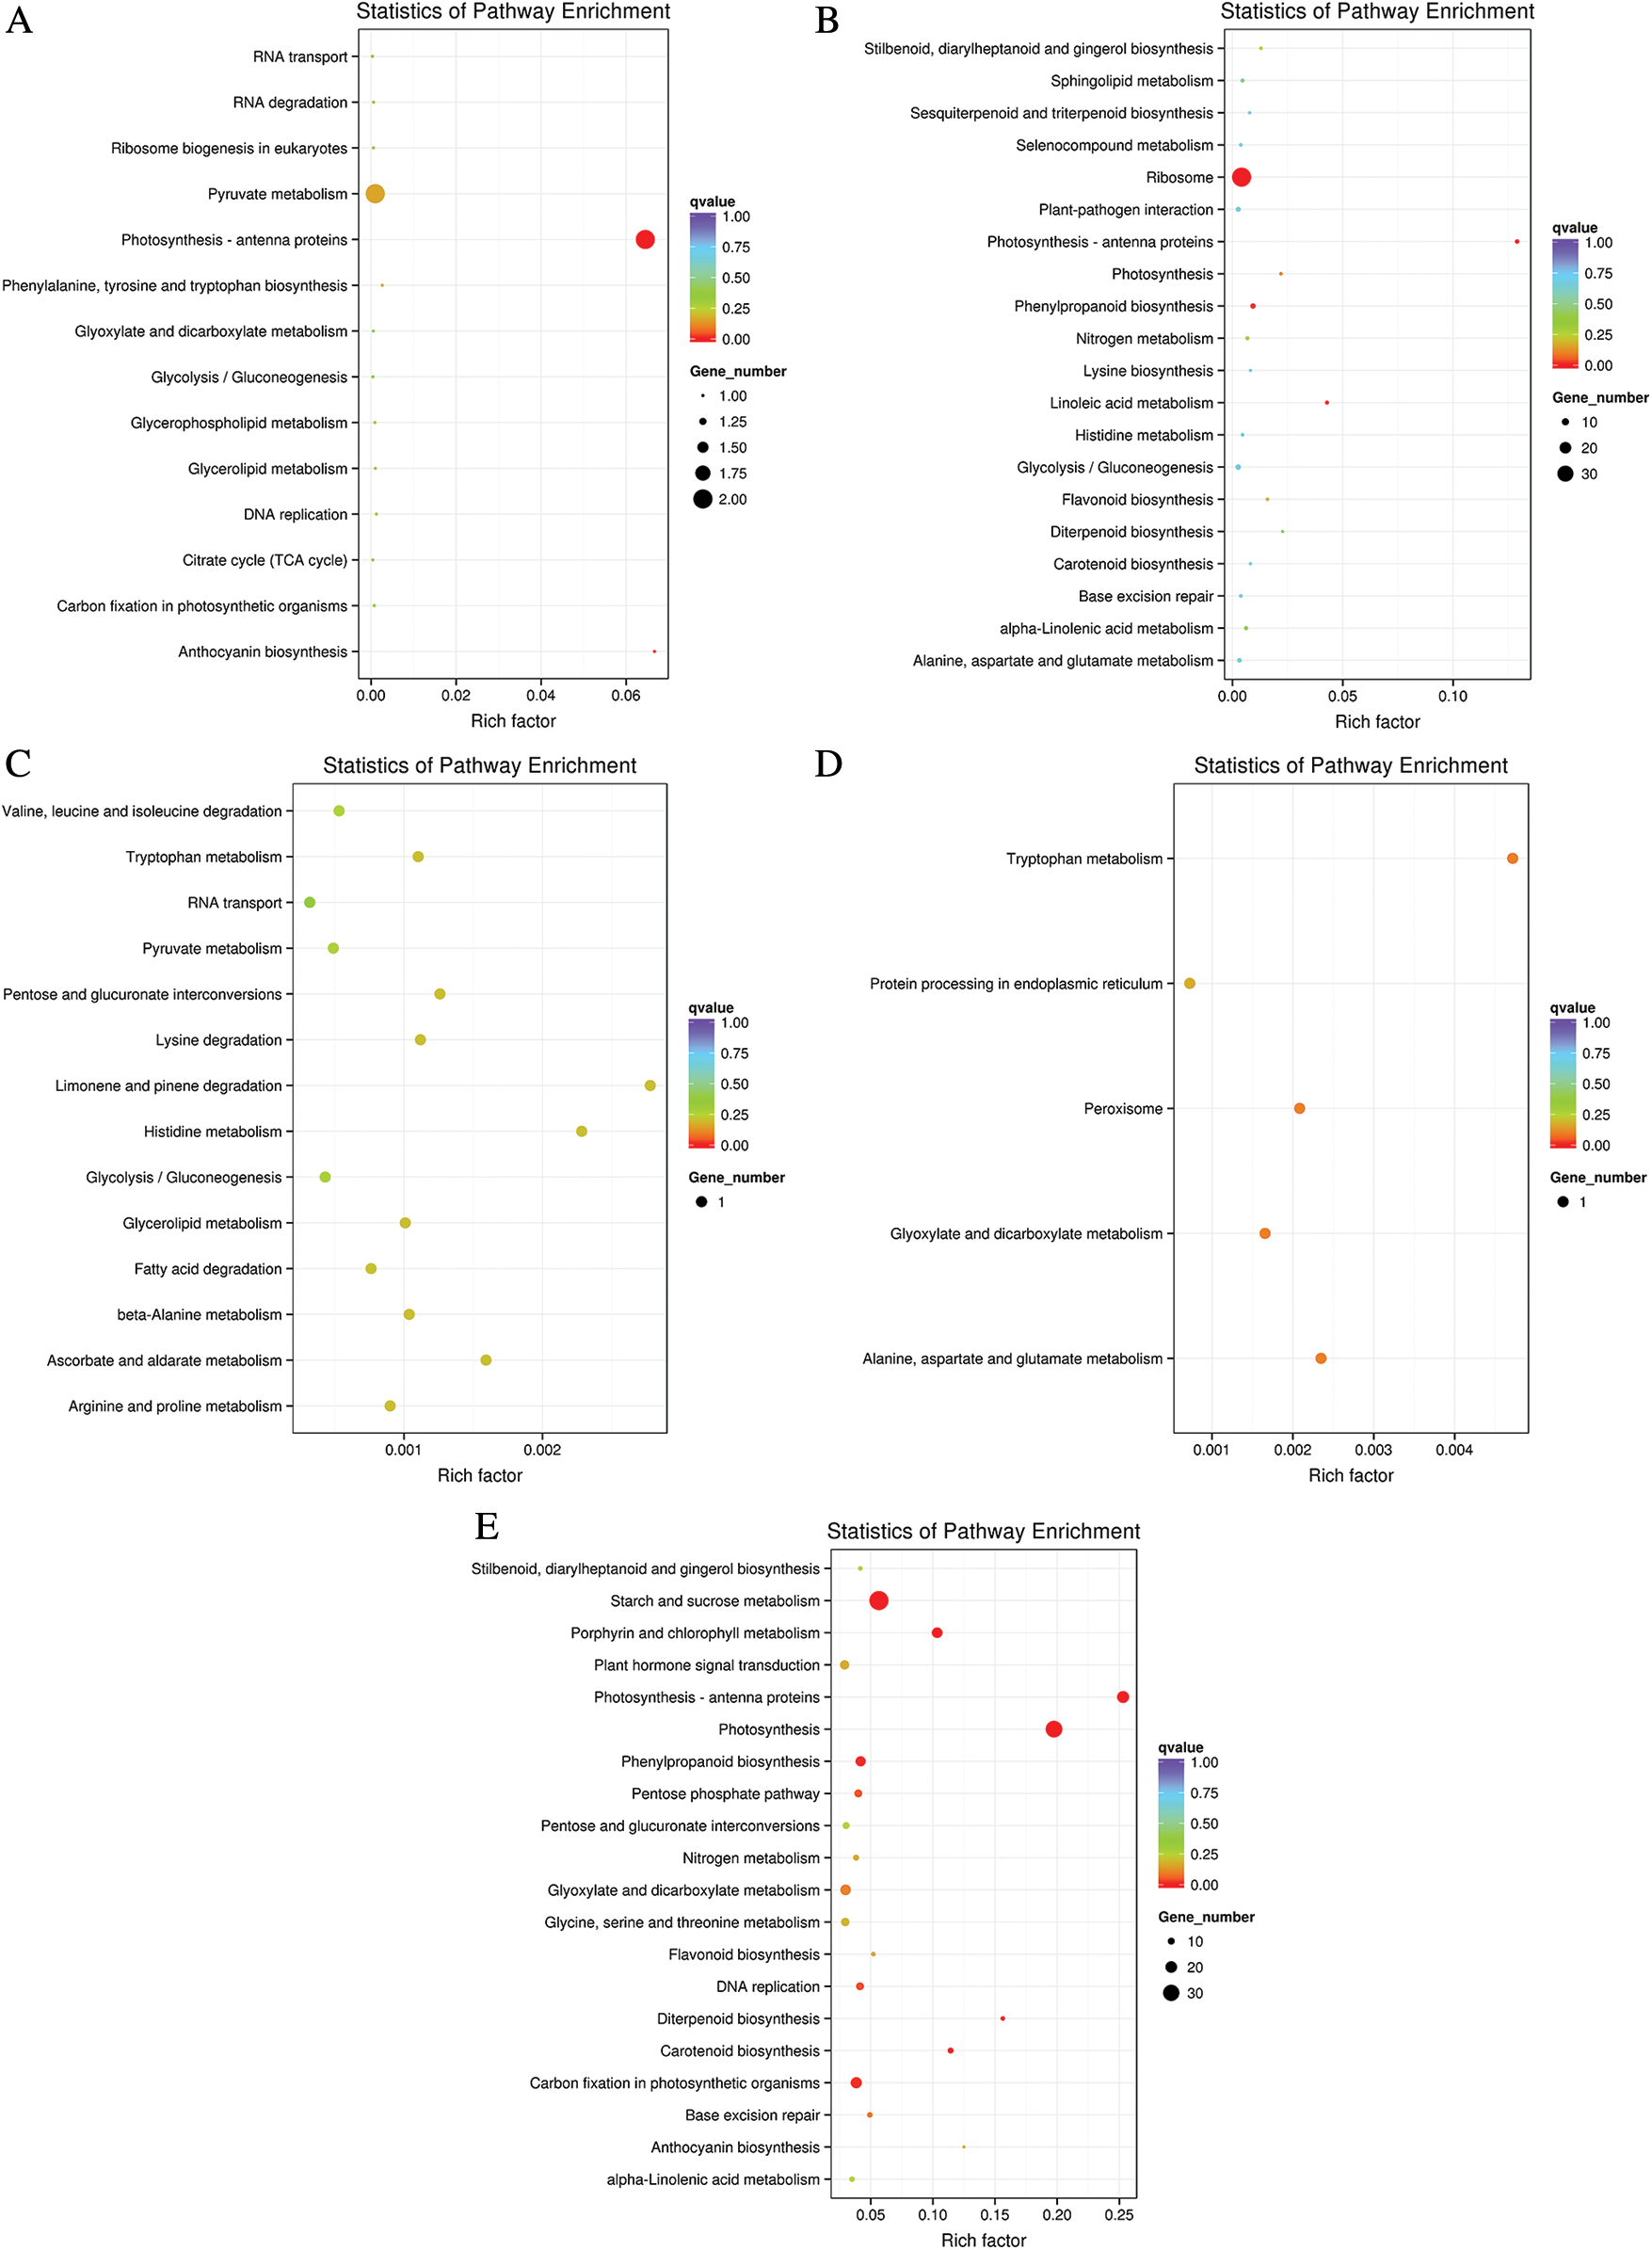
Figure 5: The top 20 pathways affected by DEGs according to the p value in KEGG. (A–C) Roots; (D–E) Shoots
In shoots, only 5 pathways were enriched in 0 d (Fig. 5D). While in 2 d, there was not any pathway enriched by KEGG. Suffering from phosphorus deficiency for 7 d, the DEGs were assigned into 74 pathways in shoots (Fig. 5E). Among the top 20 pathways, the starch and sucrose metabolism (36 DEGs), photosynthesis (31 DEGs) and Photosynthesis-antenna proteins (21 DEGs) showed a significant degree of enrichment by DEGs. Phenylpropanoid biosynthesis (17 DEGs) and flavonoid biosynthesis (5 DEGs) also showed a significant degree of enrichment by DEGs in shoots (Supplementary Table S3).
3.4 Analysis of DEGs in the Key Metabolic Pathways
As the remarkable differences at the metabolomics level, pyruvate metabolism and TCA cycle pathways had mainly discussed in our previous research. Here, these two pathways were also showed difference after 2 d LP-treatment in roots between Oe1 and WT. Part of the genes were identified in these key metabolic pathways. c137909_g1 in pyruvate metabolism and c183919_g1 in TCA cycle were up-regulated 18.25- and 3.62-folds more than those of WT under LP stress, respectively (Fig. 6).
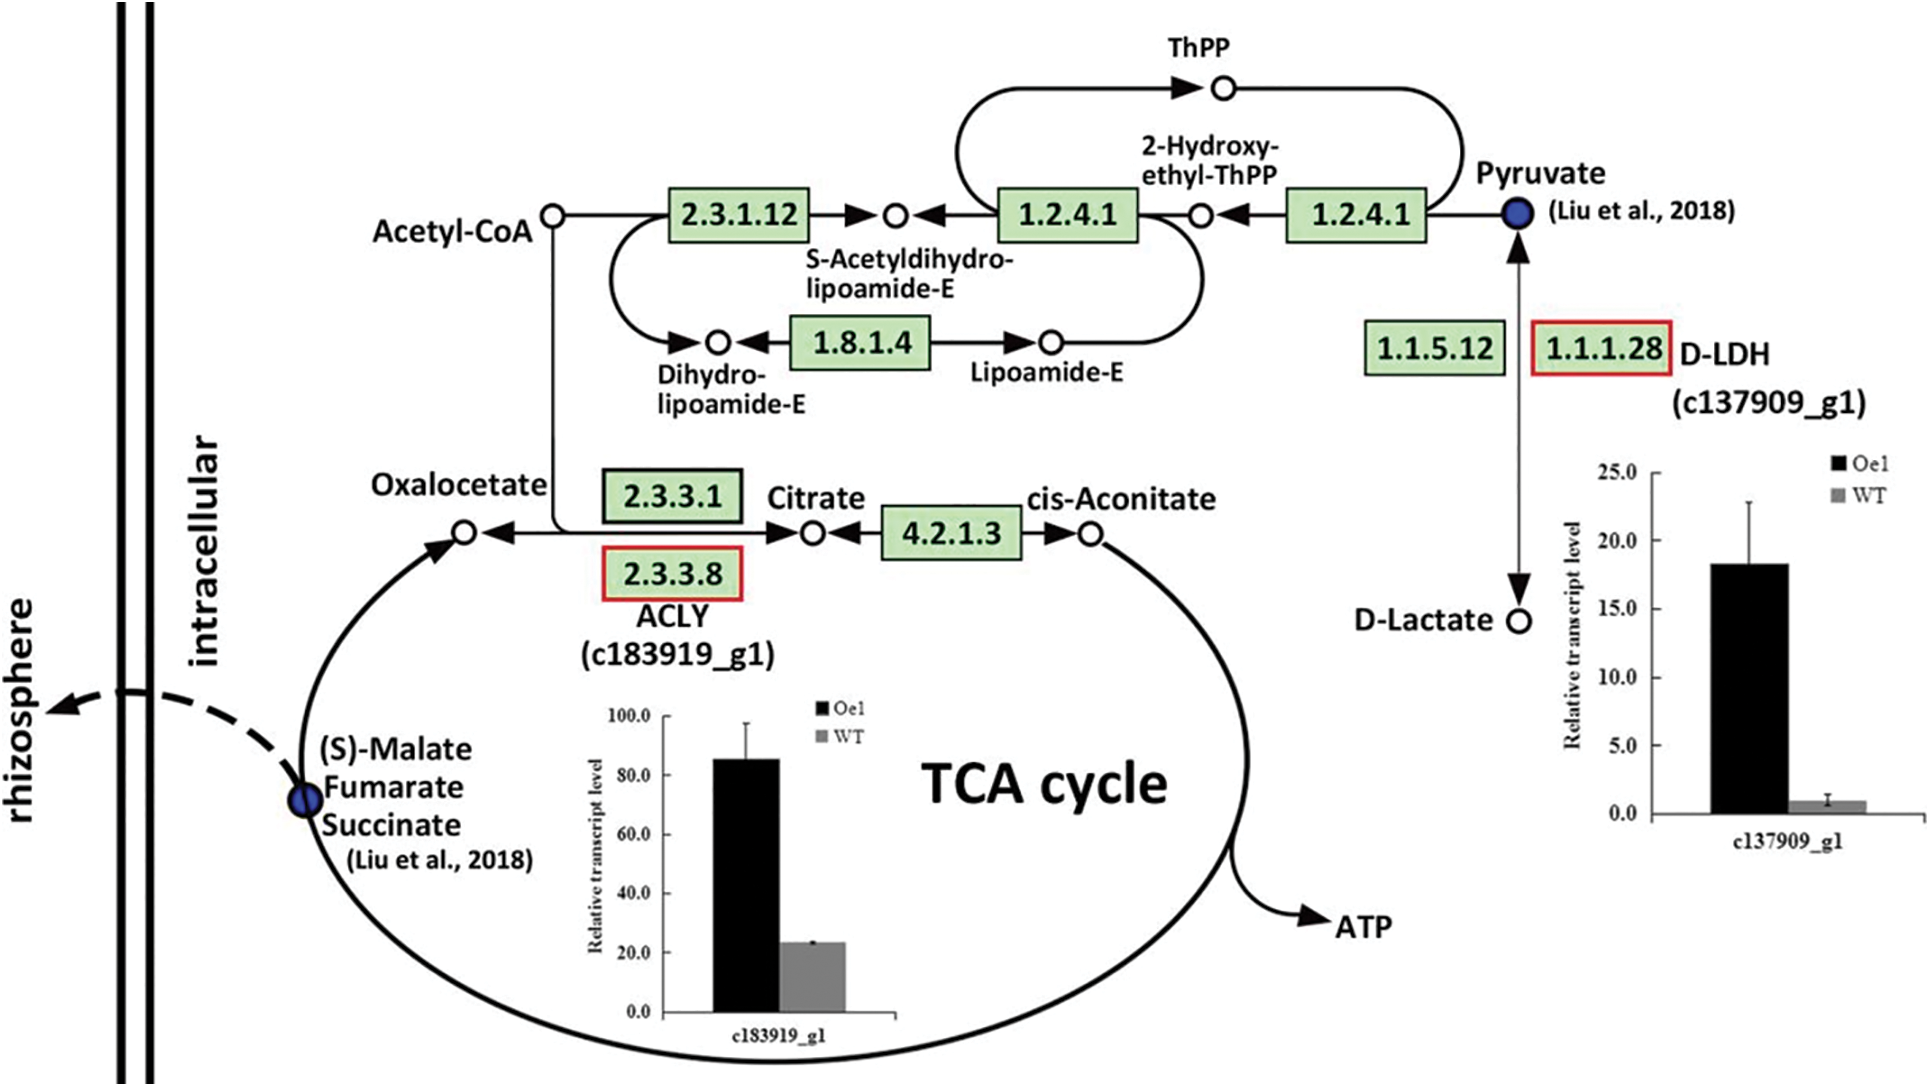
Figure 6: DEGs enriched by KEGG pathway in roots between Oe1 and WT under 2 d LP-stress. The metabolic pathway maps refer to Arabidopsis in KEGG database. The Up-regulated KEGG Orthology (KO) nodes were labeled with red frames. The bar chart shows the relative expression differences of adjacent genes
4.1 Low Phosphorus Affects Transcription Diversity of a Range of Genes
Multi-transcriptome database and candidate genes were provided for further study of genotypes with and without low-phosphorus tolerance in maize. The P deficiency-responsive genes common to low P-tolerant and the low P-sensitive line were associated with acid phosphatase (APase) activity and a series of metabolic pathways [15]. Transcriptome analysis reveals candidate genes related to low-P stress in sorghum. GO enrichment analyses showed that the candidate genes were involved in oxidoreductase activity. These will form the molecular network of sorghum responding to low P stress, and then contribute to the high-quality breeding with low P tolerance [19]. GO analysis showed that apple trees responded to metabolic processes, cell proliferation, biological process regulation, reactive oxygen metabolism and flavonoid metabolism under phosphorus stress. Pathway analysis in KEGG further showed that DEGs acted on mitogen-activated protein kinase (MAPK) signaling pathway, flavonoid biosynthesis, phenylpropanoid biosynthesis, and ATP binding box (ABC) transporters [20].
4.2 CmPht1;2 Affected Biological Processes at the Transcriptional Level
The majority of unigenes excavated in the taproot of Radish were predominately involved in basic physiological and metabolic processes, catalytic, binding, and cellular processes [21]. Gene ontology analysis revealed that salt stress-related categories involved in catalytic activity, binding, metabolic processes and cellular processes of the prunellae spica transcriptome under salt stress [22]. Similarly, here in our work, by the GO database, cellular process, metabolic process and binding were in the majority. These processes may indicate the endurance to abiotic stress of chrysanthemum. Meanwhile these unigenes were mainly annotated as translation and posttranslational modification both in roots and shoots by KOG, which contribute on the production of proteins. Nearly 200 different types of Post-translational modifications (PTMs) have been identified in previous studies, and most of them are critical regulators of protein function [23]. Under low phosphorus conditions, plant roots receive stress signals and transport them to above-ground tissues [24]. Similar to the results of the difference of MAPK signaling pathway genes in apple under LP stress, signal transduction mechanism performed noticeably in roots than shoots here [20]. The numbers of DEGs and difference pathways in roots were significantly higher than shoots under 2 d LP-treatment. While these numbers in shoots were significantly higher than those in roots under 7 d LP-treatment. This change might owe to the difference of signal transduction mechanism in roots which transmitted low phosphorus signal from roots to shoots. Carbohydrate metabolism, transport and catabolism were specially separated by KEGG in our data. These results checked with the data on many plant stress in several species. Carbohydrate metabolism focuses on biosynthesis, catabolism and biological function of the major storage carbohydrates during growth and development of the plant [25]. Soluble sugars, an important part of carbohydrate metabolism, provide important protection to plant stress. The accumulation of sorbitol and sucrose in the apple roots was higher, and the activities of sucrose synthase, invertase and sorbitol dehydrogenase, which are involved in the degradation of sucrose and sorbitol, were significantly increased under a low nitrogen supply [26]. However, the influence by the overexpression of phosphate transporter genes had rarely reported before. Therefore CmPht1;2-overexpression or high phosphate concentration of Oe1 might make an effect on the biological processes after LP treatment both in roots and shoots [12,27].
4.3 Overexpression of CmPht1;2 Might Promoted Several Pathways Directly or Indirectly
TCA cycle is one of the iconic pathways in terms of energy metabolism, being responsible for the oxidation of respiratory substrates to drive ATP synthesis [28]. Mitochondrial TCA cycle signalling involved in the regulation of DNA and histone modifications to enable dynamic control of expanded genome during eukaryogenesis. And TCA cycle remodeling is also used to coordinate stress responses and gene expression programmes in eukaryotic organisms [29]. Intermediates of glycolytic and TCA cycle were crucial players response to oxidative stress in Arabidopsis [30]. Pyruvate is the key node connecting glycolysis and TCA cycle. Genome-wide association study in wheat indicated that 6 genes involved in pyruvate metabolism and TCA cycle were upregulated significantly in the P efficient variety under LP stress [31]. D-lactate is the end product of glyoxalase system. D-Lactate dehydrogenase (D-LDH) catalyzes the oxidation of D-lactate to pyruvate using flavin adenine dinucleotide as a cofactor in Arabidopsis [32]. D-LDH completes the detoxification process of methylglyoxal and diverts the stress induced toxic metabolites D-lactate towards energy production in rice [33]. Thereby D-LDH could protect the cells from their deteriorating effects and enhance resistance to multiple abiotic stresses of plants. Here. in our results, c137909_g1 in pyruvate metabolism which was commented to D-LDH had a significantly higher expression in the Oe1 roots compared with WT under LP condition. These were able to provide a detoxification process of methylglyoxal and a further transformation from D-lactate to energy. While instead of increase, pyruvate went down as the increase of D-LDH in the metabolism data of our previous research [12]. We hypothesized that this is due to the rapid transformation of pyruvate into the TCA cycle by way of acetyl-CoA. ATP-citrate lyase (ACLY) could catalyze the transformation among acetyl-CoA, oxaloacetate and citrate based on the KEGG database. So ACLY is the key node of pyruvate metabolism going into the TCA cycle. Here c183919_g1 (ACLY) also showed a higher expression in the Oe1 roots than WT and perhaps play a key role in promoting the TCA cycle. Malate affected the length of the primary root and the number of tips in sorghum suffering from low-P stress [19]. Root-exuded organic acids will simultaneously and disproportionately increase to facilitate the Pi mobility under P deficiency [34]. In the early work, we found a prominent decrease of malate, fumarate and succinate in TCA cycle, and speculated an enhanced secretion of organic acids into the rhizosphere [12]. Therefore, the up-regulation of D-LDH and ACLY in the Oe1 plants compared with WT might enhance the growth potential and root development through promoting the pyruvate metabolism and TCA cycle in chrysanthemum. The general phenylpropanoid metabolism can generate an enormous array of secondary metabolites to result in an organ and developmentally specific pattern of metabolites in plants [35]. Salt interferences to metabolite accumulation and flavonoid biosynthesis in Tetrastigma hemsleyanum might reveal the response to salt stress by flavonoid biosynthesis in plants [36]. Here, phenylpropanoid biosynthesis and flavonoid biosynthesis were shared by both roots and shoots, but with different number of DEGs. These results might indicate the different organ and development specific pattern between roots and shoots, and the resistance response to LP stress in chrysanthemum.
This study found that CmPht1;2 affected a series of biological processes in the transcriptional level to surface the LP stress. CmPht1;2 might promote the TCA cycle and pyruvate metabolism pathway directly or indirectly which enhance the growth potential and root development. These processes may contribute to the mechanism of tolerance under LP stress in chrysanthemum.
Acknowledgement: We thank to the support of a project funded by the Priority Academic Program Development of Jiangsu Higher Education Institutions, PAPD, and Central laboratory of College of Horticulture, Nanjing Agricultural University.
Funding Statement: This research was funded by the National Natural Science Foundation of China (31902061), CL. https://www.nsfc.gov.cn.
Author Contributions: The authors confirm contribution to the paper as follows: study conception and design: Sumei Chen, Fadi Chen, Jiafu Jiang; data collection, analysis and interpretation of results: Chen Liu, Xiaowei Tang, Xiaohui Qu; draft manuscript preparation: Chen Liu. All authors reviewed the results and approved the final version of the manuscript.
Conflicts of Interest: The authors declare that they have no conflicts of interest to report regarding the present study.
References
1. He, M., Yan, Z., Cui, X., Gong, Y., Li, K. et al. (2020). Scaling the leaf nutrient resorption efficiency: Nitrogen vs phosphorus in global plants. Science of the Total Environment, 729, 138920. [Google Scholar] [PubMed]
2. Yang, M., Yang, H. (2021). Utilization of soil residual phosphorus and internal reuse of phosphorus by crops. PeerJ, 9, e11704. [Google Scholar] [PubMed]
3. Radersma, S., Grierson, P. F. (2004). Phosphorus mobilization in agroforestry: Organic anions, phosphatase activity and phosphorus fractions in the rhizosphere. Plant & Soil, 259(1), 209–219. [Google Scholar]
4. Kumar, S., Arora, P., Chugh, C., Seem, K., Kumar, S. et al. (2021). Characterization of contrasting rice (Oryza sativa L.) genotypes reveals the Pi-efficient schema for phosphate starvation tolerance. BMC Plant Biology, 21(1), 282. [Google Scholar] [PubMed]
5. Ceasar, S. A., Baker, A., Muench, S. P., Ignacimuthu, S., Baldwin, S. A. (2016). The conservation of phosphate-binding residues among PHT1 transporters suggests that distinct transport affinities are unlikely to result from differences in the phosphate-binding site. Biochemical Society Transactions, 44(5), 1541–1548. [Google Scholar] [PubMed]
6. Lundh, F., Mouillon, J. M., Samyn, D., Stadler, K., Popova, Y. et al. (2009). Molecular mechanisms controlling phosphate-induced downregulation of the yeast Pho84 phosphate transporter. Biochemistry, 48(21), 4497–4505. [Google Scholar] [PubMed]
7. Lapis-Gaza, H. R., Jost, R., Finnegan, P. M. (2014). Arabidopsis PHOSPHATE TRANSPORTER1 genes PHT1;8 and PHT1;9 are involved in root-to-shoot translocation of orthophosphate. BMC Plant Biology, 14(1), 1–19. [Google Scholar]
8. Shin, H., Shin, H. S., Dewbre, G. R., Harrison, M. J. (2004). Phosphate transport in Arabidopsis: Pht1;1 and Pht1;4 play a major role in phosphate acquisition from both low- and high-phosphate environments. Plant Journal, 39(4), 629–642. [Google Scholar]
9. Chang, M. X., Gu, M., Xia, Y. W., Dai, X. L., Dai, C. R. et al. (2018). OsPHT1;3 mediates uptake, translocation and remobilization of phosphate under extremely low phosphate regimes. Plant Physiology, 179(2), 656–670. [Google Scholar] [PubMed]
10. Jia, H., Ren, H., Gu, M., Zhao, J., Sun, S. et al. (2011). The phosphate transporter gene OsPht1;8 is involved in phosphate homeostasis in rice. Plant Physiology, 156(3), 1164–1175. [Google Scholar] [PubMed]
11. Liu, P., Chen, S., Song, A., Zhao, S., Fang, W. et al. (2014). A putative high affinity phosphate transporter, CmPT1, enhances tolerance to Pi deficiency of chrysanthemum. BMC Plant Biology, 14(1), 18. [Google Scholar] [PubMed]
12. Liu, C., Su, J., Stephen, G. K., Wang, H., Song, A. et al. (2018). Overexpression of phosphate transporter gene CmPht1;2 facilitated Pi uptake and alternated the metabolic profiles of chrysanthemum under phosphate deficiency. Frontiers in Plant Science, 9, 686. [Google Scholar] [PubMed]
13. Bräutigam, A., Mullick, T., Schliesky, S., Weber, A. P. (2011). Critical assessment of assembly strategies for non-model species mRNA-Seq data and application of next-generation sequencing to the comparison of C3 and C4 species. Journal of Experimental Botany, 62(9), 3093–3102. [Google Scholar]
14. Prodhan, M. A., Pariasca-Tanaka, J., Ueda, Y., Hayes, P. E., Wissuwa, M. (2022). Comparative transcriptome analysis reveals a rapid response to phosphorus deficiency in a phosphorus-efficient rice genotype. Scientific Reports, 12(1), 9460. [Google Scholar] [PubMed]
15. Du, Q., Wang, K., Xu, C., Zou, C., Xie, C. et al. (2016). Strand-specific RNA-Seq transcriptome analysis of genotypes with and without low-phosphorus tolerance provides novel insights into phosphorus-use efficiency in maize. BMC Plant Biology, 16(1), 222. [Google Scholar] [PubMed]
16. Zhang, H., Chu, S., Dan, Z. (2017). Transcriptome dataset of soybean (Glycine max) grown under phosphorus-deficient and -sufficient conditions. Data, 2(2), 17. [Google Scholar]
17. Delden, S., Nazarideljou, M. J., Marcelis, L. (2020). Nutrient solutions for Arabidopsis thaliana: A study on nutrient solution composition in hydroponics systems. Plant Methods, 16, 72. [Google Scholar] [PubMed]
18. Livak, K. J., Schmittgen, T. D. (2002). Analysis of relative gene expression data using real-time quantitative PCR. Methods, 25(4), 402–408. [Google Scholar]
19. Zhang, J., Jiang, F., Shen, Y., Zhan, Q., Bai, B. et al. (2019). Transcriptome analysis reveals candidate genes related to phosphorus starvation tolerance in sorghum. BMC Plant Biology, 19(1), 306. [Google Scholar] [PubMed]
20. Sun, T., Zhang, J., Zhang, Q., Li, X., Li, M. et al. (2021). Transcriptome and metabolome analyses revealed the response mechanism of apple to different phosphorus stresses. Plant Physiology and Biochemistry, 167, 639–650. [Google Scholar] [PubMed]
21. Yu, R., Liang, X., Zhang, W., Wang, Y., Luo, X. et al. (2016). De novo taproot transcriptome sequencing and analysis of major genes involved in sucrose metabolism in radish (Raphanus sativus L.). Frontiers in Plant Science, 7, 585. [Google Scholar] [PubMed]
22. Liu, Z., Hua, Y., Wang, S., Liu, X., Zou, L. et al. (2020). Analysis of the Prunellae Spica transcriptome under salt stress. Plant Physiology and Biochemistry, 156, 314–322. [Google Scholar] [PubMed]
23. Cruz, E. R., Nguyen, H., Nguyen, T., Wallace, I. S. (2019). Functional analysis tools for post-translational modification: A post-translational modification database for analysis of proteins and metabolic pathways. The Plant Journal, 99(5), 1003–1013. [Google Scholar] [PubMed]
24. Ritmejerytė, E., Boughton, B. A., Bayly, M. J., Miller, R. E. (2019). Divergent responses of above- and below-ground chemical defence to nitrogen and phosphorus supply in waratahs (Telopea speciosissima). Functional Plant Biology, 46(12), 1134–1145. [Google Scholar]
25. Avigad, G., Dey, P. M. (1997). Carbohydrate metabolism: Storage carbohydrates. Plant Biochemistry, 30(5), 143–204. [Google Scholar]
26. Zhao, H., Sun, S., Zhang, L., Yang, J., Wang, Z. et al. (2020). Carbohydrate metabolism and transport in apple roots under nitrogen deficiency. Plant Physiology and Biochemistry, 155, 455–463. [Google Scholar] [PubMed]
27. Silva, D. A., Tsai, S. M., Chiorato, A. F., Andrade, S. C., Esteves, J. A. et al. (2019). Analysis of the common bean (Phaseolus vulgaris L.) transcriptome regarding efficiency of phosphorus use. PLoS One, 14(1), e0210428. [Google Scholar] [PubMed]
28. Sweetlove, L., Beard, K., Nunes-Nesi, A., Fernie, A. R., Ratcliffe, R. G. (2010). Not just a circle: Flux modes in the plant TCA cycle-ScienceDirect. Trends in Plant Science, 15(8), 462–470. [Google Scholar] [PubMed]
29. Ryan, D., Frezza, C., O’Neill, L. A. (2021). TCA cycle signalling and the evolution of eukaryotes. Current Opinion in Biotechnology, 68, 72–88. [Google Scholar] [PubMed]
30. Sipari, N., Lihavainen, J., Shapiguzov, A., Kangasjärvi, J., Keinänen, M. (2020). Primary metabolite responses to oxidative stress in early-senescing and paraquat resistant Arabidopsis thaliana rcd1 (Radical-Induced Cell Death1). Frontiers in Plant Science, 11, 194. [Google Scholar] [PubMed]
31. Safdar, L., Umer, M., Almas, F., Uddin, S., Safdar, Q. T. et al. (2020). Identification of genetic factors controlling phosphorus utilization efficiency in wheat by genome-wide association study with principal component analysis. Gene, 768(7298), 145301. https://doi.org/10.1016/j.gene.2020.145301 [Google Scholar] [PubMed] [CrossRef]
32. Maurino, V., Welchen, E., García, L., García, L., Wagner, S. et al. (2016). D-Lactate dehydrogenase links methylglyoxal degradation and electron transport through cytochrome C. Plant Physiology, 172, 901–912. https://doi.org/10.1104/pp.16.01174 [Google Scholar] [PubMed] [CrossRef]
33. Jain, M., Aggarwal, S., Nagar, P., Tiwari, R., Mustafiz, A. (2020). A D-lactate dehydrogenase from rice is involved in conferring tolerance to multiple abiotic stresses by maintaining cellular homeostasis. Scientific Reports, 10(1), 12835. https://doi.org/10.1038/s41598-020-69742-0 [Google Scholar] [PubMed] [CrossRef]
34. Zhao, K., Wu, Y. (2014). Rhizosphere calcareous soil P-extraction at the expense of organic carbon from root-exuded organic acids induced by phosphorus deficiency in several plant species. Soil Science & Plant Nutrition, 60(5), 640–650. https://doi.org/10.1080/00380768.2014.934191 [Google Scholar] [CrossRef]
35. Vogt, T. (2010). Phenylpropanoid biosynthesis. Molecular Plant, 3(1), 2–20. https://doi.org/10.1093/mp/ssp106 [Google Scholar] [PubMed] [CrossRef]
36. Yang, L., Shi, Y., Xiao, R., Wu, Q., Qu, A. et al. (2021). Salt interferences to metabolite accumulation, flavonoid biosynthesis and photosynthetic activity in Tetrastigma hemsleyanum. Environmental and Experimental Botany, 194, 104765. [Google Scholar]
Supplementary Materials
Supplementary Table S1: Primers used in the manuscript
Supplementary Table S2: Pathways influenced by 2 d LP stress between Oe1 and WT in roots
Supplementary Table S3: Pathways influenced by 7 d LP stress between Oe1 and WT in shoots
Cite This Article
 Copyright © 2023 The Author(s). Published by Tech Science Press.
This work is licensed under a Creative Commons Attribution 4.0 International License , which permits unrestricted use, distribution, and reproduction in any medium, provided the original work is properly cited.
 Downloads
 Citation Tools