
 Submit a Paper
 Propose a Special lssue
 Open Access
ARTICLE

Investigation of GhFAT Genes Related to Seed Oil Content and Fatty Acid Composition in Gossypium hirsutum L.
1 Key Laboratory of Oasis Eco-Agriculture, College of Agriculture, Shihezi University, Shihezi, 832000, China
2 College of Biology and Agricultural Resources, Huanggang Normal University, Huanggang, 438000, China
3 College of Biology and Food Engineering, Anhui Polytechnic University, Wuhu, 241000, China
* Corresponding Authors: Wei Zhang. Email: ; Feng Liu. Email:
# These authors contributed equally to this work
Phyton-International Journal of Experimental Botany 2023, 92(5), 1633-1647. https://doi.org/10.32604/phyton.2023.027542
Received 03 November 2022; Accepted 21 December 2022; Issue published 09 March 2023
 View Full Text
 Download PDF
Abstract
Fatty Acyl-ACP thioesterase (FAT) is a key enzyme controlling oil biosynthesis in plant seeds. FATs can be divided into two subfamilies, FATA and FATB according to their amino acid sequences and substrate specificity. The Upland cotton genome contains 20 GhFAT genes, amongst which 6 genes were of the GhFATA subfamily and 14 of the GhFATB subfamily. The 20 GhFAT genes are unevenly distributed on 14 chromosomes. The GhFATA genes have 5 or 7 exons and the GhFATB genes have 6 or 7 exons. All GhFAT proteins have the conserved Acyl-ACP_TE domain and PLN02370 super family, the typical characteristics of plant thioesterases. Analyses of the expression level of GhFATs and the compositions of fatty acid in 5–60 days-post-anthesis seeds showed that the ratio of saturated fatty acids to unsaturated fatty acids was consistent with the expression profile of GhFATB12, GhFATB3, and GhFATB10; the ratio of monounsaturated fatty acid to polyunsaturated fatty acids was consistent with the expression profile of GhFATA3. The oil contents of mature cottonseeds were positively correlated with the contents of palmitic acid and linolenic acid as well as seed vigor. These results provide essential information for further exploring the role(s) of the specific GhFATs in determining oil biosynthesis and cottonseed compositions.Keywords
Supplementary Material
Supplementary Material FileIn higher plants, the de novo biosynthesis of fatty acids mainly occurs in plastids. The acyl carbon chain of fatty acids is synthesized by adding two carbons each cycle via the cyclic reaction of ‘condensation-reduction-dehydration-reduction’ to finally generate palmityl-ACP (C16:0-ACP). Under the action of β-ketoacyl ACP synthetase II (KASII), C16:0-ACP can extend two carbon atoms to form stearoyl-ACP (C18:0-ACP). Most C18:0-ACP is dehydrogenated by Δ9-stearoyl-ACP dehydrogenase (SAD) to produce monounsaturated C18:1-ACP. The formation of C16:0-ACP, C18:0-ACP, and C18:1-ACP are catalyzed by fatty acyl thioesterase (FAT) to release free C16:0, C18:0, and C18:1, respectively. The most common termination reaction of fatty acid synthesis takes place within plastids by fatty acyl thiolipase [1,2]. After the termination of carbon chain polymerization, free fatty acids with different length of the carbon chain are transported to the cytoplasm, where they are catalyzed by acyl synthase to form fatty acyl-CoA, and then the reextension, desaturation, modification, and synthesis of possible fatty acids are carried out on the endoplasmic reticulum [3–5]. According to the amino acid sequence and substrate preference, FAT is divided into two subfamilies, FATA and FATB [6,7]. In most plants, FATA encodes 18:1-ACP thioesterase, which has a relatively weak effect on C18:0-ACP [8–10] and determines the level of 18:1 output to the plastid. FATB tends to generate saturated acyl-ACP fatty acyl chains. FATB is also involved in the biosynthesis of unsaturated acyl-ACP fatty acids, but in most plants, it is a class of 16:0-ACP thioesterases catalyzing the formation of C16:0 [8,11]. The specificity of fatty acyl-ACP thioesterase (FAT) largely determines the length and the level of unsaturation of most fatty acid chains in plants [12].
At present, FAT genes have been cloned in Arabidopsis [13], sunflower [14], Populus tomentosa [11], Jatropha curcas [15], Castor [16] and cotton [17]. Arabidopsis contains two copies of the FATA gene. The fata double mutant plants created by T-DNA insertion showed decreased content of triacylglycerol and increased the proportion of linolenic acid and erucic acid in seeds [18]. Overexpressing sunflower FATA1 in E. coli resulted in a significant increase in the total fatty acids and free fatty acids [14]. The content of C16:0 in roots, leaves, flowers, and seeds of the Arabidopsis fatb mutants generated by T-DNA insertion decreased by 48%, 42%, 56% and 56%, respectively, and the C18:0 content was reduced by 50% and 30% in leaves and seeds, respectively. The fatb mutants also had a reduced plant growth rate and decreased the survival rate of seeds [19]. Overexpressing the J. curcas FATB1 gene in Arabidopsis increased the content of saturated fatty acids, especially palmitic acid, but decreased the level of unsaturated fatty acids [15].
Cotton is not only the most important natural fiber crop, but also an important source of edible vegetable oil. Cotton kernel oil content in Upland cotton seeds can reach 30%–40%. As an important source of edible vegetable oil, its nutritional components and quality have attracted much attention. Being the oil with a relatively high level of saturated fatty acids and polyunsaturated fatty acids, the storage and nutritional qualities of cottonseed oil have become an increasingly important hot topic. FAT directly determines the carbon chain length of vegetable oils and fatty acid types in higher plants. Therefore, in-depth knowledge on the characteristics of GhFAT expression, and on the regulation of the balance of saturated and unsaturated fatty acids would provide guidance for genetic improvement of the quality of cottonseed oils [20–22]. In this study, we analyzed the cotton GhFAT gene family and the expression patterns of GhFATs in different tissues and cottonseeds from different developmental stages. We found that the cotton varieties with a high expression level of FATB had a high content of C16:0; correspondingly, the seed oil content and seed vigor of these cotton varieties are also high.
2.1 Identification and Bioinformatic Analysis of the GhFAT Genes
The identity of GhFAT genes was based on the annotation information of the Upland cotton accession TM-1 [23] available in CottonGen (https://www.cottongen.org/). We retrieved the CDS (coding sequence), genomic, and peptide sequences of the GhFAT genes. The CDS length, molecular weight (MW), and isoelectric point (pI) of the deduced GhFAT polypeptides were calculated by tools of ExPasy (http://web.expasy.org/protparam/). Subcellular localization was predicted by the PSORT software (https://wolfpsort.hgc.jp/). The chromosome location information of the GhFAT genes was based on the gff3 file of the TM-1 genome sequence [23] and visualized using TBtools. Clustal X and DNAMAN were used to align multiple sequences of GhFAT protein. FAT homologous proteins of Arabidopsis thaliana (AtFATA1: AT3G25110; AtFATA2: AT4G13050; AtFATB: AT1G08510), Arachis hypogaea L. (AhFATA: GU324446.1 and AhFATB: EF117305.1) were downloaded from the National Center for Biotechnology Information (NCBI; http://www.ncbi.nlm.nih.gov/). FAT homologous proteins of Oryza sativa (LOC_Os09g32760.1 and LOC_Os01g31760.1) were downloaded from the rice database (http://rice.plantbiology.msu.edu/index.shtml), FAT homologous proteins of Theobroma cacao L. (TcFATA: EG002853t1; TcFATB1: EG037945t1; TcFATB2: EG014679t1; TcFATB3: EG012529t1; TcFATB4: EG009021t1; TcFATB5: EG028605t1) were downloaded from the Cocoa database (http://www.cacaogenomedb.org). MEGA 6.0 was used to construct the phylogenetic tree with the neighbor-joining method (NJ) and bootstrap analysis (1000 replicates). Gene Structure Display Server 2.0 (GSDS, http://gsds.cbi.pku.edu.cn/) was used for gene structure analysis by aligning the CDS sequences with the corresponding genomic sequences. The Multiple Expectation Maximization for Motif Elicitation (MEME) program (version 5.0.5, http://meme-suite.org/tools/meme) and TBtools were used to identify the conserved motifs in the GhFAT protein sequences. Existence of the Acyl-ACP_TE domain sequences was examined using the Pfam (https://pfam.xfam.org/) and NCBI Conserved Domains databases (http://www.ncbi.nlm.nih.gov/Structure/cdd/wrpsb.cgi). The promoter sequences (up to 2000-bp upstream ATG) of the GhFAT genes were obtained for cis-element analysis using the PlantCARE (http://bioinformatics.psb.ugent.be/webtools/plantcare/html/). Heatmap showing gene expression level was generated by the TBtools software.
2.2 Analysis of Fatty Acid Composition of Cotton Seeds
Xinluzao 33, the major cultivar used cotton production in Xinjiang, was used as the experimental material. The harvested seeds (5, 10, 15, 20, 25, 30, 35, 40, 45, 50, 55 and 60 DPA) were depilated with sulfuric acid, cleaned, dried and ground. After passing 0.5 mm sieve, 1 g sample powder was weighed and transferred into extraction bottle and added 2/3 volume of petroleum ether (30°C–60°C). Crude fat was extracted by Soxhlet extractor. After methylation of the extracted oil using KOH-methanol, the fatty acid composition of cottonseed oil was analyzed by GC-MS QP2020. The temperature was programmed at 40°C (2 min) → 4 °C/min → 240°C (15 min). The oven temperature was 40°C and the inlet temperature was 250°C, with split ratio: 10:1; carrier gas: He; purge flow: 3.0 mL/min. The mass spectrometry conditions were, ion source: EI source; ion source temperature, 200°C; interface temperature, 250°C; solvent delay, 13 min; and mass scan setting, 40 to 500 m/z.
2.3 Determination of the Oil Content and Fatty Acid Composition of Mature Seeds
The experimental materials were mainly Upland cotton cultivars used in Xinjiang and preserved in the laboratory. The seeds were harvested in the summer of 2019, which were delinted by sulfuric acid, cleaned, and dried. In further exploration of the relationship between seed oil content, fatty acid composition, and seed vigor, 9 Upland cotton cultivars were selected, including 3 low-oil cultivars (oil content 11%–15%) (Xinluzao 1, Xinluzao 2 and X-21), 3 medium-oil cultivars (oil-containing 16%–19%) (357, 197 and 282), and 3 high-oil material (oil content >20%) (Xinluzao 41, Xinluzhong 7 and L-29). The total oil content of delinted cottonseed was analyzed undestructively using a wave communication DA7250 Near Infrared analyzer according to Liu et al. [17]. The experiments were done with three biological replicates for each cultivar, and the average value was taken as the cottonseed oil content of the sample.
2.4 Determination of Seed Vitality
The germination test was conducted according to the protocols and procedures defined by the International Seed Testing Association. The standard germination test of cotton seeds was carried out by the culture method. Each germination box tested 100 seeds, and the experiment was repeated three times. Germination was performed in a 28°C incubator with constant water content. The number of germinated seeds was recorded every day, and the fresh weight of the seedlings was measured on the 12th day. The formula used in calculation of germination potential (GP) was
where n1 is the number of seeds germinated on the 4th day, and N is the total number of seeds used in the germination experiment; The final germination rate (FG) was calculated by
where n2 is the number of seeds germinated on the 12th day. Germination index (GI) was
where Gt is the number of seeds germinated on the tth day, Dt is the number of days from the first day to the tth day. Vigor index (VI) was calculated by
where W1 is the fresh weight of seedling on the 12th day after germination [17].
The SPSS 11.5 software was used to statistically analyze the data. The one-way analysis of variance (ANOVA) method was used to test the significance of the germination indexes (p < 0.05), the least significant difference (LSD) tested means at 5% level of significance and all results were represented as the mean ± SE of three replicates.
3.1 The FAT Gene Family in Upland Cotton
A total of 20 GhFAT genes were annotated in the TM-1 genome (Table 1). These genes were randomly distributed on 14 chromosomes, with 10 (3 GhFATAs and 7 GhFATBs) in 7 different At chromosomes and 10 (3 GhFATAs and 7 GhFATBs) in 7 different Dt chromosomes. Chromosomes A08 and D08 each has 4 genes. All the 3 GhFATs of the At subgeome (GhFATA1, GhFATA2, and GhFATA3) or the 3 GhFATs of the Dt subgenome (GhFATA4, GhFATA5, and GhFATA6) are located on chromosome A08 or D08, respectively. The pair of GhFATA2/3 and the pair of GhFATA5/6 each is in a tandem configuration (Fig. 1a, Table 1).
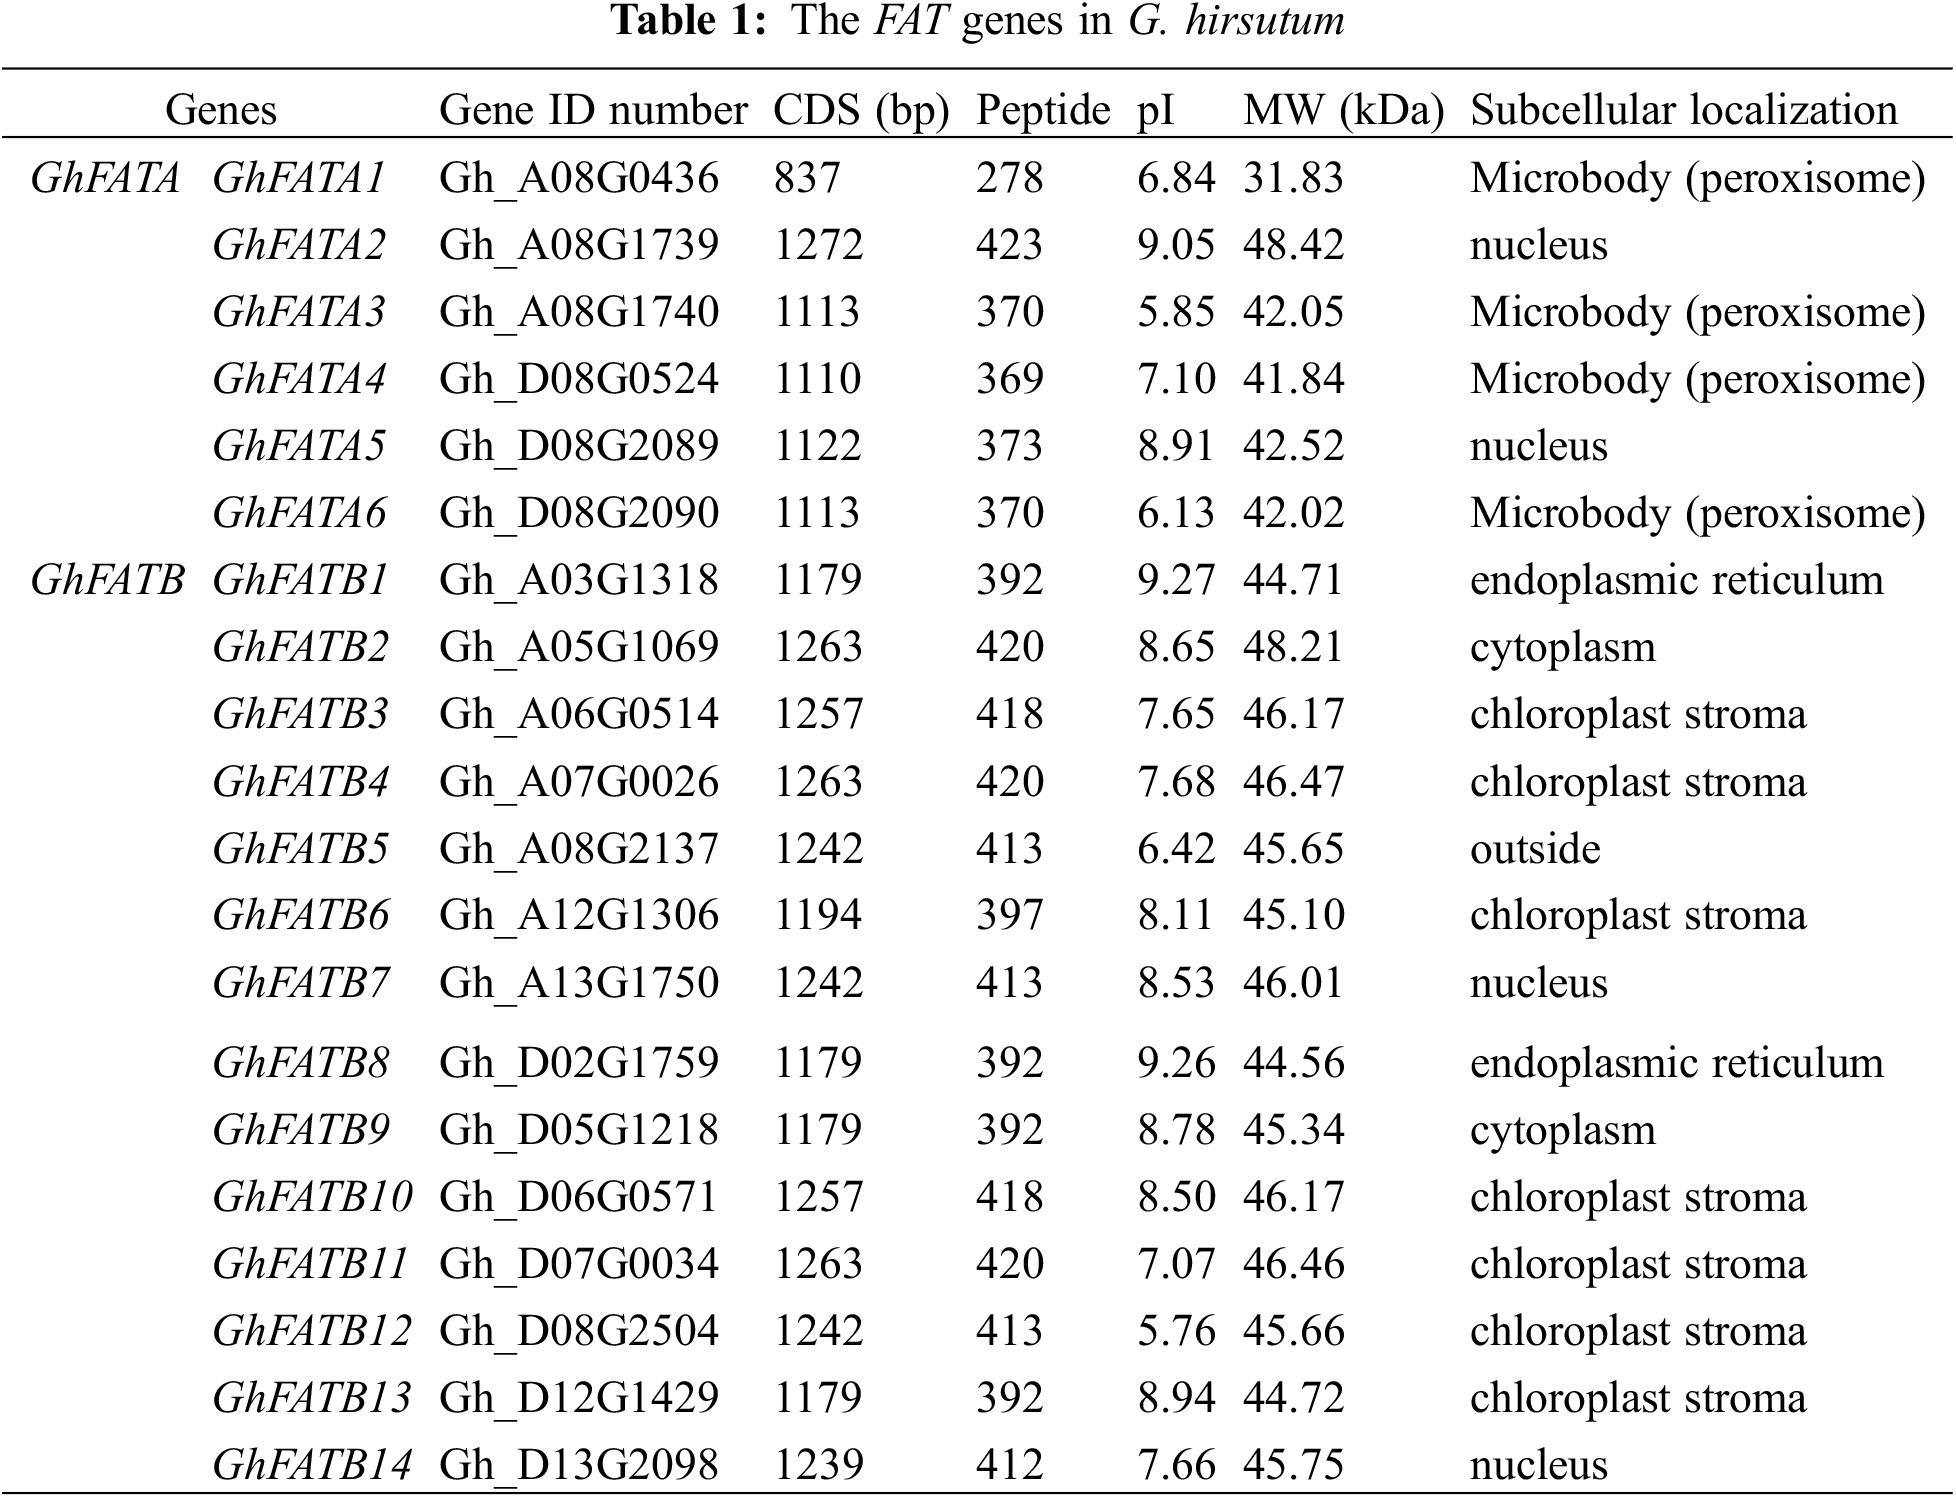
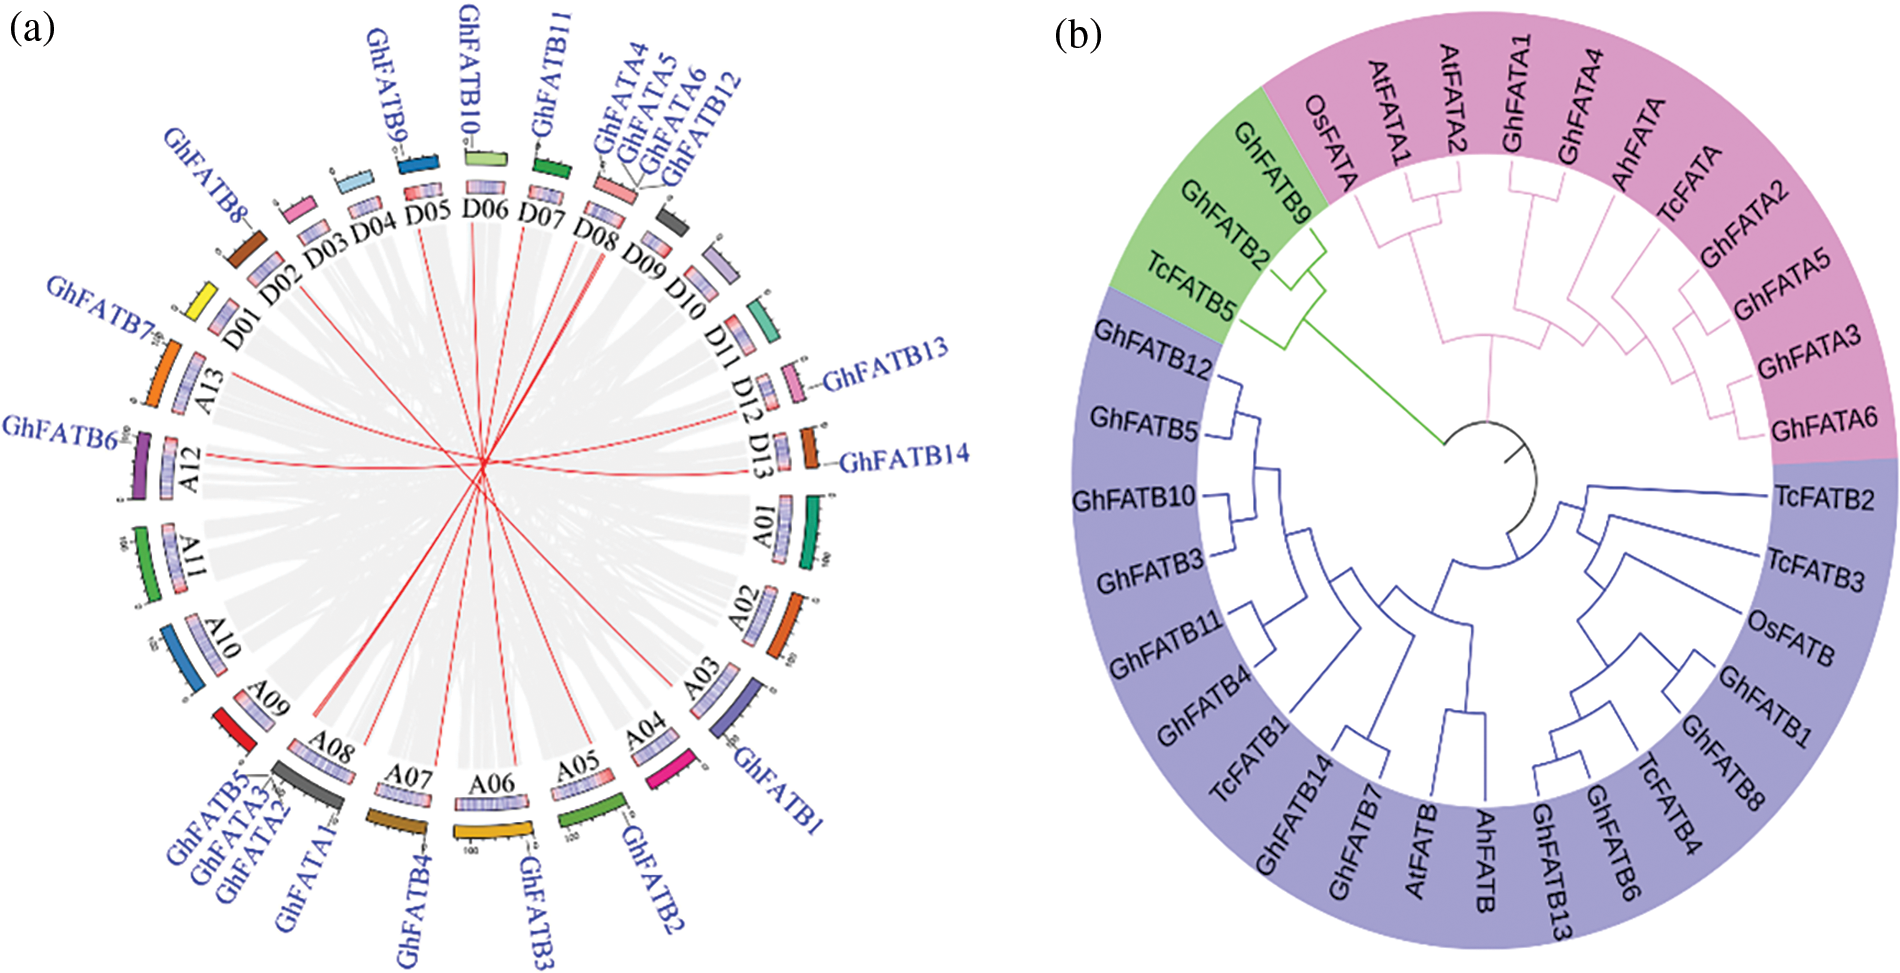
Figure 1: Chromosomal distribution and phylogenetic of the GhFAT genes. (a) The gray line represented all the synonym blocks in G. hirsutum genome, and the red line showed the interchromosomal relationship of GhFATs. The chromosome numbers were displayed in the circle. (b) GhFAT and four other plants protein sequences (Arabidopsis thaliana, O. sativa, T. cacao and Arachis hypogaea) were included to generate the neighbor-joining phylogenetic tree
GhFATs were clustered into three groups based on phylogenetic analysis using the 20 GhFATs and the FATs from Arabidopsis thaliana, O. sativa, T. cacao, and Arachis hypogaea (Fig. 1b). All FATAs, including GhFATAs and FATAs of other species, were classified into Group I, while the FATBs were classified into Group II and Group III, with the latter containing only three, including GhFATB2, GhFATB9 and TcFATB (Fig. 1b). The ORF length of the GhFATs ranged from 837 bp (GhFATA1) to 1272 bp (GhFATA2), encoding 278 to 423 amino acids. The predicted MW ranged from 31.83 to 48.42 kDa and PI was from 5.76 (GhFATB12) to 9.27 (GhFATB1). Based on the prediction of subcellular localization, most GhFATs seem to be located at the chloroplast stroma or microbody (peroxisome) (Table 1).
3.2 Detection of Promoter Cis-Acting Elements and Structural Analysis of GhFATs
The promoter sequences (2,000 bp upstream ATG) of GhFATs were analyzed for cis-elements. We found a total of 513 putative cis-acting elements (Supplementary Table S1). These elements were found to be related to light response, methyl jasmonate (MeJA) response (CGTCA-motif, TCA-element, and TGACG-motif), anaerobic induction (ARE), abscisic acid response (ABRE), gibberellin response (P-box and GARE-motif), low-temperature response (LTR), salicylic acid response (TCA-element), auxin response (TGA-box and TGA-element), defense and stress response (TC-rich repeats), and drought-inducibility (MBS) (Fig. 2b). Analyses of gene structure and motifs showed that each GhFAT has multiple motifs, and multiple exons and introns (Supplementary Fig. S1, Supplementary Table S2). The GhFATA and GhFATB subfamilies seemed to have different gene structure. Of the 6 members of the GhFATA subfamily, all have 7 exons except GhFATA2 that has 5 exons. While for the 14 members in the GhFATB subfamily, all contain 6 exons except GhFATB9 that contains 7 exons (Fig. 2c). All GhFAT proteins have the conserved domains, i.e., Acyl-ACP_TE (Supplementary Table S3) and the PLN02370 super family (Supplementary Table S4), typical members of the plant thioesterase family.
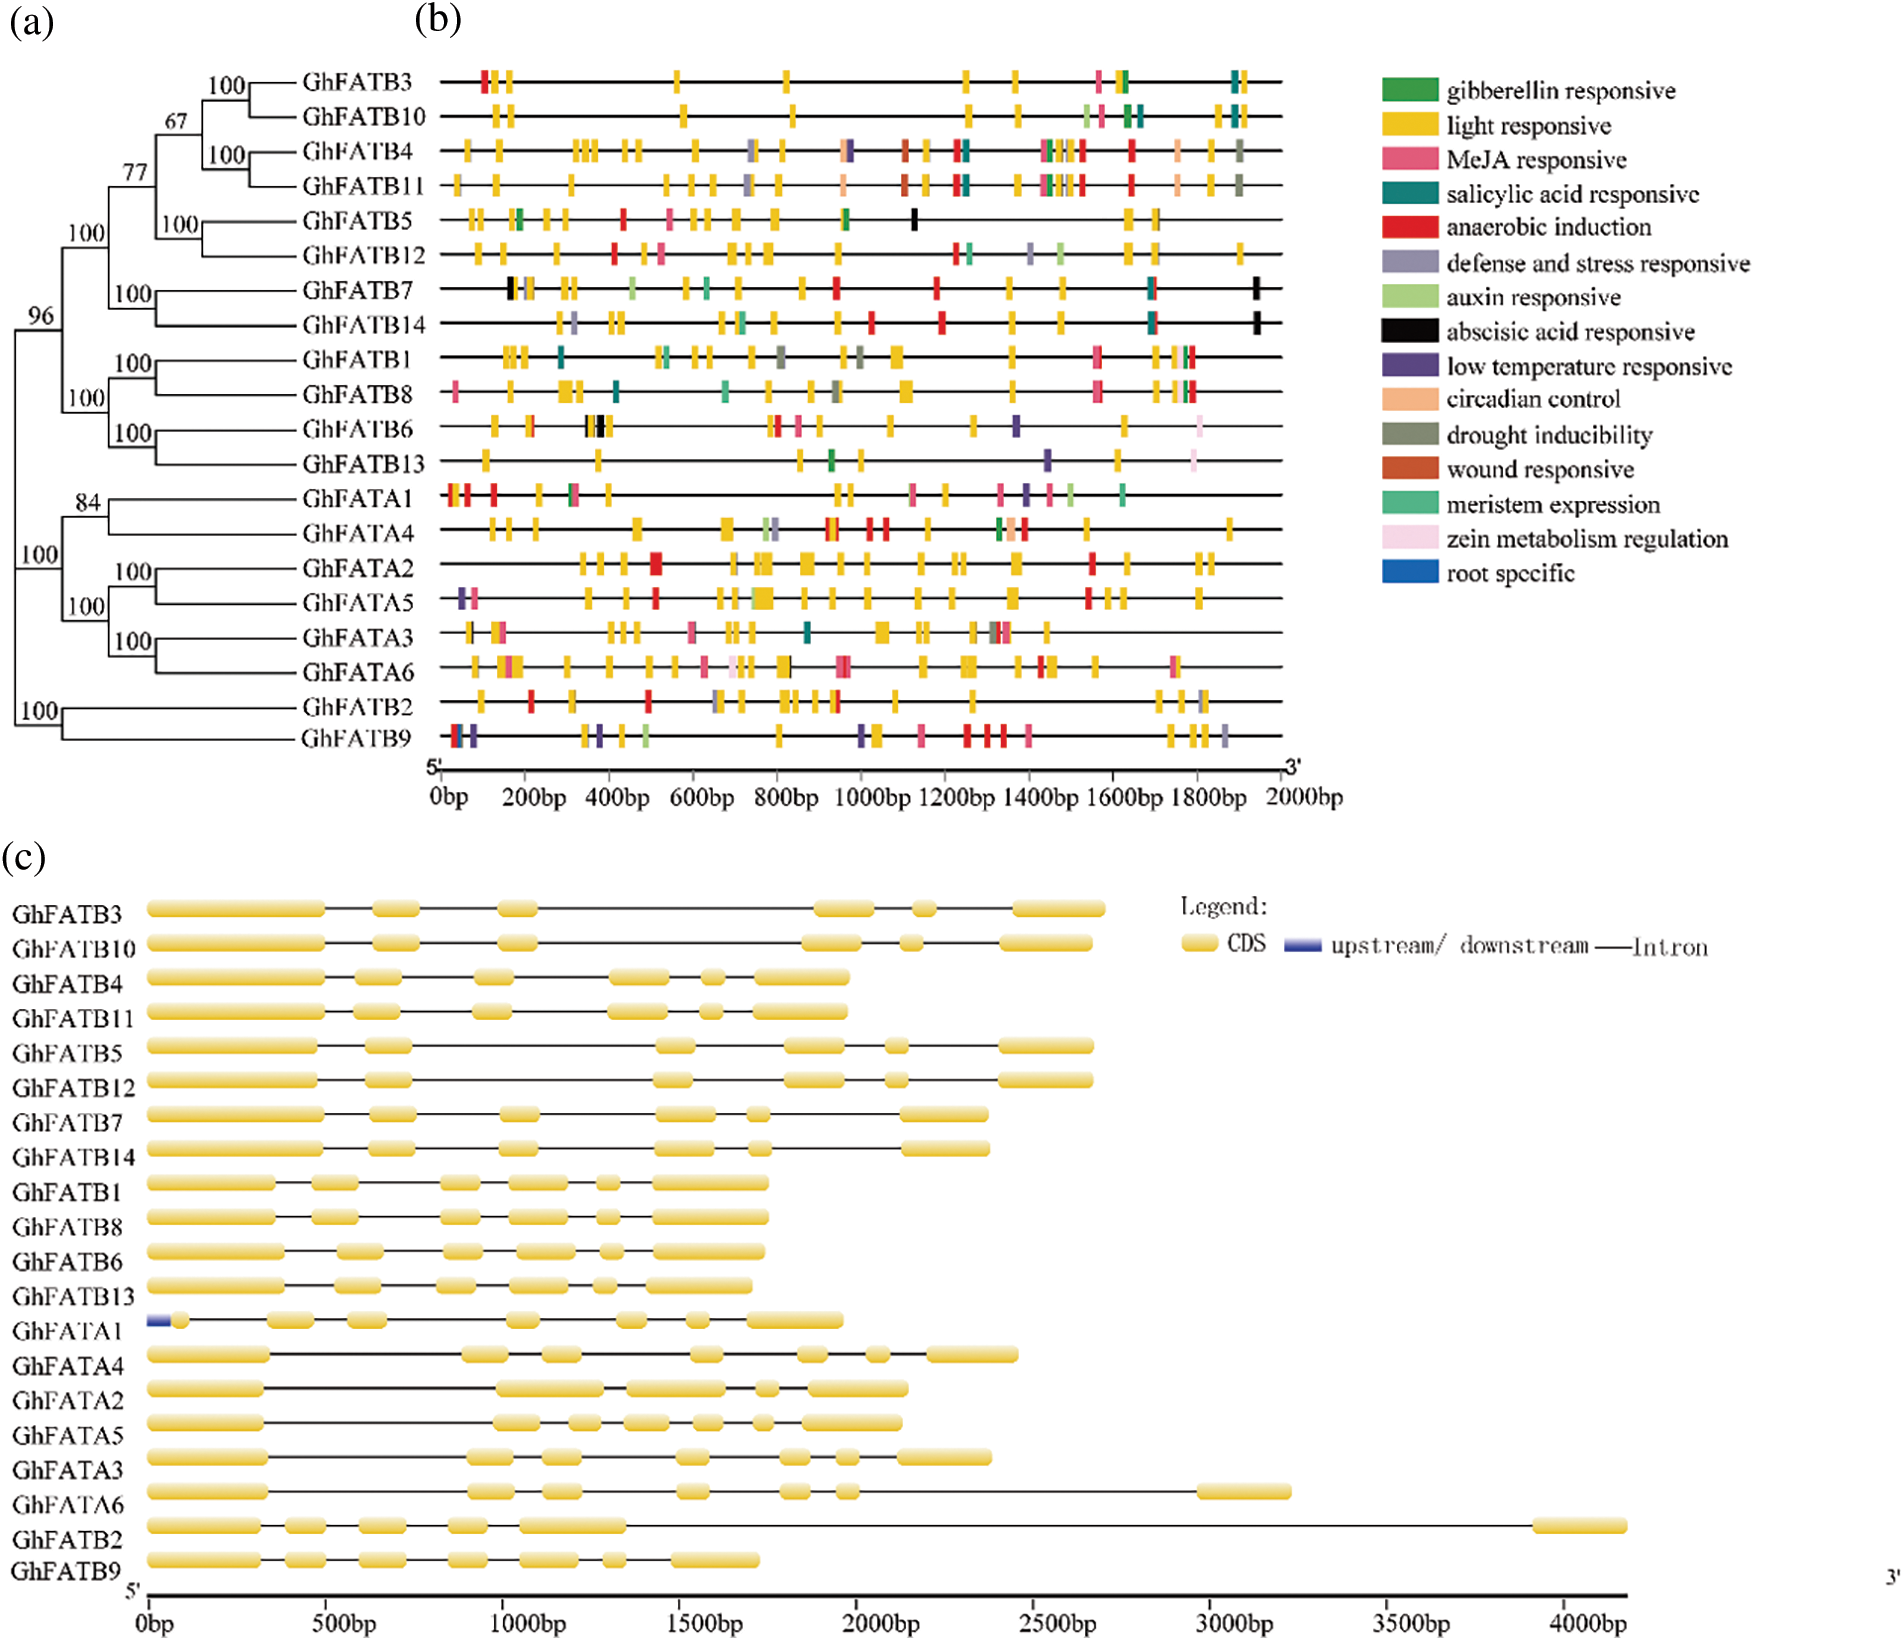
Figure 2: Analysis of the cis-element and structure of exons and introns in the GhFAT genes. (a) Phylogenetic of the GhFAT proteins. (b) The cis-element analysis was conducted with 2000 bp upstream from the initiation codon. The colored boxes indicated different promoter cis-element originals. (c) The structure of exons and introns of each GhFAT gene. Exons were indicated by orange boxes, introns were indicated by black lines between exons, the upstream or downstream UTRs were indicated by blue boxes. The length of the genes were indicted by the scale line at the bottom
3.3 Expression Profile of GhFAT Genes in Different Tissues and Organs
We used the publicly available RNA-seq data (BioProject Accession: PRJNA672231) to study the expression profile of GhFATs in different tissues of cotton, including root, stem, leaf, flower, stamen, gynoecium, and ovary. Of the 20 GhFAT genes, 18 were relatively highly expressed in at least of the tissues analyzed, while GhFATA1 and GhFATA4 were weakly expressed or not expressed in all tissues. In the vegetative tissues, GhFATB5, GhFATB7, GhFATB10, and GhFATB11 were strongly expressed in root, GhFATB13 was highly expressed in stem, and GhFATA6 and GhFATB1 were highly expressed in leaf. In the reproductive tissues, GhFATB9 was strongly expressed in flowers, GhFATB6 and GhFATB14 were highly expressed in the stamen, and GhFATB4 was mainly expressed in the gynoecium. Interestingly, 7 genes, including GhFATA2, GhFATA3, GhFATA5, GhFATB2, GhFATB3, GhFATB8, and GhFATB12 were highly expressed in the ovary (Fig. 3).
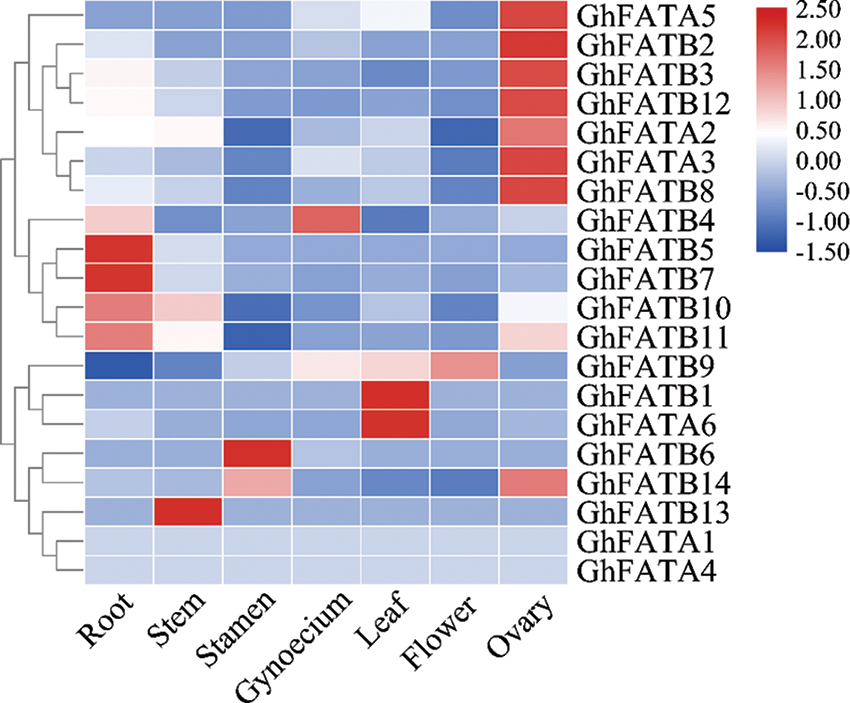
Figure 3: Expression pattern of the GhFAT genes in different tissues of G. hirsutum by the RNA-seq data. Red represents high expression, and blue represents low expression. Each row represented a differentially expressed gene
3.4 Analysis of GhFAT Expression Patterns in Different Developmental Stages of Seeds
We analyzed the transcript level of the GhFATs in 5, 10, 15, 20, 25, 30, 35, 40, 45, 50, 55, and 60 day-post-anthesis (DPA) seeds to identify the key GhFATs involved in seed oil biosynthesis and accumulation. The results showed that GhFATA1, GhFATA4, and GhFATB13 were weakly or not expressed during seed development. Fourteen genes were mainly expressed in 5 to 30 DPA seeds, and 3 genes (GhFATA5, GhFATA6, and GhFATB4) were highly expressed in 55 or 60 DPA seeds. Of the early expressed genes, GhFATA3 and GhFATB1 had the highest expression level in 5 and 10 DPA seeds, respectively. The expression level of GhFATB12, GhFATB5, GhFATB9, and GhFATB2 reached their maximum at 15, 20, 25, and 30 DPA of seed development, respectively (Fig. 4).
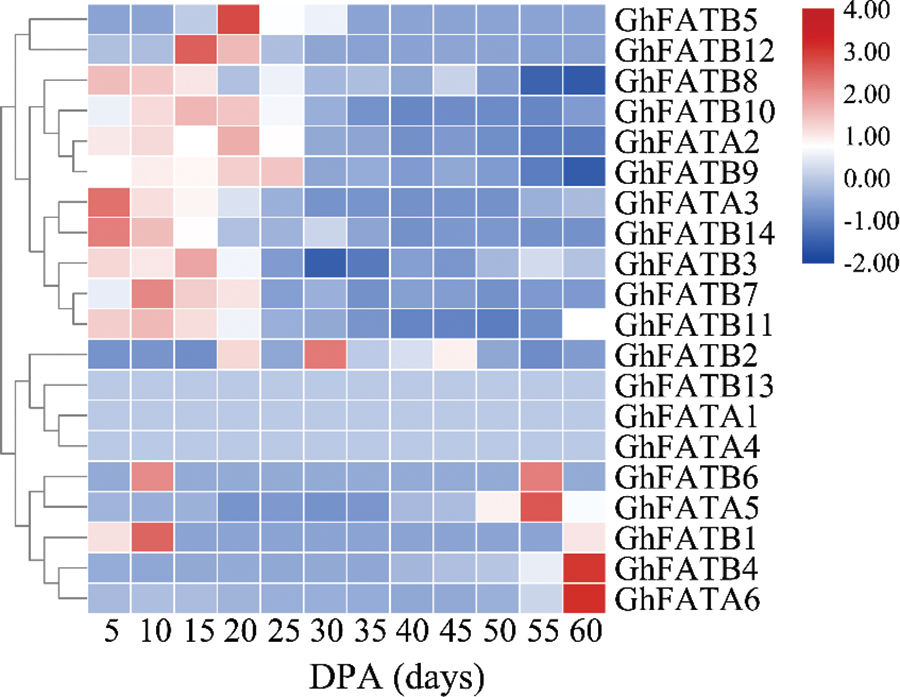
Figure 4: Expression profile of the GhFAT genes in different seed development stages. Red represented high expression, and blue represented low expression. Each row represented a differentially expressed gene. 5–60 represented the seeds harvested from Xinluzao33, respectively. DPA, day post-anthesis
3.5 The Relationship between the Expression of GhFATs and Fatty Acid Composition in Cottonseeds
The extracted crude cottonseed oil was subjected to alkali methyl esterification treatment, and then the fatty acid components of the cottonseed oil were analyzed by GC-MS. After database retrieval analysis and area normalization, the results showed that the main fatty acid components in cottonseeds were palmitate (C16:0), stearate (C18:0), Oleate (C18:l), linoleate (C18:2), and linolenate (C18:3). The ratio of saturated fatty acids to unsaturated fats was decreased from 5 to 10 DPA, and rapidly increased from 10 to 15 DPA to reach its peak at 15 DPA, then gradually decreased from 15 to 30 DPA and remaining relatively stable afterwards. This was consistent with the expression changes of GhFATB12, GhFATB10, and GhFATB3 during seed development (Fig. 5a). The ratio of monounsaturated fatty acids to polyunsaturated fatty acids showed the highest value at 5 DPA, and gradually decreased with the development of seeds, and reached the lowest value at ~35 DPA, then slowly increased for a short period of time and remaining relatively stable afterwards. This was consistent with the expression profile of GhFATA3 during seed development (Fig. 5b).
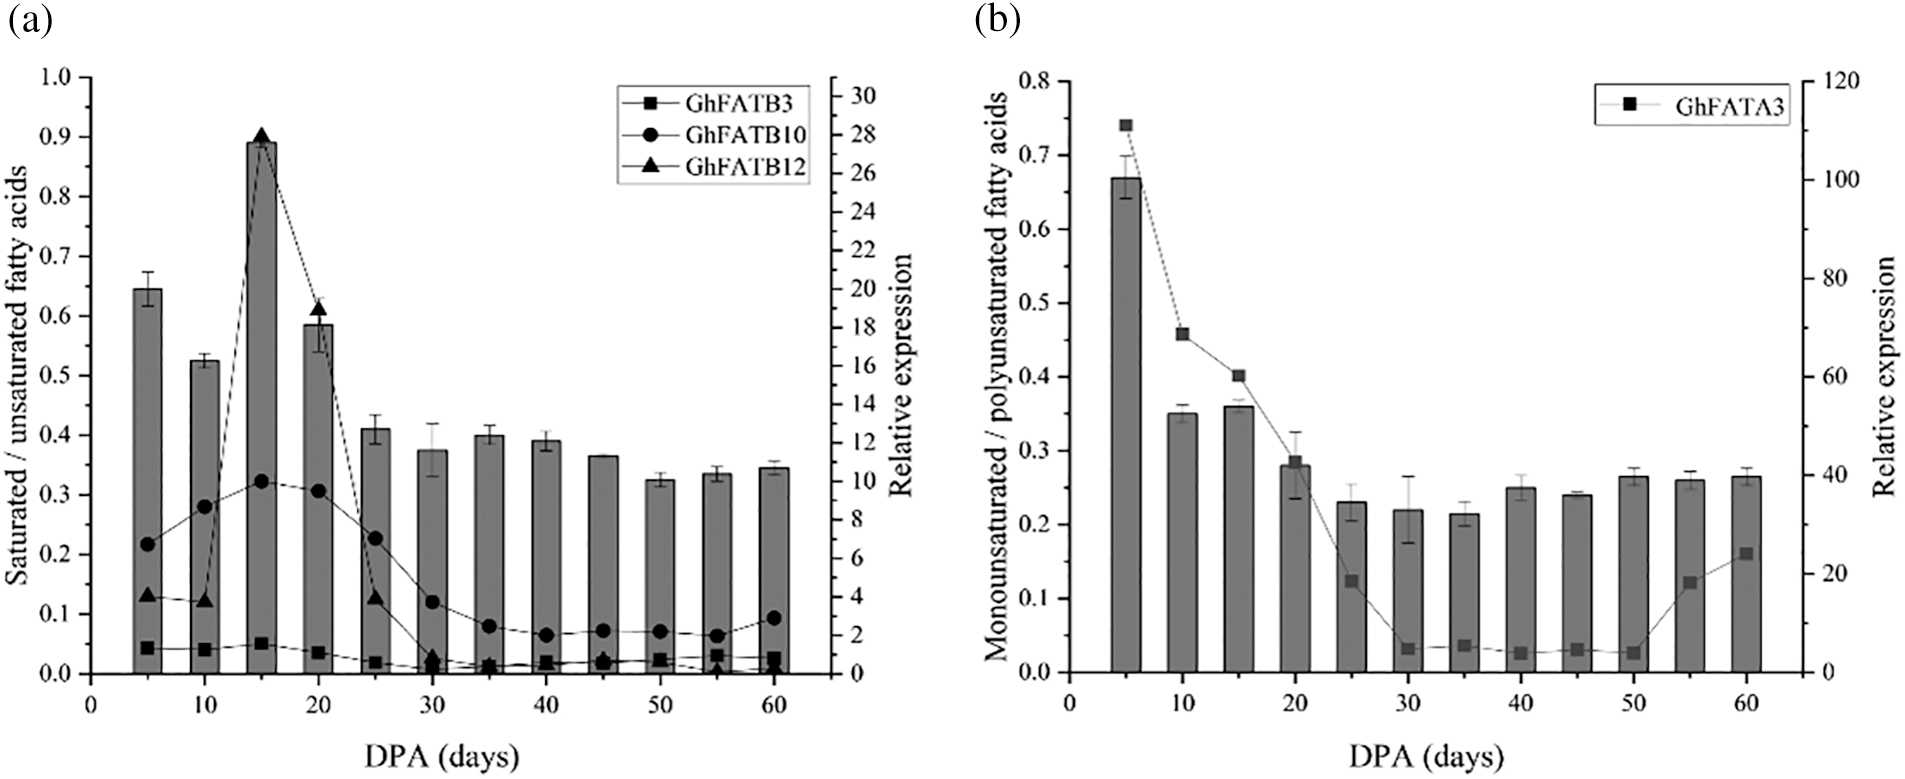
Figure 5: The relationship between GhFAT gene expression and fatty acid composition in different developmental stages of cottonseed. (a) The correlation between saturated/unsaturated fatty acids and gene expression, (b) The relationship between monounsaturated/polyunsaturated fatty acids and gene expression. The bar graph showed the ratio of fatty acid components, and the broken line chart showed the gene expression. The abscissa represented the days to harvest seeds from Xinluzao 33. DPA, day post-anthesis
3.6 Correlation between Seed oil Content and Fatty Acid Composition in Mature Seeds
In order to further explore the relationship between seed oil content and fatty acid composition in Upland cotton seeds, we selected different varieties with low, medium, or high oil content to analyze the oil content and components. In the low oil content (LO) varieties, the seed oil content ranged from 11.35% to 13.98%, with an average of 12.84%. In the medium oil content (MO) varieties, the seed oil content ranged from 17.84% to 17.90%, with an average value of 17.87%. For the high oil content (HO) varieties, the range of seed oil content was 20.92% to 21.47%, with an average of 21.17%.
The fatty acid component analysis showed that the HO varieties had a higher C16:0 content than the LO and MO varieties. The average content of C16:0 in LO, MO, and HO varieties was 20.59%, 22.80%, and 25.29%, respectively. It seemed that the contents of C18:0 (with an average 2.72%, 2.39% and 2.10% in LO, MO, and HO, respectively) and C18:1 (with an average 16.74%, 14.73% and 13.85% in LO, MO, and HO, respectively) were negatively correlated with the content of seed oil content (Fig. 6). With the increase of seed oil content, the proportion of saturated fatty acids and unsaturated fatty acids increased, and the average values of LO, MO and HO were 31.70%, 34.67%, and 39.03%, respectively (Supplementary Table S5). We speculated that the oil content of mature seeds might be correlated with seed vigor.
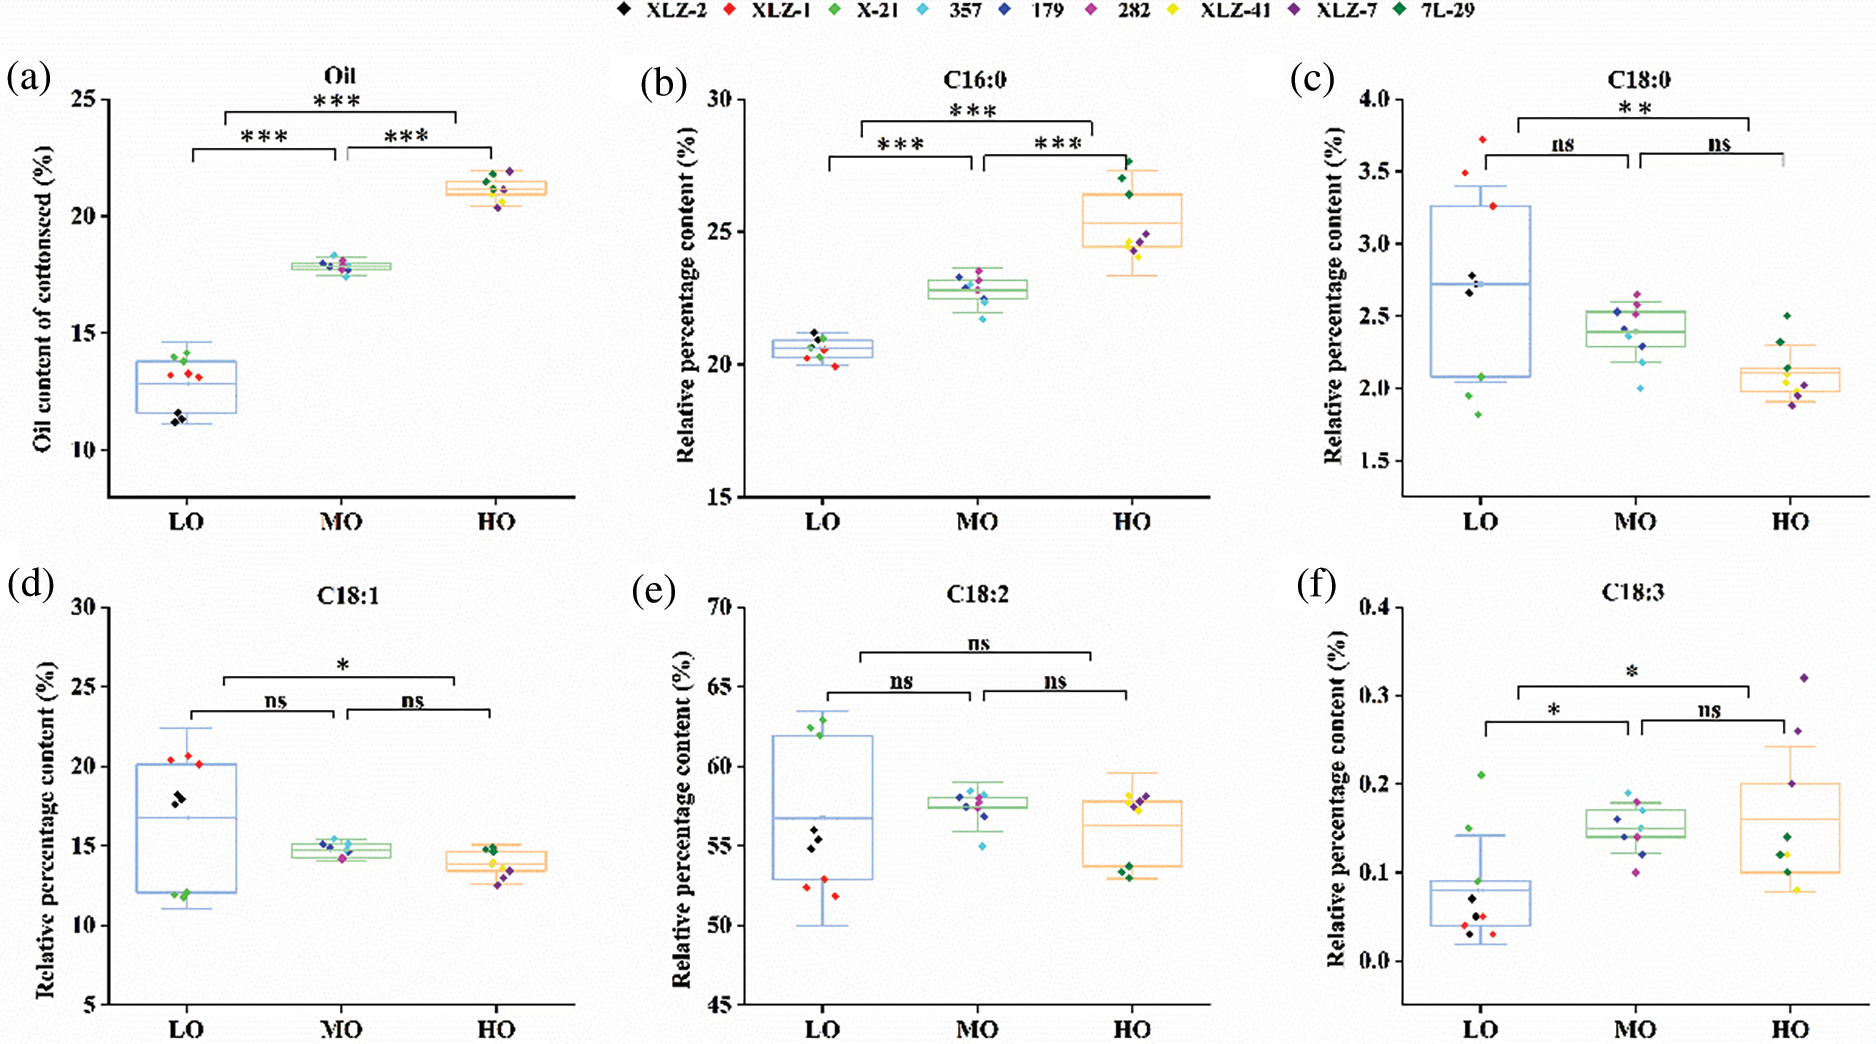
Figure 6: The relative percentage of fatty acid composition and oil content of cottonseed. (a) Oil content of cotton seeds in different varieties. (b–f) Relative percentage of various fatty acids in different cotton seeds. LO, Low oil content; MO, Medium oil content; HO, High oil content; The box shows the average, lower and upper quartiles. C16:0, palmitate. C18:0, stearate. C18:1, oleate. C18:2, linoleate. C18:3, linolenate. The colored dots indicated different cotton varieties and three repetitions; Differences were assessed using one-way ANOVA followed by Tukey’s test (*p < 0.05, **p < 0.01, ***p < 0.001). ns, not significant
3.7 Determination of Seed Vitality
In order to study whether seed oil and fatty acid components affect seed vigor, we compared the germination potential, germination rate, and vigor index of seeds with LO, MO, and HO varieties. The results showed that the germination potential of LO, MO, and HO varieties were 79.00%, 86.00%, and 87.63%, respectively. The germination rates were 97.13%, 97.43%, and 99.3% in LO, MO, and HO varieties, respectively. Germination index gradually increased with the increase of oil content, but there was no significant difference. The vigor index was 16.09%, 19.26%, and 20.24% in LO, MO, and HO varieties, respectively. The seed vigor of MO and HO varieties was higher than that of LO varieties (Table 2 and Supplementary Table S6).
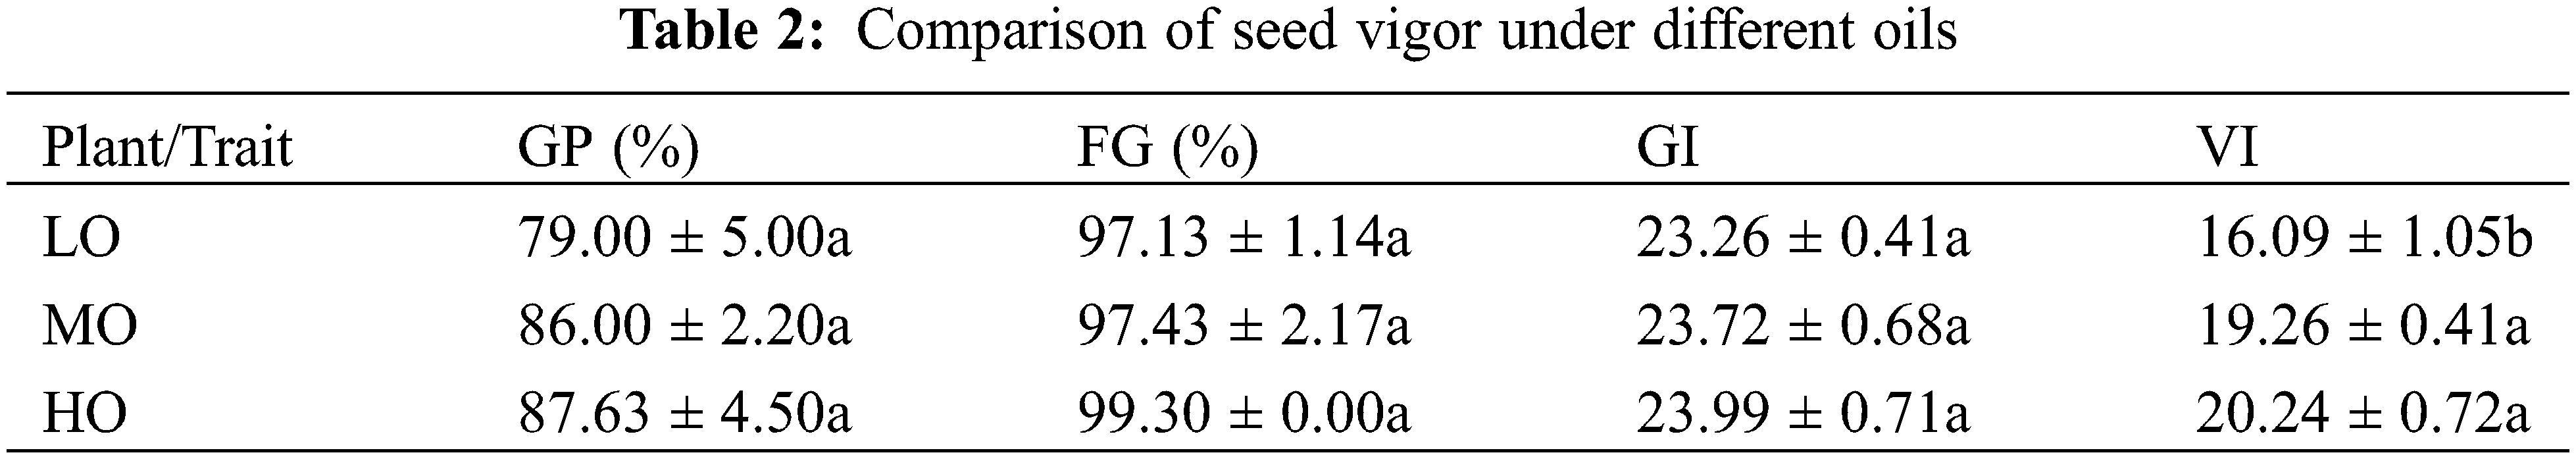
Cotton seed germination experiment was performed at 28°C. Each value was the average value of three replicates. LO, Low oil content; MO, Medium oil content; HO, High oil content; GP, germination potential on the 4th day; FG, final germination rate on the 12th day; VI, Vigor Index. The different letters in the same column indicate differences statistically different (p < 0.05).
Cotton is an important oil crop in the world. The main fatty acid components in cotton are saturated C16:0, monounsaturated C18:1, and polyunsaturated C18:2 [24–27]. The nutritional value and oxidation stability of cottonseed oil largely depend on its fatty acid components. So improving the content and quality of cottonseed oil has become the focus of attention. FAT directly determines the chain length of vegetable oils and the types of fatty acid in higher plants. Therefore, research on the expression of GhFATs and its relationship with seed oil content would provide essential knowledge for regulating the fatty acid components of cotton seed oil.
In this study, we found that the 20 GhFAT genes could be classified into three major branches (Figs. 1b and 2a). Most GhFATs (14) belong to the FATB subfamily, with only 6 GhFATAs, accounting for 30% of the whole gene family (Table 1). More GhFATB members might be related to its importance in oil biosynthesis or indicate an evolutionary history different from GhFATAs [24,28]. Previous study has shown that FATB thioesterase can be divided into two subfamilies, FATB1 and FATB2 [29]. Consistently, GhFATB1 and GhFATB2 belong to two different groups, and the majority of GhFATBs were grouped with GhFATB1 (Fig. 1b). Nevertheless, all GhFATAs and GhFATBs have the conserved Acyl-ACP_TE and PLN02370 super family domains (Supplementary Tables S3 and S4), indicating their functional conservation [30]. GhFATA and GhFATB were clustered together with FATA and FATB of different plants, respectively, which indicated the conservation in sequence and function of the two subfamilies during their evolution (Fig. 1b) [31]. The cis-elements located in the promoter region of the gene play a key role in regulation of gene expression and environmental responses. It showed that the GhFAT promoter sequences contain typical seed-specific expression elements, including the G-box element widely present in various seed specific promoters [28,29] and the seed-specific expression elements AACA [32] and ACGT [33] (Supplementary Table S1), suggesting that these elements might play a role in regulation of the corresponding GhFATs during seed development and consequently oil content of cotton seeds.
Analyses of cottonseed oil compositions and the expression level of GhFAT genes from 12 developmental stages of Upland cotton cultivar Xinluzao 33 found that the ratio of saturated fatty acid to unsaturated fatty acid was correlated with the expression profiles of GhFATB12, GhFATB3 and GhFATB10 (Fig. 5a), and the ratio of monounsaturated fatty acid to polyunsaturated fatty acid was correlated with the expression pattern of GhFATA3 (Fig. 5b). During the development of cotton seeds, the expression level of these GhFATB genes increased rapidly and then decreased slowly in the early developmental stage, with the peak expression level at ~15 DPA. As a result, saturated fatty acids were accumulated to the highest level at the same time point to provide sufficient substrates for the synthesis of unsaturated fatty acids. There are two genes encoding FATA and one gene encoding FATB in the Arabidopsis genome [9,34]. It was found that the total amount of saturated fatty acids in various tissues of the Arabidopsis fatb mutant decreased by 40%–50% compared with that of wild type, as a result of increased fatty acid turnover, leading to slow growth of seedlings [13]. Many studies in Arabidopsis confirmed that FAT was also involved in the production of saturated fatty acids in flowers and seeds [35]. Therefore, FAT genes are crucial for plant growth and development, likely through maintaining the normal physiological characteristics of organisms by controlling the balance of saturated and unsaturated fatty acids.
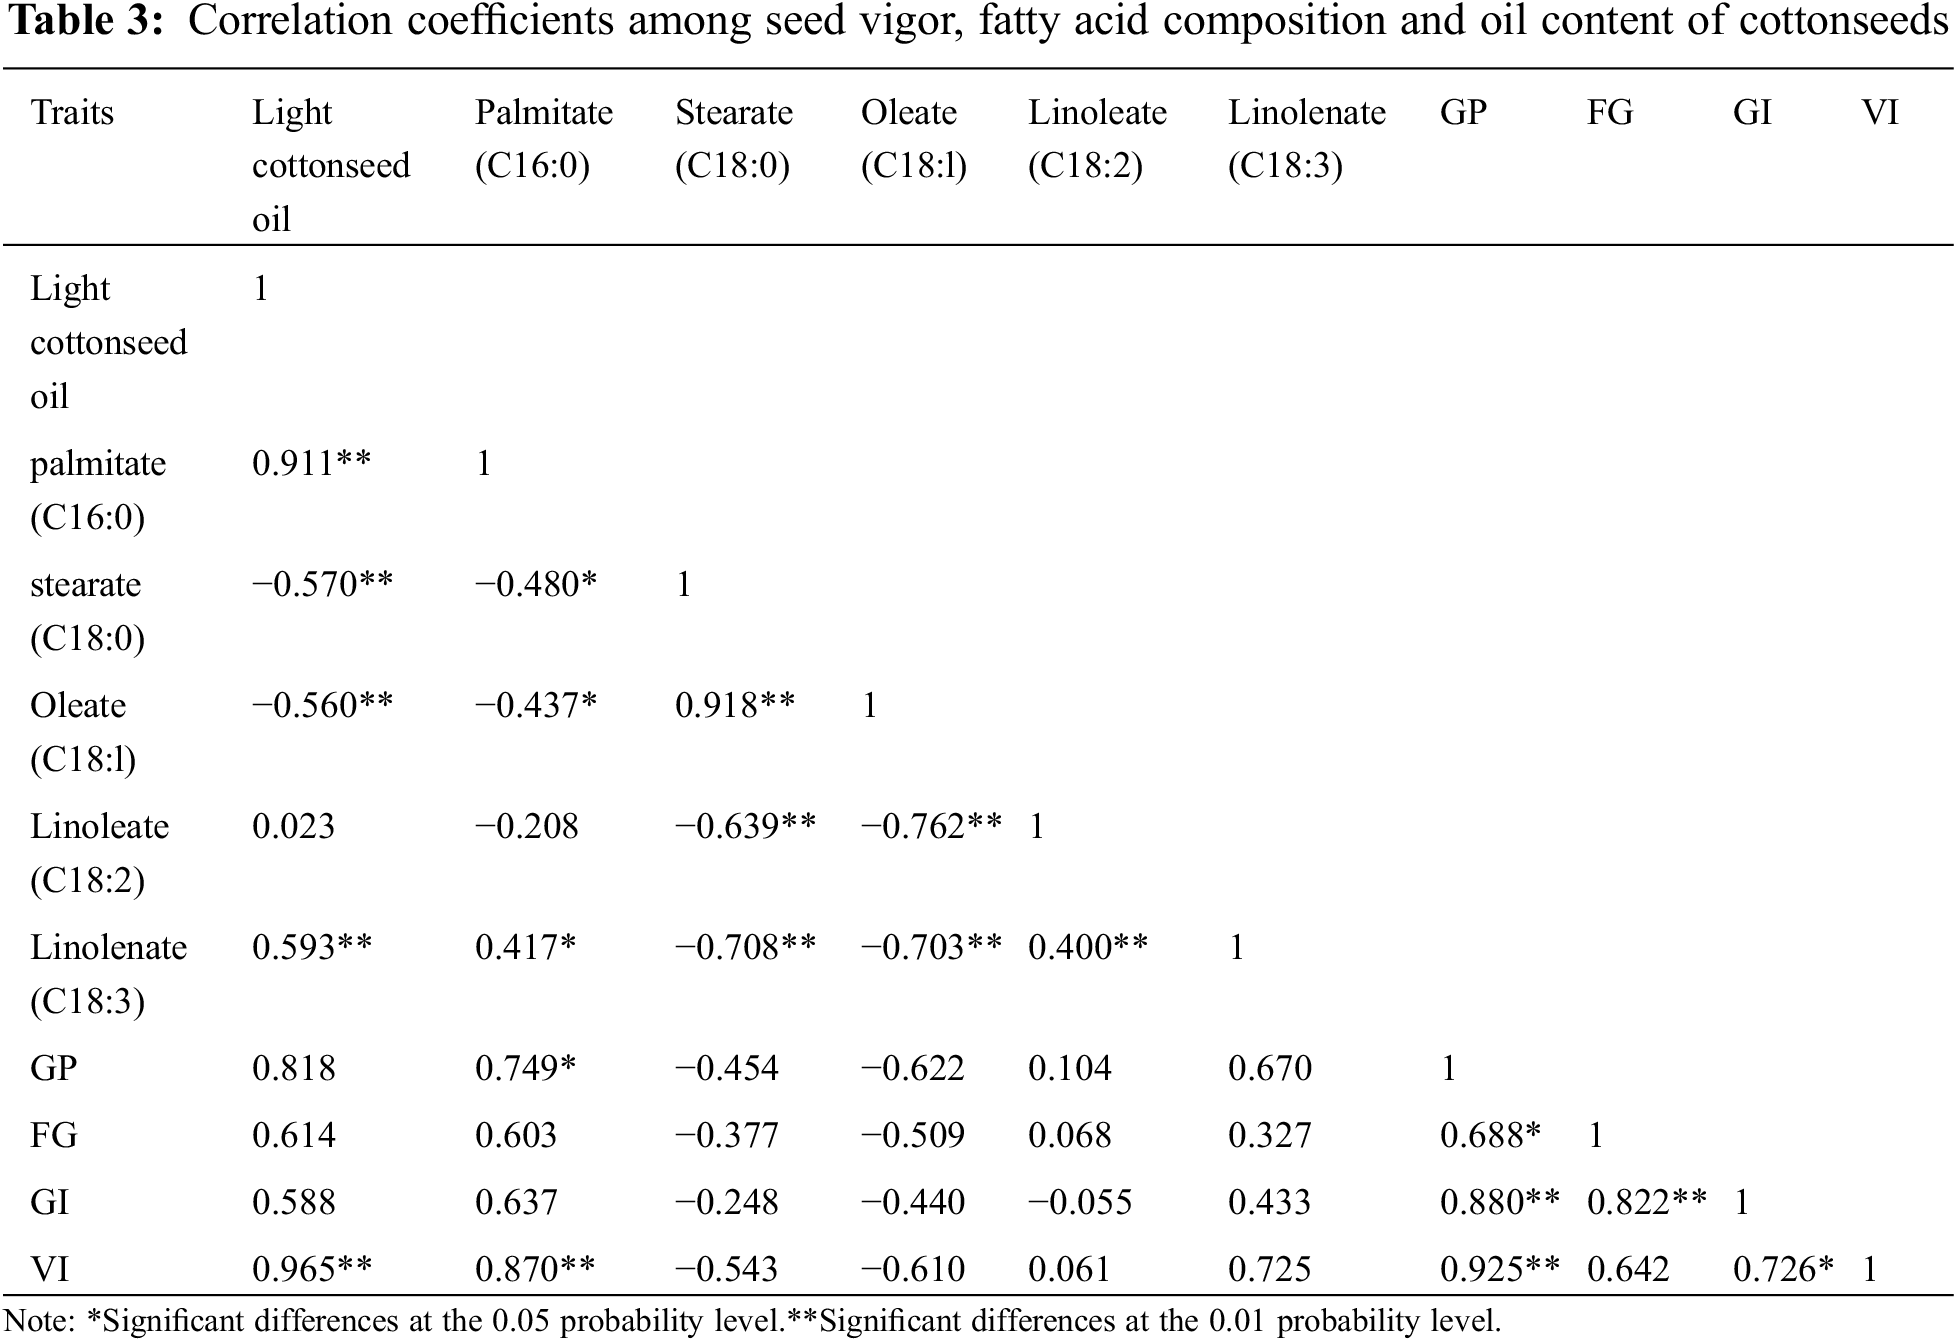
It had been reported that an increase in oleic acid content in transgenic cottonseed resulted in a significant reduction in oil content [17]. In this study, the analyses of the fatty acid compositions of Upland cotton cultivars with different seed oil content showed that the seed oil content was significantly positively correlated with the content of palmitic acid and linolenic acid, and significantly negatively correlated with the content of stearic acid and oleic acid, and that the ratio of saturated fatty acid to unsaturated fat gradually increased with the increase of seed oil content (Table 3). Consistently, it has been shown in rice that the ratio of saturated fatty acids to unsaturated fatty acids in rice bran was highly positively correlated with palmitic acid content, particularly in Indica rice lines [36].
Seed vigor mainly depends on the nutrients accumulated during seed development [37]. This study found that the seeds with a higher oil content tend to have a higher vigor index than those with a low or medium oil content (Table 2 and Supplementary Table S6). Generally, oil consumption during seed germination is related to the types of fatty acids. No study in cotton has investigated the relationship between fatty acid components in mature cotton seeds and seed vigor, although seed germination index has been reported to be decreased for the transgenic seeds with a reduced oil content (mainly palmitic acid and linoleic acid) due to simultaneous silencing of both GhFAD2-1 and GhFATB [17]. It has been reported that unsaturated fatty acids were preferentially used during seed germination [38] and seedling emergence differences are associated with the ratio of saturated to unsaturated fatty acids in mature seeds [39,40]. Seeds with high fatty acid content will first use lipolysis for energy during germination. When water enters the seeds during the germination period, lipase is activated to decompose fat into fatty acids [41,42]. Oil provides energy for seed germination and plays an important role in the growth and development of seedlings. Changes of fat and its composition and content in seeds would affect the normal growth and development of plants because of not only the totally available energy but also the energic components used by various pathways contributing to seed germination. In addition to fatty acids, whether differences in protein and carbohydrate content are also related to germination characteristics remain to be further studied.
Funding Statement: This work was financially supported by the National Natural Science Foundation of China [31960369] and the Project for Crops Breeding of Shihezi University [YZZX201803].
Author Contributions: Z.-Y.F., W.Z., and F.L. designed the experiment. X.-Q.C., T.-W.W., Y.-C.H., F.X. and Z.-Y.F. performed the experiment and took all measurements. X.-Q.C., X.-Y.Z., Y.-J.L. and F.L. analyzed the results. X.-Q.C. wrote the initial manuscript draft with revisions by J.S., and F.L. All authors approved the submitted manuscript.
Conflicts of Interest: The authors declare that they have no conflicts of interest to report regarding the present study.
References
1. Zhao, L., Katavic, V., Li, F., Haughn, G. W., Kunst, L. (2010). Insertional mutant analysis reveals that long-chain acyl-CoA synthetase 1 (LACS1but not LACS8, functionally overlaps with LACS9 in Arabidopsis seed oil biosynthesis. The Plant Journal: For Cell and Molecular Biology, 64(6), 1048–1058. [Google Scholar] [PubMed]
2. Wen, Q., Lei, Y., Huang, J., Jiang, H., Liao, B. (2012). Molecular cloning and characterization of an acyl-ACP thioesterase gene (AhFatB1) from allotetraploid peanut (Arachis hypogaea L.). African Journal of Biotechnology, 11, 14123–14131. [Google Scholar]
3. Koo, A. J., Ohlrogge, J. B., Pollard, M. (2004). On the export of fatty acids from the chloroplast. The Journal of Biological Chemistry, 279(16), 16101–16110. [Google Scholar] [PubMed]
4. Salas, J. J., Martínez-Force, E., Harwood, J. L., Venegas-Calerón, M., Aznar-Moreno, J. A. et al. (2014). Biochemistry of high stearic sunflower, a new source of saturated fats. Progress in Lipid Research, 55, 30–42. [Google Scholar] [PubMed]
5. Aznar-Moreno, J. A., Venegas Calerón, M., Martínez-Force, E., Garcés, R., Mullen, R. et al. (2014). Sunflower (Helianthus annuus) long-chain acyl-coenzyme A synthetases expressed at high levels in developing seeds. Physiologia Plantarum, 150(3), 363–373. [Google Scholar] [PubMed]
6. Ghosh, S. K., Bhattacharjee, A., Jha, J. K., Mondal, A. K., Maiti, M. K. et al. (2007). Characterization and cloning of a stearoyl/oleoyl specific fatty acyl-acyl carrier protein thioesterase from the seeds of Madhuca longifolia (latifolia). Plant Physiology and Biochemistry, 45(12), 887–897. [Google Scholar] [PubMed]
7. Aznar-Moreno, J. A., Venegas-Calerón, M., Martínez-Force, E., Garcés, R., Salas, J. J. (2016). Acyl carrier proteins from sunflower (Helianthus annuus L.) seeds and their influence on FatA and FatB acyl-ACP thioesterase activities. Planta, 244(2), 479–490. [Google Scholar] [PubMed]
8. Salas, J. J., Ohlrogge, J. B. (2002). Characterization of substrate specificity of plant FatA and FatB acyl-ACP thioesterases. Archives of Biochemistry and Biophysics, 403(1), 25–34. [Google Scholar] [PubMed]
9. Beisson, F., Koo, A. J., Ruuska, S., Schwender, J., Pollard, M. et al. (2003). Arabidopsis genes involved in acyl lipid metabolism. A 2003 census of the candidates, a study of the distribution of expressed sequence tags in organs, and a web-based database. Plant Physiology, 132(2), 681–697. [Google Scholar] [PubMed]
10. Moreno-Pérez, A. J., Sánchez-García, A., Salas, J. J., Garcés, R., Martínez-Force, E. (2011). Acyl-ACP thioesterases from macadamia (Macadamia tetraphylla) nuts: Cloning, characterization and their impact on oil composition. Plant Physiology and Biochemistry, 49(1), 82–87. [Google Scholar]
11. Zhou, Z., Zhang, D., Lu, M. (2007). Cloning and expression analysis of PtFATB gene encoding the acyl-acyl carrier protein thioesterase in Populus tomentosa Carr. Journal of Genetics and Genomics = Yi Chuan Xue Bao, 34(3), 267–273. [Google Scholar] [PubMed]
12. Inaba, Y., Nakahigashi, K., Ito, T., Tomita, M. (2017). Alteration of fatty acid chain length of Chlamydomonas reinhardtii by simultaneous expression of medium-chain-specific thioesterase and acyl carrier protein. Phycological Research, 65(1), 94–99. [Google Scholar]
13. Bonaventure, G., Bao, X., Ohlrogge, J., Pollard, M. (2004). Metabolic responses to the reduction in palmitate caused by disruption of the FATB gene in Arabidopsis. Plant Physiology, 135(3), 1269–1279. [Google Scholar] [PubMed]
14. Serrano-Vega, M. J., Garcés, R., Martínez-Force, E. (2005). Cloning, characterization and structural model of a FatA-type thioesterase from sunflower seeds (Helianthus annuus L.). Planta, 221(6), 868–880. [Google Scholar] [PubMed]
15. Wu, P. Z., Li, J., Wei, Q., Zeng, L., Chen, Y. P. et al. (2009). Cloning and functional characterization of an acyl-acyl carrier protein thioesterase (JcFATB1) from Jatropha curcas. Tree Physiology, 29(10), 1299–1305. [Google Scholar] [PubMed]
16. Sánchez-García, A., Moreno-Pérez, A. J., Muro-Pastor, A. M., Salas, J. J., Garcés, R. et al. (2010). Acyl-ACP thioesterases from castor (Ricinus communisL.An enzymatic system appropriate for high rates of oil synthesis and accumulation. Phytochemistry, 71(8–9), 860–869. [Google Scholar]
17. Liu, F., Zhao, Y. P., Zhu, H. G., Zhu, Q. H., Sun, J. (2017). Simultaneous silencing of GhFAD2-1 and GhFATB enhances the quality of cottonseed oil with high oleic acid. Journal of Plant Physiology, 215, 132–139. [Google Scholar] [PubMed]
18. Moreno-Pérez, A. J., Venegas-Calerón, M., Vaistij, F. E., Salas, J. J., Larson, T. R. et al. (2012). Reduced expression of FatA thioesterases in Arabidopsis affects the oil content and fatty acid composition of the seeds. Planta, 235(3), 629–639. [Google Scholar]
19. Bonaventure, G., Salas, J. J., Pollard, M. R., Ohlrogge, J. B. (2003). Disruption of the FATB gene in Arabidopsis demonstrates an essential role of saturated fatty acids in plant growth. The Plant Cell, 15(4), 1020–1033. [Google Scholar] [PubMed]
20. Kim, M. J., Kim, H., Shin, J. S., Chung, C. H., Ohlrogge, J. B. et al. (2006). Seed-specific expression of sesame microsomal oleic acid desaturase is controlled by combinatorial properties between negative cis-regulatory elements in the SeFAD2 promoter and enhancers in the 5′-UTR intron. Molecular Genetics and Genomics: MGG, 276(4), 351–368. [Google Scholar] [PubMed]
21. Qu, J., Mao, H. Z., Chen, W., Gao, S. Q., Bai, Y. N. et al. (2012). Development of marker-free transgenic Jatropha plants with increased levels of seed oleic acid. Biotechnology for Biofuels, 5(1), 10. [Google Scholar] [PubMed]
22. Cao, S., Zhou, X. R., Wood, C. C., Green, A. G., Singh, S. P. et al. (2013). A large and functionally diverse family of Fad2 genes in safflower (Carthamus tinctorius L.). BMC Plant Biology, 13, 5. [Google Scholar] [PubMed]
23. Zhang, T., Hu, Y., Jiang, W., Fang, L., Guan, X. et al. (2015). Sequencing of allotetraploid cotton (Gossypium hirsutum L. acc. TM-1) provides a resource for fiber improvement. Nature Biotechnology, 33(5), 531–537. [Google Scholar] [PubMed]
24. Chandrasekharan, M. B., Bishop, K. J., Hall, T. C. (2003). Module-specific regulation of the beta-phaseolin promoter during embryogenesis. The Plant Journal, 33(5), 853–866. [Google Scholar] [PubMed]
25. Liu, Q., Singh, S. P., Green, A. G. (2002). high-stearic and high-oleic cottonseed oils produced by hairpin RNA-mediated post-transcriptional gene silencing. Plant Physiology, 129(4), 1732–1743. [Google Scholar] [PubMed]
26. Lu, C., Napier, J. A., Clemente, T. E., Cahoon, E. B. (2011). New frontiers in oilseed biotechnology: Meeting the global demand for vegetable oils for food, feed, biofuel, and industrial applications. Current Opinion in Biotechnology, 22(2), 252–259. [Google Scholar] [PubMed]
27. Liu, F., Zhao, Y., Wang, X., Li, Y., Sun, J. (2015). Isolation and functional characterization of seed-specific FAD2-1 promoter from cotton (Gossypium hirsutum L). Journal of Plant Biochemistry and Biotechnology, 24, 369–375. [Google Scholar]
28. Huynh, T. T., Pirtlem, R. M., Chapman, K. D. (2002). Expression of a Gossypium hirsutum cDNA encoding a FatB palmitoyl-acyl carrier protein thioesterase in Escherichia coli. Plant Physiology and Biochemistry, 40, 1–9. [Google Scholar]
29. Jones, A., Davies, H. M., Voelker, T. A. (1995). Palmitoyl-acyl carrier protein (ACP) thioesterase and the evolutionary origin of plant acyl-ACP thioesterases. The Plant Cell, 7(3), 359–371. [Google Scholar] [PubMed]
30. Dong, S., Huang, J., Li, Y., Zhang, J., Lin, S. et al. (2014). Cloning, characterization, and expression analysis of acyl-acyl carrier protein (ACP)-thioesterase B from seeds of Chinese Spicehush (Lindera communis). Gene, 542(1), 16–22. [Google Scholar] [PubMed]
31. Mayer, K. M., Shanklin, J. (2005). A structural model of the plant acyl-acyl carrier protein thioesterase FatB comprises two helix/4-stranded sheet domains, the N-terminal domain containing residues that affect specificity and the C-terminal domain containing catalytic residues. The Journal of Biological Chemistry, 280(5), 3621–3627. [Google Scholar] [PubMed]
32. Washida, H., Wu, C. Y., Suzuki, A., Yamanouchi, U., Akihama, T. et al. (1999). Identification of cis-regulatory elements required for endosperm expression of the rice storage protein glutelin gene GluB-1. Plant Molecular Biology, 40(1), 1–12. [Google Scholar] [PubMed]
33. Niu, X., Adams, C. C., Workman, J. L., Guiltinan, M. J. (1996). Binding of the wheat basic leucine zipper protein EmBP-1 to nucleosomal binding sites is modulated by nucleosome positioning. The Plant cell, 8(9), 1569–1587. [Google Scholar] [PubMed]
34. Mekhedov, S., de Ilárduya, O. M., Ohlrogge, J. (2000). Toward a functional catalog of the plant genome. A survey of genes for lipid biosynthesis. Plant Physiology, 122(2), 389–402. [Google Scholar] [PubMed]
35. Dörmann, P., Voelker, T. A., Ohlrogge, J. B. (2000). Accumulation of palmitate in Arabidopsis mediated by the acyl-acyl carrier protein thioesterase FATB1. Plant Physiology, 123(2), 637–644. [Google Scholar]
36. Goffman, F. D., Pinson, S., Bergman, C. (2003). Genetic diversity for lipid content and fatty acid profile in rice bran. Journal of the American Oil Chemists’ Society, 80(5), 485–490. https://doi.org/10.1007/s11746-003-0725-x [Google Scholar] [CrossRef]
37. Peng, F. Y., Weselake, R. J. (2011). Gene coexpression clusters and putative regulatory elements underlying seed storage reserve accumulation in Arabidopsis. BMC Genomics, 12(1), 286. https://doi.org/10.1186/1471-2164-12-286 [Google Scholar] [PubMed] [CrossRef]
38. Mostafa, M. M., Rahma, E. H., Rady, A. H. (1987). Chemical and nutritional changes in soybean during germination. Food Chemistry, 23(4), 257–275. https://doi.org/10.1016/0308-8146(87)90113-0 [Google Scholar] [CrossRef]
39. Linder, C. R. (2000). Adaptive evolution of seed oils in plants: Accounting for the biogeographic distribution of saturated and unsaturated fatty acids in seed oils. The American Naturalist, 156(4), 442–458. https://doi.org/10.1086/303399 [Google Scholar] [PubMed] [CrossRef]
40. Menard, G. N., Moreno, J. M., Bryant, F. M., Munoz-Azcarate, O., Kelly, A. A. et al. (2017). Genome wide analysis of fatty acid desaturation and its response to temperature. Plant Physiology, 173(3), 1594–1605. https://doi.org/10.1104/pp.16.01907 [Google Scholar] [CrossRef]
41. Sanyal, A., Decocq, G. (2016). Adaptive evolution of seed oil content in angiosperms: Accounting for the global patterns of seed oils. BMC Evolutionary Biology, 16(1), 187. https://doi.org/10.1186/s12862-016-0752-7 [Google Scholar] [PubMed] [CrossRef]
42. Cai, L., Sutter, B. M., Li, B., Tu, B. P. (2011). Acetyl-CoA induces cell growth and proliferation by promoting the acetylation of histones at growth genes. Molecular Cell, 42(4), 426–437. https://doi.org/10.1016/j.molcel.2011.05.004 [Google Scholar] [PubMed] [CrossRef]
Supplementary Materials
Supplementary Figure S1: Motif pattern of the GhFAT genes. Motif analysis was performed by the MEME suite. TBtools software detected 20 patterns and displayed them in a color-coded box. The length of the protein is indicated by the scale ruler at the bottom
Supplementary Table S1: Putative promoter cis-acting elements of GhFATs
Supplementary Table S2: Information of the 20 motifs of GhFAT proteins
Supplementary Table S3: Information on the conserved domain of Acyl-ACP_TE in the 20 GhFAT proteins
Supplementary Table S4: Information on the conserved domain of the PLN02370 superfamily in the 20 GhFAT proteins
Supplementary Table S5: Analysis of fatty acid composition ratio of cottonseeds
Supplementary Table S6: Comparison of seed vigor of different cultivars with different seed oils
Cite This Article
 Copyright © 2023 The Author(s). Published by Tech Science Press.
This work is licensed under a Creative Commons Attribution 4.0 International License , which permits unrestricted use, distribution, and reproduction in any medium, provided the original work is properly cited.
 Downloads
 Citation Tools