
 Submit a Paper
 Propose a Special lssue
 Open Access
ARTICLE

Assessment of Nutrient Leaching Losses and Crop Uptake with Organic Fertilization, Water Saving Practices and Reduced Inorganic Fertilizer
1 Institute of Agricultural Resources and Environment, Ningxia Academy of Agriculture and Forestry Sciences, Yinchuan, 750002, China
2 Faculty of Agricultural Sciences and Technology, Bahauddin Zakariya University, Multan, 60800, Pakistan
3 College of Agriculture, University of Layyah, Layyah, 31200, Pakistan
4 Key Laboratory of Nonpoint Source Pollution Control, Ministry of Agriculture, Institute of Agricultural Resources and Regional Planning, Chinese Academy of Agricultural Sciences (CAAS), Beijing, 100081, China
* Corresponding Authors: Xuejun Zhang. Email: ; Hongbin Liu. Email:
# The authors have contributed equally, should be considered as 1st authors
Phyton-International Journal of Experimental Botany 2023, 92(5), 1555-1570. https://doi.org/10.32604/phyton.2023.026735
Received 22 September 2022; Accepted 05 December 2022; Issue published 09 March 2023
 View Full Text
 Download PDF
Abstract
The increasing world population has forced excessive chemical fertilizer and irrigation to complete the global food demand, deteriorating the water quality and nutrient losses. Short-term studies do not compile the evidences; therefore, the study aimed to identify the effectiveness of reduced doses of inorganic fertilizer and water-saving practices, hence, a six-year experiment (2015–2020) was conducted in China to address the knowledge gap. The experimental treatments were: farmer accustomed fertilization used as control (525:180:30 kg NPK ha−1), fertilizer decrement (450:150:15 kg NPK ha−1), fertilizer decrement + water-saving irrigation (450:150:15 kg NPK ha−1), application of organic and inorganic fertilizer + water-saving irrigation (375:120:0 kg NPK ha−1 + 4.5 tones organic fertilizer ha−1), and application of controlled-release fertilizer (80:120:15 kg NPK ha−1). Each treatment was replicated thrice following a randomized complete block design. The results achieved herein showed that control has the highest losses in the six-year study for total nitrogen (225.97 mg L−1), total soluble nitrogen (121.58 mg L−1), nitrate nitrogen (0.93 mg L−1), total phosphorus (0.57 mg L−1), and total soluble phosphorus (0.57 mg L−1) respectively. Reduced fertilizer and water application improved crop nutrient uptake, nitrogen concentration was significantly enhanced with organic and inorganic fertilizer + water-saving irrigation, P concentration was increased with fertilizer decrement + water-saving irrigation, and K concentration was improved with fertilizer decrement + water-saving irrigation. Hence, this study concludes that reduced inorganic fertilizer dose combined with water-saving practices is significantly helpful in reducing nutrient leaching losses and improving nutrient uptake and water pollution. Further studies are needed to explore the impacts of reduced fertilization and water-saving irrigation on leaching losses. The benefits at different climatic conditions, soil types, and fertilizer types with application methods are also a research gap.
Keywords
Supplementary Material
Supplementary Material FileThe world population is estimated to increase by 1.7 billion between now and 2050, giving rise to food and water security challenges [1]. China has to feed 18% of the global population with 6% of global water resources and 9% of global arable land [2]. The demand for rapid population growth for agricultural production is usually fulfilled by applying chemical fertilizers [3]. China consumes nearly 35% of the global chemical fertilizers to achieve high crop yield and satisfy the food demand [4]. However, it has been reported that the plants consume only 30%–40% of the applied fertilizers, and the remaining results in nutrient losses causing water, soil, and environmental pollution [5]. Excessive use of chemical fertilizers causes harmful algae in the water, soil acidification, high N2O emissions, and soil organic matter deterioration [6]. Non-point pollution also contributes to environmental pollution, its major sources include return flow from irrigated lands, agriculture and silviculture runoff [7], fertilization of cropland, and livestock and poultry waste disposal [8].
Large portions of agrochemicals find their fate at the surface and in groundwater, resulting in poor global water quality and aquatic system deterioration [3]. Literature reported that agricultural production caused huge total N (30.3%–34.6%) and total P (79.9%–82.8%) pollution in Ninghe County during 2004–2007. Moreover, at the Yanhe River watershed, about 59% of total N and 33.6% of total P pollution was reported due to agricultural activities [9]. At present, eutrophication is a problem in more than 60% of lakes in China [10]. Eutrophication causes algal blooms, releases toxic substances, and threats fishes and aquatic life. Moreover, eutrophication in freshwater bodies can adversely affect the drinking water quality causing a health hazard to humans consuming water. Therefore, it is a need to minimize the entry of nutrients into the water for a sustainable environment [9].
In this scenario, the improvement in fertilization and irrigation management practices needs to be adopted to reduce the entry of N into surface and groundwater [11], and protect water resources [9]. Due to the temporal and spatial variability in crop nitrogen (N) intake, managing N to reach maximum yield potential while limiting environmental losses is difficult [12]. Moreover, the improved plant nutrient uptake also reduces nutrient loss [13]. This is the major cause of increasing the studies on improving agricultural operations, especially focusing on the irrigation methods that reduce the amount of N entering groundwater and surface waters [11]. Corn (Zea mays L.) is one of the major field crops, cultivated in approximately 4.2 × 10⁷ ha in China and ranking third among the highest corn-producing countries [14]. The Ningxia Plain is a developing area located upstream of the Yellow River. The agricultural land is primarily irrigated using Yellow River water [13]. The water availability for agriculture is reducing due to increased industrialization and urbanization, lake shrinkage, rising riverbeds, and a drop in the groundwater table in some areas of China. Considering these aspects, China has introduced water-saving policies and irrigation to ensure efficient waste usage and increase land and water productivity [15]. Due to high agricultural production demand, the farmers prefer high fertilization and irrigation practices resulting in water pollution [16]. Nutrient loss is an open challenge in the application of chemical fertilizers. Therefore, it is essential to avoid excessive fertilizer use and identify suitable nutrient doses for corn [5].
The lack of consecutive year-round investigations on N leaching at the field scale is the key factor for the current divergent study to reduce the water application in the agroecosystem. The scientific question considered was to assess how the reduced fertilization will affect losses under water saving conditions in the long-term. We consequently conducted a six-year field experiment in the Yellow River Irrigation Region of Ningxia Plain, China. The objectives of the study are to: (i) examine the nutrient leaching losses at three stages of corn (jointing stage, big trumpet stage, and after harvest) throughout the cropping season, (ii) study the leaching flux dynamics of N, and P during the investigation period, and (iii) propose suitable fertilization and irrigation practices to minimize nutrient leaching losses and improve nutrients uptake. The study has some limitations depending on the soil and fertilizer type, climatic zones, and use of organic fertilizer type.
A six-year-long field experiment was performed at Nongfeng village (42.32°N, 106.65°E) Wanghong, District Yongning, Ningxia, China. The area is located at an altitude of 1108 m and in arid to semi-arid plains. With the aims mentioned above, corn (Zea mays) cv. Xianyu 335 was cultivated once a year from April 2015–October 2020. According to the USDA system, the soil was identified as heavy loam.
Keeping the local conditions in view, five treatments were applied in three replicates following a randomized complete block design (RCBD). The plot size was maintained at 8 m × 6 m (length x width), and corn seeds were sown. The treatments were: farmer accustomed fertilization (CON, 525:180:30 kg NPK ha−1) as control, fertilizer decrement (KF: 450:150:15 kg NPK ha−1), fertilizer decrement + water-saving irrigation (BMP1, 450:150:15 kg NPK ha−1), application of organic and inorganic fertilizer + water-saving irrigation (BMP2, 375:120:0 kg NPK ha−1 + 4.5 tones organic fertilizer ha−1 as commercial chicken manure), and application of controlled-release fertilizer (BMP3, 180:120:15 kg NPK ha−1). The treatments received the fertilizers in the form of urea (CH4N2O; 46% N), triple superphosphate (46% P2O5), potassium sulfate (50% K2O), and controlled-release fertilizer is coated urea (total nutrient ≥42%). Details for types of fertilizers, sources, composition, and application time are given in the supplementary file (Table S1).
Organic fertilizer, P, K, and controlled-release fertilizer were all applied in the base (ploughing after spreading), and N fertilizer was applied in the base of 60%. Topdressing was divided into two times, the first time at 20% (strip application) and the second time at 20% (spreading). Conventional irrigation treatments (CON, KF, and BMP3) received about 1300 m3 ha−1 irrigation volume each time. The volume of water in water-saving irrigation treatment (BMP1, BMP2) was 910 m3 ha−1 each time. The irrigation volume for winter irrigation was 1,800 m3 ha−1. In 2017, due to drought, the crop was irrigated 4 times (thrice in the corn growth period and once in winter). The irrigation volume of the first conventional irrigation treatment was 1,050 m3 ha−1, while for water-saving irrigation treatment, water volume was maintained at 735 m3 ha−1 every time. Whereas, the irrigation volume of the second, third, and winter irrigation was the same as that of 2016 and 2018. Irrigation volume was measured by the water meter. Details for corn planting, harvest, fertilization, irrigation date, and leaching time are given in the supplementary file (Table S2).
Corn (cv. Xianyu 335) was transplanted in the field with (row × plant) spacing of 60 × 22.2 cm, respectively, and the plant density was 82,500 ha−1 [17]. Conventional field practices, including manual weed control and pesticide application, were followed. Groundwater was used for irrigation purposes. The crop was harvested at maturity.
Lysimeter was used to collect the water leachate samples. The soil column in the lysimeter was 160 cm in length, 80 cm in height, and 60 cm in width. The soil inside the lysimeter was separated by plastic cloth, and a leaching barrel (40 cm in diameter and 35 cm in height) was placed beneath the lysimeter. The lid for the leaching barrel was covered with two layers of 80 mesh nylon and 3 cm thick quartz sand. When the leachate reaches at a depth of 80 cm, the leachate in the upper soil enters the leaching barrel due to gravity. In the leaching barrel, a connecting tube was inserted into the soil surface to allow the leachate to be pumped out with a vacuum pump and provide the leaching barrel for cleaning [18].
The leaching water (LW) samples were collected to analyze nutrient concentration. LW samples were collected at different plant growth stages, including the jointing stage (JS), big trumpet stage (BTS), and after harvest (AT; also known as winter irrigation). To minimize the standard error, three LW samples were collected and analyzed for TN, total soluble N (TSN), nitrate nitrogen (NO3−-N), ammonium nitrogen (NH4+-N), total P (TP), and total soluble P (TSP). TN was measured by the potassium persulfate-UV-VIS spectrophotometer (UV-1780, SHIMADZU, China), TSN, NH4+-N, and NO3−-N were analyzed by the continuous-flow analyzer (AA3, BRAN + LUEBBE, Germany) [13,19], total P was estimated, and TSP was determined by the method described in [20,21].
2.4 Plant Nutrient Analysis and Grain Yield
To determine the nutrient concentration in corn straw and grain, the samples from each plot were collected, dried, ground, and the homogenized mixture was digested and filtered. TN, TP, and TK concentrations were measured using Kjeldahl N determination (FOSS-USA), continuous flow analyzer (AA3-Germany), and inductively coupled plasma mass spectrometry (ICP-MS; Thermoscientific-USA), respectively [22]. All plants were harvested from each plot thrashed, and grain yield was recorded [23].
The following formula was used to measure the nutrient (TN, TSN, NO3−-N, NH4+-N, TP, and TSP) leaching flux:
where F is nutrient leaching flux kg ha−1, n is times of farmland leaching production (underground leaching) in the monitoring period, Vi is water volume of the ith leaching, Ci nutrient concentration of the ith leaching (mg L−1), and S is the area of monitoring unit (m2).
Statistix software 8.1® was used to compare the means and significance of treatments (p ≤ 0.05) using two factorial design analysis of variance (ANOVA) with Tukey multiple comparison tests (Tukey HSD) at p ≤ 0.05. All the graphs, and data sets are presented as means ± S.D of three replicates (n = 3). Data handling and visualization were done using Microsoft excel 365.
Water analysis demonstrated that using reduced fertilizer and water-saving techniques minimizes the loss of nutrients through water leaching. At JS, CON showed the highest TN losses in 2015, 2016, 2018, and 2019. While KF and BMP2 resulted in the highest TN losses in 2017 and 2020. The treatment-wise trend line indicated that CON and KF had the highest TN losses in 2017. However, the losses were reduced in 2015 and KF in 2018, respectively. BMP1 showed the highest losses in 2020, significantly reducing the TN losses in 2018. Moreover, BMP2 significantly increased the losses in 2017, followed by 2020 and 2016. BMP3 also enhanced the losses in 2017 compared to other years (Fig. 1a). At BTS, TN losses were highest with the application of CON every year. The trend line shows that all the treatments significantly improved the TN losses at BTS (Fig. 1b). At AH, CON showed the highest TN losses in 2016, 2018, 2019, and 2020. While KF and BMP2 resulted in the highest TN losses in 2015 and 2017. The trend line showed that CON showed the highest TN losses in 2019, while the lowest were reported in 2017. KF increased the losses in 2018, and all the other treatments reported the highest losses in 2019 at AH (Fig. 1c) significantly.
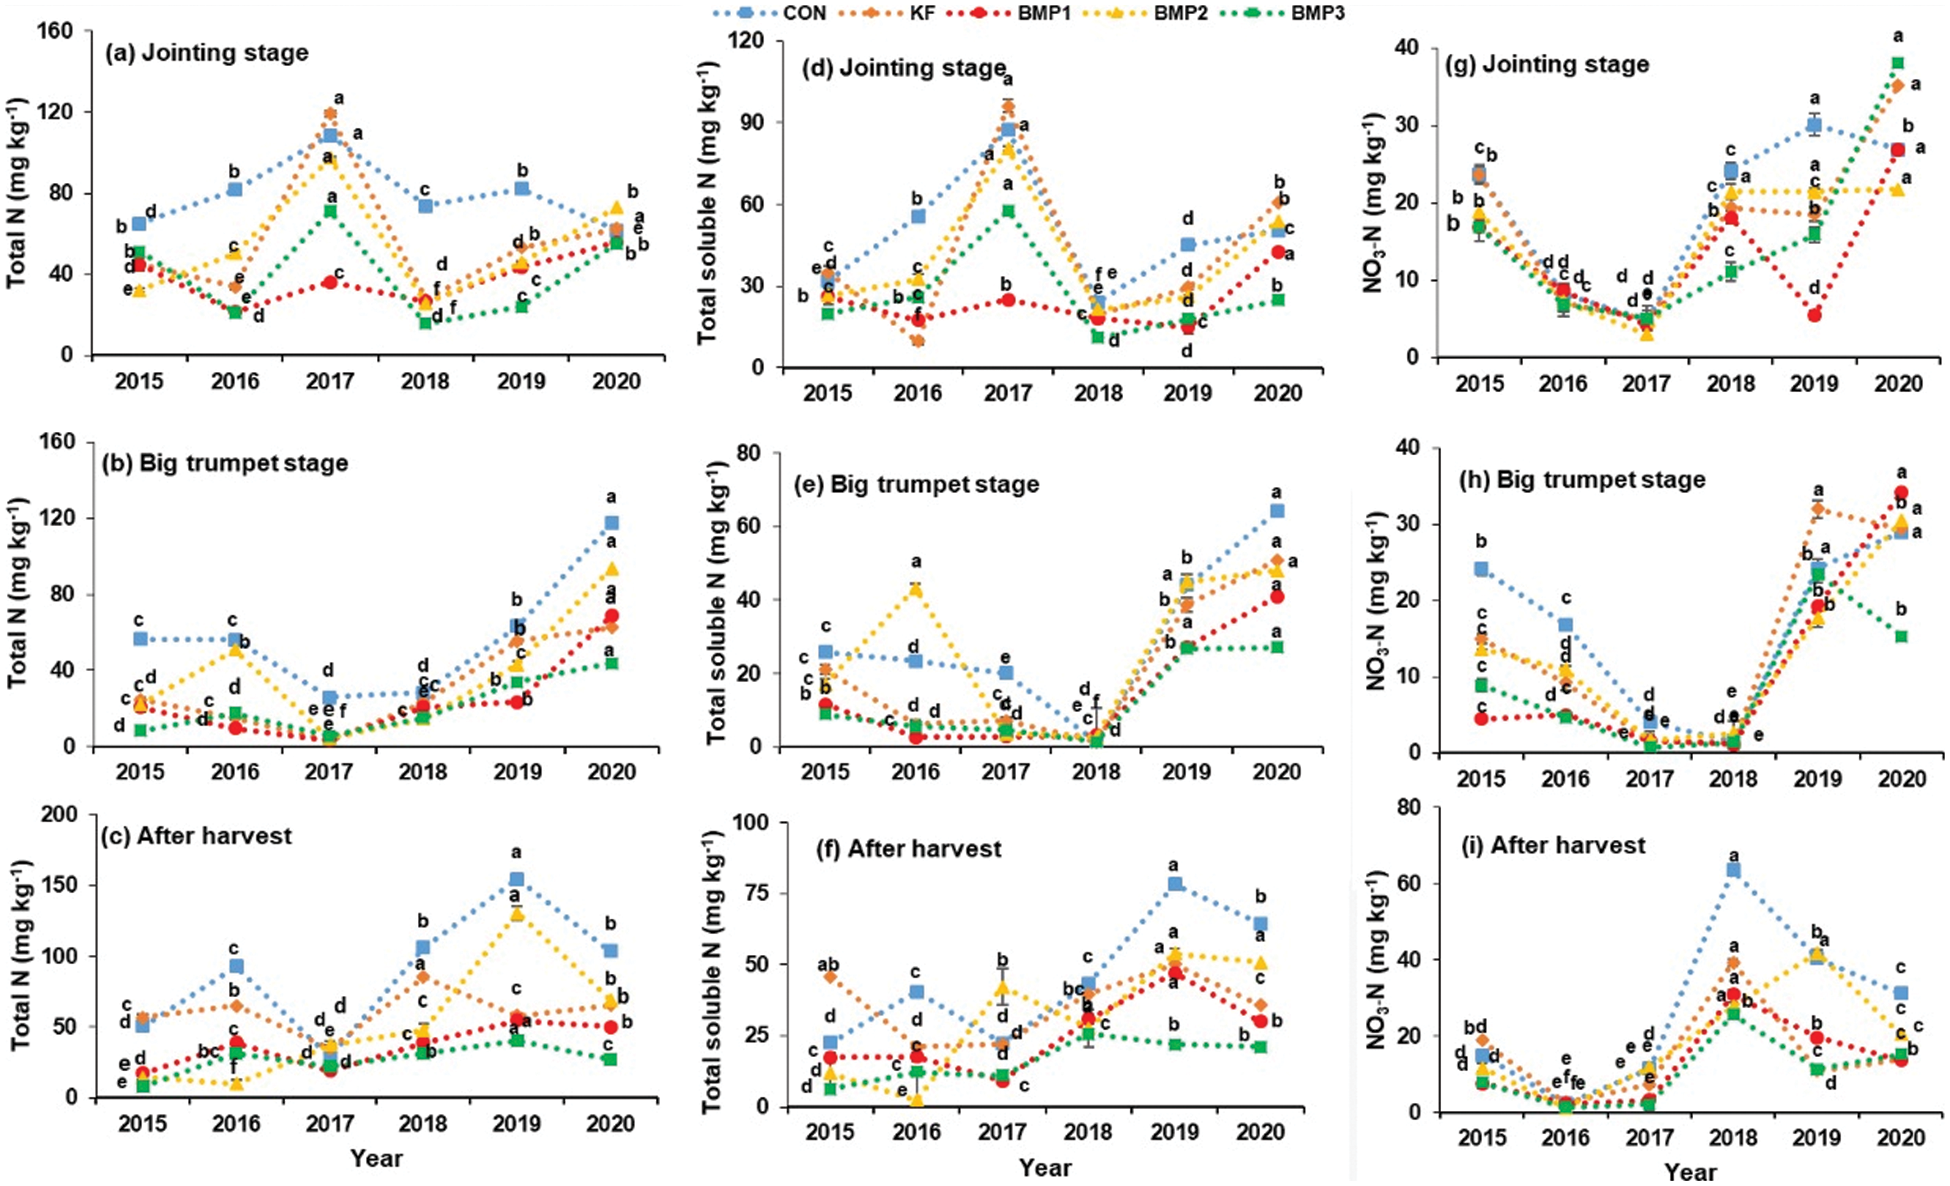
Figure 1: Nutrient leaching losses 2015–2020, TN losses at jointing stage (a), TN losses at big trumpet stage (b), TN losses after harvest (c), total soluble N losses at jointing stage (d), total soluble N losses at big trumpet stage (e), total soluble N losses after harvest (f), NO3-N losses at jointing stage (g), NO3-N losses at big trumpet stage (h), NO3-N losses after harvest (i). Annual treatment response in control (CON), fertilizer decrement (KF), fertilizer decrement + water-saving irrigation (BMP1), combined application of organic and inorganic fertilizer + water-saving irrigation (BMP2), and combined application of controlled-release fertilizer (BMP3) with relative to CON (2015–2020). The error bars indicate the standard deviations, and the lowercase letters indicate the significant difference among the means
Results revealed that TSN was also influenced by using the reduced fertilizer technique. At JS, CON increased the TSN losses in 2016, 2018, and 2019. However, KF indicated the highest TSN losses in 2015, 2017, and 2020 respectively. Whereas, the trend line showed that CON increased the TSN losses in 2017, followed by 2016. KF also improved the losses in 2017, followed by 2020, and BMP showed the highest losses in 2020. BMP2 and BMP3 significantly increased the TSN losses in 2017. Whereas, BMP1 increased the TSN losses in 2020 at JS, respectively (Fig. 1d). At BTS, CON showed the highest TSN losses in 2015, 2017, and 2020, Whereas, BMP2 increased the losses in 2016, 2018, and 2019. The trend line demonstrates that CON, KF, and BMP1 significantly enhanced the TSN losses in 2020, followed by 2019. BMP2 showed the highest values in 2016, 2019, and 2020, and BMP3 reported the highest losses in 2019 and 2020 (Fig. 1e). At AH, CON reported the highest losses in 2016, 2018, 2019, and 2020. While KF and BMP2 resulted in the highest TSN losses in 2015 and 2017 (Fig. 1e).
At JS, CON and KF contributed equally to the highest NO3-N losses in 2015. While BMP1 showed the highest losses in 2016, BMP3 in 2017, CON in 2018 and 2019, and BMP2 in 2020. The trend line indicates that CON significantly increased its losses in 2019, followed by 2020. KF also reported the highest losses in 2020, followed by 2015. BMP1 increased the losses in 2020. BMP2 significantly reduced the losses in 2017. Moreover, BMP3 reported the highest losses in 2020, respectively (Fig. 1f). At BTS, the highest losses were reported by CON in 2015, 2016, 2017, and 2019. While BMP2 resulted in the highest NO3-N losses in 2018 and 2020. The trend line elaborates that CON treatments showed the highest losses in 2019 and the lowest losses in 2018, respectively. KF resulted in the highest losses in 2019, followed by 2020. BMP1 and BMP2 reported the highest losses in 2020, followed by 2019. BMP3 had the highest losses in 2019, followed by 2020 and 2015, respectively (Fig. 1g). At AH, the highest losses were indicated by KF in 2015 and 2016, BMP2 in 2017 and 2019, and CON in 2018 and 2020, respectively. CON, KF, BMP2, and BMP3 reported the highest losses in 2018, while BMP1 was in 2018 (Fig. 1h).
Our results revealed that respective treatments also influenced NH4-N losses. At JS, BMP2 showed the highest NH4-N losses in 2015, CON in 2016, 2017, and 2020, BMP1 in 2018, and BMP3 in 2019. The trend line indicates that CON reported the highest losses in 2017, followed by 2020, KF in 2020 followed by 2017, BMP1 in 2017 followed by 2018, and BMP3 in 2019, followed by 2017. In addition, BMP2 significantly reduced the losses in 2017 (Fig. 2a). At BTS, the highest losses were reported by BMP3 in 2015 and 2020, BMP2 in 2016, BMP1 in 2017, and CON in 2018 and 2019, respectively. The trend line shows that CON reported the highest losses in 2019, followed by 2017, and BMP1 in 2017, followed by 2019. KF significantly reduced the losses in 2016 (Fig. 2b). At AH, CON and BMP2 contributed equally to the highest NH4-N losses in 2015. Moreover, BMP1 in 2016, KF in 2017, CON and KF in 2018, and BMP3 in 2019 and 2020, respectively. All the treatments significantly enhanced the losses in 2018 except BMP3, which showed the highest value in 2020 (Fig. 2c).
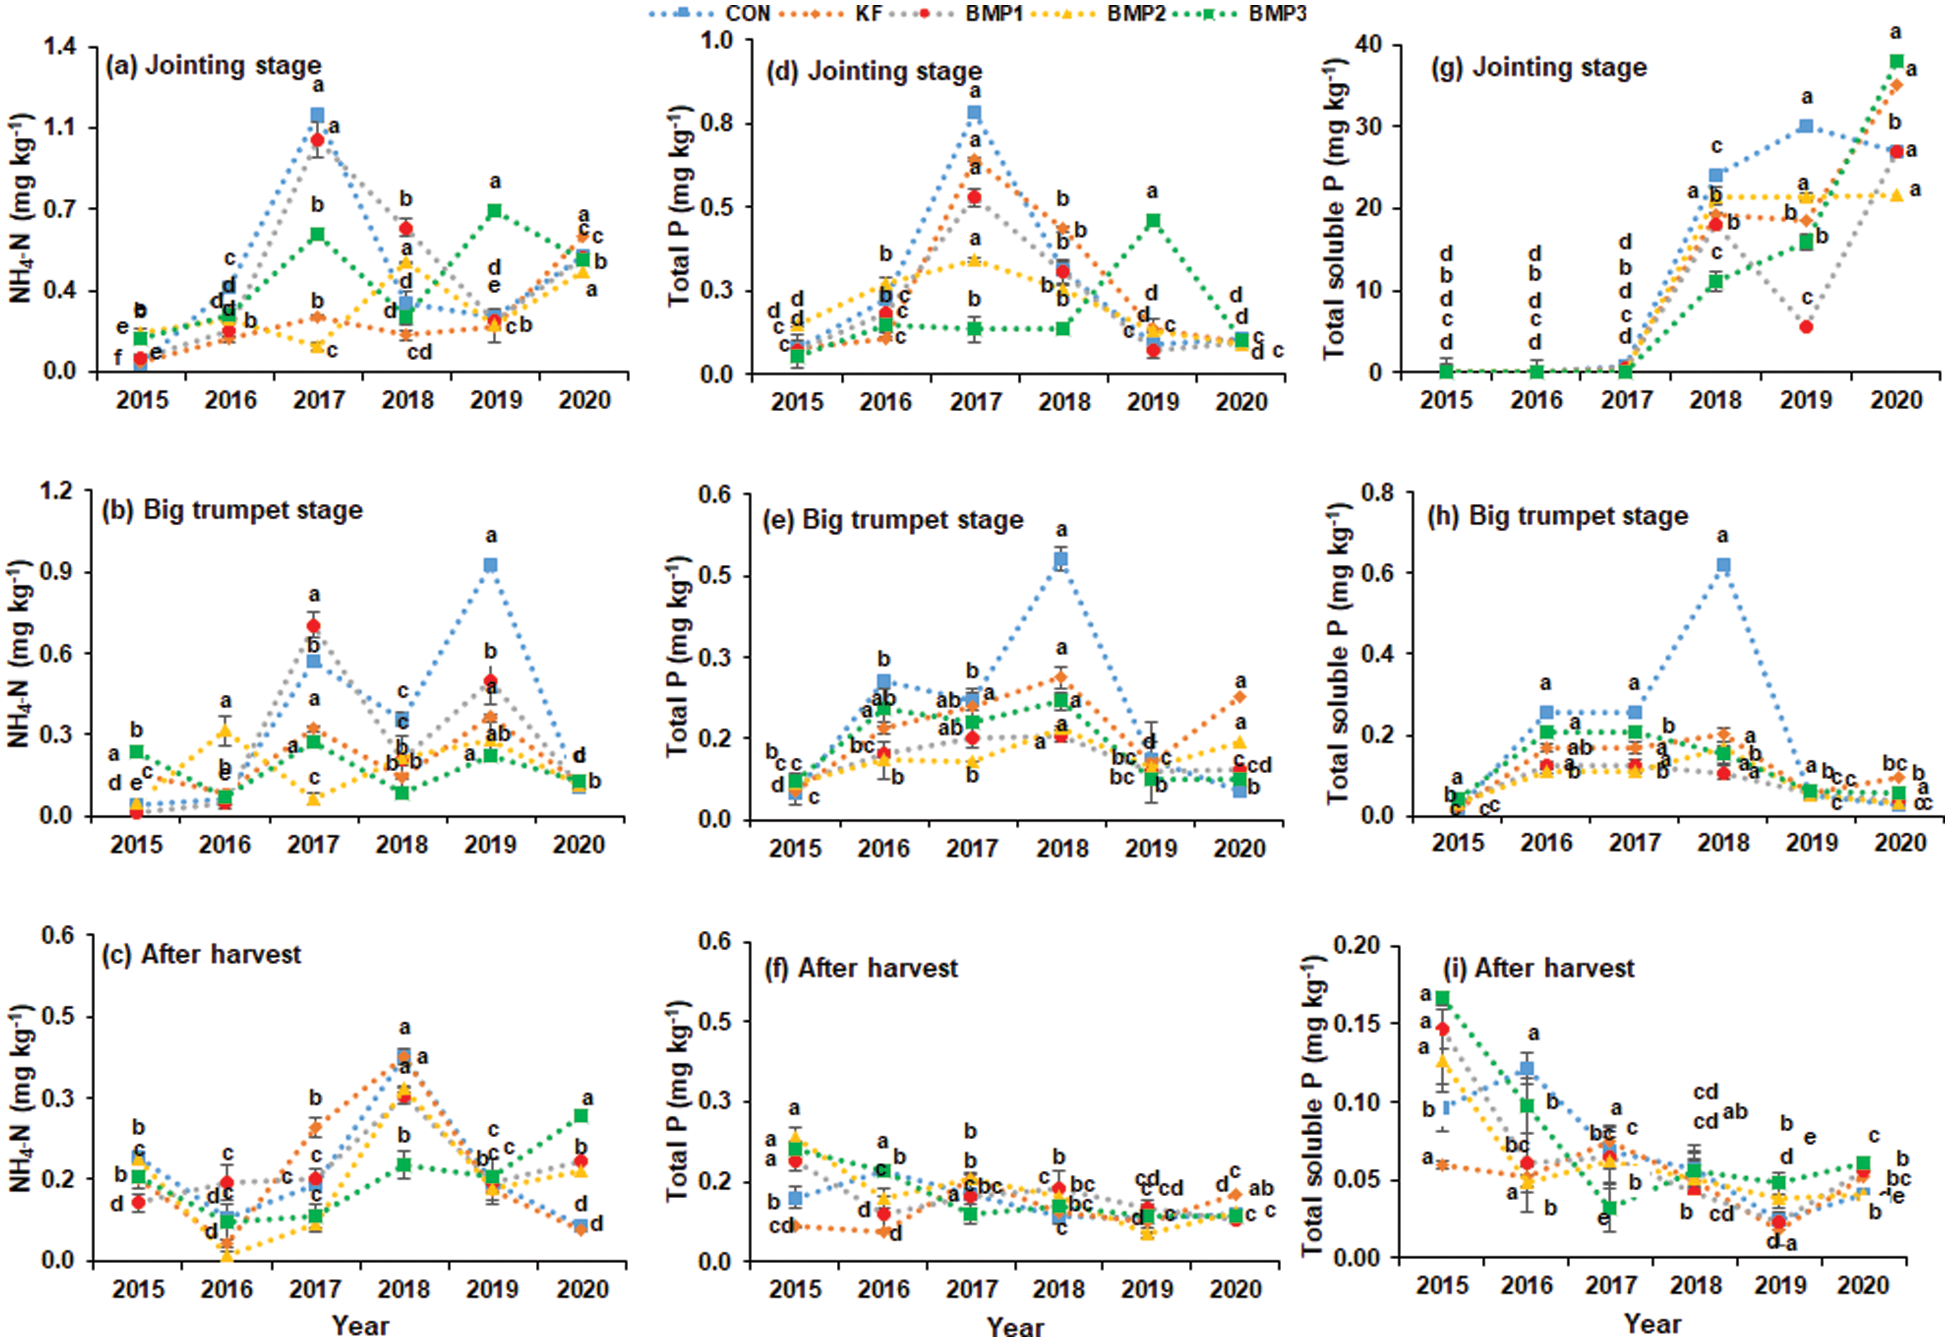
Figure 2: Nutrient leaching losses 2015–2020, NH4-N losses at jointing stage (a), NH4-N losses at big trumpet stage (b), NH4-N losses after harvest (c), total P losses at jointing stage (d), total P losses at big trumpet stage (e), total P losses after harvest (f), total soluble P losses at jointing stage (g), total soluble P losses at big trumpet stage (h), total soluble P losses after harvest (i). The error bars indicate the standard deviations, and the lowercase letters indicate the significant difference among the means
Results showed that TP losses were highest with BMP2 in 2015 and 2016, CON in 2017, KF in 2018, BMP3 in 2019, and CON in 2020. All the treatments significantly enhanced the losses in 2017 except BMP3, which showed the highest value in 2019 (Fig. 2d). A similar TP loss trend was observed at BTS in BMP1, BMP2, and BMP3 in 2015. In 2016–2018, CON showed the highest losses, while in 2019, CON and KF reported the highest TP losses. In 2020, KP showed peak values (Fig. 2e). At AH, a similar trend was observed among treatments. CON reported the highest losses in 2016, BM1, BMP2, and BMP3 in 2015 (Fig. 2f).
At JS, minute TSP losses were observed during 2015–2017. Afterward, CON showed the highest losses in 2018 and 2019 and BMP3 in 2020. The trend line showed that CON increased the losses in 2019, KF in 2020, BMP1 in 2020, BMP2 in 2018–2020, and BMP3 in 2020, respectively (Fig. 2g). All treatments showed a similar trend at BTS, while CON showed the highest losses in 2018. The trend line indicates that CON has non-significant results. BMP2 and BMP3 increased the TSP losses in 2018 and 2016, respectively (Fig. 2h). At AH, BMP3 showed the highest losses in 2015, CON in 2016 was observed, while other treatments showed a similar trend (Fig. 2i).
The interaction effect of year*treatment was significant (p ≤ 0.05) for TN, TSN, NO3-N, TP, and TSP leaching losses (Fig. 3). Among all the treatments, CON showed maximum TN losses (299.76 mg L−1) in 2019, followed by the same treatment in 2020 with 282.52 mg L−1 TN losses. Overall, the lowest value of TN losses (58.80 mg L−1) was observed from BMP1 treatment in 2017 (Fig. 3a). TSN losses were significantly increased with CON in 2020 compared to other treatments (Fig. 3b). For the NO3−-N, the higher losses were in 2019 (CON), 2018 (CON), and 2020 (CON), respectively. Among all the treatments, the lowest value of NO3-N losses (8.04 mg L−1) was observed in the BMP3 treatment of the year 2017, followed by BMP1 treatment with 9.02 mg L−1 NO3-N losses in the same year (Fig. 3c). NH4-N losses were significantly higher in 2017 (CON, BMP1) than in other treatments (Fig. 3d). Overall, the maximum value of total P loss (1.13 mg L−1) was observed in the CON treatment of the year 2017 (Fig. 3e). In the same year, the highest TP and TSP losses were reported with the application of CON (Fig. 3f).
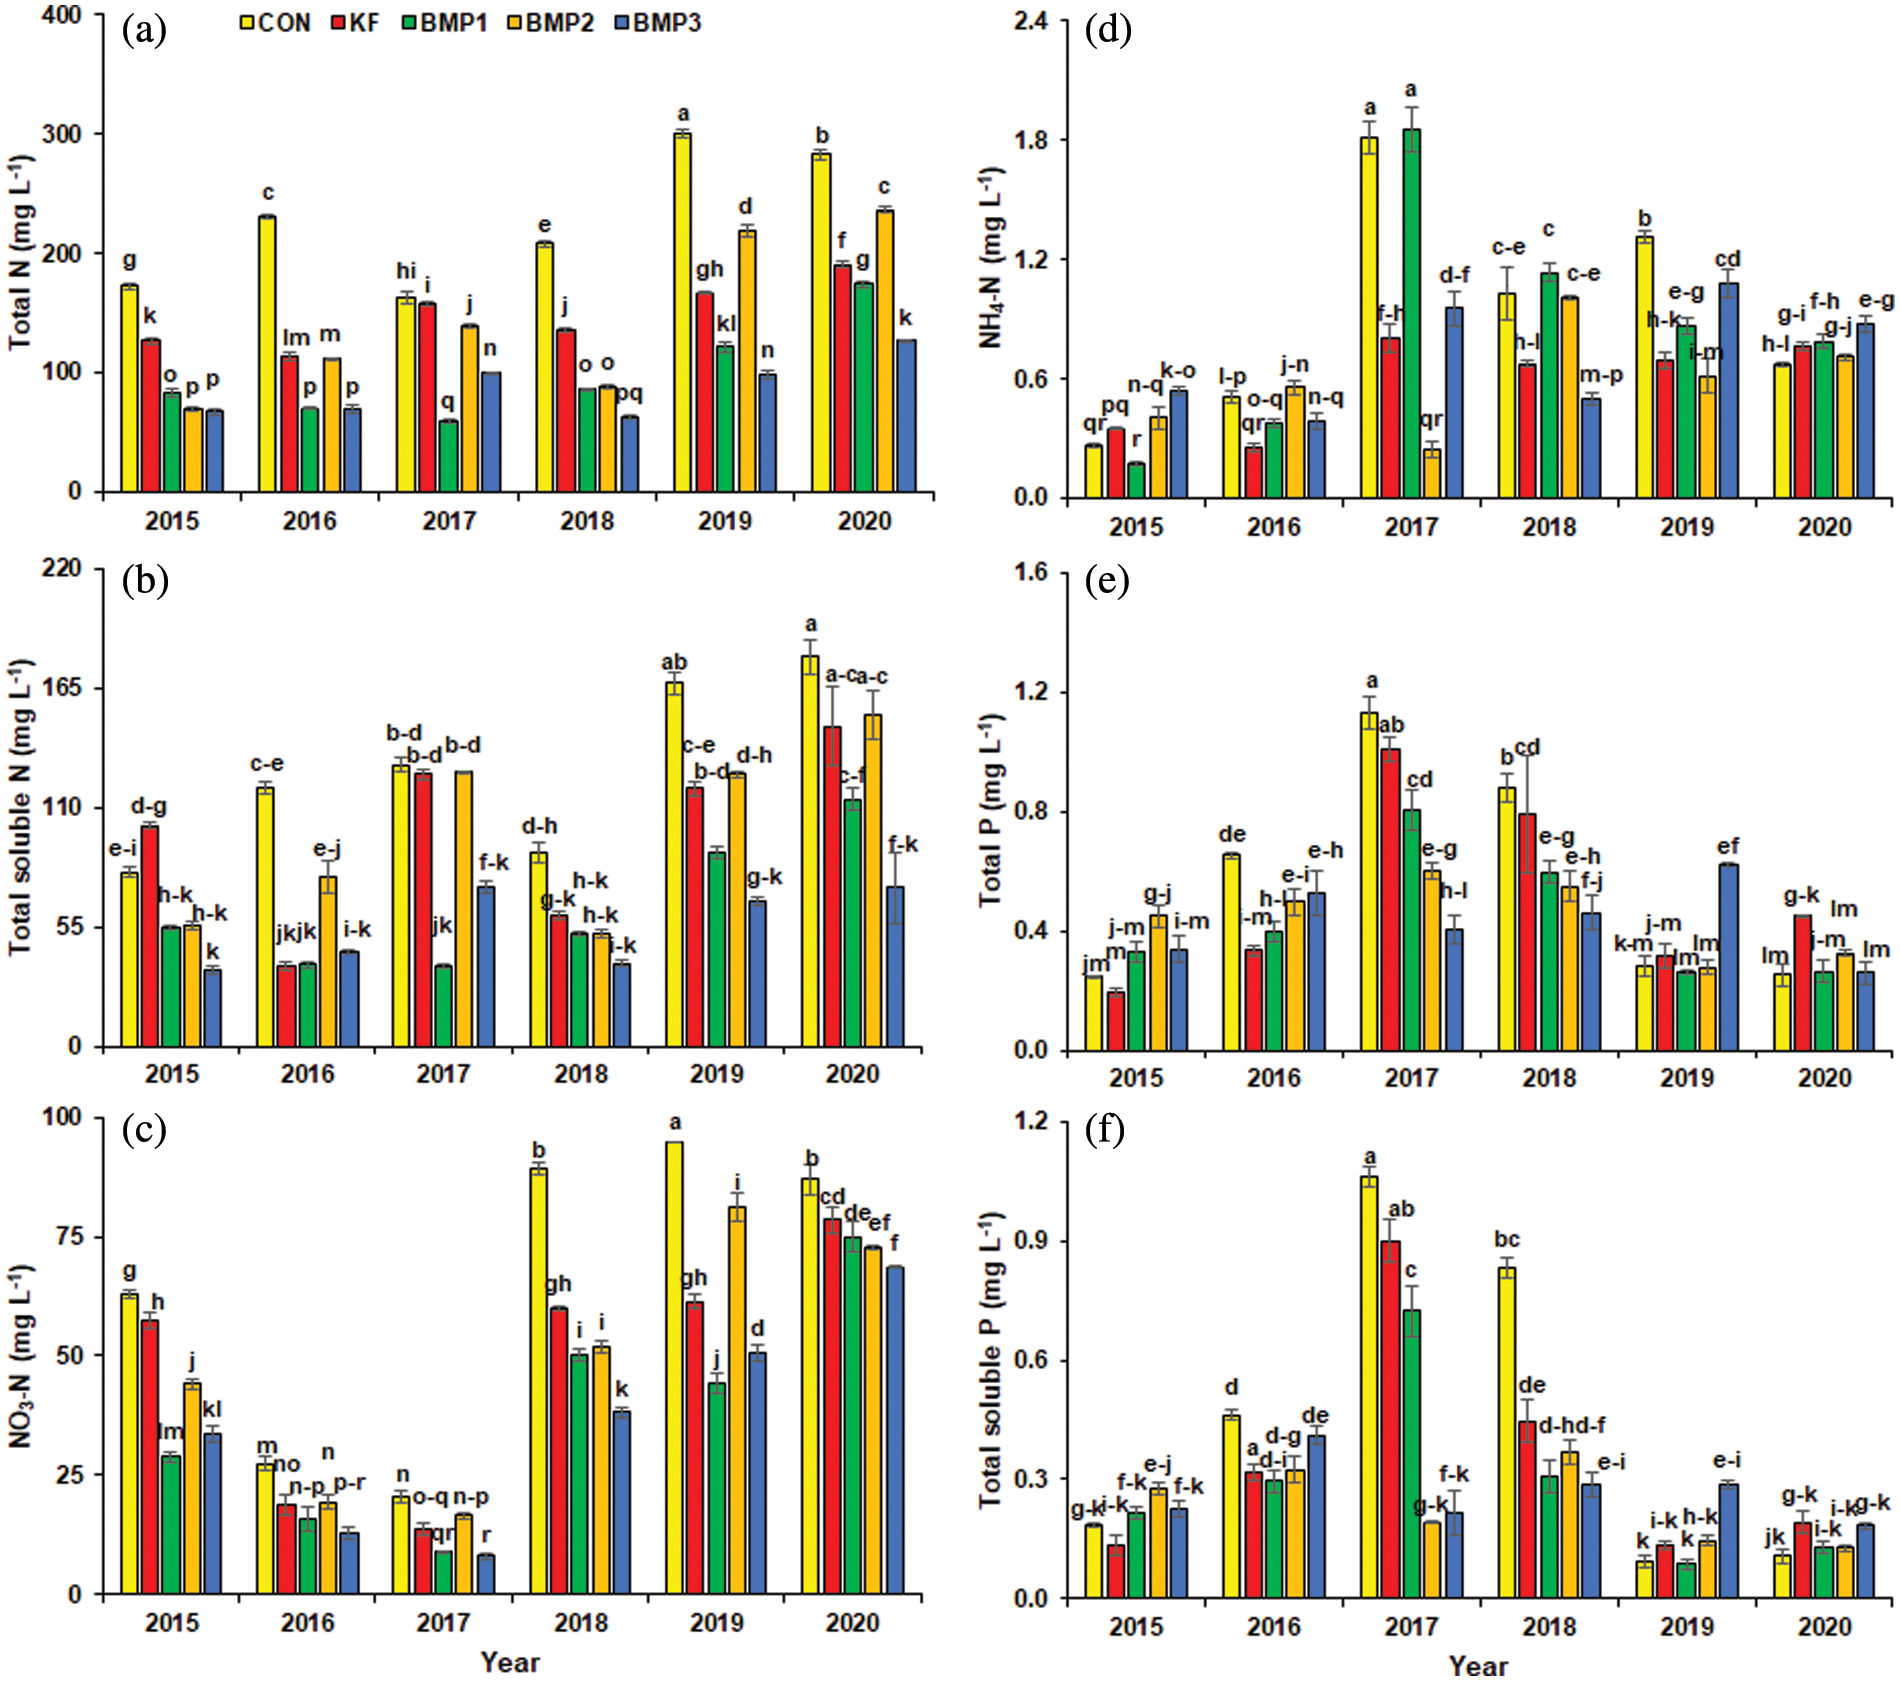
Figure 3: Interactive effect of Years and treatments to influence the leaching losses. TN (a), TSN (b), NO3-N (c), NH4-N (d), TP (e), TSP (f). The error bars indicate the standard deviations, and the lowercase letters indicate the significant difference among the means
The interaction effect of year*treatment was significant (p ≤ 0.05) for the parameters (N, P, and K concentration in straw and grain) presented in Fig. 4. N concentration in the straw was significantly higher in 2017 with CON (Fig. 4a). In 2018, BMP2 treatment significantly improved the P concentration in straw (p ≤ 0.05), over the respective treatments (Fig. 4b). In the BMP1 treatment of 2016, there was a significant improvement in straw K concentration compared to other treatments (Fig. 4c).
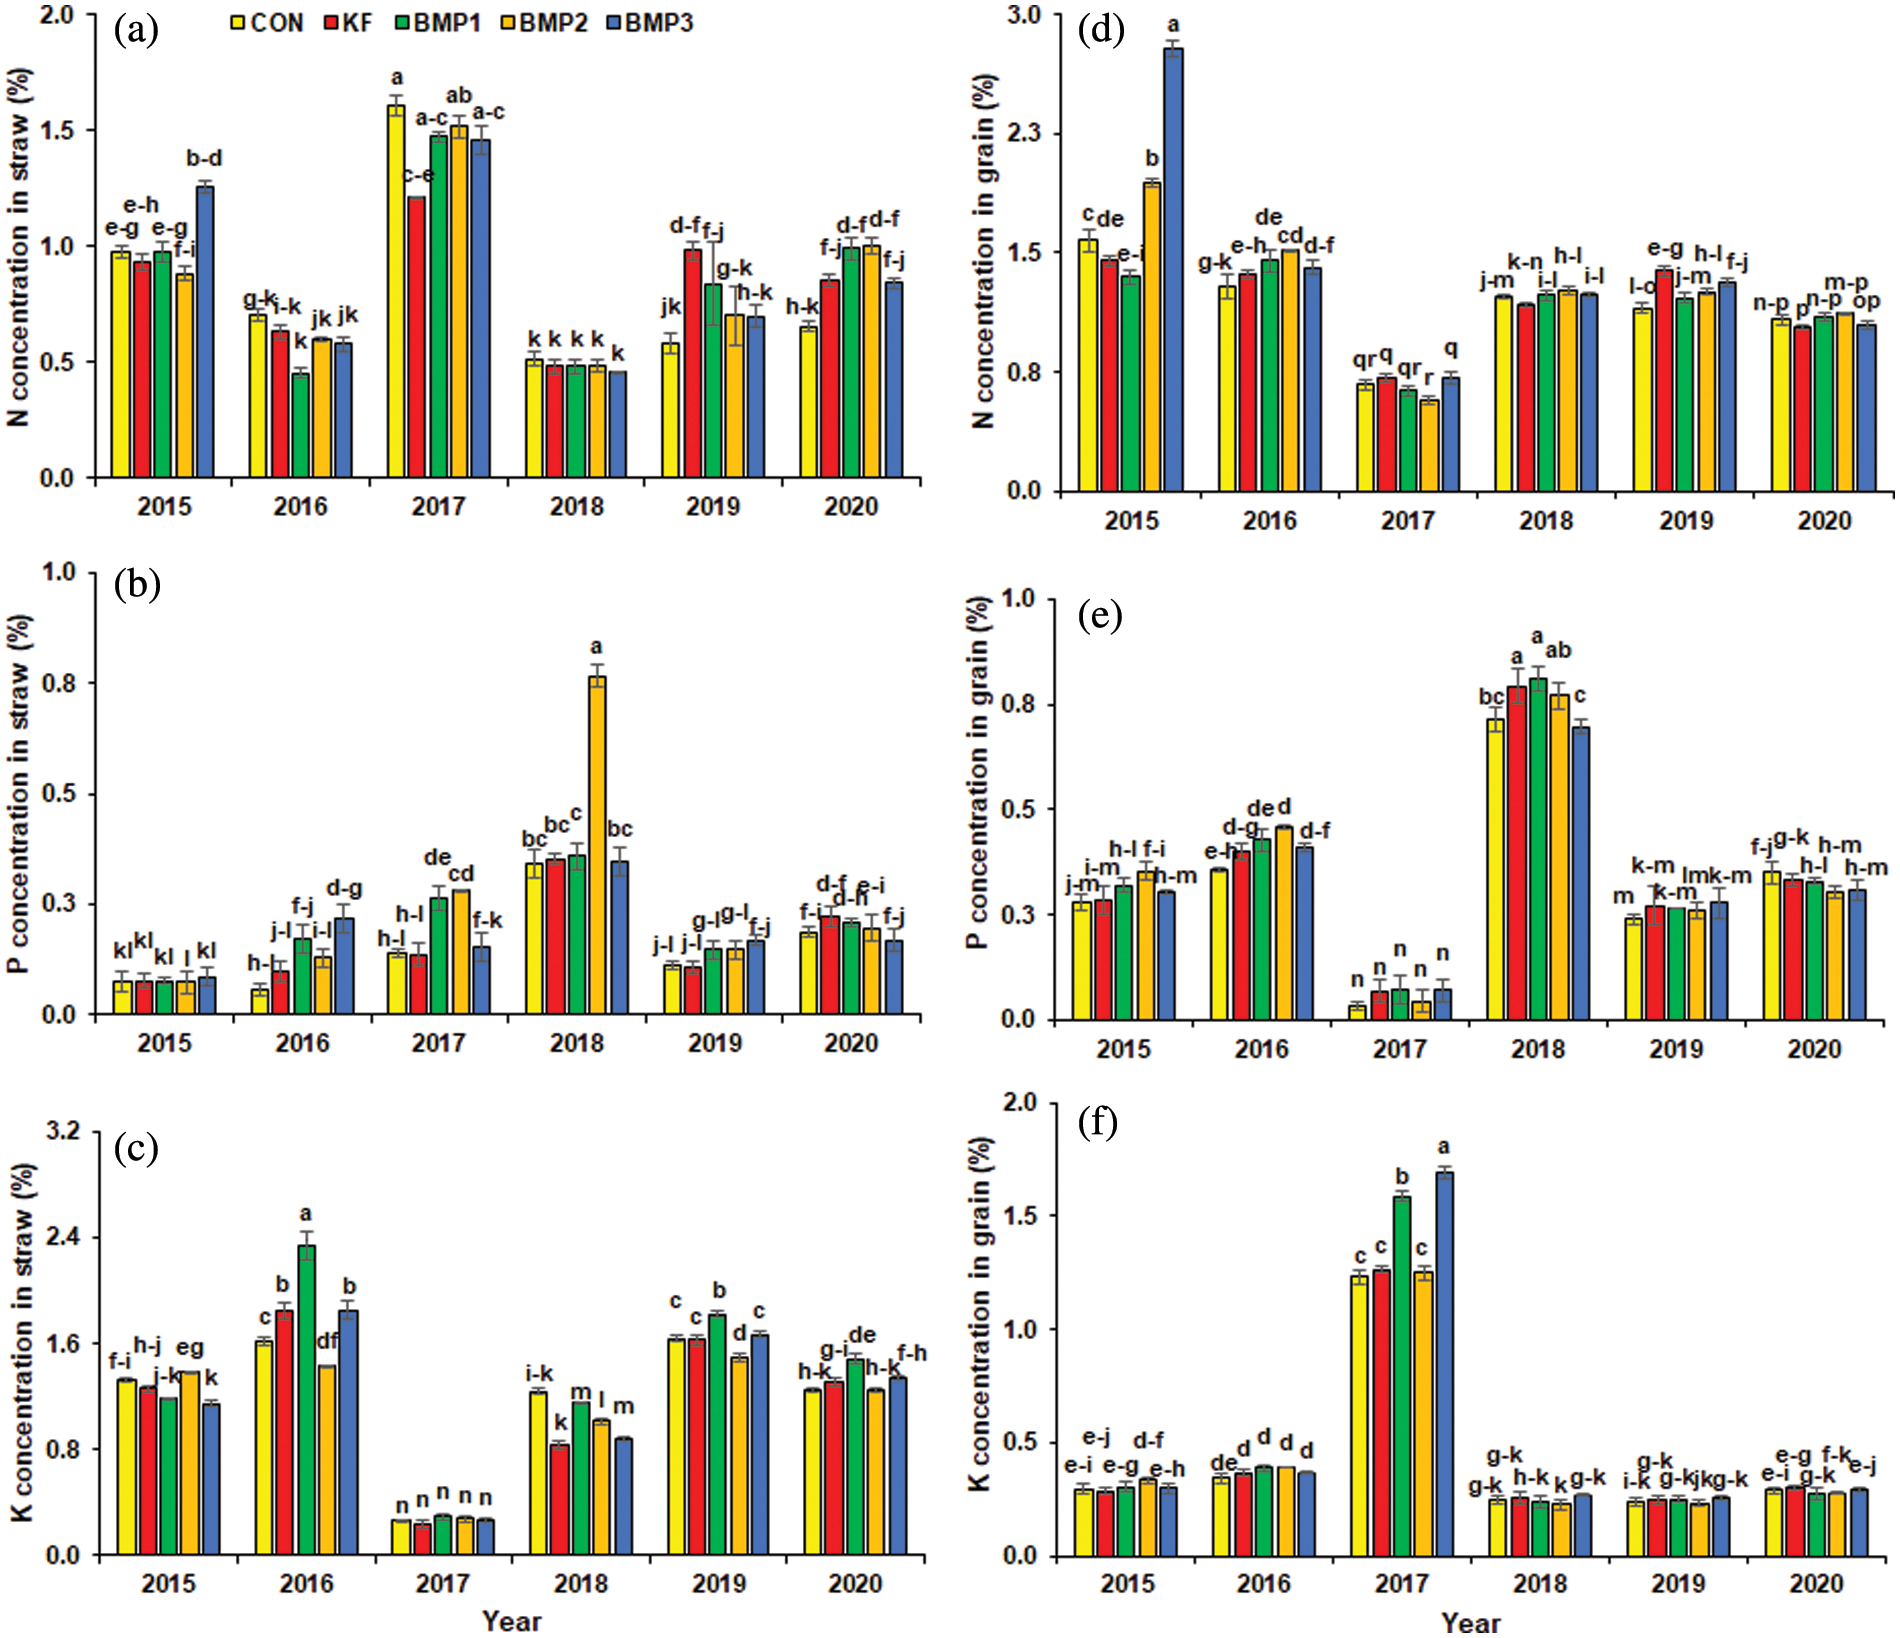
Figure 4: Interactive years and treatments effects on nutrient concentration in straw and grain. TN concentration in straw (a), TP concentration in straw (b), TK concentration in straw (c), TN concentration in grain (d), TP concentration in grain (e), and TK concentration in grain (f). The error bars indicate the standard deviations, and the lowercase letters indicate the significant difference among the means
The N concentration in grain was improved by BMP3 (2015) followed by BMP2 (2015) with respect to others. The value of grain N concentration (2.79%) of treatment BMP3 in 2015 remained the most prominent among all treatments. In 2018, BMP2 significantly reduced the grain N concentration compared to other treatments (Fig. 4d). P concentration was significantly improved in 2018 with all treatments compared with other years and treatments (Fig. 4e). In 2017, the grain K concentration of all the treatments was significantly better than the grain K concentration of the respective treatments of other years. Overall, BMP3 and BMP1 treatments in 2017 showed maximum grain K concentration (Fig. 4f).
In 2017, treatment KF showed a 67.76% increase in grain yield over the KF treatment of 2015. In 2017, treatment BMP1 showed 47.95% better grain yield than the BMP1 treatment of 2015. Grain yield was enhanced with the application of BMP2 in 2015 (34.5%), 2016 (50.1%), 2018 (59.8%), 2019 (78.1%), and 2020 (45.5%) as compared to respective CON treatments. KF improved the grain yield in 2017 by up to 105.6% over the respective CON treatment (Fig. 5). The comparison among treatments showed that grain yield was significantly improved with BMP2, while the year-wise comparison demonstrated that the highest yield was obtained in 2017, respectively (Fig. 5).
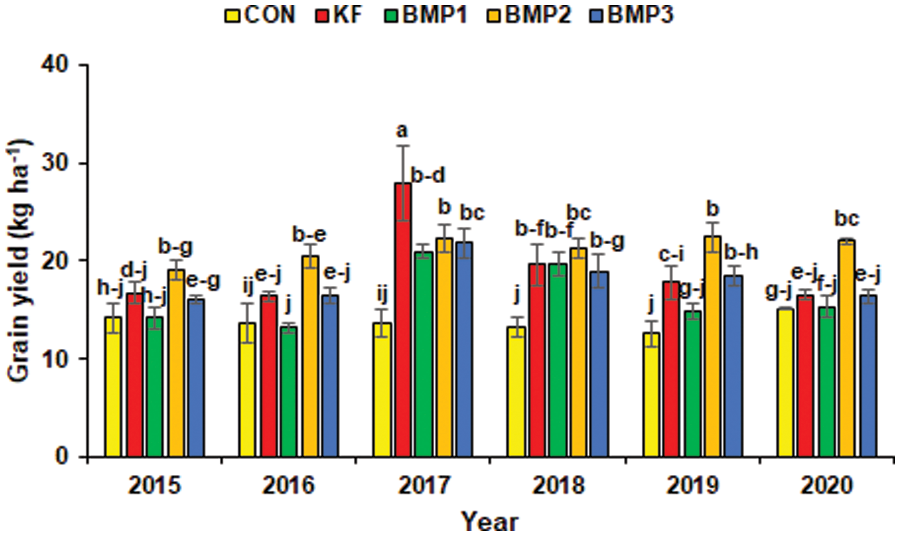
Figure 5: Interactive years and treatments effects on grain yield. The error bars indicate the standard deviations, and the lowercase letters indicate the significant difference among the means
The results achieved herein indicated that leaching flux was significantly affected (year*treatment) with the time and management of fertilization and irrigation practices (Fig. 6). From 2015–2020, the TN leaching flux (kg ha−1) range in CON was 32.92–81.37, KF was 14.60–43.52, BMP1 was 20.77–44.55, BMP2 was 16.35–53.57, and BMP3 was 10.59–29.44 kg ha−1, respectively. TSN leaching flux range observed in CON was 20.70–50.74, KF was 4.62–29.68, BMP1 was 11.63–23.74, BMP2 was 9.64–28.09, and BMP3 was 6.06–20.27 kg ha−1, respectively. Overall, the highest value of NO3-N leaching flux was observed in the CON treatment of the year 2018 (20.83 kg ha−1), 2019 (18.92 kg ha−1), and 2020 (18.85 kg ha−1), respectively. The range of NO3-N leaching flux in CON was 0.21–16.22, KF was 0.01–17.01, BMP1 was 0.25–9.41, BMP2 was 0.19–12.91 and BMP3 was 0.08–12.09. Regarding NH4-N leaching flux, the CON value of the year 2017 was 8.50 fold greater than the value of CON treatment in 2015. Comparing the different treatments with BMP1, the maximum NH4-N leaching flux was observed in 2017 with 9.2 fold increased value, over the year 2015. NH4-N leaching flux range with CON was 0.16–1.86, KF was 0.01–0.63, BMP1 was 0.121.32, BMP2 was 0.1–1.03 and BMP3 was 0.11–0.61, respectively. CON treatment of the year 2017 resulted in maximum TP leaching flux. Moreover, TP range with CON was 0.05–0.16, KF 0.04–0.34, BMP1 was 0.40–0.04, BMP2 was 0.04–0.24, and BMP3 was 0.02–0.11 kg ha−1, respectively. Overall, the maximum value of TSP leaching flux (0.29 kg ha−1) was observed in the CON treatment of the year 2017 (Fig. 6).
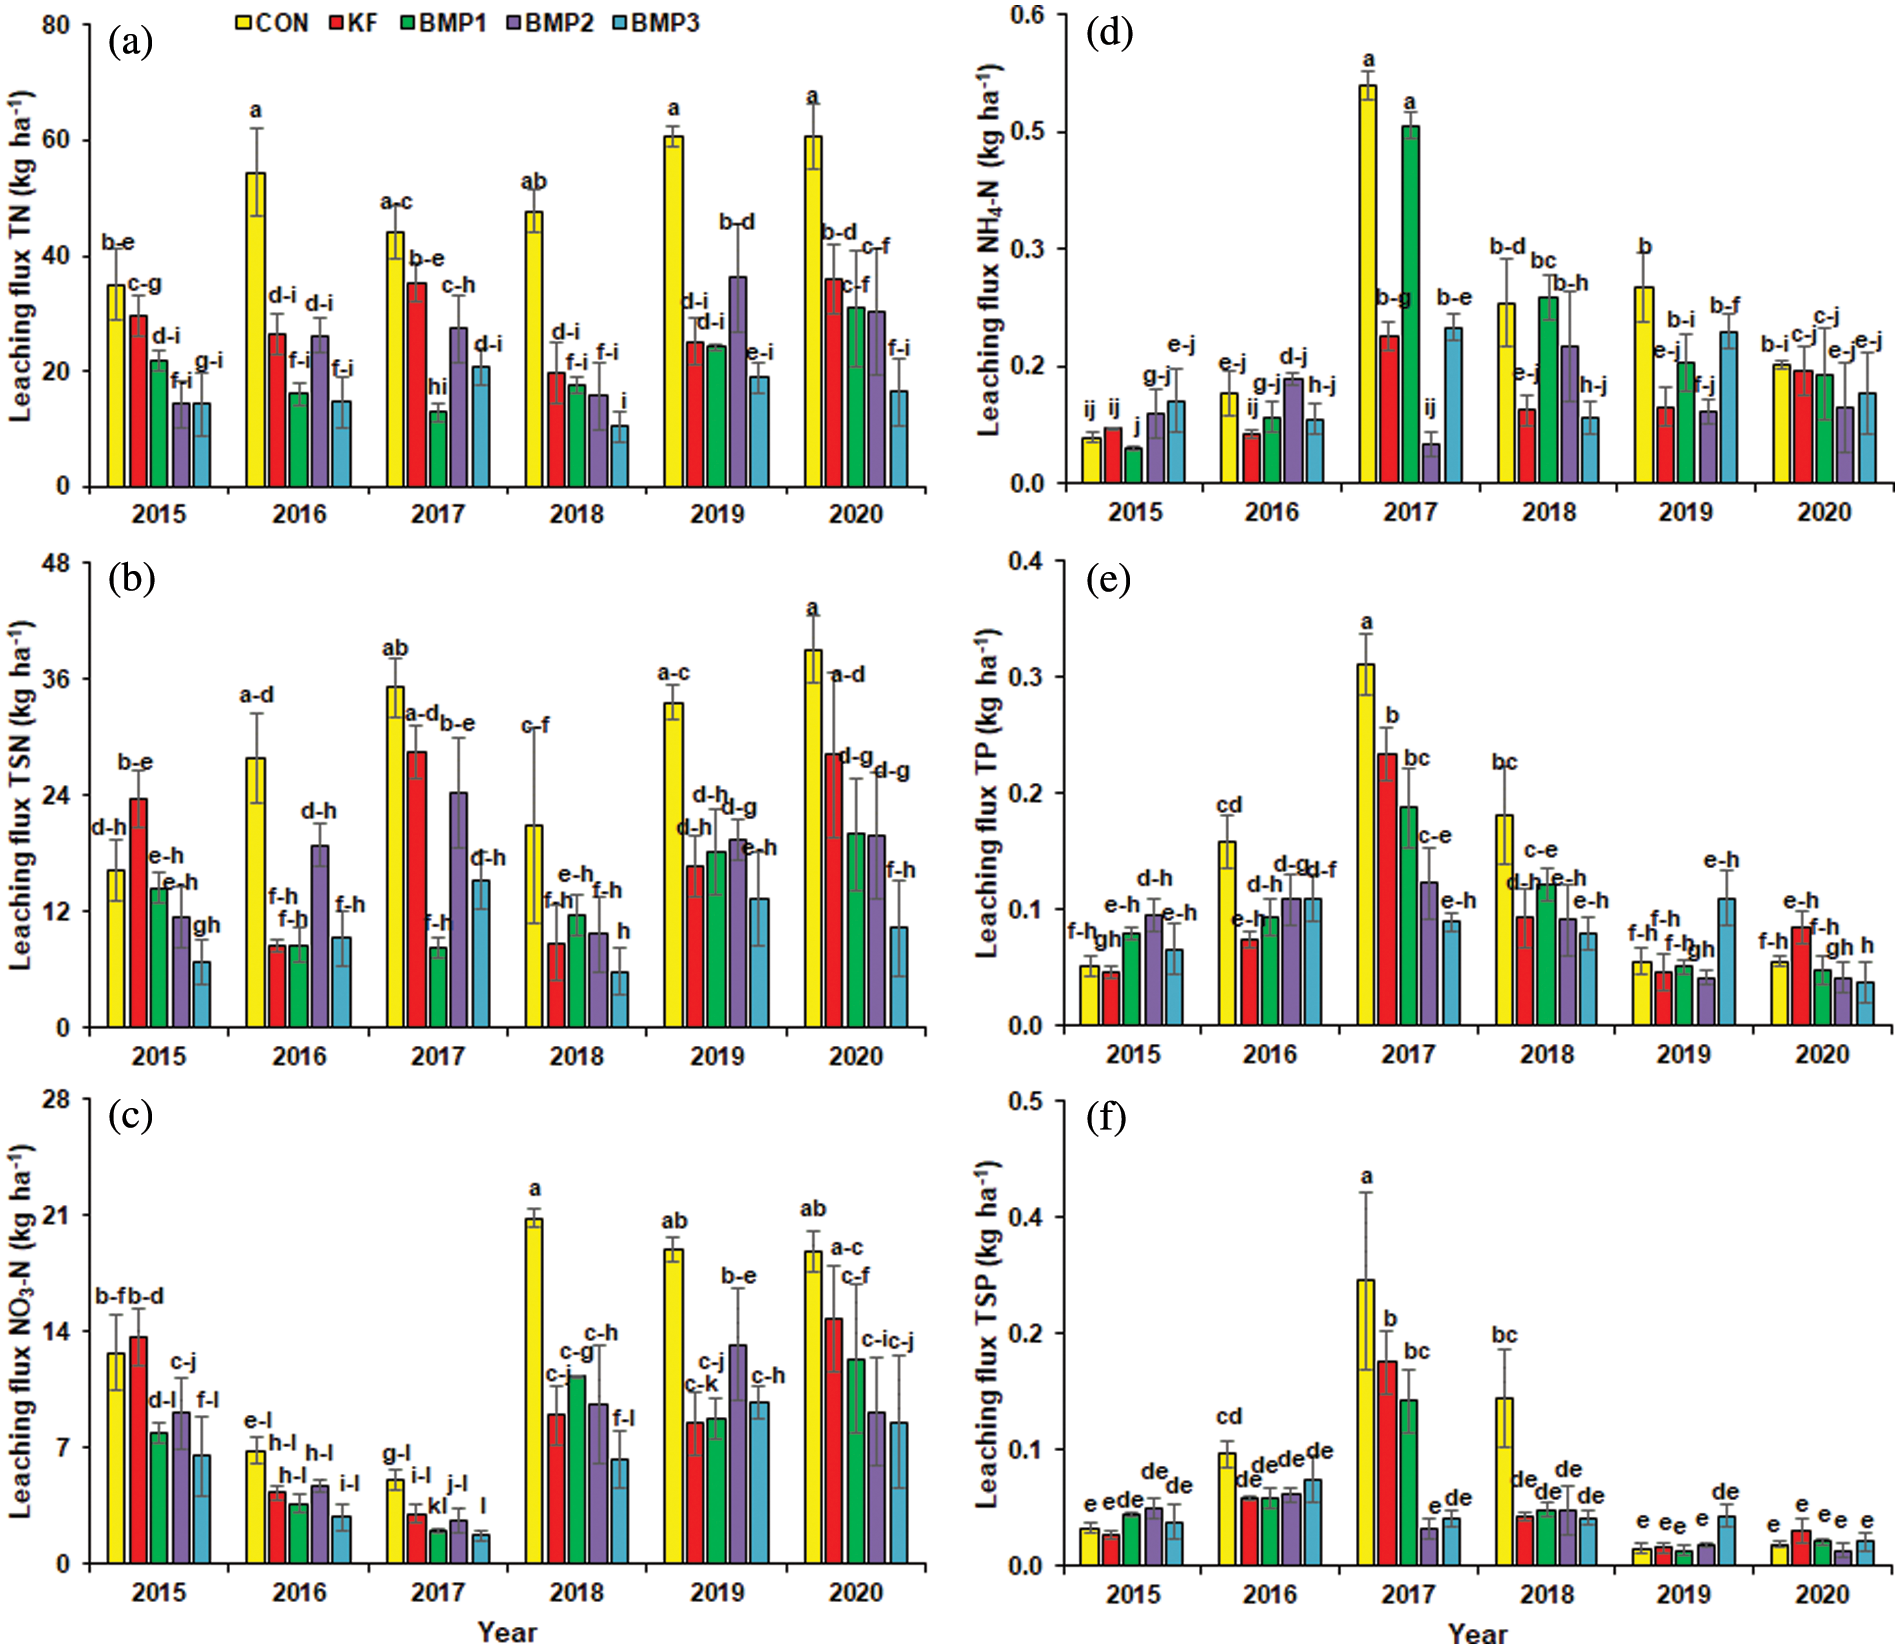
Figure 6: Interactive effects of years and treatments to nutrient leaching flux. TN leaching flux (a), TP leaching flux (b), TK leaching flux (c), TN leaching flux (d), TP leaching flux (e), and TK leaching flux (f). The error bars indicate the standard deviations, and the lowercase letters indicate the significant difference among the means
3.4 Principal Components Analysis
The principal components analysis (PCA) determined the association among all the studied variables (Fig. 7). The first principal component (PC1) accounted for 27.9%, and the second principal component (PC2) accounted for 13.8% of the total variation. In the biplots, close vectors represent a positive correlation. Moreover, the vectors apart at 90° are not correlated, and diverging angles (nearly 180°) are negatively correlated. Leaching nutrient concentrations, including TN, TSN, TP, and TSP, are positively correlated but showed a negative association with plant nutrient concentration in corn straw and grain (SN, SP, GN, and GP). It indicates that nutrient losses result in poor nutrient concentration in straw and grain. The cos2 values estimate the quality of representation. High cos2 indicates good representation, and such variables are closer to the circumference. While low cos2 shows an imperfect presentation and is nearer to the circle’s center.
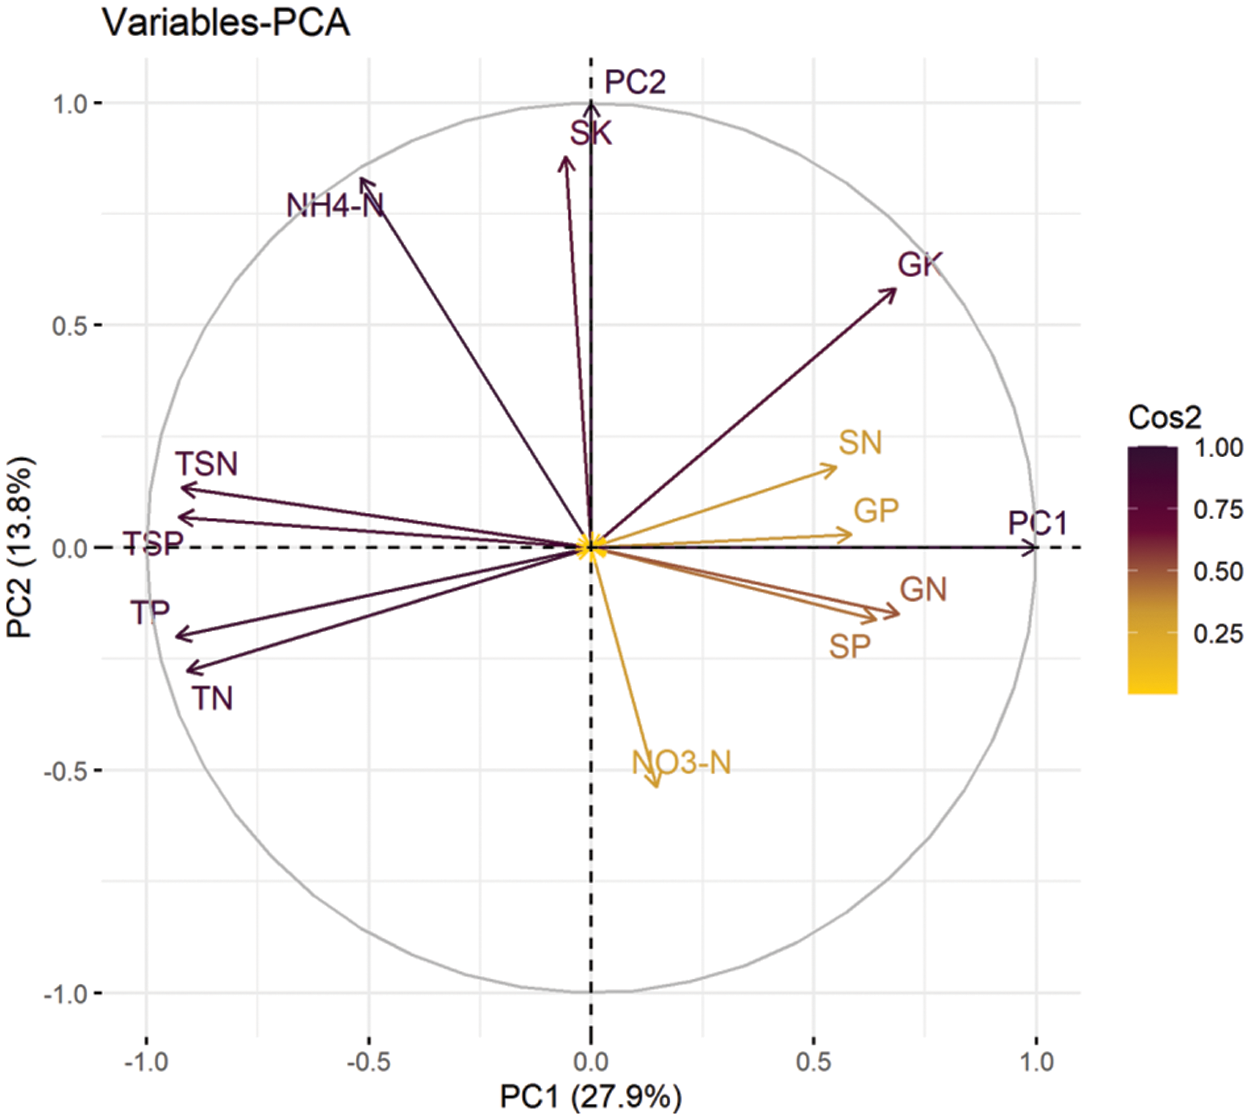
Figure 7: Principal component analysis (PCA) biplot of variables. TN, TSN, NO3-N, NH4-N, TP, and TSP represents nutrient leaching losses; SN, SP, and SK represent NPK concentration in straw; GN, GP, and GK indicate NPK concentration in grain. Colors represent Cos2 values that estimate the quality of the representation of the variable
Ningxia province, located in North China, is receiving major consideration for agricultural production, especially corn and vegetables, in the zone of the Yellow River. The area is suitable for highly productive crops, which require higher inputs of chemical fertilizers and heavy irrigation [13]. The excessive use of fertilizers and heavy irrigations generates leaching and runoff losses of nutrients which is a serious cause of the eutrophication of water courses [24]. The reduced irrigation with the aim to save excessive water application is receiving considerable attention from the scientific and farming communities. This is assumed to be a reliable water management practice to enhance water use efficiency and quality in the agricultural production system. Previous studies have indicated that the above practice saves irrigation water and improves or maintains crop production [25,26].
The current study observed that N losses were significantly enhanced with chemical fertilization (Figs. 1–3). The six-year study showed that the N losses (TN, NH4-N, and NO3-N) gradually increased each year (Fig. 3), as assumed in the hypothesis. The stage-wise study noted that the losses were high near the fertilization day and then declined effectively. This could be associated with the fixation with soil particles, volatilization losses, plant uptake, and leaching losses [27]. This study compares the effects of the chemical, compound, and organic fertilizers to test the various environmental characteristics, i.e., leaching losses and crop nutritional contents. Corn is a highly exhaustive crop, which needs a higher dose of chemical fertilizers to complete its growth and development cycle, resulting in a huge part in leaching losses.
It was also observed that the loss amount of NO3−-N was higher than NH4+-N (Figs. 1 and 2); such a phenomenon has been observed in previously published studies [28,29]. This could be because of the higher stability of NH4+-N in the agroecosystem and its binding capacity with the colloidal soil particles. Furthermore, the study concludes that N input capitalizes the dissolution of insoluble phosphates in the agroecosystem [30]. The N and P losses were significantly higher with chemical fertilization (CON) compared to compound and integrated use of organic with inorganic fertilizers (BMP2 and BMP3). The N losses are highly controlled by irrigation management, the dose of water applied, soil properties, and the crop growth stage. Using compound and organic fertilizers lowers the speed of N availability and its mineralization, effectively affecting the losses [30,31].
Rapid release of nutrients is an important factor contributing to agricultural nonpoint pollution, as observed in the CON treatment of the current study. Chemical fertilizers have high loss risks due to fast nutrient release. The results demonstrated that N and P losses were increased in the CON treatment compared to KF, BMP1, BMP2, and BMP3 throughout the six-year experiment. The nutrient uptake in straw and grains was significantly enhanced in all treatments compared to CON, ultimately increasing grain yield (Figs. 4 and 5). The higher nutrient use efficiency is a remarkable tool to control environmental pollution, as described in previous studies [22,32]. The KF treatment indicated that decreasing the fertilizer dose could decrease the N loss. In the case of BMP2, organic inputs helped control the losses, as this could have enhanced the soil organic contents and the water retaining capacity [33]. A study [34] concluded that using organic fertilizer reduced the nitrification and associated N losses significantly more than inorganic fertilization. Therefore, it is assumed the release of nutrients in organic fertilizers is much lower than in traditional farming practices. A study has shown similar findings where organic inputs reduced the N losses by 15%–18% [35,36].
The techniques to reduce the N and P losses are divided into two categories: (i) in-field management and (ii) edge-of-field management. The in-field effectively reduces the nonpoint pollution load at the source point, including optimized cropping, reduced water use, and conservation tillage. Crop optimization can effectively enhance nutrient use efficiency and uptake [37] and is mainly important to control the P losses and improve its concentration in grains [38]. The fertilizer application rate in each cropping system has variability, mainly attributed to the differences in fertilizer type, application habit, and planting system [39]. In this study, we have used the PCA to test the association among all the studied variables (Fig. 7). It has indicated that leaching losses were negatively correlated with the crop nutrients uptake.
The results achieved herein speculated that excessive, higher dose and continuous application of inorganic fertilizers results in higher N losses (Fig. 6) and accumulation in soils and significantly supported our hypothesis. The N application in the form of NH4-N can easily be fixed with the soil clay particles [40], reducing N mobility and affecting N losses. The use of agronomic practices is directly affected by the farmers’ managing strategies; hence, policies should be implemented to limit nonpoint source pollution. The improvement in grain yield and grain accumulated nutrients are also among the major contributor to reducing the losses. United States has introduced insurance policies for the farming community to adopt the N management best plans to reduce pollution in agriculture [41]. The Danish government introduced the N-fertilizer application tax to control nonpoint pollution. These taxes vary with the kind (organic or inorganic) and dose of the fertilizers [42]. Developing countries, especially China, require such regulations to control nonpoint pollution and enhance resource utilization in the land, water, and fertilizers. Adopting these measures will result in reduced fertilizers application, high economic benefits, and reduced agricultural and environmental issues. The non-government organizations (NGOs) can also play a part in guiding the farming community toward sustainable agriculture.
Reducing fertilizer rates with water-saving techniques is an effective practice for corn cultivation in the Yellow River Irrigation Region of Ningxia Plain, China. The results concluded that TN, TSN, NO3-N, NH4-N, TP, and TSP leaching losses were generally reduced with the combined use of organic and inorganic fertilizers and controlled irrigation. It is also an innovative approach to reducing water pollution and water safety. Moreover, it also improved nutrient concentration in straw and grain. Farmers can adopt such techniques to minimize fertilization costs, save water, and limit leaching losses. Further studies are needed to explore the impacts of reduced fertilization and water-saving irrigation on leaching losses. In addition, benefits at different climatic conditions, soil types, fertilizer types, and application methods can also be addressed.
Funding Statement: This study received funds from the National Natural Science Foundation of China [41361062], National Natural Science Foundation of China Joint Fund for Regional Innovation and Development [U20A20114], Natural Science Foundation of Ningxia Hui Autonomous Region [2022AAC03449], and Station of Observation and Experiment National Agricultural Environment in Yinchuan, Ningxia, China [NAES091AE18].
Author Contributions: The authors confirm their contribution to the paper as follows: study conception and design: Xiaotong Liu, Muhammad Amjad Bashir, Yucong Geng, Xuejun Zhang, and Hongbin Liu; data collection: Xiaotong Liu, Muhammad Amjad Bashir, Qurat-Ul-Ain Raza, Xuejun Zhang, Jianhang Luo, and Ying Zhao; analysis and interpretation of results: Xiaotong Liu, Muhammad Amjad Bashir, Qurat-Ul-Ain Raza, Ying Zhao, Muhammad Aon, and Abdur Rehim; draft manuscript preparation: Xiaotong Liu, Xuejun Zhang, Muhammad Amjad Bashir, Qurat-Ul-Ain Raza, Jianhang Luo, and Hongbin Liu. All authors reviewed the results and approved the final version of the manuscript.
Conflicts of Interest: The authors have no relevant financial or non-financial interests to disclose.
References
1. Mc Carthy, U., Uysal, I., Badia-Melis, R., Mercier, S., O’Donnell, C. et al. (2018). Global food security–issues, challenges and technological solutions. Trends in Food Science & Technology, 77, 11–20. https://doi.org/10.1016/j.tifs.2018.05.002 [Google Scholar] [CrossRef]
2. Chen, L., Chang, J., Wang, Y., Guo, A., Liu, Y. et al. (2021). Disclosing the future food security risk of China based on crop production and water scarcity under diverse socioeconomic and climate scenarios. Science of Total Environment, 790, 148110. https://doi.org/10.1016/j.scitotenv.2021.148110 [Google Scholar] [PubMed] [CrossRef]
3. Cui, N., Cai, M., Zhang, X., Abdelhafez, A. A., Zhou, L. (2020). Runoff loss of nitrogen and phosphorus from a rice paddy field in the east of China: Effects of long-term chemical N fertilizer and organic manure applications. Global Ecology and Conservation, 22(4), e01011. https://doi.org/10.1016/j.gecco.2020.e01011 [Google Scholar] [CrossRef]
4. Qiao, J., Wang, J., Zhao, D., Zhou, W., Schwenke, G. et al. (2022). Optimizing N fertilizer rates sustained rice yields, improved N use efficiency, and decreased N losses via runoff from rice-wheat cropping systems. Agriculture, Ecosystems & Environment, 324(4), 107724. https://doi.org/10.1016/j.agee.2021.107724 [Google Scholar] [CrossRef]
5. Han, J., Xin, Z., Han, F., Xu, B., Wang, L. et al. (2021). Source contribution analysis of nutrient pollution in a P-rich watershed: Implications for integrated water quality management. Environmental Pollution, 279(3), 116885. https://doi.org/10.1016/j.envpol.2021.116885 [Google Scholar] [PubMed] [CrossRef]
6. Rahman, K. M. A., Zhang, D. (2018). Effects of fertilizer broadcasting on the excessive use of inorganic fertilizers and environmental sustainability. Sustainability, 10(3), 759. https://doi.org/10.3390/su10030759 [Google Scholar] [CrossRef]
7. Loague, K., Corwin, D. L. (2005). Point and non-point source pollution. In: Encyclopedia of hydrological sciences. New York: John Wiley & Sons, Ltd. [Google Scholar]
8. Wang, X. (2006). Management of agricultural nonpoint source pollution in China: Current status and challenges. Water Science and Technology, 53(2), 1–9. https://doi.org/10.2166/wst.2006.033 [Google Scholar] [PubMed] [CrossRef]
9. Wang, R., Wang, Q., Dong, L., Zhang, J. (2021). Cleaner agricultural production in drinking-water source areas for the control of non-point source pollution in China. Journal of Environmental Management, 285(3), 112096. https://doi.org/10.1016/j.jenvman.2021.112096 [Google Scholar] [PubMed] [CrossRef]
10. Hou, L., Zhou, Z., Wang, R., Li, J., Dong, F. et al. (2022). Research on the non-point source pollution characteristics of important drinking water sources. Water, 14(2), 211. https://doi.org/10.3390/w14020211 [Google Scholar] [CrossRef]
11. Mohammadi, A., Besharat, S., Abbasi, F. (2019). Effects of irrigation and fertilization management on reducing nitrogen losses and increasing corn yield under furrow irrigation. Agricultural Water Management, 213(4), 1116–1129. https://doi.org/10.1016/j.agwat.2018.11.007 [Google Scholar] [CrossRef]
12. del Pilar Muschietti-Piana, M., Cipriotti, P. A., Urricariet, S., Peralta, N. R., Niborski, M. (2018). Using site-specific nitrogen management in rainfed corn to reduce the risk of nitrate leaching. Agricultural Water Management, 199, 61–70. https://doi.org/10.1016/J.AGWAT.2017.12.002 [Google Scholar] [CrossRef]
13. Geng, Y., Bashir, M. A., Zhao, Y., Luo, J., Liu, X. et al. (2022). Long-term fertilizer reduction in greenhouse tomato-cucumber rotation system to assess N utilization, leaching, and cost efficiency. Sustainability, 14(8), 4647. https://doi.org/10.3390/su14084647 [Google Scholar] [CrossRef]
14. Li, C., Xiong, Y., Cui, Z., Huang, Q., Xu, X. et al. (2020). Effect of irrigation and fertilization regimes on grain yield, water and nitrogen productivity of mulching cultivated maize (Zea mays L.) in the Hetao Irrigation District of China. Agriculture Water Management, 232, 106065. https://doi.org/10.1016/j.agwat.2020.106065 [Google Scholar] [CrossRef]
15. Li, Y. (2006). Water saving irrigation in China. Irrigation and Drainage, 55(3), 327–336. [Google Scholar]
16. Zhao, Y., Luo, J. H., Chen, X. Q., Zhang, X. J., Zhang, W. L. (2012). Greenhouse tomato-cucumber yield and soil N leaching as affected by reducing N rate and adding manure: A case study in the Yellow River Irrigation Region China. Nutrient Cycling in Agroecosystems, 94(2–3), 221–235. https://doi.org/10.1007/s10705-012-9535-8 [Google Scholar] [CrossRef]
17. Chen, B., Zhang, Z., Yan, L., Hou, X., Zhang, W. (2017). Effects of different row spacing and planting density on the main agronomic characters and yield of a maize variety Xianyu 335. Agricultural Science & Technology, 18(5), 801–804. [Google Scholar]
18. Wang, D., Guo, L., Zheng, L., Zhang, Y., Yang, R. et al. (2019). Effects of nitrogen fertilizer and water management practices on nitrogen leaching from a typical open field used for vegetable planting in Northern China. Agricultural Water Management, 213(4), 913–921. https://doi.org/10.1016/j.agwat.2018.12.015 [Google Scholar] [CrossRef]
19. Bashir, M. A., Zhai, L., Liu, J., Wang, H. Y., Raza, Q. U. A. et al. (2022). Apparent variations in nitrogen runoff and its uptake in paddy rice under straw incorporation. Journal of Integrative Agriculture, 21(11), 3356–3367. https://doi.org/10.1016/j.jia.2022.08.062 [Google Scholar] [CrossRef]
20. Gai, X., Liu, H., Zhai, L., Tan, G., Liu, J. et al. (2016). Vegetable yields and soil biochemical properties as influenced by fertilization in Southern China. Applied Soil Ecology, 107, 170–181. https://doi.org/10.1016/j.apsoil.2016.06.001 [Google Scholar] [CrossRef]
21. Liu, J., Ouyang, X., Shen, J., Li, Y., Sun, W. et al. (2020). Nitrogen and phosphorus runoff losses were influenced by chemical fertilization but not by pesticide application in a double rice-cropping system in the subtropical hilly Region of China. Science of the Total Environment, 715(1), 136852. https://doi.org/10.1016/j.scitotenv.2020.136852 [Google Scholar] [PubMed] [CrossRef]
22. Bashir, M. A., Wang, H., Sun, W., Zhai, L., Zhang, X. et al. (2021). The implementation of rice-crab co-culture system to ensure cleaner rice and farm production. Journal of Cleaner Production, 316, 128284. https://doi.org/10.1016/j.jclepro.2021.128284 [Google Scholar] [CrossRef]
23. Liu, H., Zou, G., Fan, X., Liu, S., Ren, T. (2015). Farmland non-point source pollution monitoring methods and practices. Beijing, China: Science Press. [Google Scholar]
24. Li, J., Liu, H., Wang, H., Luo, J., Zhang, X. et al. (2018). Managing irrigation and fertilization for the sustainable cultivation of greenhouse vegetables. Agriculture Water Management, 210, 354–363. https://doi.org/10.1016/j.agwat.2018.08.036 [Google Scholar] [CrossRef]
25. Shao, G., Cui, J., Yu, S., Lu, B., Brian, B. J. et al. (2015). Impacts of controlled irrigation and drainage on the yield and physiological attributes of rice. Agricultural Water Management, 149(5), 156–165. https://doi.org/10.1016/J.AGWAT.2014.11.002 [Google Scholar] [CrossRef]
26. de Vries, M. E., Rodenburg, J., Bado, B. V., Sow, A., Leffelaar, P. A. et al. (2010). Rice production with less irrigation water is possible in a Sahelian environment. Field Crop Research, 116(1–2), 154–164. https://doi.org/10.1016/J.FCR.2009.12.006 [Google Scholar] [CrossRef]
27. Zhou, M., Zhu, B., Brüggemann, N., Bergmann, J., Wang, Y. et al. (2014). N2O and CH4 emissions, and NO3-leaching on a crop-yield basis from a subtropical rain-fed wheat-maize rotation in response to different types of nitrogen fertilizer. Ecosystems, 17(2), 286–301. https://doi.org/10.1007/S10021-013-9723-7 [Google Scholar] [CrossRef]
28. Gao, S., Yu, S., Wang, M., Meng, J., Tang, S. et al. (2018). Improving water productivity and reducing nutrient losses by controlled irrigation and drainage in Paddy fields. Polish Journal of Environmental Studies, 27(3), 1049–1059. https://doi.org/10.15244/pjoes/76791 [Google Scholar] [CrossRef]
29. Zhao, X., Zhou, Y., Min, J., Wang, S., Shi, W. et al. (2012). Nitrogen runoff dominates water nitrogen pollution from rice-wheat rotation in the Taihu Lake Region of China. Agriculture, Ecosystem & Environment, 156, 1–11. https://doi.org/10.1016/j.agee.2012.04.024 [Google Scholar] [CrossRef]
30. Qi, D., Wu, Q., Zhu, J. (2020). Nitrogen and phosphorus losses from paddy fields and the yield of rice with different water and nitrogen management practices. Scientific Reports, 10(1), 9734. https://doi.org/10.1038/s41598-020-66757-5 [Google Scholar] [PubMed] [CrossRef]
31. Fronczyk, J., Sieczka, A., Lech, M., Radziemska, M., Lechowicz, Z. (2016). Transport of nitrogen compounds through subsoils in agricultural areas: Column tests. Polish Journal of Environmental Studies, 25(4), 1505–1514. https://doi.org/10.15244/pjoes/62340 [Google Scholar] [CrossRef]
32. Bashir, M. A., Liu, J., Geng, Y., Wang, H., Pan, J. et al. (2020). Co-culture of rice and aquatic animals: An integrated system to achieve production and environmental sustainability. Journal of Cleaner Production, 249(80), 119310. https://doi.org/10.1016/j.jclepro.2019.119310 [Google Scholar] [CrossRef]
33. Bulluck, L. R., Brosius, M., Evanylo, G. K., Ristaino, J. B. (2002). Organic and synthetic fertility amendments influence soil microbial, physical and chemical properties on organic and conventional farms. Applied Soil Ecology, 19(2), 147–160. https://doi.org/10.1016/S0929-1393(01)00187-1 [Google Scholar] [CrossRef]
34. Koper, T. E., Stark, J. M., Habteselassie, M. Y., Norton, J. M. (2010). Nitrification exhibits Haldane kinetics in an agricultural soil treated with ammonium sulfate or dairy-waste compost. FEMS Microbiology Ecology, 74(2), 316–322. https://doi.org/10.1111/j.1574-6941.2010.00960.x [Google Scholar] [PubMed] [CrossRef]
35. Shan, L., He, Y., Chen, J., Huang, Q., Lian, X. et al. (2015). Nitrogen surface runoff losses from a Chinese cabbage field under different nitrogen treatments in the Taihu Lake Basin China. Agricultural Water Management, 159(3), 255–263. https://doi.org/10.1016/j.agwat.2015.06.008 [Google Scholar] [CrossRef]
36. Xie, S., Yang, F., Feng, H., Yu, Z., Liu, C. et al. (2021). Organic fertilizer reduced carbon and nitrogen in runoff and buffered soil acidification in tea plantations: Evidence in nutrient contents and isotope fractionations. Science of the Total Environment, 762(9), 143059. https://doi.org/10.1016/j.scitotenv.2020.143059 [Google Scholar] [PubMed] [CrossRef]
37. Zhan, F., Fu, Z., Yang, J., Chen, J., An, T. et al. (2012). Effects of maize intercropping on characteristics of surface runoff pollution from vegetables fields in Dianchi watershed. Acta Scientiae Circumstantiae, 32(4), 847–855. [Google Scholar]
38. Wang, R., Min, J., Kronzucker, H. J., Li, Y., Shi, W. (2019). N and P runoff losses in China’s vegetable production systems: Loss characteristics, impact, and management practices. Science of the Total Environment, 663(2), 971–979. https://doi.org/10.1016/j.scitotenv.2019.01.368 [Google Scholar] [PubMed] [CrossRef]
39. Ju, X. T., Kou, C. L., Christie, P., Dou, Z. X., Zhang, F. S. (2007). Changes in the soil environment from excessive application of fertilizers and manures to two contrasting intensive cropping systems on the North China Plain. Environmental Pollution, 145(2), 497–506. https://doi.org/10.1016/j.envpol.2006.04.017 [Google Scholar] [PubMed] [CrossRef]
40. Du, L. F., Zhao, T. K., Zhang, C. J., An, Z. Z., Wu, Q. et al. (2011). Investigations on nitrate pollution of soil, groundwater and vegetable from three typical farmlands in Beijing Region, China. Agricultural Sciences in China, 10(3), 423–430. https://doi.org/10.1016/S1671-2927(11)60021-7 [Google Scholar] [CrossRef]
41. Huang, W. Y., Heifner, R. G., Taylor, H., Uri, N. D. (2001). Using insurance to enhance nitrogen fertilizer application to reduce nitrogen losses to the environment. Environmental Monitoring and Assessment, 68(3), 209–233. https://doi.org/10.1023/A:1010755424263 [Google Scholar] [PubMed] [CrossRef]
42. Berntsen, J., Petersen, B. M., Jacobsen, B. H., Olesen, J. E., Hutchings, N. J. (2003). Evaluating nitrogen taxation scenarios using the dynamic whole farm simulation model FASSET. Agricultural Systems, 76(3), 817–839. https://doi.org/10.1016/S0308-521X(02)00111-7 [Google Scholar] [CrossRef]
Appendix
Table S1: Detailed description of planting, harvesting, fertilization, and irrigation
Table S2: Types of fertilizers, sources, composition, and application time
Cite This Article
 Copyright © 2023 The Author(s). Published by Tech Science Press.
This work is licensed under a Creative Commons Attribution 4.0 International License , which permits unrestricted use, distribution, and reproduction in any medium, provided the original work is properly cited.
 Downloads
 Citation Tools