
 Submit a Paper
 Propose a Special lssue
 Open Access
ARTICLE

Selection and Validation of Reference Genes for Normalization of RT-qPCR Analysis in Developing or Abiotic-Stressed Tissues of Loquat (Eriobotrya japonica)
1 Fujian Provincial Key Laboratory of Ecology-Toxicological Effects & Control for Emerging Contaminants, College of Environmental and Biological Engineering, Putian University, Putian, 351100, China
2 Key Laboratory of Ecological Environment and Information Atlas (Putian University), Fujian Provincial University, Putian, 351100, China
* Corresponding Author: Jincheng Wu. Email:
# These authors contributed equally to this work
Phyton-International Journal of Experimental Botany 2023, 92(4), 1185-1201. https://doi.org/10.32604/phyton.2023.026752
Received 23 September 2022; Accepted 04 November 2022; Issue published 06 January 2023
 View Full Text
 Download PDF
Abstract
Loquat (Eriobotrya japonica Lindl.) is a subtropical evergreen fruit tree that produces fruits with abundant nutrients and medicinal components. Confirming suitable reference genes for a set of loquat samples before qRT-PCR experiments is essential for the accurate quantification of gene expression. In this study, eight candidate reference genes were selected from our previously published RNA-seq data, and primers for each candidate reference gene were designed and evaluated. The Cq values of the candidate reference genes were calculated by RT-qPCR in 31 different loquat samples, including 12 subgroups of developing or abiotic-stressed tissues. Different combinations of stable reference genes were screened according to a comprehensive rank, which was synthesized from the results of four algorithms, including the geNorm, NormFinder, BestKeeper and ΔCt methods. The screened reference genes were verified by normalizing EjLGA1 in each subgroup. The obtained suitable combinations of reference genes for accurate normalization were GAPDH, EF1α and ACT for floral development; GAPDH, UBCE and ACT for fruit setting; EF1α, GAPDH and eIF2B for fruit ripening; ACT, EF1α and UBCE for leaves under heat stress; eIF2B, UBCE and EF1α for leaves under freezing stress; EF1α, TUA and UBCE for leaves under salt stress; ACT, EF1α and eIF2B for immature pulp under freezing stress; ACT, UBCE and eIF2B for immature seeds under freezing stress; EF1α, eIF2B and UBCE for both immature pulp and seeds under freezing stress; UBCE, TUB and TUA for red-fleshed fruits under cold-storage stress; eIF2B, RPS3 and TUB for white-fleshed fruits under cold-storage stress; and eIF2B, UBCE and RPS3 for both red- and white-fleshed fruits under cold-storage stress. This study obtained different combinations of stable reference genes for accurate normalization in twelve subgroups of developing or abiotic-stressed tissues in loquat. To our knowledge, this is the first report to obtain stable reference genes for normalizing gene expression of abiotic-stressed tissues in E. japonica. The use of the three most stable reference genes could increase the reliability of future quantification experiments.Keywords
Abbreviations
| ACT | Actin |
| EF1α | Elongation factor 1-alpha |
| eIF2B | Translation initiation factor eIF-2B subunit alpha |
| GAPDH | Glyceraldehyde-3-phosphate dehydrogenase |
| RPS3 | Ribosomal protein S3 |
| TUA | Tubulin alpha chain |
| TUB | Tubulin beta-1 chain |
| UBCE | Ubiquitin-conjugating enzyme E2 |
Loquat (Eriobotrya japonica Lindl.) is a subtropical evergreen fruit tree with fruit that is edible, providing abundant nutrients, and has medicinal uses, relieving coughs and asthma [1]. Many studies have focused on the functions of specific genes in loquat. Quantifying gene transcript abundance is a frequently used and effective strategy to predict gene functions and determine targets for loquat functional research [2–4]. An understanding of the gene expression characteristics of developing and abiotic-stressed tissues of loquat will improve the breeding of loquat cultivars with high quality and stress tolerance.
Reverse transcription-quantitative real-time PCR (RT-qPCR) is an established benchmark technique that is widely used for quantifying the abundance of steady-state mRNA in biological samples because of its simplicity, specificity, sensitivity, wide dynamic range, potential for high throughput and accuracy [5,6]. In addition, it is considered to be the most accurate and reliable method and often serves to validate data obtained by other methods, such as cDNA microarray or RNA-seq [7]. Absolute quantification and relative quantification are two primary methods used to present RT-qPCR data. Absolute expression requires a standard curve to transform the RT-qPCR data to yield an exact copy number, while relative expression presents RT-qPCR data relative to reference genes as a fold change level. In fact, RT-qPCR data often do not need to be presented by using the absolute quantification method, and relative quantification is sufficient [8].
A widely used method to present relative gene expression is the
The screening of suitable reference genes has been carried out in many species. Tong et al. found that TEF2, UBQ10 and RP II were the three most suitable reference genes for peach samples [18]. Chen et al. reported that the RPS2 and UBQ2 genes were the most suitable reference genes across all tested banana samples, and different banana sample sets should select different suitable reference gene(s) [19]. Perini et al. concluded that MDH, SAND, THFS, TMp1 and WD40 were the best reference genes for RT-qPCR in various apple tissues [20]. In loquat, the Actin gene has been widely used to normalize gene expression under different experimental conditions, such as fruit pulp coloration, floral initiation, fruit cell division [16], fruitlets under freezing stress [21], and postharvest fruits under chilling stress [22]. However, Su et al. revealed that the Actin gene was not always suitable for detecting expression in all samples. RPL4, RPL18, HIS3 and TUA3 were the four most stable reference genes across all of the tested loquat samples, including fruits, ovules and seeds, floral tissues and vegetative tissues, while the Actin gene was the sixth choice [16]. Therefore, suitable reference genes should be further confirmed for other developing or abiotic-stressed tissues for which screening of reference genes was not performed.
In this study, eight candidate reference genes were selected from our previously published RNA-seq data [1], and primers for each candidate reference gene were designed and evaluated. Moreover, the Cq values of the candidate reference genes were calculated by RT-qPCR in 31 different loquat samples, including 12 subgroups of developing or abiotic-stressed tissues. Then, the Cq values were analysed using four algorithms (geNorm, NormFinder, BestKeeper and ΔCt), and the four results were synthesized to obtain a comprehensive rank to confirm the suitable reference genes for each subgroup. Finally, to verify the results, the expression abundance of EjLGA1 in each subgroup was normalized to the screened reference genes.
The loquat cultivars ‘Zaozhong No. 6’ (ZZ6), ‘Jiefangzhong’ (JFZ) and ‘Baili’ (BL) were used and prepared according to our previously published methods with some modification [1,3]. Loquat seedlings and mature trees were both grown in an outdoor nursery and managed by conventional agronomic methods. For seedlings, loquat scions of the ZZ6 cultivar were collected from mature loquat trees and grafted to one-year-old loquat seedlings that were cultured in cloth bags (25 cm in diameter and 20 cm in height) filled with nursery soil in winter. The next summer, the grafted container seedlings were treated under heat (40°C; Lh I: 0 h, Lh II: 1 h, Lh III: 2 h), freezing (−3°C; Lf I: 0 h, Lf II: 1 h, Lf III: 2 h) and salt (NaCl; Ls I: 0 mM, Ls II: 100 mM, Ls III: 200 mM) stress. After each abiotic stress treatment, the 3rd–5th leaves of each grafted container seedling were individually sampled and mixed. When the floral tissues developed, the floral meristems (Fd I), buds (Fd II) and flowers (Fd III) were successively sampled and grouped as floral development samples. After that, flowers in full bloom (Fs I), fruitlets at 15 d after full bloom (DAF) (Fs II), and fruitlets at 30 DAF (Fs III) were collected and grouped as fruit setting samples. Grafted container seedlings with 60 DAF young fruits were exposed at 12°C for 5 d of cold acclimation and then treated with freezing stress (6 h; Ff I: 25°C, Ff II: −1°C, Ff III: −3°C). The pulp and seeds of young fruits were sampled. For mature trees, the flowers were removed except those in full bloom, which were defined as 0 DAF, in the red-fleshed cultivar JFZ and white-fleshed cultivar BL. When the fruits reached 40 DAF, four uniform fruits were reserved and bagged per cluster. The fruit samples were peeled and rapidly seeded before being frozen in liquid nitrogen. The fruit ripening samples were sampled from the JFZ cultivar at 70 DAF (Fr I), 90 DAF (Fr II), 110 DAF (Fr III), and 130 DAF (Fr IV). For the postharvest cold-storage samples, the mature fruits (125 DAF) of two cultivars were stored at 4°C and sampled after 0, 14 and 28 d (red-fleshed fruits: Jcs I: 0 d, Jcs II: 14 d, Jcs III: 28 d; white-fleshed fruits: Bcs I: 0 d, Bcs II: 14 d, Bcs III: 28 d). Three biological replicates were performed for each sample. For the samples from seedlings, each replicate was sampled and mixed from three grafted container seedlings. For the samples from mature trees, each replicate contained the samples collected from five bagged fruit clusters. All samples were frozen in liquid nitrogen, ground and mixed with an A11 mill (IKA, Germany), and stored at −80°C. The plant materials and sampling processes are also shown in Fig. 1.
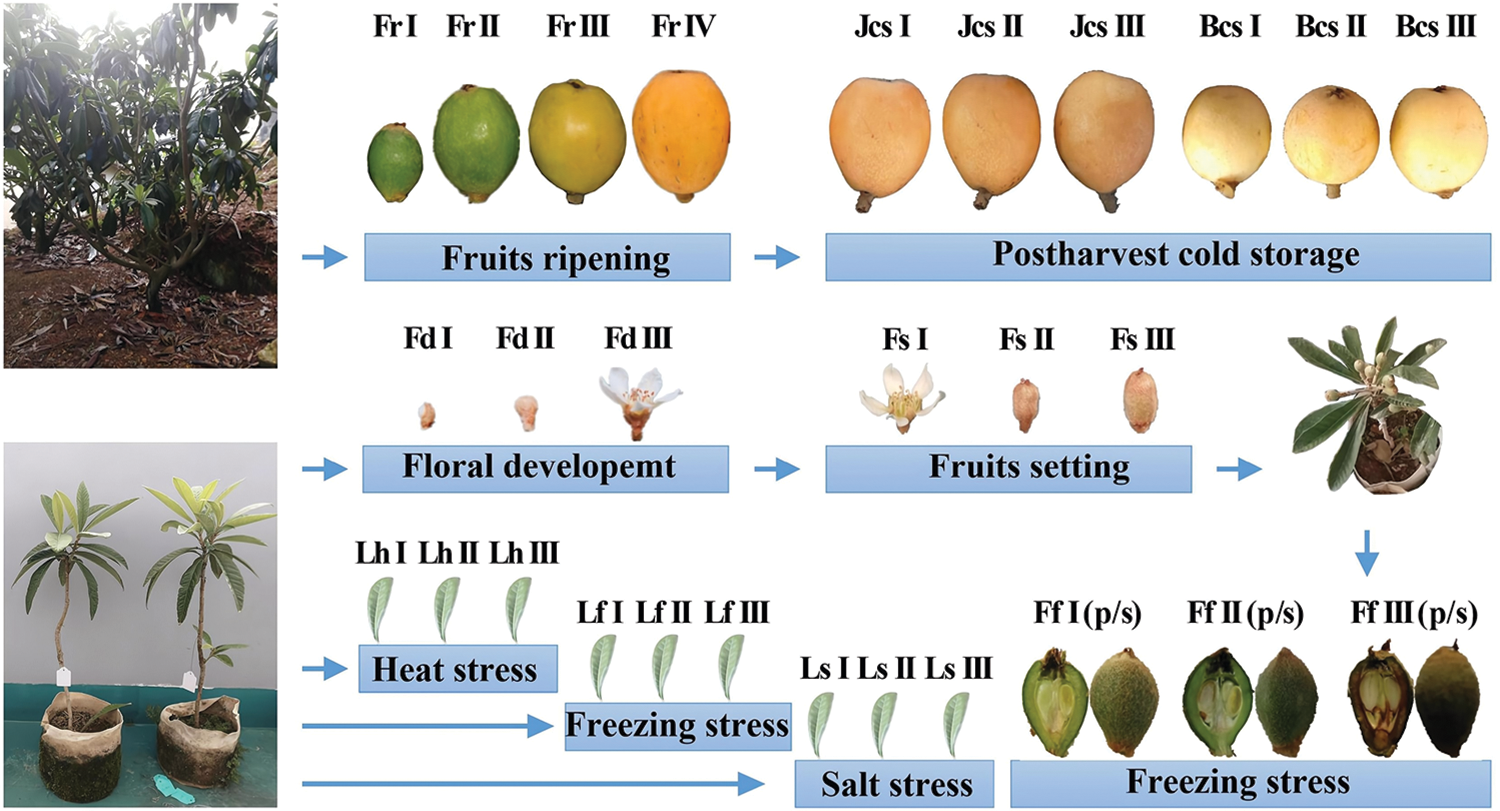
Figure 1: Plant materials and sampling processes. Floral development: Fd I: Floral meristem, Fd II: Bud, Fd III: Flower; fruit setting: Fs I: Full bloom, Fs II: 15 DAF, Fs III: 30 DAF; fruit ripening: Fr I: 70 DAF, Fr II: 90 DAF, Fr III: 110 DAF, Fr IV: 130 DAF; postharvest cold storage: Red-fleshed fruits (125 DAF): Jcs I: 0 d, Jcs II: 14 d, Jcs III: 28 d; white-fleshed fruits (125 DAF): Bcs I: 0 d, Bcs II: 14 d, Bcs III: 28 d; leaves under heat stress (40°C): Lh I: 0 h, Lh II: 1 h, Lh III: 2 h; leaves under freezing stress (−3°C): Lf I: 0 h, Lf II: 1 h, Lf III: 2 h; leaves under salt stress (NaCl): Ls I: 0 mM, Ls II: 100 mM, Ls III: 200 mM; young fruits under freezing stress (6 h): Ff I: 25°C, Ff II: −1°C, Ff III: −3°C; (p/s): Pulp/seeds
2.2 RNA Extraction, cDNA Synthesis and RT-qPCR
Total RNA was extracted using the E.Z.N.A Plant RNA Kit (Omega, USA) with DNase I digestion. The cDNAs were synthesized from RNAs that passed quality control by using the PrimeScript™ RT reagent Kit with gDNA Eraser (Perfect Real Time) (Takara, Japan). The RT-qPCR experiments were carried out with CFX Connect (Bio-Rad, USA) and SYBR Premix Ex Taq (Tli RNaseH Plus) (Takara, Japan) as previously described [1]. Three technological repeats were performed for each biological replicate. All kits were operated according to the manufacturer’s instructions. The obtained Cq values were used for further data analysis.
2.3 Candidate Reference Gene Selection and Primer Verification
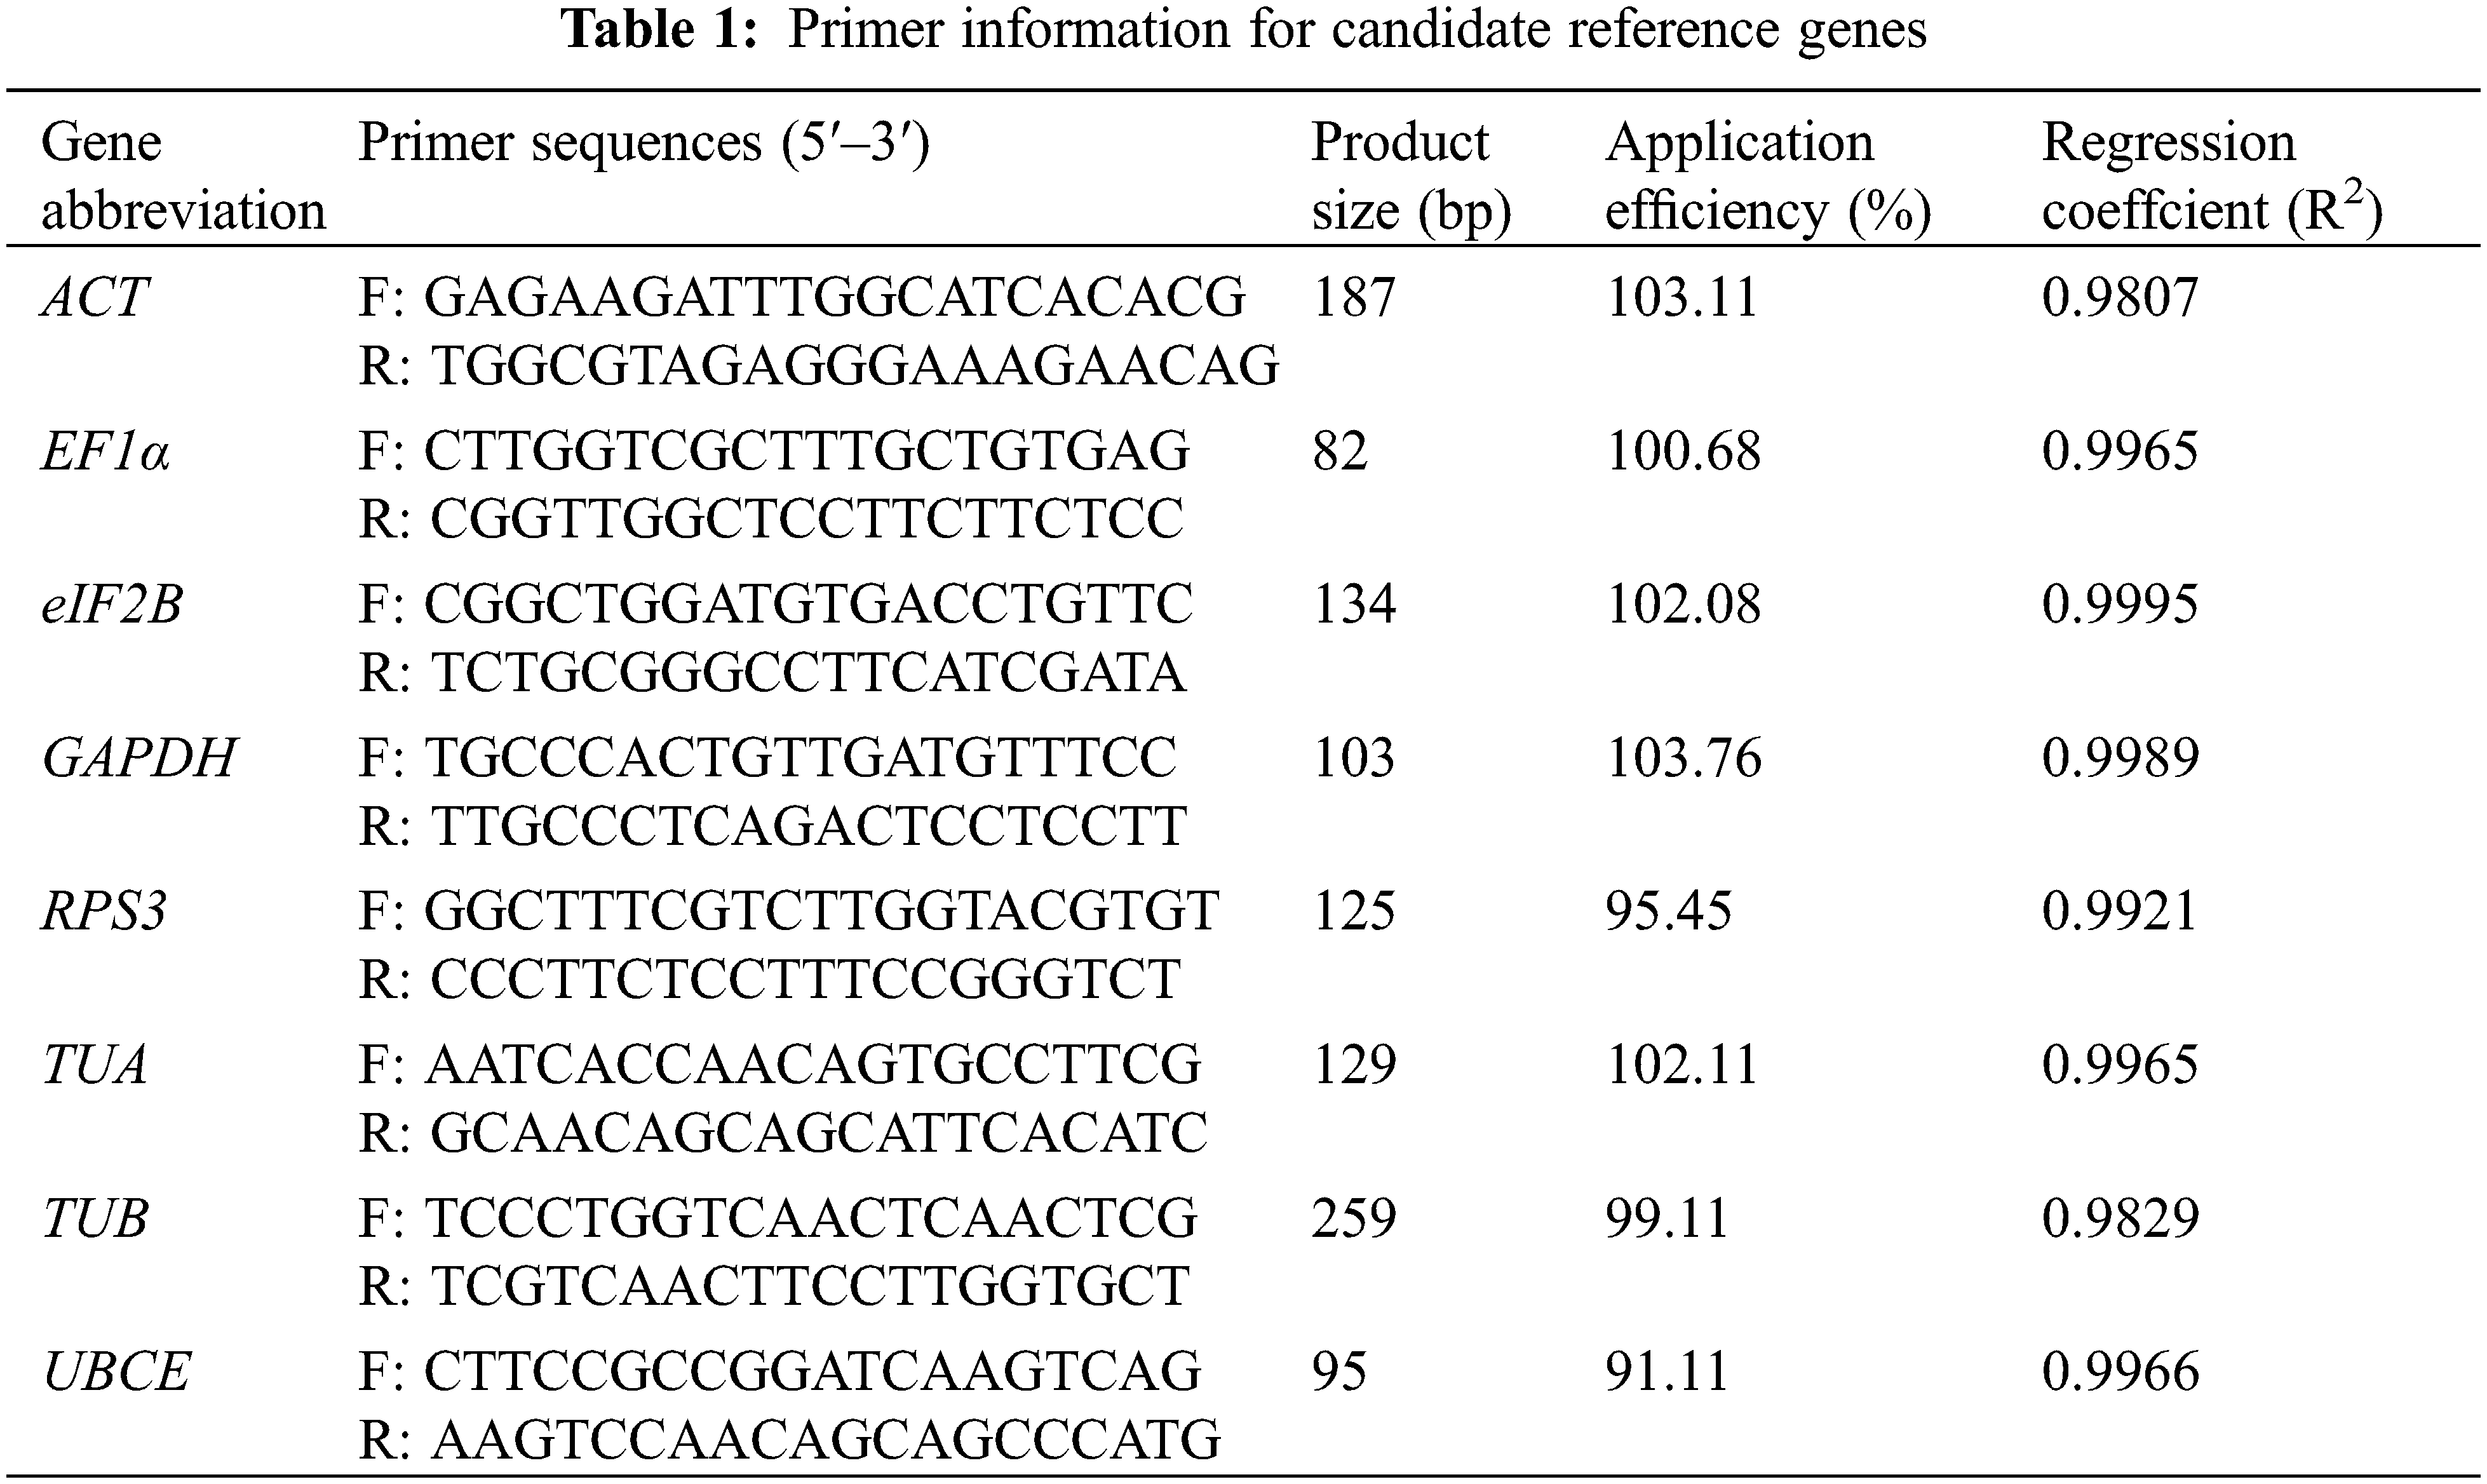
Eight commonly used reference genes in other species were selected as candidate reference genes, including Actin (ACT), Elongation factor 1-alpha (EF1α), Translation initiation factor eIF-2B subunit alpha (eIF2B), Glyceraldehyde-3-phosphate dehydrogenase (GAPDH), Ribosomal protein S3 (RPS3), Tubulin alpha chain (TUA), Tubulin beta-1 chain (TUB), and Ubiquitin-conjugating enzyme E2 (UBCE). The sequence of these candidate reference genes came from our previously published loquat RNA-seq data according to the annotation [1]. The RT-qPCR primers were designed by NCBI Primer-BLAST (https://www.ncbi.nlm.nih.gov/tools/primer-blast/) with the following parameters: annealing temperature (Tm) of 56°C–64°C (optimal 60°C), primer length of 18–22 bp (optimal 20 bp), GC contents of 40%–60% (optimal 50%), and product size of 80–300 bp. Detailed information on the primers is listed in Table 1. The primer specificities were evaluated by melt curve analysis and electrophoretic analysis. After that, the amplification efficiency (AE) and correlation coefficient (R2) of each pair of primers were calculated according to the Schmittgen and Livak method [8]. The AE values of the qualified pairs of primers should lie between 90% and 110%, and the R2 should be greater than 0.98.
2.4 Stability Analysis of Candidate Reference Genes
The Cq values of the candidate reference genes in different samples were calculated by RT-qPCR and exhibited by boxplots. The expression stability of each candidate reference gene was individually analysed using the geNorm [12], NormFinder [13], BestKeeper [14] and ΔCt [15] methods, and ranked according to the results of the four algorithms. The overall rank order of the candidate reference genes was established by calculating the geometric mean of the rank orders derived from the four algorithms. A lower rank number represented a higher stability in both the rankings of the four individual algorithms and the overall rank [16,17].
2.5 Validation of Screened Reference Genes
The validation of the screened reference genes was performed according to Su’s methods [16] with some modifications. The cloned loquat gene EjLGA1 was used to verify the expression stabilities of the screened reference genes. The expression pattern of EjLGA1 was analysed by RT-qPCR (forward primer: 5′-ATGCTGTCTATTTTGATCGAAAAT-3′; reverse primer: 5′-TCACAATAAACCGGCCTCG-3′) [22] and calculated using the
3.1 Verification of Specific Primers for Selected Candidate Reference Genes
Eight candidate reference genes (ACT, EF1α, eIF2B, GAPDH, RPS3, TUA, TUB, and UBCE) were selected to design the specific primers. The Tm of the designed primers ranged from 60.65°C to 63.44°C, the GC content ranged from 47.62% to 60.00%, and the product size ranged from 82 to 259 bp (Table 1). The melt curve analysis of the RT-qPCR for each primer exhibited a single specific melt peak, and the electrophoretic analysis of RT-qPCR products showed a single specific electrophoretic band with the expected size. The AE values of the designed primers ranged from 91.11% to 103.76%, and the R2 values ranged from 0.9807 to 0.9989 (Table 1 and Fig. 2). These results suggested that the eight pairs of primers could be used for the expression stability analysis of eight candidate reference genes.
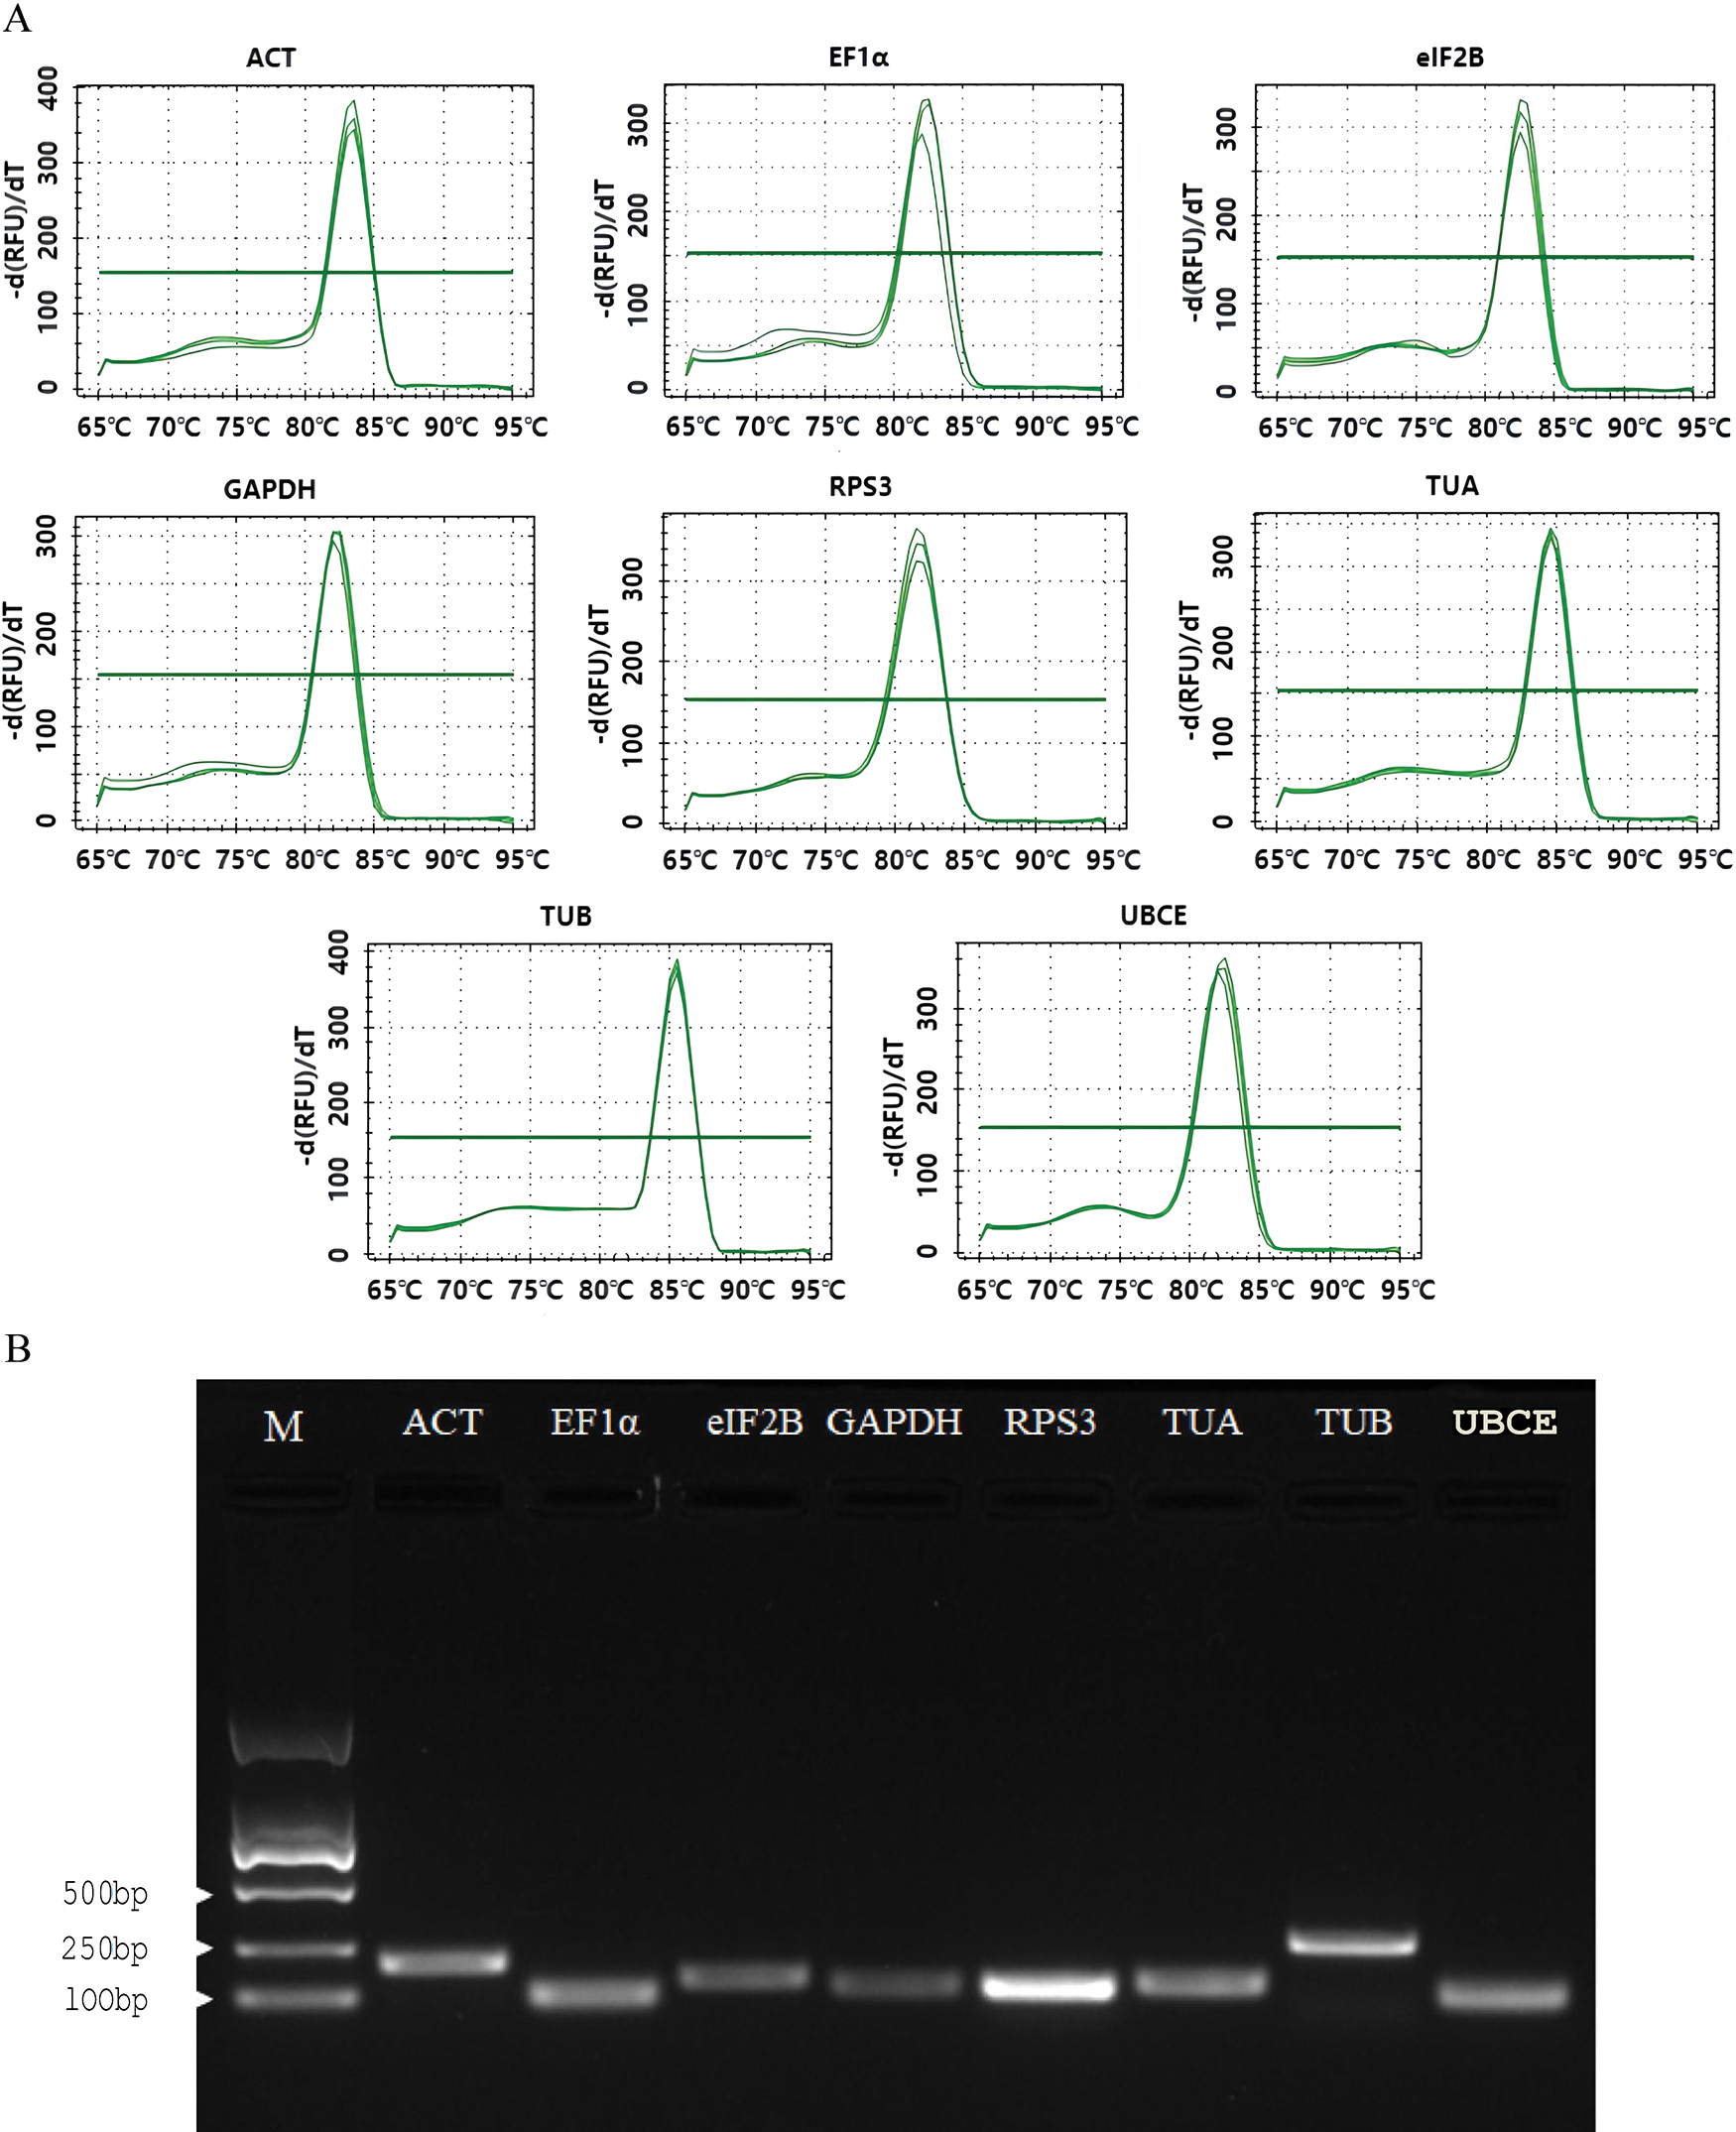
Figure 2: RT-qPCR primer specificity of the 8 candidate reference genes. (A) Melt peaks of 8 primer sets; (B) PCR products of 8 primer sets
3.2 Expression Stability of Candidate Reference Genes
The expression stability of eight candidate reference genes was investigated by RT-qPCR in 93 loquat samples (including biological replicates) that were separated into four groups, including tissue development (group I), leaves under abiotic stress of heat, freezing and salt (group II), immature fruitlets under freezing stress (group III), and postharvest fruits under chilling stress (group IV). Each group included three subgroups as follows: group I included floral development stages (A), fruit setting stages (B) and fruit ripening stages (C); group II involved leaves under heat (D), freezing (E) and salt (F) stress; group III comprised immature pulp (G), immature seeds (H) and immature pulp and seeds (I). Group IV contained red-fleshed fruits (J), white-fleshed fruits (K) and red- and white-fleshed fruits (L). The Cq value distributions of the candidate reference genes in the 4 groups and 12 subgroups are displayed in Fig. 3.
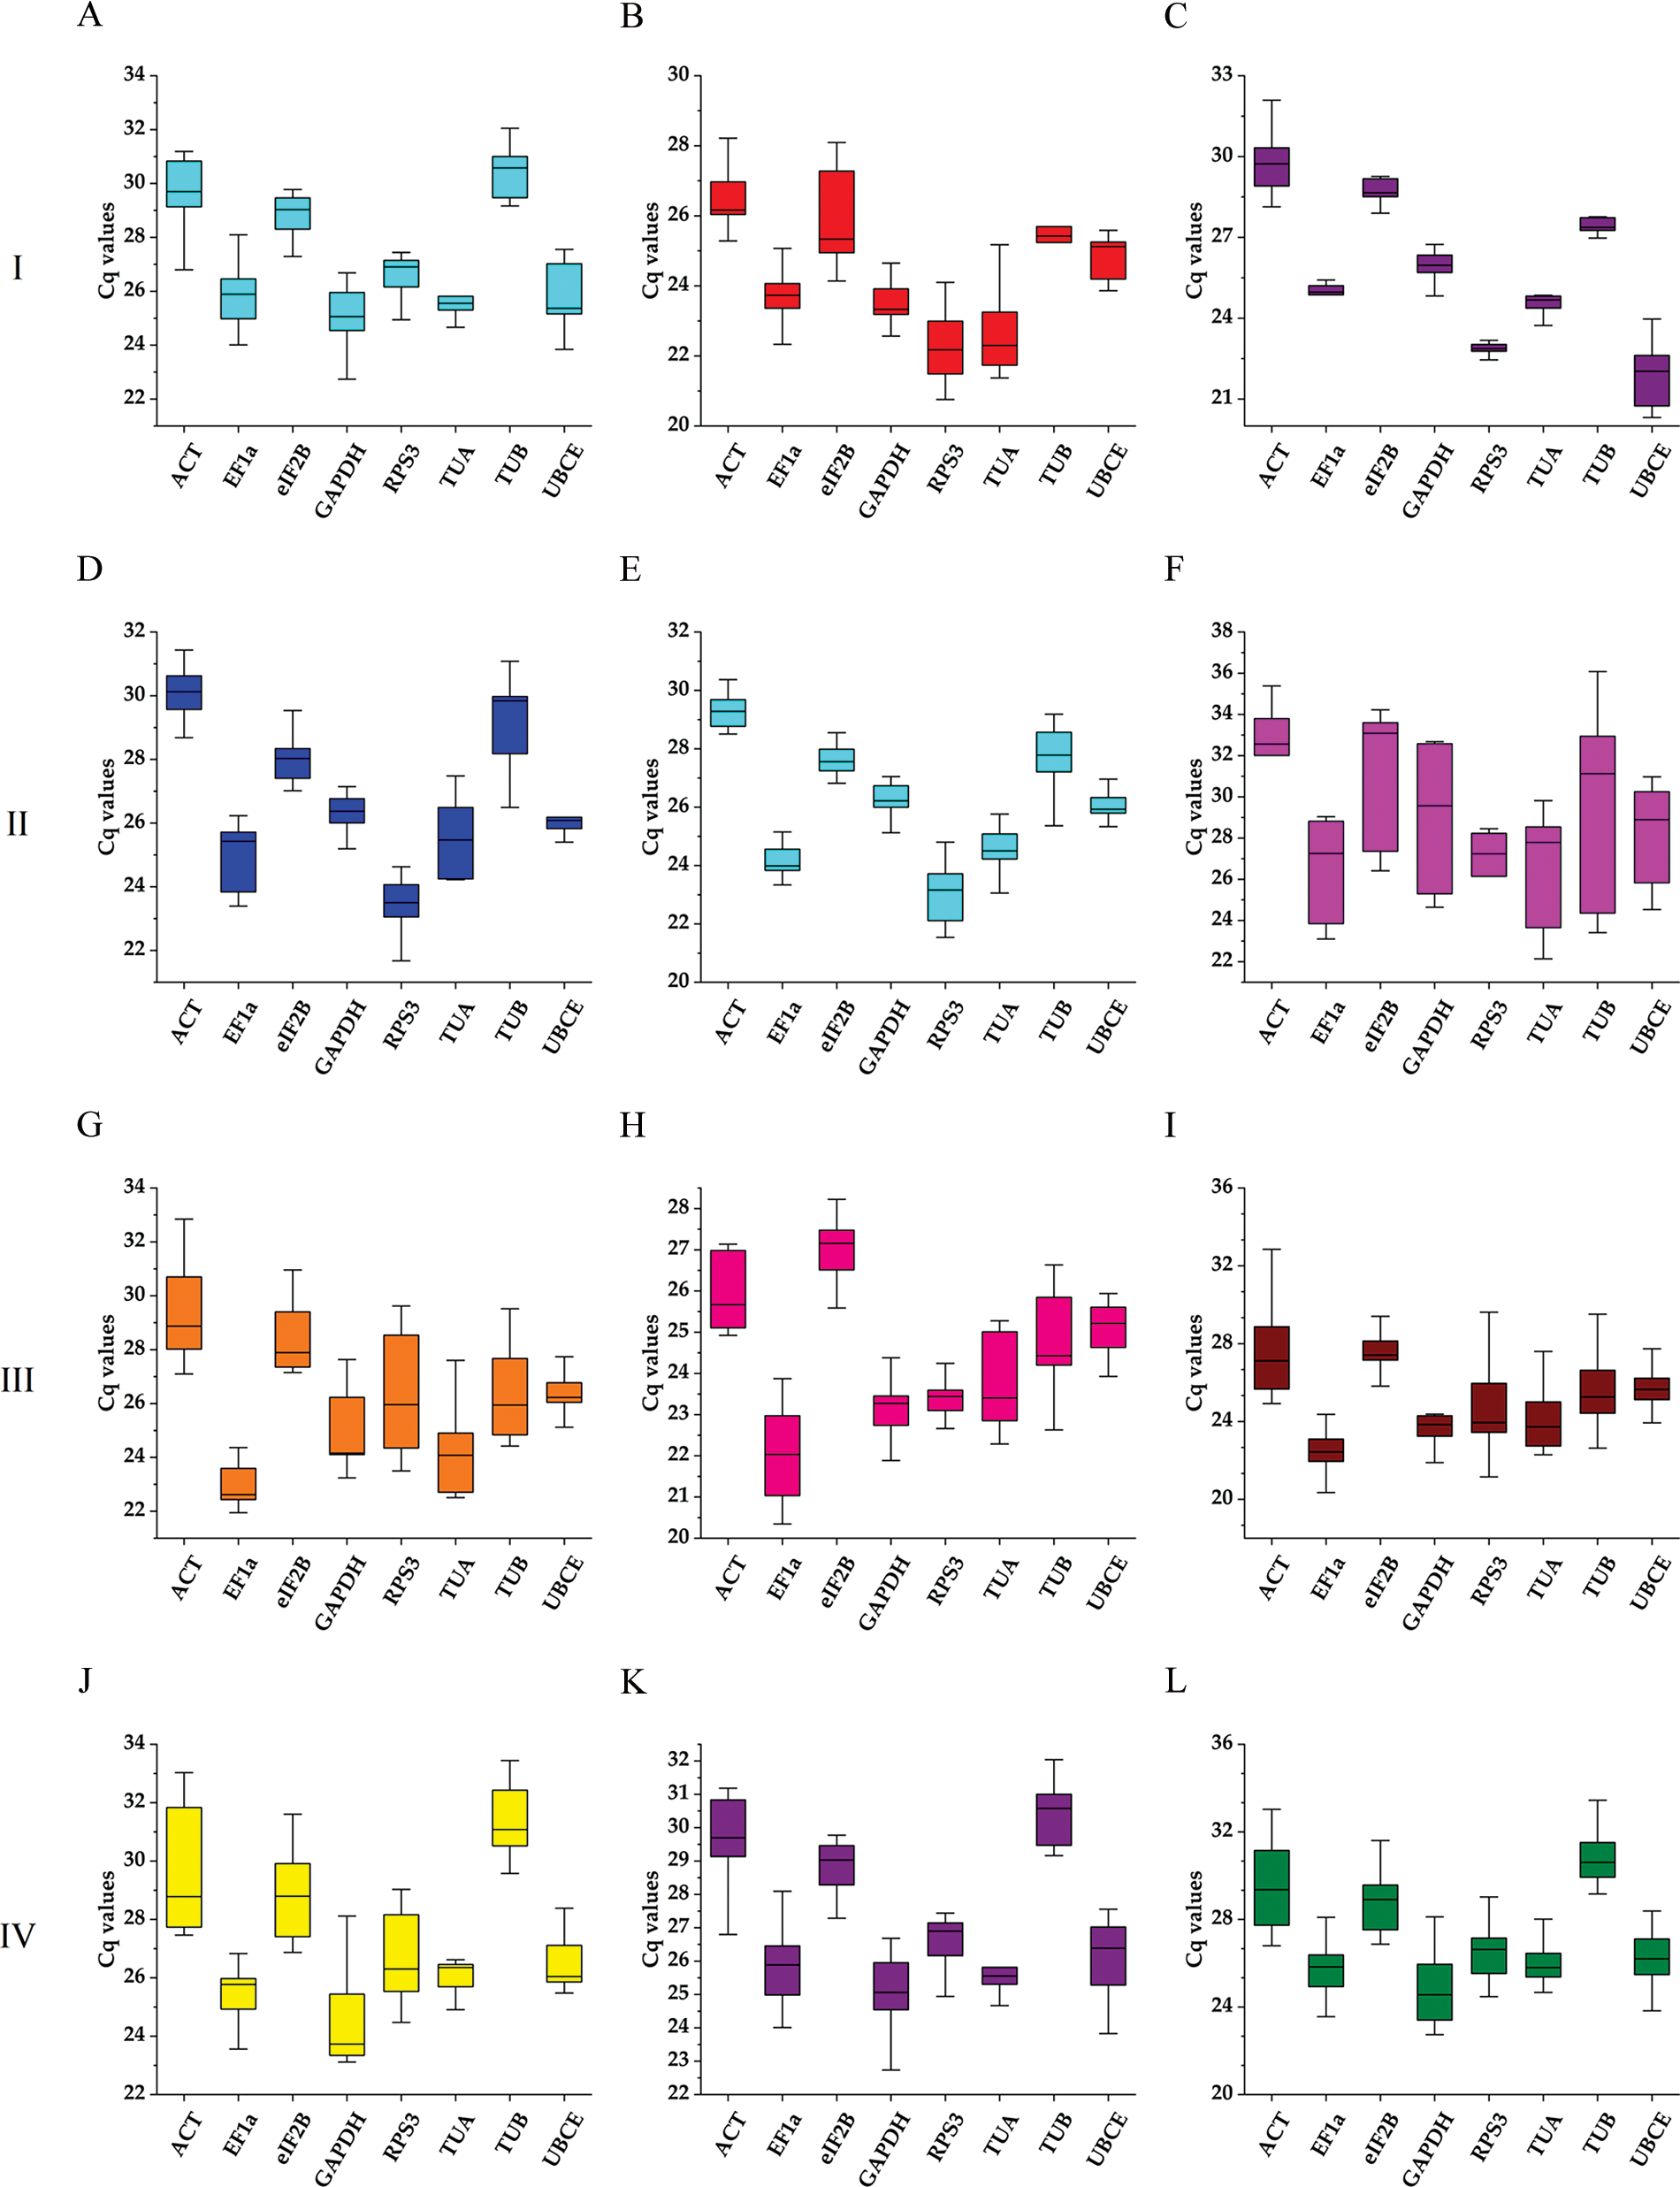
Figure 3: Boxplots of the expression levels of the eight candidate reference genes during tissue development and under abiotic stresses. The boxes represent the 25th/75th percentiles. The lines across the boxes show the median. The whiskers indicate the maximum and minimum values. Group I: Tissue development; (A) Floral development; (B) Fruit setting; (C) Fruit ripening. Group II: Leaves under abiotic stress; (D) Leaves under heat stress; (E) Leaves under freezing stress; (F) Leaves under salt stress. Group III: Immature fruitlets under freezing stress (G) Immature pulp; (H) Immature seeds; (I) Immature pulp and seeds. Group IV: Postharvest fruits under cold-storage stress; (J) Red-fleshed fruits; (K) White-fleshed fruits; (L) Red- and white-fleshed fruits
Across all samples, the minimum Cq value was 19.550 (UBCE), while the maximum Cq value was 36.081 (TUB). The mean Cq values ranged from 24.532 (EF1α) to 29.014 (ACT), and the variation levels of the Cq values varied from 8.689 (EF1α) to 13.706 (TUB). In contrast, the variation levels of the Cq values fluctuated from 2.579 (EF1α) to 6.058 (TUB) in subgroup A, 1.722 (UBCE) to 6.412 (TUB) in subgroup B, 1.910 (EF1α) to 4.417 (UBCE) in subgroup C, 1.806 (UBCE) to 4.591 (TUB) in subgroup D, 1.631 (UBCE) to 3.824 (TUB) in subgroup E, 5.932 (EF1α) to 12.671 (TUB) in subgroup F, 2.615 (UBCE) to 6.121 (RPS3) in subgroup G, 2.010 (UBCE) to 4.004 (TUB) in subgroup H, 3.808 (UBCE) to 8.464 (RPS3) in subgroup I, 2.908 (UBCE) to 5.566 (ACT) in subgroup J, 2.490 (eIF2B) to 5.052 (TUA) in subgroup K, and 4.279 (TUB) to 6.232 (ACT) in subgroup L (Fig. 3). The results suggested that EF1α had a high expression level and ACT had a low expression level. In addition, the variation levels of the Cq values were very high across all the samples, but the variation was significantly narrower in each subgroup, which indicated that the expression levels of these candidate reference genes were more stable within subgroups than across all samples. Therefore, screening suitable reference genes in each subgroup was reasonable.
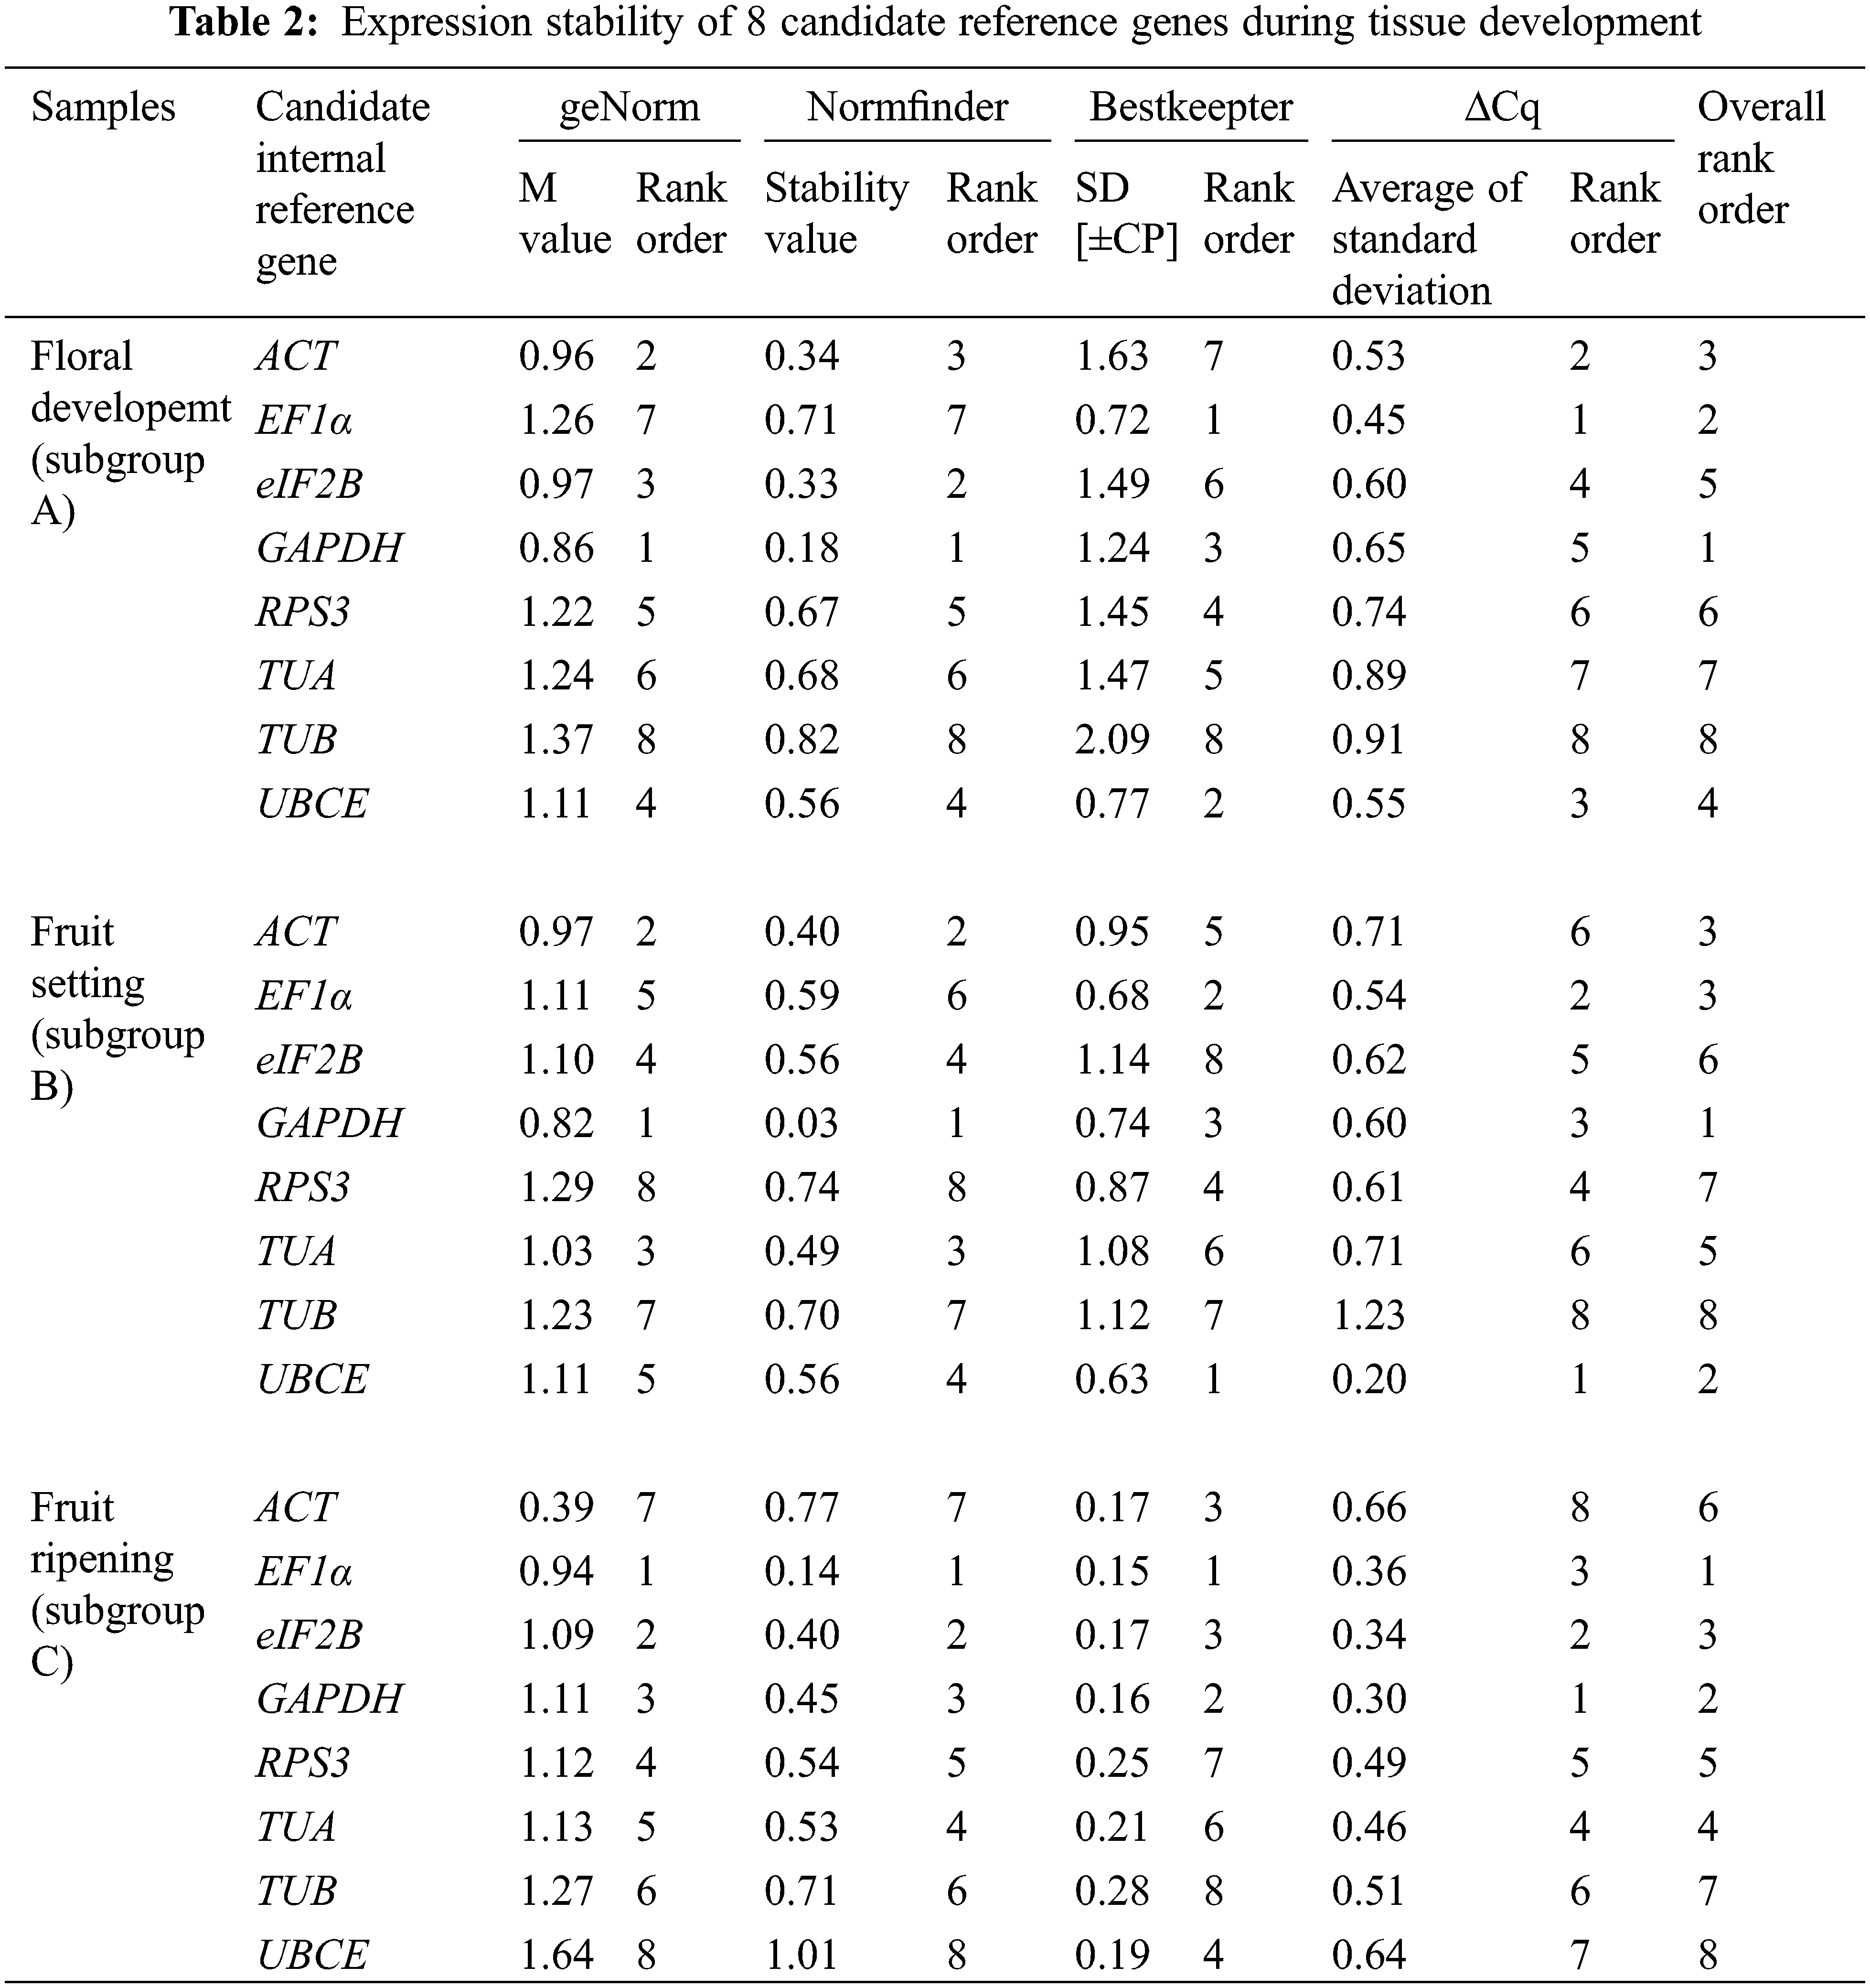
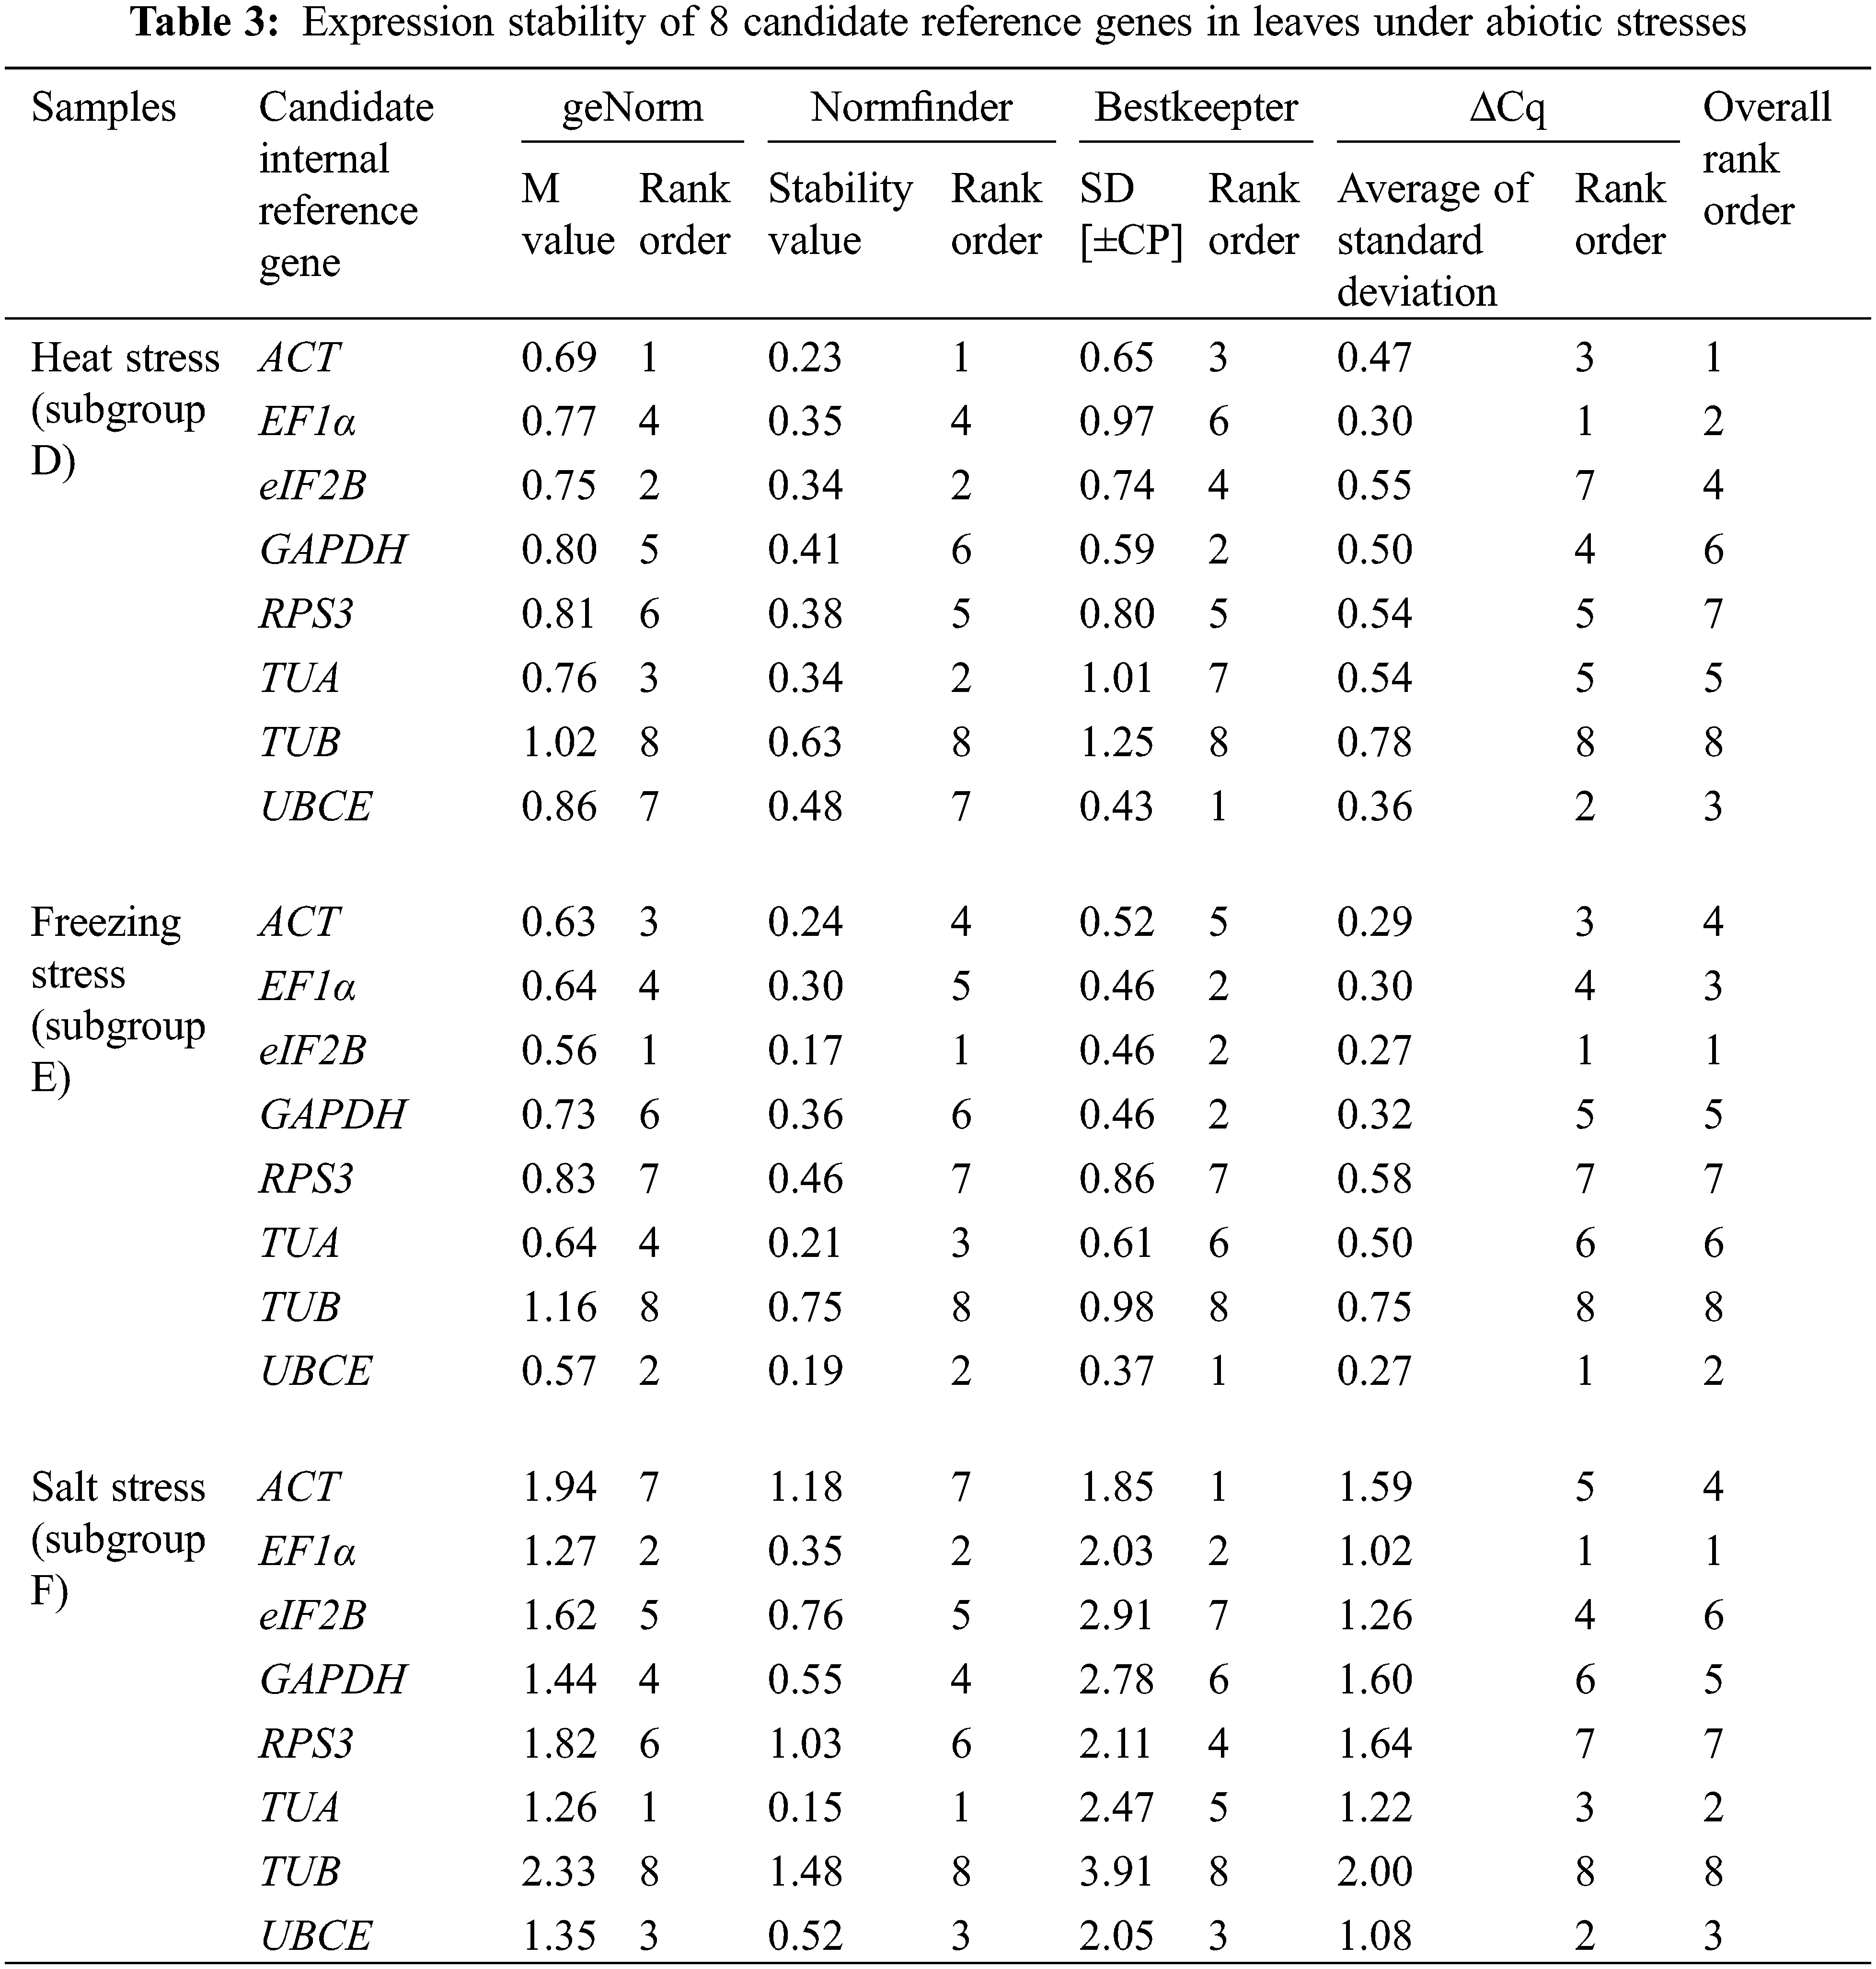
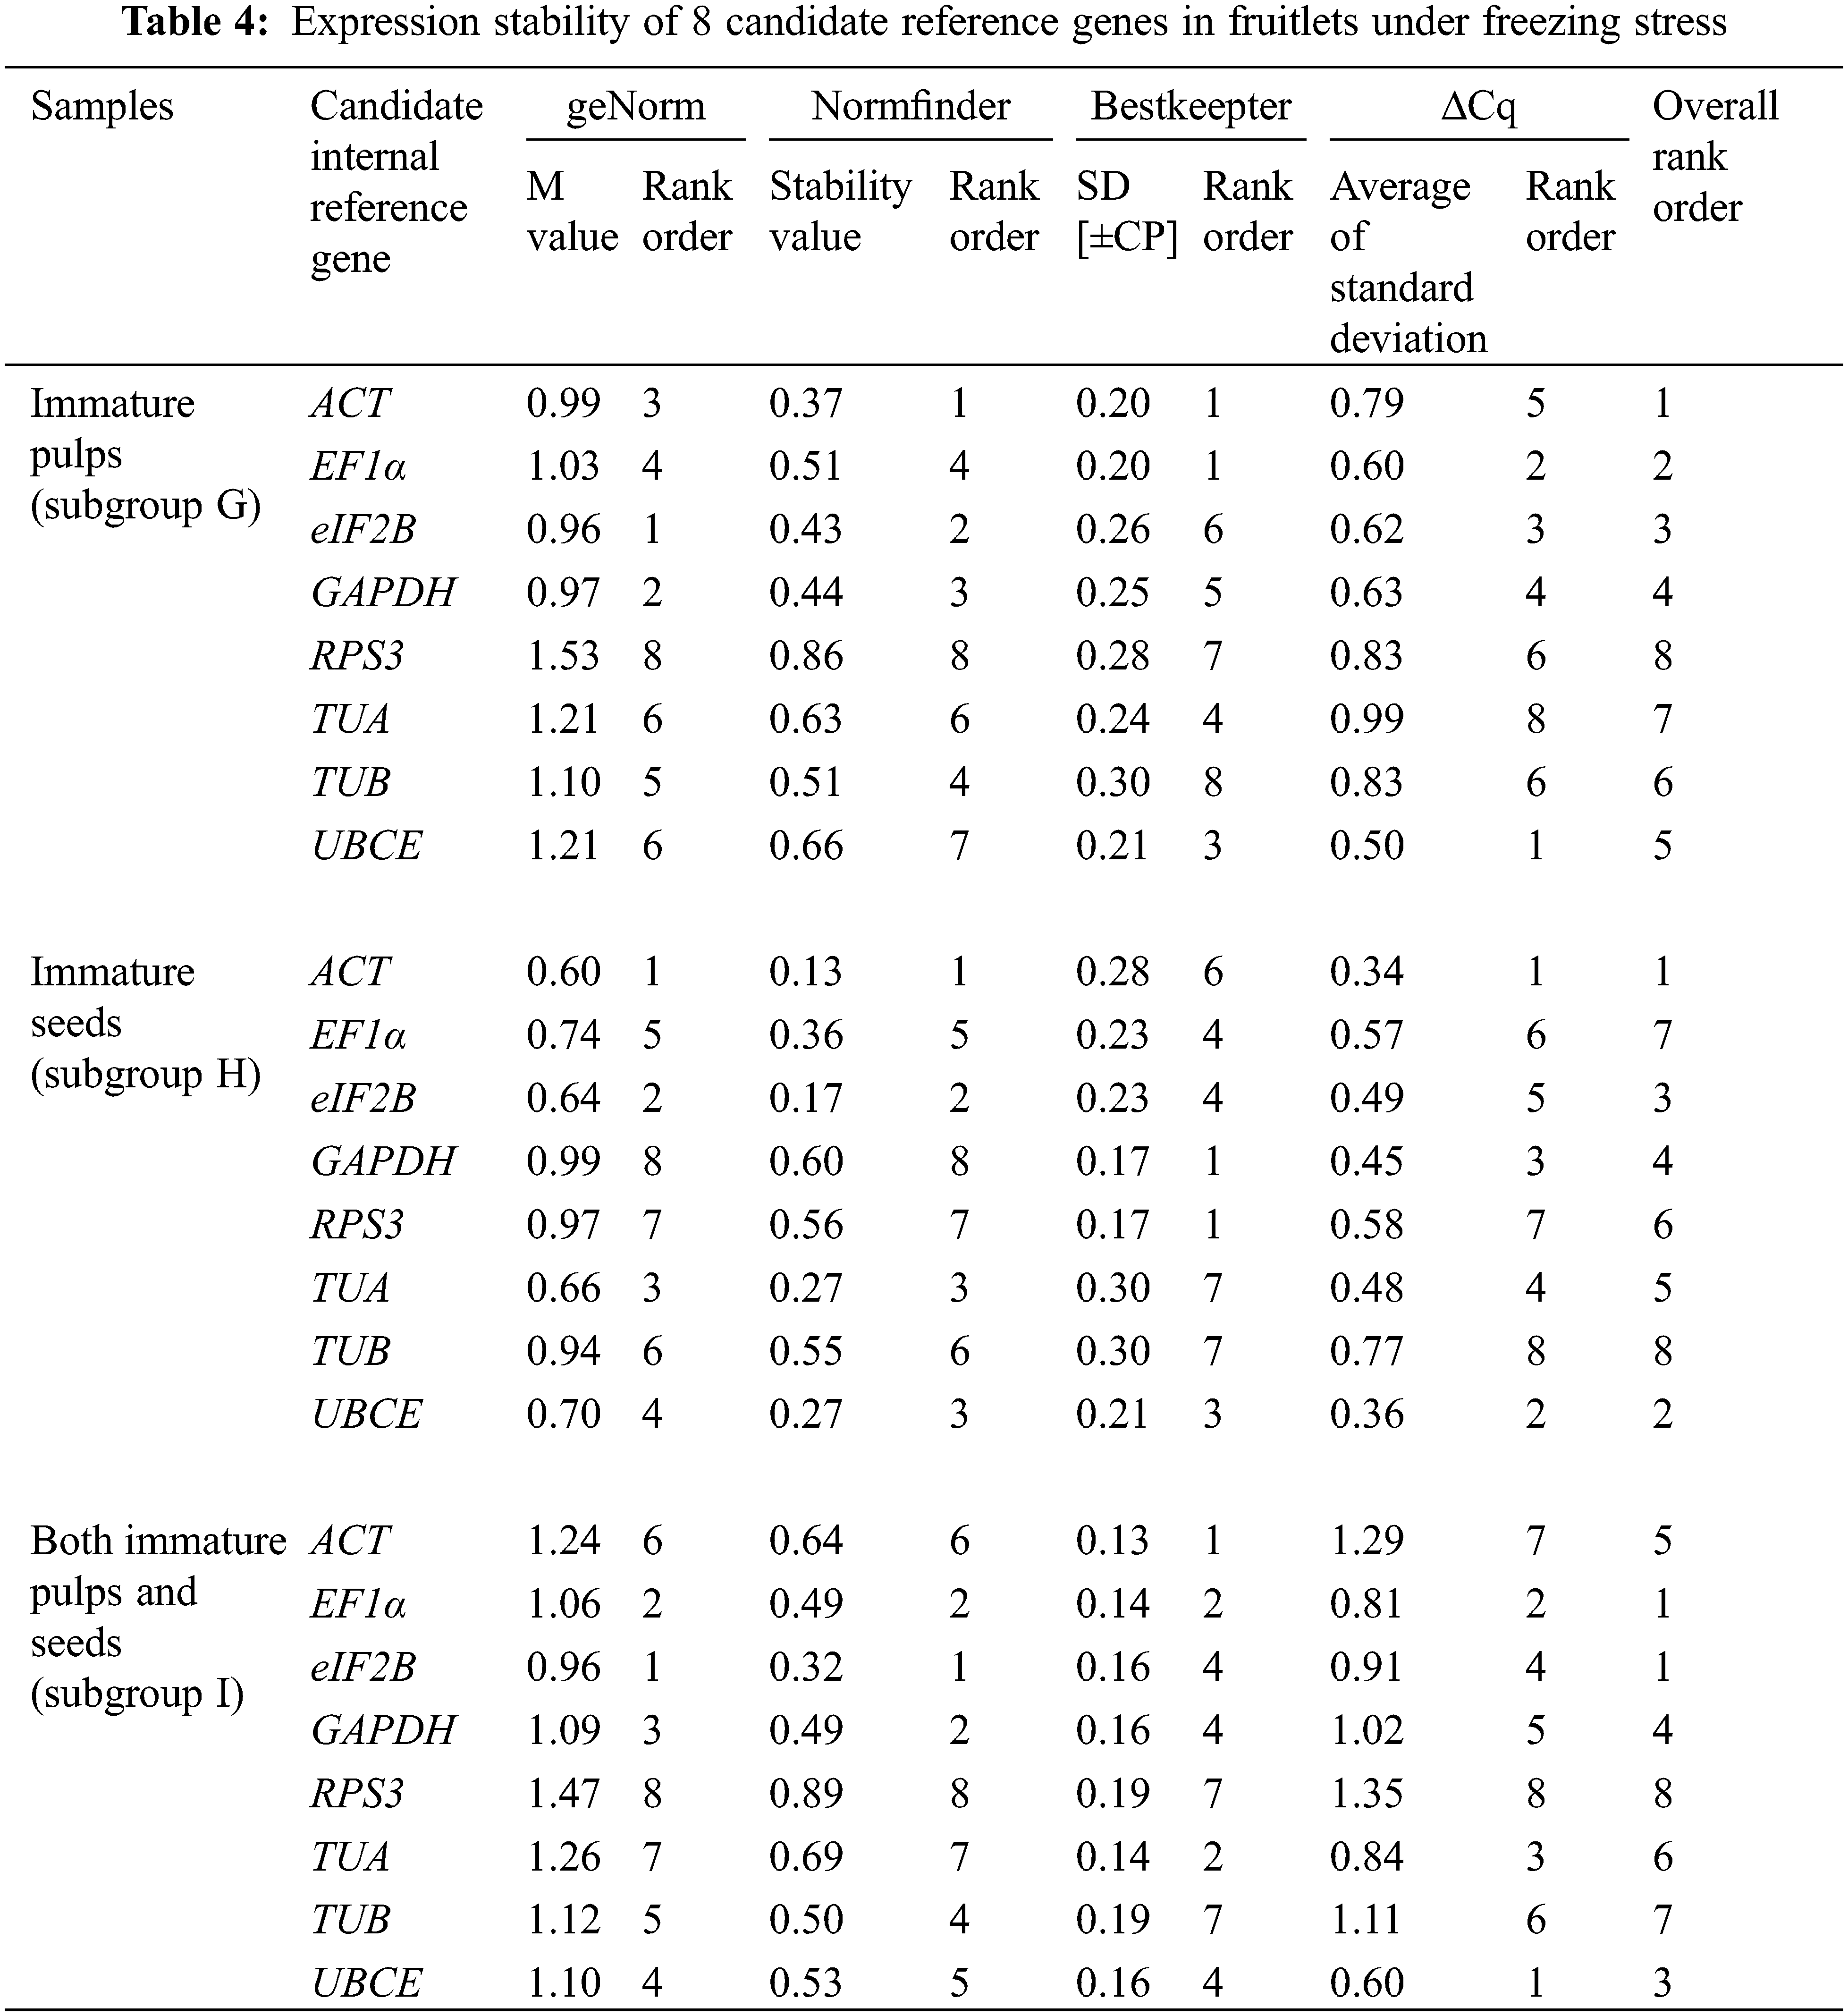
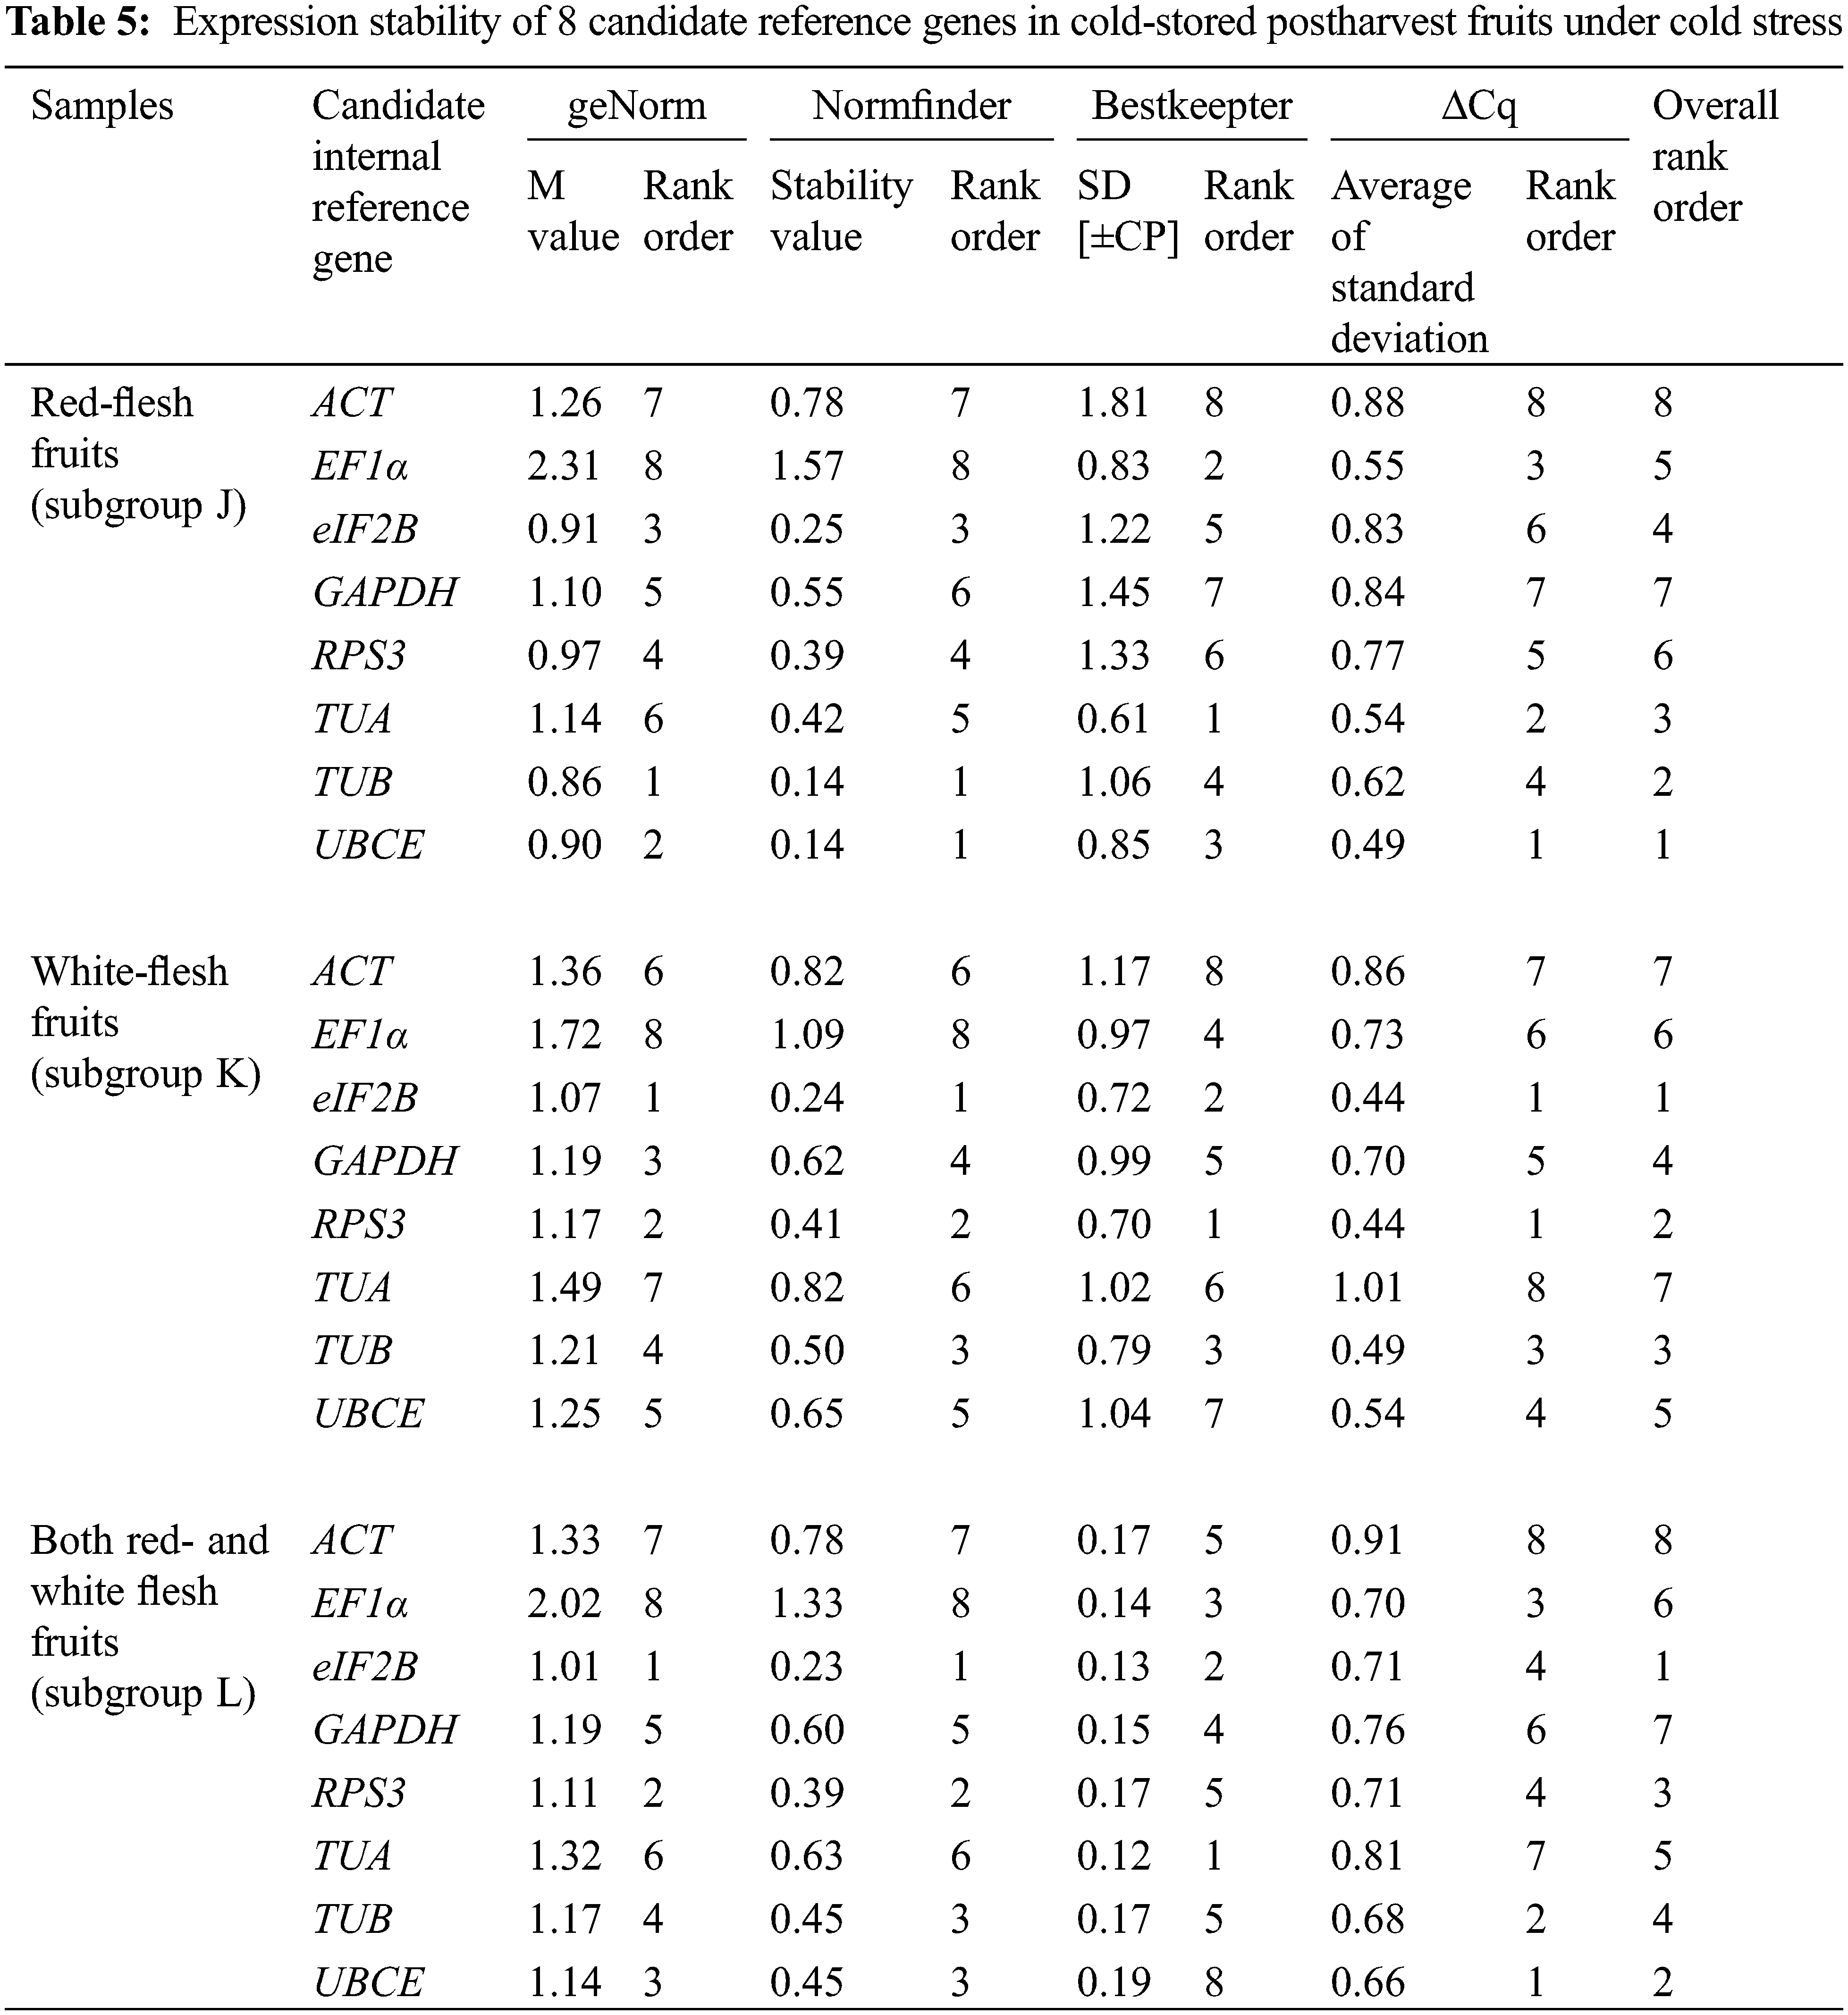
The Cq values of the candidate reference genes were first analysed by four different algorithms and then synthesized to gain overall rankings, which were used to confirm the expression stabilities of the reference genes. In subgroup A, the three most stable reference genes were GAPDH, EF1α and ACT, while the three most unstable reference genes were RPS3, TUA and TUB. In subgroup B, the three most stable reference genes were GAPDH, UBCE and ACT, while the three most unstable reference genes were eIF2B, RPS3 and TUB. In subgroup C, the three most stable reference genes were EF1α, GAPDH and eIF2B, while the three most unstable reference genes were ACT, TUB and UBCE (Table 2). In subgroup D, the three most stable reference genes were ACT, EF1α and UBCE, while the three most unstable reference genes were GAPDH, RPS3 and TUB. In subgroup E, the three most stable reference genes were eIF2B, UBCE and EF1α, while the three most unstable reference genes were TUA, RPS3 and TUB. In subgroup F, the three most stable reference genes were EF1α, TUA and UBCE, while the three most unstable reference genes were eIF2B, RPS3 and TUB (Table 3). In subgroup G, the three most stable reference genes were ACT, EF1α and eIF2B, while the three most unstable reference genes were TUB, TUA and RPS3. In subgroup H, the three most stable reference genes were ACT, UBCE and eIF2B, while the three most unstable reference genes were RPS3, EF1α and TUB. In subgroup I, the three most stable reference genes were EF1α, eIF2B and UBCE, while the three most unstable reference genes were TUA, TUB and RPS3 (Table 4). In subgroup J, the three most stable reference genes were UBCE, TUB and TUA, while the three most unstable reference genes were RPS3, GAPDH and ACT. In subgroup K, the three most stable reference genes were eIF2B, RPS3 and TUB, while the three most unstable reference genes were EF1α, ACT and TUA. In subgroup L, the three most stable reference genes were eIF2B, UBCE and RPS3, while the three most unstable reference genes were EF1α, GAPDH and ACT (Table 5). Obviously, all the candidate reference genes could be among either the three most stable or the three most unstable reference genes in different subgroups, demonstrating that there were no reference genes suitable for all subgroups.
3.3 Validation of Screened Reference Genes
To verify the screened reference genes, the expression patterns of EjLGA1 were analysed by RT-qPCR and normalized by using the geometric mean of the most three stable reference genes as well as the most three unstable reference genes in the 12 subgroups. The PCC values of the relative expression abundance of EjLGA1 were calculated. As shown in Fig. 4, the expression patterns of EjLGA1 normalized by the three most stable and unstable reference genes were positively correlated. The PCC values showed very strong correlation in 7 subgroups (B, D, E, F, H, J, and K), strong correlation in 2 subgroups (G and L) and moderate correlation (A, C and I) in 3 subgroups. In the moderate correlation subgroups, the use of unstable reference genes resulted in a difference in expression patterns of EjLGA1 compared to the use of stable reference genes. In addition, although the relative expression patterns of EjLGA1 normalized to stable and unstable reference genes were similar in the very strong and strong correlation subgroups, normalization using stable reference genes could result in a smaller deviation in most samples, which was beneficial for reducing errors (Fig. 4). Thus, our results indicated that stable reference genes could provide more reliable results.
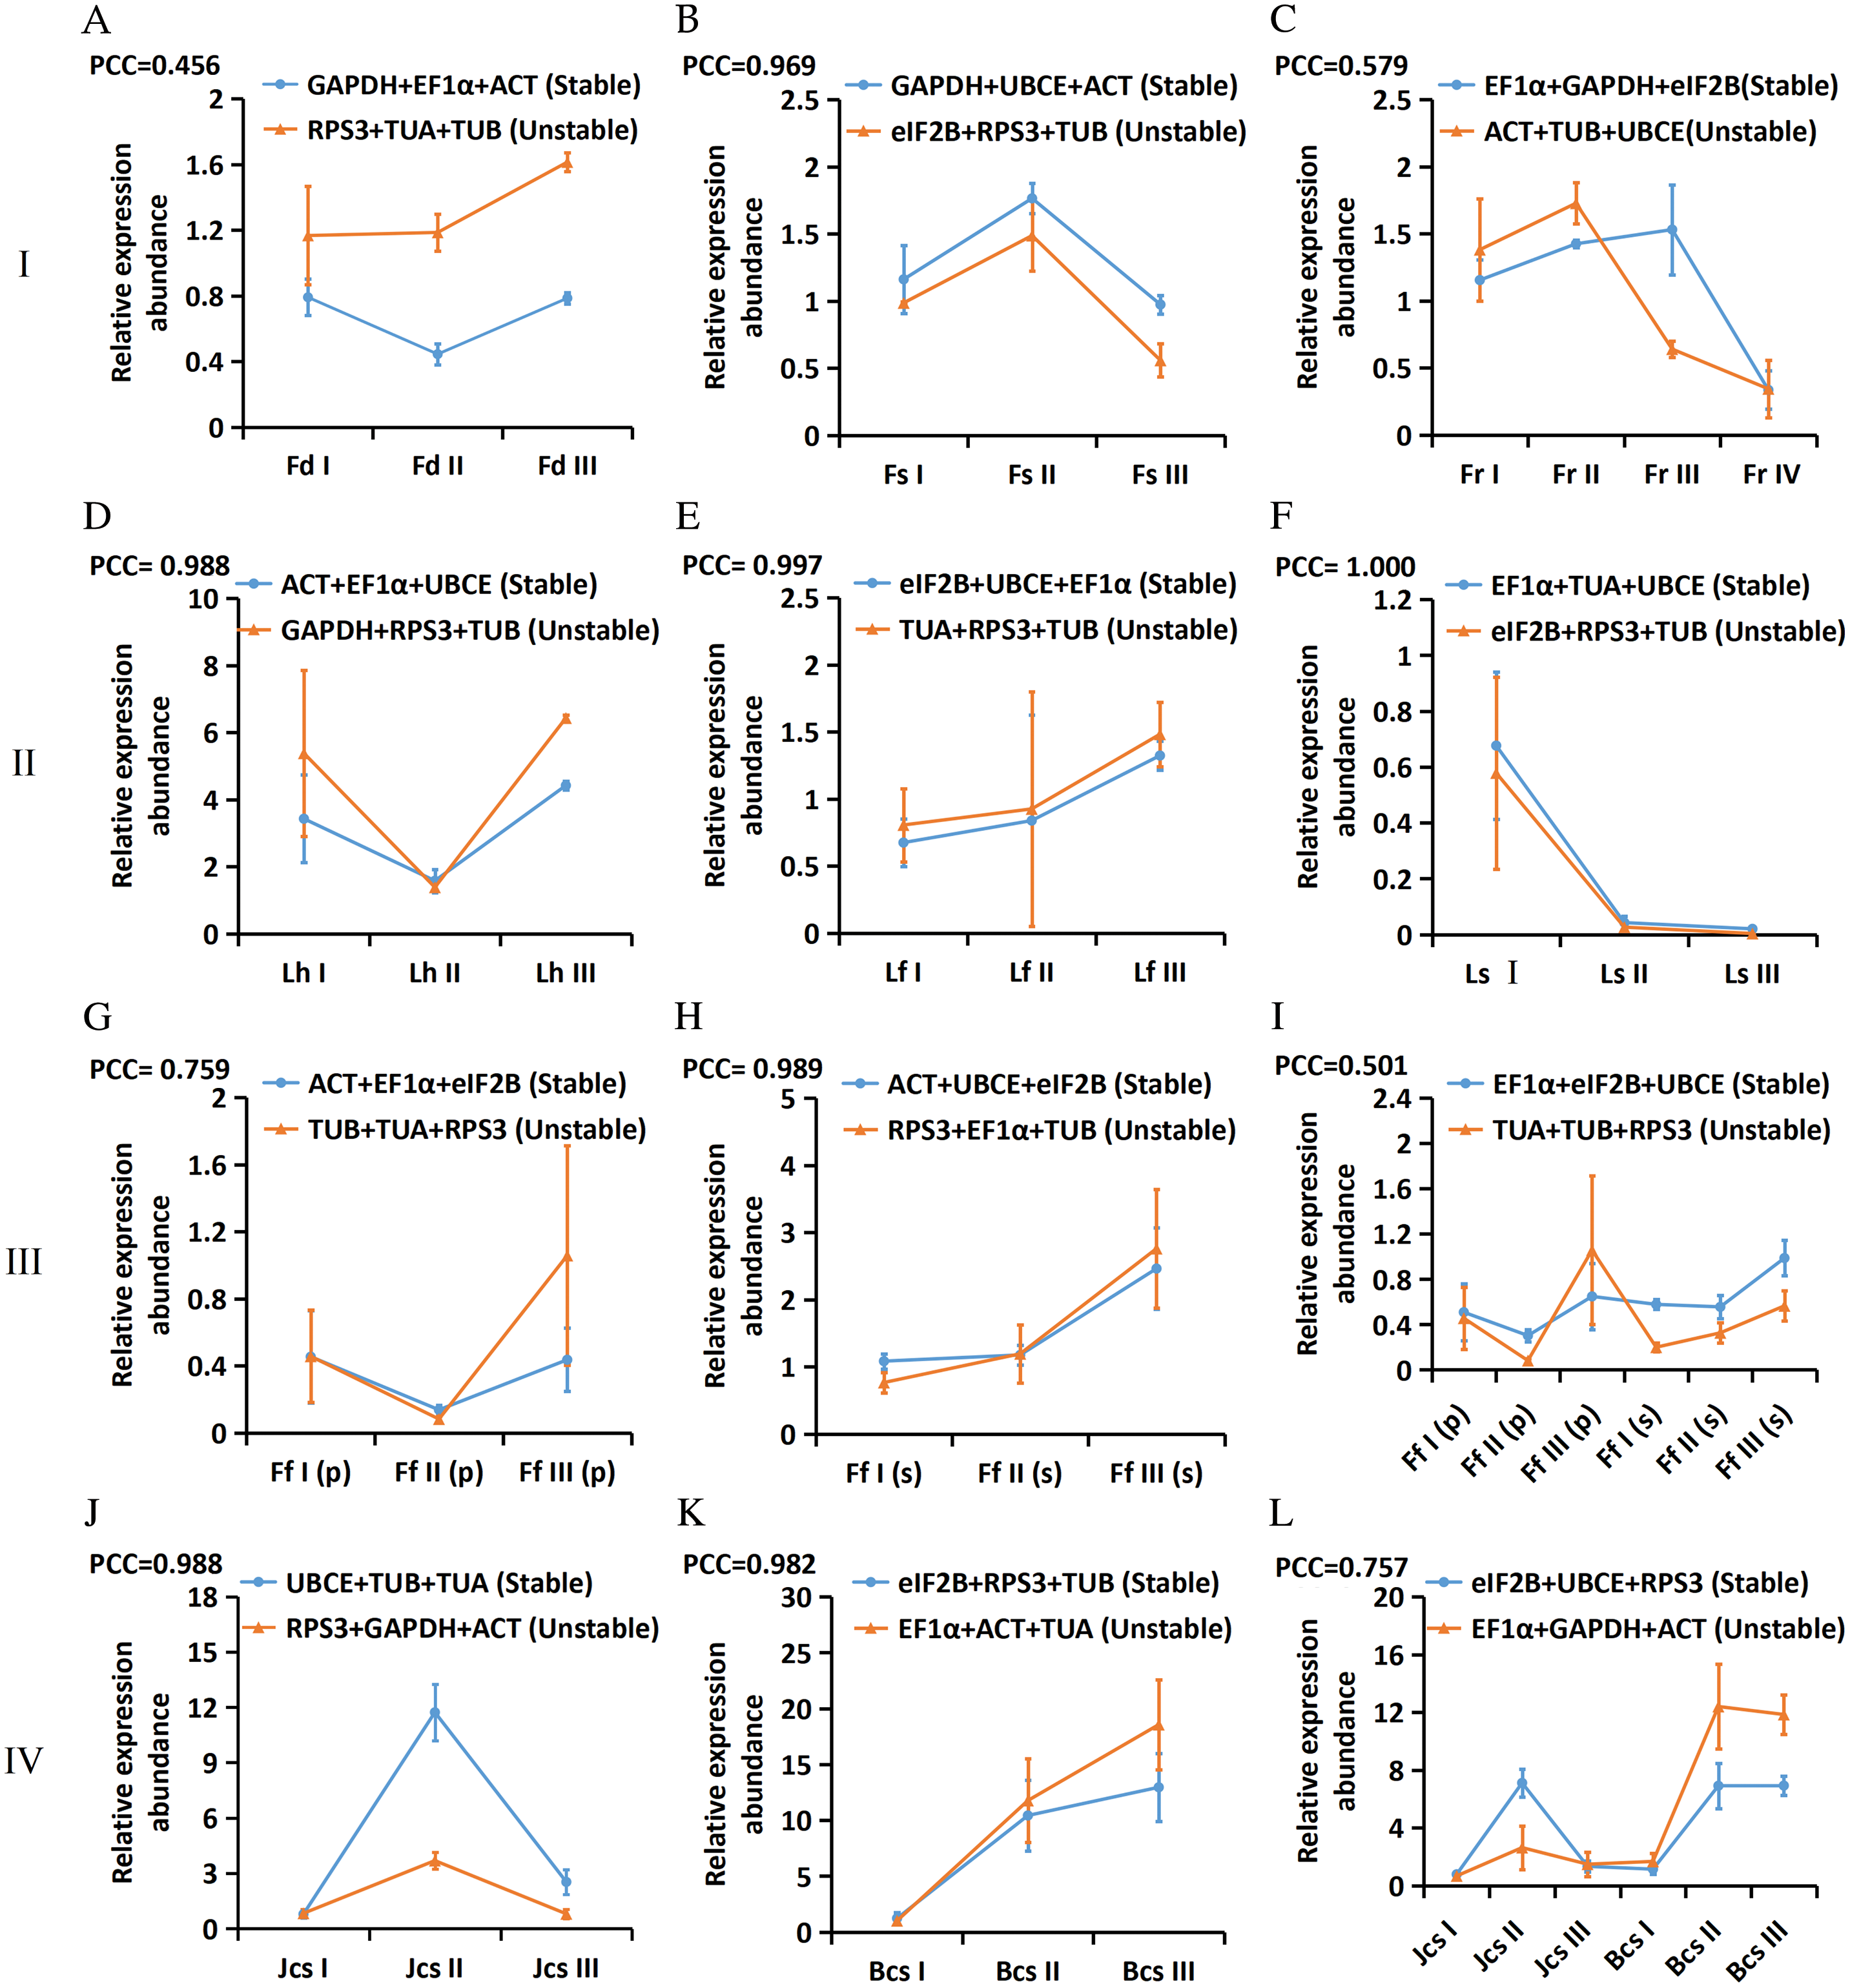
Figure 4: The relative expression abundances of EjLGA1 in different samples. The data are normalized to the most two stable reference genes and one unstable reference gene. Group I: Tissue development; (A) Floral development; (B) Fruit setting; (C) Fruit ripening. Group II: Leaves under abiotic stress; (D) Leaves under heat stress; (E) Leaves under freezing stress; (F) Leaves under salt stress. Group III: Immature fruitlets under freezing stress (G) Immature pulp; (H) Immature seeds; (I) Immature pulp and seeds. Group IV: Postharvest fruits under cold-storage stress; (J) Red-fleshed fruits; (K) White-fleshed fruits; (L) Red- and white-fleshed fruits
Eight candidate reference genes (ACT, EF1α, eIF2B, GAPDH, RPS3, TUA, TUB, and UBCE) were selected to design the specific primers. The Tm of the designed primers ranged from 60.65°C to 63.4°C. Loquat (E. japonica Lindl.) is a subtropical evergreen fruit tree that produces fruit with abundant nutrients and medicinal components [1]. Gene expression quantification by using RT-qPCR with the relative quantification 2−ΔΔCt method has been widely performed in loquat in different tissues or organs and under different stress conditions, such as pulp coloration, floral initiation, fruit cell division, fruitlets under freezing stress and postharvest fruits under chilling stress. The Actin gene was the most commonly used reference gene and has been widely used to normalize gene expression in various works [16,21,22]. In fact, the use of reference genes is the most effective and appropriate method for the problem of the normalization step in RT-qPCR [7,10]. However, it has been reported that there is no universal reference gene that could be used for all RT-qPCR experiments [10], and the most stable reference genes should be confirmed before RT-qPCR experiments [11]. The screening of suitable reference genes has therefore been carried out in many species [18–20]. A recent study in loquat supported these opinions and found that RPL4, RPL18, HIS3 and TUA3 were the four most stable reference genes across different tissues or organs of loquat, while Actin was the sixth choice [16]. Therefore, it is worth further evaluating suitable reference genes in other developing or abiotic-stressed tissues.
To further evaluate suitable reference genes in loquat, in this work, we constructed a sample pool with 31 samples (each sample had three biological replicates) that could be divided into 4 groups and 12 subgroups. The sample pool included both developing tissues and abiotic-stressed tissues of loquat. Su et al. screened the most stable reference genes in the fruit, floral tissues, ovule, seed and vegetative tissues of loquat [16]. In contrast, we examined 3 subgroups of developing tissues related to the agricultural production of loquat fruits in this work, including floral development, fruit setting and fruit ripening. On the other hand, abiotic stress conditions could cause serious losses to agricultural production worldwide, and temperature, salinity and drought have been the subject of intense research in many plants [23]. Loquat also suffers from many abiotic stresses, such as the exposure of fruitlets to freezing stress and that of postharvest fruits to chilling stress [21,22]. When the temperature drops below −3°C, freezing stress could seriously damage the fruitlets [21]. In addition, cold storage is the main preservation method for postharvest loquat fruits, but cold storage could result in many chilling injury phenomena, especially lignification. Interestingly, red-fleshed fruits often suffer from lignification due to chilling, while white-fleshed fruits do not [1,22]. It is important to determine how loquat plants alter their gene expression in response to different abiotic stresses. However, suitable reference genes for loquat under stress conditions have never been reported. Therefore, we also examined 9 subgroups of abiotic-stressed tissues, including leaves under abiotic stress (heat, freezing and salt), immature fruitlets under freezing stress (immature pulp, seeds, and both pulp and seeds), and postharvest fruits under chilling stress (red-fleshed fruits, white-fleshed fruits and both red- and white-fleshed fruits).
The expression abundance of a reliable reference gene should be unaffected by experimental factors and show minimal variations in different tissues and different physiological states of the same tissue [24]. It is generally believed that basic metabolism genes, also called housekeeping genes, could perfectly fulfil these requirements. Housekeeping genes are defined as the genes that are crucial for the survival of cells, suggesting that their expression must remain stable and constant [7]. Suitable reference genes should be chosen from a sufficient number of candidate reference genes [25]. It has been recommended that at least four potential reference genes should be selected from the literature and that gene-specific primers should be designed and tested for these genes [11]. We selected eight candidate reference genes from our previously published RNA-seq data, including ACT, EF1α, eIF2B, GAPDH, RPS3, TUA, TUB, and UBCE. These candidate reference genes are common housekeeping genes that have been used as candidate reference genes in many plants [26–29].
In theory, the expression of reference genes should be unchanged in each tested sample. However, in practice, it is important to select genes with the most stable expression or the least deviation from the mean expression because variations in Cq values are always observed [12]. In our results, the Cq values were obviously more stable within each subgroup than across all samples. Therefore, we continued to screen suitable reference genes in each subgroup. To confirm the most stable reference genes, there are many algorithms for the optimal choice of reference genes, such as the geNorm [12], NormFinder [13], BestKeeper [14], and ΔCt [15] methods. However, it has been found that different algorithms may lead to different rankings of the candidate reference genes [7]. A similar result was also observed in our work. For example, GAPDH ranked 3rd (geNorm), 2nd (NormFinder), 4th (BestKeeper), and 5th (ΔCt method) in subgroup I. To solve these problems, a comprehensive approach was presented in which the results of the different algorithms were combined to obtain aggregated stability rankings [16,17,30]. In this approach, at least three different algorithms should be used [7]. Here, we synthesized the results of four commonly used algorithms, the geNorm, NormFinder, BestKeeper and ΔCt methods, to obtain an overall rank order for each subgroup. Not surprisingly, no reference genes were appropriate for all subgroups.
Although the most stable reference gene could be calculated by this comprehensive strategy, a significant bias may still be generated by using one reference gene [31]. To avoid this, at least three reference genes should be used for accurate normalization of qRT-PCR data [25,31]. In this work, we normalized the qRT-PCR data of the EjLGA1 gene to verify the screened reference genes. EjLGA1 encodes the Gα subunit of heterotrimeric G protein, which could transduce extracellular signals to intercellular downstream effectors [22]. Our results showed that the usage of the three most stable reference genes to normalize the qRT-PCR data could avoid the underestimation or overestimation of actual expression abundance or reduce the expression deviation from the mean. This result suggested that the combined use of the three most stable reference genes was suitable for the accurate normalization of the twelve experimental subgroups of loquat.
The current study evaluated suitable reference genes in twelve subgroups of developing or abiotic-stressed tissues in loquat. Eight candidate reference genes were selected from our previously published RNA-seq data and evaluated by synthesizing the results of four algorithms (geNorm, NormFinder, BestKeeper and ΔCt methods) to yield an overall rank. Finally, we obtained different combinations of the three most stable reference genes for accurate normalization in twelve subgroups.
Acknowledgement: The English language of this manuscript was edited by American Journal Experts (AJE).
Authorship: J.W. supervised this study and revised the manuscript. S.L. participated in the design and coordination of this study and drafted the manuscript. S.X. and L.H. performed the RT-qPCR experiments and data analysis. F.Q., Y.Z., Q.L., and J.L. prepared the plant materials and carried out the samples collection. S.M. and B.W. substantively revised the manuscript. All authors read and approved the final manuscript.
Funding Statement: This research was funded by the Natural Science Foundation of Fujian Province (2021J05240), Fujian Provincial Science and Technology Project (2021N5014, 2022N5006), Research Project of Putian Science and Technology Bureau (2021ZP08, 2021ZP09, 2021ZP10, 2021ZP11), and Scientific Research Project of Putian University (2018064).
Conflicts of Interest: The authors declare that they have no conflicts of interest to report regarding the present study.
References
1. Lin, S., Wu, T., Lin, H., Zhang, Y., Xu, S. et al. (2018). De novo analysis reveals transcriptomic responses in Eriobotrya japonica fruits during postharvest cold storage. Genes, 9(12), 639. [Google Scholar]
2. Liu, Y., Song, H., Liu, Z., Hu, G., Lin, S. (2013). Molecular characterization of loquat EjAP1 gene in relation to flowering. Plant Growth Regulation, 70(3), 287–296. [Google Scholar]
3. Lin, S., Wu, T., Li, M., Huang, X., Zhang, Y. et al. (2019). Cloning, in silico characterization, subcellular localization, and expression of a heat shock cognate 70 kDa protein/gene (EjHsc70-2) from Eriobotrya japonica. Acta Physiologiae Plantarum, 41(7), 119. [Google Scholar]
4. Jiang, Y., Peng, J., Wang, M., Su, W., Gan, X. et al. (2020). The role of EjSPL3, EjSPL4, EjSPL5, and EjSPL9 in regulating flowering in loquat (Eriobotrya japonica Lindl.). International Journal of Molecular Sciences, 21(1), 248. [Google Scholar]
5. Bustin, S. (2002). INVITED REVIEW quantification of mRNA using real-time reverse transcription PCR (RT-PCRTrends and problems. Journal of Molecular Endocrinology, 29, 23–39. [Google Scholar]
6. Dheda, K., Huggett, J., Chang, J., Kim, L., Bustin, S. et al. (2005). The implications of using an inappropriate reference gene for real-time reverse transcription PCR data normalization. Analytical Biochemistry, 344(1), 141–143. [Google Scholar]
7. Kozera, B., Rapacz, M. (2013). Reference genes in real-time PCR. Journal of Applied Genetics, 54(4), 391–406. [Google Scholar]
8. Schmittgen, T. D., Livak, K. J. (2008). Analyzing real-time PCR data by the comparative CT method. Nature Protocols, 3(6), 1101–1108. [Google Scholar]
9. Livak, K. J., Schmittgen, T. D. (2001). Analysis of relative gene expression data using real-time quantitative PCR and the 2−ΔΔCT method. Methods, 25(4), 402–408. [Google Scholar]
10. Bustin, S., Benes, V., Nolan, T., Pfaffl, M. (2005). Quantitative real-time RT-PCR–a perspective. Journal of Molecular Endocrinology, 34(3), 597–601. [Google Scholar]
11. Udvardi, M. K., Czechowski, T., Scheible, W. R. (2008). Eleven golden rules of quantitative RT-PCR. The Plant Cell, 20(7), 1736–1737. [Google Scholar]
12. Vandesompele, J., De Preter, K., Pattyn, F., Poppe, B., van Roy, N. et al. (2002). Accurate normalization of real-time quantitative RT-PCR data by geometric averaging of multiple internal control genes. Genome Biology, 3(7), research0034.1. [Google Scholar]
13. Andersen, C. L., Jensen, J. L., Ørntoft, T. F. (2004). Normalization of real-time quantitative reverse transcription-PCR data: A model-based variance estimation approach to identify genes suited for normalization, applied to bladder and colon cancer data sets. Cancer Research, 64(15), 5245–5250. [Google Scholar]
14. Pfaffl, M. W., Tichopad, A., Prgomet, C., Neuvians, T. P. (2004). Determination of stable housekeeping genes, differentially regulated target genes and sample integrity: BestKeeper-Excel-based tool using pair-wise correlations. Biotechnology Letters, 26(6), 509–515. [Google Scholar]
15. Silver, N., Best, S., Jiang, J., Thein, S. L. (2006). Selection of housekeeping genes for gene expression studies in human reticulocytes using real-time PCR. BMC Molecular Biology, 7(1), 33. [Google Scholar]
16. Su, W., Yuan, Y., Zhang, L., Jiang, Y., Gan, X. et al. (2019). Selection of the optimal reference genes for expression analyses in different materials of Eriobotrya japonica. Plant Methods, 15(1), 7. [Google Scholar]
17. Takamori, L. M., Pereira, A. V. C., Souza, G. M., Vieira, L. G. E., Ribas, A. F. (2017). Identification of endogenous reference genes for RT-qPCR expression analysis in Urochloa brizantha under abiotic stresses. Scientific Reports, 7(1), 1–11. [Google Scholar]
18. Tong, Z., Gao, Z., Wang, F., Zhou, J., Zhang, Z. (2009). Selection of reliable reference genes for gene expression studies in peach using real-time PCR. BMC Molecular Biology, 10(1), 71. [Google Scholar]
19. Chen, L., Zhong, H., Kuang, J., Li, J., Lu, W. et al. (2011). Validation of reference genes for RT-qPCR studies of gene expression in banana fruit under different experimental conditions. Planta, 234(2), 377–390. [Google Scholar]
20. Perini, P., Pasquali, G., Margis-Pinheiro, M., de Oliviera, P. R. D., Revers, L. F. (2014). Reference genes for transcriptional analysis of flowering and fruit ripening stages in apple (Malus × domestica Borkh.). Molecular Breeding, 34(3), 829–842. [Google Scholar]
21. Xu, H., Li, X., Chen, J. (2017). Comparative transcriptome profiling of freezing stress responses in loquat (Eriobotrya japonica) fruitlets. Journal of Plant Research, 130(5), 893–907. [Google Scholar]
22. Wu, T., Lin, S., Wu, B., Chen, Y., Lin, S. et al. (2019). Cloning and in silico and expression analyses of the heterotrimeric G protein α subunit gene (EjLGA1) from loquat (Eriobotrya japonica) fruits under cold storage with different pretreatments. The Journal of Horticultural Science and Biotechnology, 94(3), 295–304. [Google Scholar]
23. Mittler, R. (2006). Abiotic stress, the field environment and stress combination. Trends in Plant Science, 11(1), 15–19. [Google Scholar]
24. Chervoneva, I., Li, Y., Schulz, S., Croker, S., Wilson, C. et al. (2010). Selection of optimal reference genes for normalization in quantitative RT-PCR. BMC Bioinformatics, 11(1), 253. [Google Scholar]
25. Bustin, S. A., Beaulieu, J. F., Huggett, J., Jaggi, R., Kibenge, F. S. et al. (2010). MIQE précis: Practical implementation of minimum standard guidelines for fluorescence-based quantitative real-time PCR experiments. BMC Molecular Biology, 11, 74. [Google Scholar]
26. Fernandes-Brum, C. N., de Oliveira Garcia, B., Moreira, R. O., Ságio, S. A., Barreto, H. G. et al. (2017). A panel of the most suitable reference genes for RT-qPCR expression studies of coffee: Screening their stability under different conditions. Tree Genetics & Genomes, 13(6), 131. [Google Scholar]
27. Amorim, L. L. B., Ferreira-Neto, J. R. C., Bezerra-Neto, J. P., Pandolfi, V., de Araújo, F. T. et al. (2018). Cowpea and abiotic stresses: Identification of reference genes for transcriptional profiling by qPCR. Plant Methods, 14(1), 88. [Google Scholar]
28. Luo, H., Luo, K., Luo, L., Li, E., Guan, B. et al. (2014). Evaluation of candidate reference genes for gene expression studies in Cymbidium kanran. Scientia Horticulturae, 167, 43–48. [Google Scholar]
29. Ma, J., Sun, Y., Wang, Y., Duan, Y. (2017). Screening of reference genes for qRT-PCR analysis in sorghum (Sorghum bicolor) under low nitrogen stress. Journal of Agricultural Biotechnology, 25(5), 805–812. [Google Scholar]
30. Mallona, I., Lischewski, S., Weiss, J., Hause, B., Egea-Cortines, M. (2010). Validation of reference genes for quantitative real-time PCR during leaf and flower development in Petunia hybrida. BMC Plant Biology, 10(1), 4. [Google Scholar]
31. Derveaux, S., Vandesompele, J., Hellemans, J. (2010). How to do successful gene expression analysis using real-time PCR. Methods, 50(4), 227–230. [Google Scholar]
Cite This Article
 Copyright © 2023 The Author(s). Published by Tech Science Press.
This work is licensed under a Creative Commons Attribution 4.0 International License , which permits unrestricted use, distribution, and reproduction in any medium, provided the original work is properly cited.
 Downloads
 Citation Tools