
 Submit a Paper
 Propose a Special lssue
 Open Access
ARTICLE

Monitoring Thosea sinensis Walker in Tea Plantations Based on UAV Multi-Spectral Image
1 School of Information Engineering, Zhejiang University of Water Resources and Electric Power, Hangzhou, 310018, China
2 College of Artificial Intelligence, Hangzhou Dianzi University, Hangzhou, 310018, China
3 Tea Research Institute, College of Agriculture and Biotechnology, Zhejiang University, Hangzhou, 310058, China
* Corresponding Author: Yao Zhang. Email:
(This article belongs to the Special Issue: Symbiotic Associations for Nutrients Management and Complexes Formation for Better Agricultural Crops Productivity under Biotic and Abiotic Stresses)
Phyton-International Journal of Experimental Botany 2023, 92(3), 747-761. https://doi.org/10.32604/phyton.2023.025502
Received 17 July 2022; Accepted 05 September 2022; Issue published 29 November 2022
 View Full Text
 Download PDF
Abstract
Thosea sinensis Walker (TSW) rapidly spreads and severely damages the tea plants. Therefore, finding a reliable operational method for identifying the TSW-damaged areas via remote sensing has been a focus of a research community. Such methods also enable us to calculate the precise application of pesticides and prevent the subsequent spread of the pests. In this work, based on the unmanned aerial vehicle (UAV) platform, five band images of multispectral red-edge camera were obtained and used for monitoring the TSW in tea plantations. By combining the minimum redundancy maximum relevance (mRMR) with the selected spectral features, a comprehensive spectral selection strategy was proposed. Then, based on the selected spectral features, three classic machine learning algorithms, including random forest (RF), support vector machine (SVM), and k-nearest neighbors (KNN) were used to construct the pest monitoring model and were evaluated and compared. The results showed that the strategy proposed in this work obtained ideal monitoring accuracy by only using the combination of a few optimized features (2 or 4). In order to differentiate the healthy and TSW-damaged areas (2-class model), the monitoring accuracies of all the three models were computed, which were above 96%. The RF model used the least number of features, including only SAVI and Bandred. In order to further discriminate the pest incidence levels (3-class model), the monitoring accuracies of all the three models were computed, which were above 80%, among which the RF algorithm based on SAVI, Bandred, VARI_green, and Bandred_edge features achieve the highest accuracy (OAA of 87%, and Kappa of 0.79). Considering the computational cost and model accuracy, this work recommends the RF model based on a few optimal feature combinations to monitor and distinguish the severity of TSW in tea plantations. According to the UAV remote sensing mapping results, the TSW infestation exhibited an aggregated distribution pattern. The spatial information of occurrence and severity can offer effective guidance for precise control of the pest. In addition, the relevant methods provide a reference for monitoring other leaf-eating pests, effectively improving the management level of plant protection in tea plantations, and guaranting the yield and quality of tea plantations.Keywords
Thosea sinensis Walker (TSW) is a well-known leaf-eating pest. It has a wide variety of hosts, including tea trees, camellia trees, etc. When the larvae start feeding on the leaves, all the leaves of the host may be consumed, thus seriously affecting the plant and even causing its death in some cases [1]. According to statistics, generally, 10%–15% leaves are lost and 30% leaves are lost in severe cases [2]. Therefore, timely detection and accurate monitoring of the pest infestation in the fields is indispensable for formulating a precise prevention and effectively managing the tea plantations. Currently, the monitoring process of diseases and pests in tea plantations mainly relies on the visual inspection and field sampling, which is less efficient and easily misses the affected areas. In addition, it is difficult to perform timely and effective monitoring of the diseases and pests in tea plantations.
Recently, remote sensing technology has been adopted as a continuous and rapid means of acquiring surface information from a wide range of space. It has also provided new means for agricultural pest monitoring [3]. The previous works show that there are various symptoms and physiological changes, such as pigment destruction, cellular damage, scab, etc., caused by the diseases and pests [4–6]. These symptoms and physiological changes are reflected in the spectral responses and characteristics. There are various works presented in the literature that monitored the plant diseases and pests based on medium- and high-resolution satellite images. By using the SPOT6 images, Yuan et al. [7] conducted sensitivity analysis of original band and multiple vegetation index features by combining the optimized spectral features with three machine learning algorithms, including mahalanobis distance (MD), maximum likelihood classifier (MLC), and artificial neural network (ANN) for effective monitoring of powdery mildew of wheat. Based on RapidEye image and random forest algorithm, Dhau et al. [8] recognized and mapped the Streak Gemini virus (MSV) in maize fields. The results showed that with some sensitive vegetation indexes (VIs), such as soil adjusted vegetation index, enhanced vegetation index, red index, and normalized vegetation Index, a relatively high classification accuracy of 86% can be achieved. Based on the spectral features derived from the Sentinel-2 images by using three different machine learning algorithms, including SVM, KNN, and BPNN, Ruan et al. [9] successfully predicted the occurrence of wheat stripe rust with an accuracy of 86.2%. The aforementioned works show that the combination of satellite remote sensing images and machine learning algorithms for surface monitoring and detection of crop diseases and pests is an effective means to understand the occurrence and distribution of diseases and pests. However, due to fixed orbit and revisiting cycle, the satellite remote sensing images are susceptible to clouds and rain. Consequently, the spatial resolution is often unable to meet the requirements of pests and diseases monitoring with a small incidence area.
As an important part of low altitude remote sensing systems, UAV remote sensing systems are flexible, easy to operate, and obtain high-resolution data. These systems have various potential applications in cereals and commercial crops [10–12]. de Oca et al. [13] developed a low-cost unmanned aerial system for precision agriculture namely AgriQ, which is able to provide a series of vegetation indices based on a dual-spectrum system. Tao et al. [14] applied a couple of machine learning methods including RF, Multilayer Perceptron (MLP), Naive Bayesian (NB) and SVM to monitor the damage of armyworm in summer corn based on the multispectral UAV data. Xavier et al. [15] identified ramularia leaf blight cotton with an overall accuracy of 79% by using multispectral UAV imagery and four nonparametric classifiers, including multinomial logistic regression (MLR), multinomial logistic regression with boosting (MLRb), support vector machine (SVM), and random forest tree (RFT) for plant diseases and pests monitoring. The results show the possibility of using low-cost multispectral systems for monitoring ramularia blight in cotton. Based on the UAV systems equipped with RGB camera combined with SVM algorithm, Calou et al. [16] effectively monitored the yellow sigatoka disease in banana plantation. The aforementioned works show that the UAV remote sensing has potential application in monitoring diseases and pests of commercial crops at the field scale. Currently, the UAV remote sensing technology is already being used for the detection of main biochemical components of tea plants, monitoring the growth of intercropping crops in tea plantation, etc. [17,18]. However, there is still a lack of applied research in terms of monitoring the diseases and pests in tea plantations.
In order to address the problem of Thosea sinensis Walker (TSW) in tea plantations based on a UAV remote sensing system equipped with multi-spectral red-edge camera, this work: (1) developed a framework for mapping TSW of tea plants by using UAV-based multispectral imagery, (2) proposed a comprehensive feature optimization protocol to generate optimal spectral features (SFs) combination for TSW monitoring, and (3) evaluated and compared some classic machine learning algorithms proposed for mapping of TSW, and understand the spatial distribution of the damage caused by the TSW.
The target area is located in Hangzhou, Zhejiang Province, which is well-known for producing high-quality green tea in China. This region has a typical subtropical monsoon climate with four distinct seasons and abundant rainfall. The annual average temperature is 17.8°C, the average relative humidity is 70.3%, the annual precipitation is about 1500 mm, and the annual duration of sunshine is more than 1700 h. The type of soil is mainly red loam, which is suitable for tea plantation. Recently, the harm caused by TSW has been serious in tea plantations of Zhejiang Province. The symptoms are shown in Fig. 1. This study was performed in the Tea Experimental Base of Zhejiang University, Jingshan, Hangzhou (119°52′15E, 30°23′35N), and the target tea tree was Longjing 43. In November 2020, the tea plantation was seriously harmed by TSW, and the monitoring of TSW was performed in the experimental tea plantation based on UAV multi-spectral remote sensing images. The geographical location and spatial distribution of samples of the target area are shown in Fig. 2.
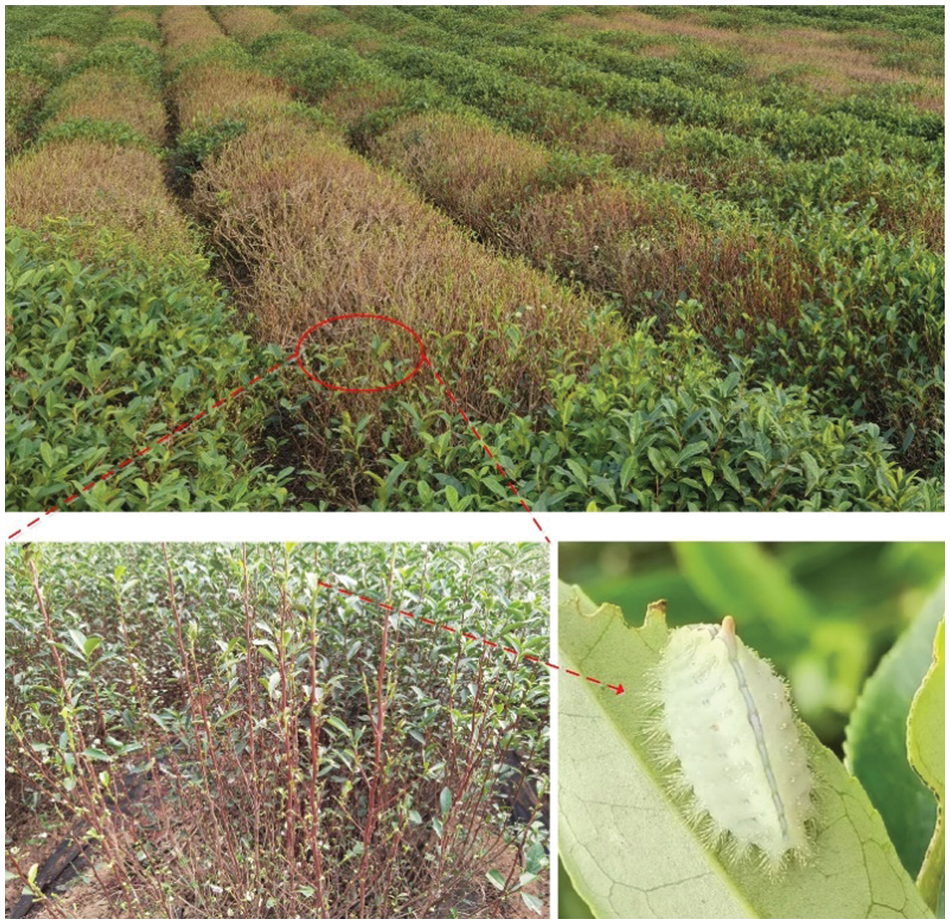
Figure 1: The symptoms of the TSW in tea plantation
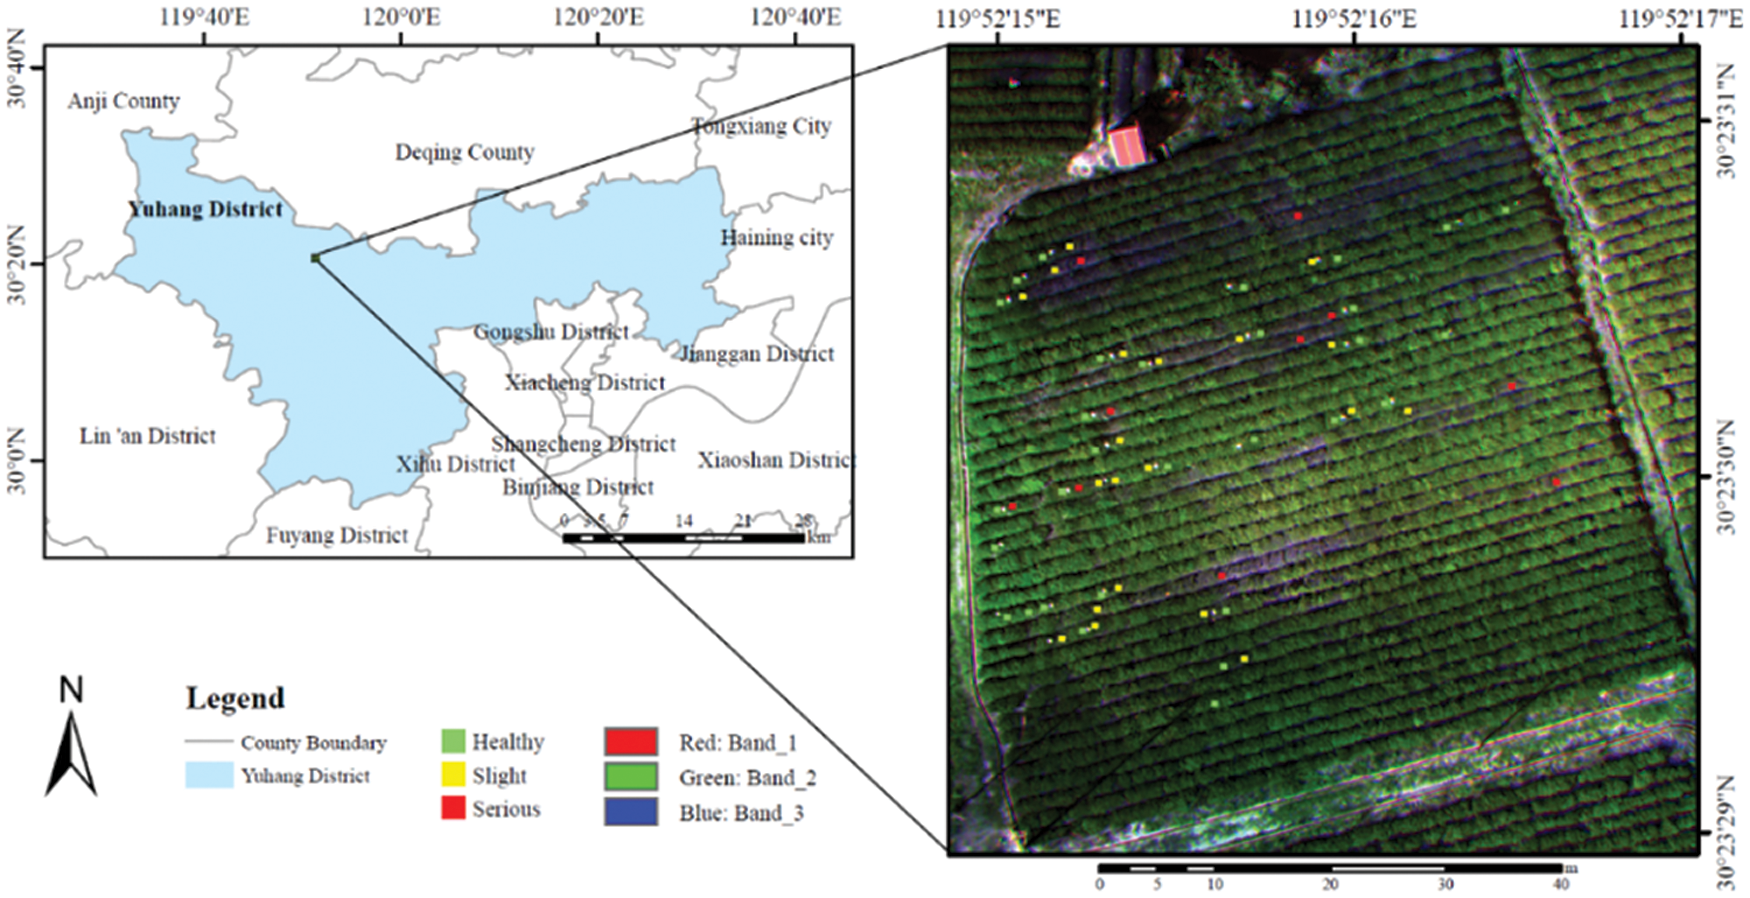
Figure 2: The symptoms of the TSW in tea plantation
2.2 Data Acquisition and Processing
The ground investigation was performed in the morning of November 05, 2020, for examining the occurrence of TSW in the tea plantation. At the same time, marker plates were placed in fields to facilitate the positioning of the affected area in the UAV multi-spectral images. Altogether, 60 sample sites were investigated in the affected plantation. Each sample site was 1 row*1 m, and the pest incidence level of each sample point was investigated. Based on the proportion of damaged canopy blades of tea plants, the severity was divided into three levels, including healthy (no damage or damage <10%), slightly damaged (damage between 10% to 30%), and serious damaged (damage >30%). Finally, 30 healthy, 20 slightly damaged, and 10 seriously damaged samples were obtained for the modeling.
2.2.2 UAV Multi-Spectral Image Acquisition and Pre-Processing
The flight was conducted on November 5, 2020 by using DJI Matrice 600 pro (developed by Shenzhen DJI Sciences and Technologies, Ltd., Shenzhen, China). The UAV was controlled autonomously with the help of an integrated GPS receiver and a navigation system. The UAV multi-spectral images were acquired with a MicaSense RedEdge-M sensor (MicaSense, Inc., Seattle, WA, USA). This sensor included five independent high precision sensors for capturing the vegetation response for five spectral bands [i.e., blue, green, red, red-edge, and near infrared (NIR)]. The UAV flights were realized under clear sky and optimal illumination conditions from 10:30–14:30. Before and after the experiment, a calibration reflecting whiteboard was placed on the ground for relative radiometric calibration of multi-spectral data. In order to obtain stable images, the flight routes were planned before take-off, covering the entire target area. The flight altitude was set at 60 m, achieving ~3.3 cm spatial resolution. These settings enabled an 80% image side overlap and 70% image forward overlap for ensuring optimal photogrammetric processing. Pix4D (available at: https://pix4d.com/) was used to manage and process the UAV images. The preprocessing mainly included an image mosaic, geometric correction, radiometric calibration, and clipping. The schematic diagram of multi-spectral data acquisition and image preprocessing is shown in Fig. 3. Based on the pre-processed images, ROI of 15*15 pixels was selected at each sample site to extract corresponding image information and form a data set for subsequent feature extraction and modeling.
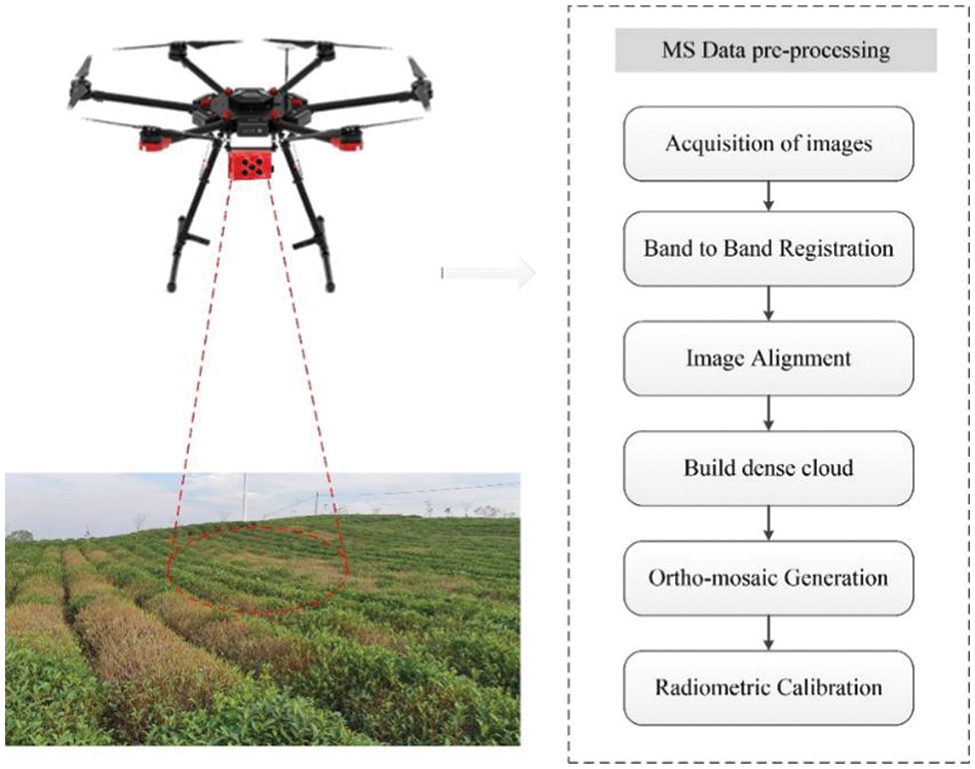
Figure 3: The flowchart of UAV multi-spectral image acquisition and preprocessing
2.3 Data Selection of Spectral Features for Pest Mapping
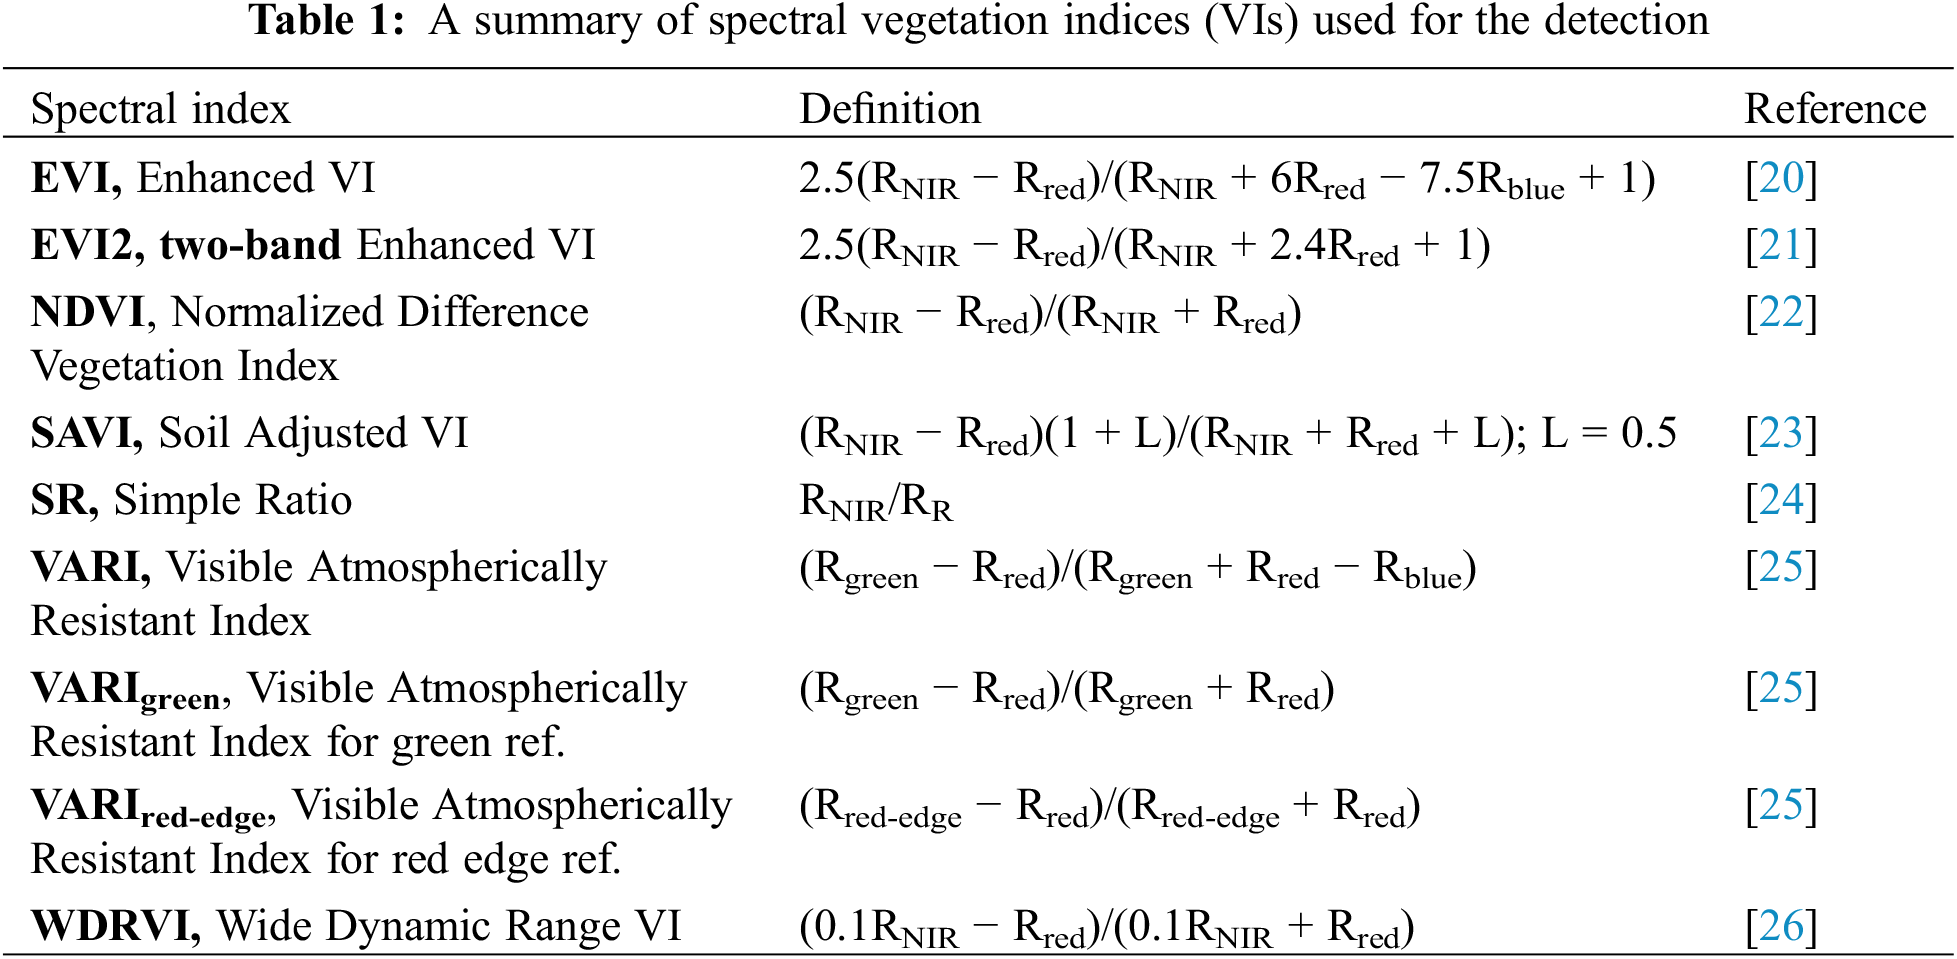
It was noted that the vegetation indices (VIs) had been widely used in remote sensing monitoring of crop stress, such as crop diseases and pests [19]. By combining the spectral bands, the VIs were able to effectively represent the changes in the physiological and biochemical parameters and structures of the plants. The morphological and physiological changes in the tea plant caused by TSW led to changes in the spectral information. Therefore, in addition to using the five original spectral bands obtained using the red-edge sensor, nine vegetation indices were also selected as the candidate spectral features in monitoring of TSW. The definitions, calculation formulae, and references for these nine VIs were summarized in Table 1. Some of these VIs have been demonstrated to be responsible for the plant stress status (NDVI, SR); some were used for estimating the leaf area and biomass (EVI, EVI2, and WDRVI); and some for estimating the green vegetation fraction (SAVI, VARI, VARIgreen, and VARIred-edge). These were chosen because of their potential relevance to discriminate symptomatic tea plants infected by TSW.
2.4 Feature Importance Ranking Based on mRMR Algorithm
In order to evaluate the sensitivity of the candidate spectral features (SFs) towards TSW and obtain the optimal feature combination for the monitoring model, minimum redundancy maximum relevance (mRMR) was adopted. This algorithm eliminated redundant features while ensuring maximum correlation between the features and categories, and has been successfully applied in various fields, such as target recognition [27], remote sensing image classification [28], and remote sensing monitoring of diseases and pests [29]. The mRMR algorithm used mutual information as the standard metric. The main idea was to find m optimal features from the feature space, which have the maximum correlation with the target category and have a minimum redundancy among features [30]. The correlation D between feature set S and class a was the relationship between the average value of all mutual information values between each feature xi and class a.
The redundancy R(S) of all the features in set S was represented by the average value of all the mutual information values between feature
where
where p(x) and p(y) denote the probability density functions of random variables x and y, respectively, and p(x, y) represents the joint probability density function of x and y.
Combining (1) and (2), the objective function based on mRMR selection features was obtained as follows:
As compared with the correlation analysis and T test, mRMR algorithm considers the correlation between the selected features and the severity of pest attack as well as the redundancy between features. Therefore, based on the mRMR algorithm, this work obtained the candidate feature set in a decreasing order of importance. It was then combined with the machine learning algorithms and was used for optimizing the remote sensing feature set for monitoring the effects of TSW. In order to perform the UAV-based mapping research of the tea plantation, feature selection and model construction were performed for two kinds of classification strategies. First, a dichotomous model for distinguishing the healthy and pest infested samples (i.e., 2-class model). Second, based on the pest incidence levels, the model performed a classification among healthy, slightly affected, and serious affected (i.e., 3-class model).
2.5 Algorithms for Pest Mapping
In recent decades, machine learning (ML) has received significant attention due to its robustness in remote sensing classification. In order to map TSW on the multi-spectral UAV images, three classic algorithms, including random forest (RF), support vector machine (SVM), and k-nearest neighbors (KNN) were implemented and their performances were compared. RF is an ensemble learning method used for classification and regression. It constructs a multitude of decision trees during the training process. For classification tasks, the output of the random forest is the class selected by most of the trees [31]. In this work, we used a random forest classifier comprising 100 decision trees. The SVM is a binary classification technique that uses the training dataset to estimate an optimal hyperplane in an n-dimensional space. The n-dimensional hyperplane uses “kernels” to categorize the n-dimensional data [32]. KNN is a non-parametric method used for classification. It arranges the data in a space by using the selected features. When a new data sample is classified, the algorithm compares the classes of the k closest data samples to determine the class of new data sample [33]. All of the three algorithms have been widely used in remote sensing classification, which have potential in mapping of pest damages [3].
According to the mRMR algorithm, the candidate feature set is sorted based on the importance of features. The models are trained and verified by using different numbers of feature combinations to obtain the changes in the accuracy by changing the number of features. By observing the changes in the accuracy curve, the initial position of the accuracy rising to the relative stationary interval is determined as the optimal feature number, and the optimal feature collection corresponding to the three algorithms is determined. The subsequent modeling and mapping are performed under both classification strategies. The three algorithms presented in this work wereimplemented by using scikit-learn library in Python.
For both classification strategies, the samples were randomly divided into 60% training samples and 40% verification samples. The accuracy of the model was evaluated at the pixel scale. The final accuracy in terms of detecting the TSW was assessed by calculating the confusion matrix of the calibration data. The confusion matrix presented the overall accuracy (OA), producer’s accuracy (PA, %), user’s accuracy (UA, %), kappa, commission error (%), and omission error (%).
3.1 Selecting Optimal Combination of Indices for Mapping TSW
As different vegetation indices were obtained based on the spectral calculations, there existed an information homology. mRMR, as an important feature optimization algorithm that reduced the redundant information by sorting the importance of these features. Bandblue was unable to pass the preliminary test of mRMR analysis and was removed, which yielded 13 variables for subsequent analysis. mRMR method was used to select the candidate feature set, and the order of the importance of features in the obtained 2-class and 3-class models. In the 2-class model, the first six features were sorted as SAVI, Bandred, VARI_green, Bandgreen, SR, and Bandred-edge. In the 3-class model, the first six features were sorted as SAVI, Bandred, VARI_green, Bandred-edge, SR, and Bandgreen, as presented in Table 2. The order of all the features in both classification strategies was the same, and the only difference was in the fourth and sixth ranked features. This showed that the feature optimization algorithm based on mRMR method was highly stable. Based on the above feature ordering, the optimal feature combination was determined based on the overall accuracy of each model obtained using the combinations of different numbers of features, as presented in Fig. 4. For RF, SVM, and KNN algorithms, the optimal number of features in the 2-class model were 2, 4, and 4, respectively. The optimal number of features in the 3-class model were 4, 2, and 4, respectively. The above results showed that the feature optimization strategy combined with mRMR algorithm proposed in this work obtained a fewer number of features in both classification strategies, which is of great significance for improving the monitoring efficiency. The images of the top 6 (based on the sensitivity) features were shown in Fig. 5. These images indicated the spatial distribution of the features. From these images, it was noted that the differences between the damaged and the healthy areas were more obvious for the three VIs than the three original bands.
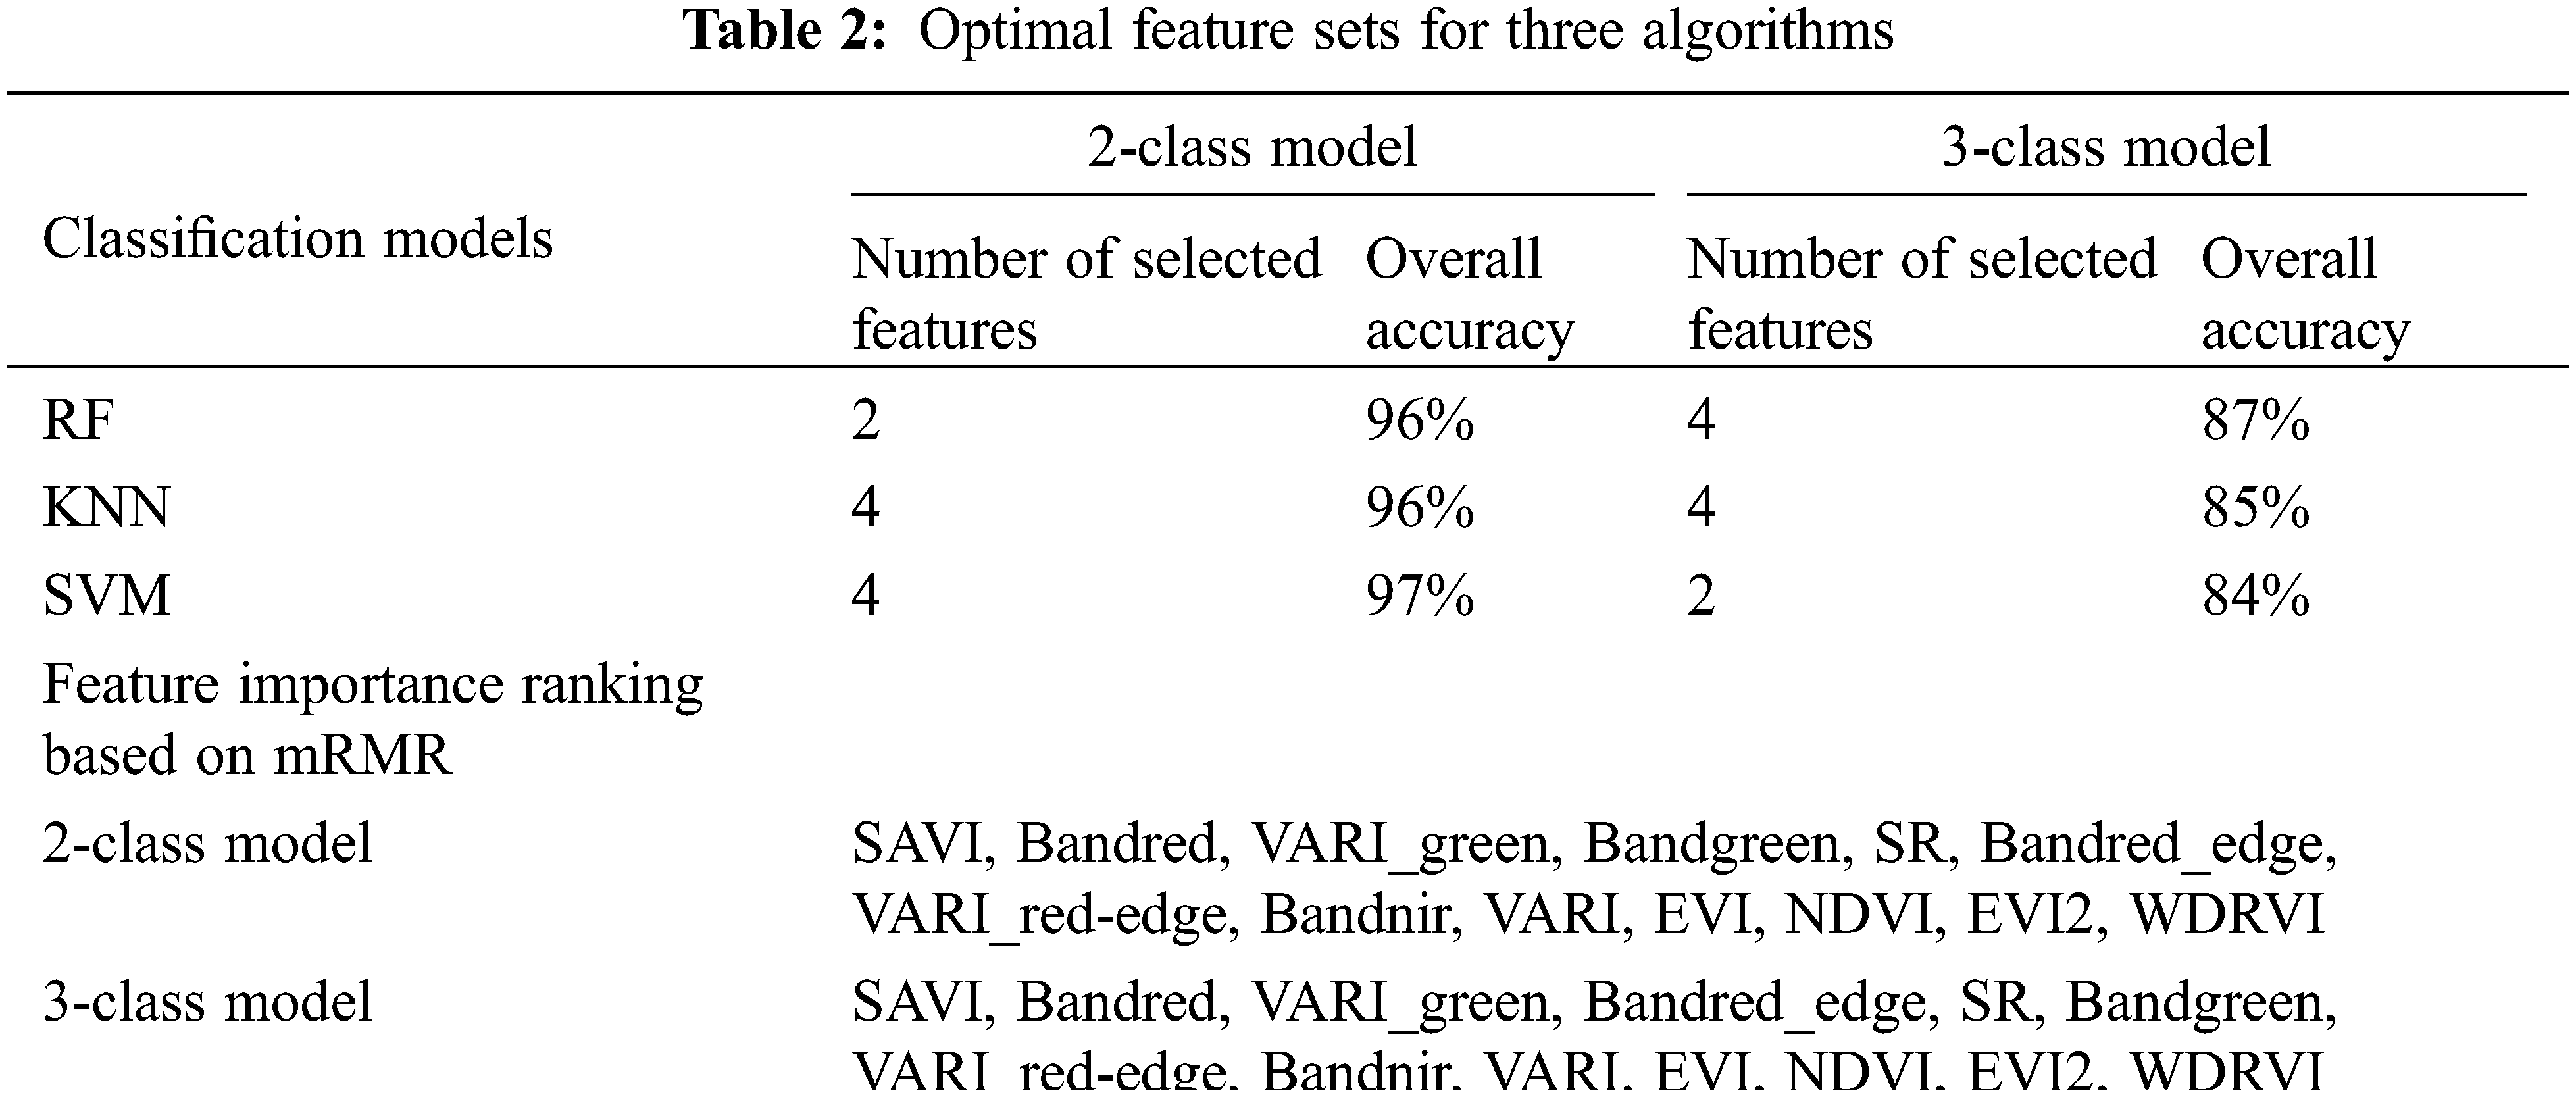
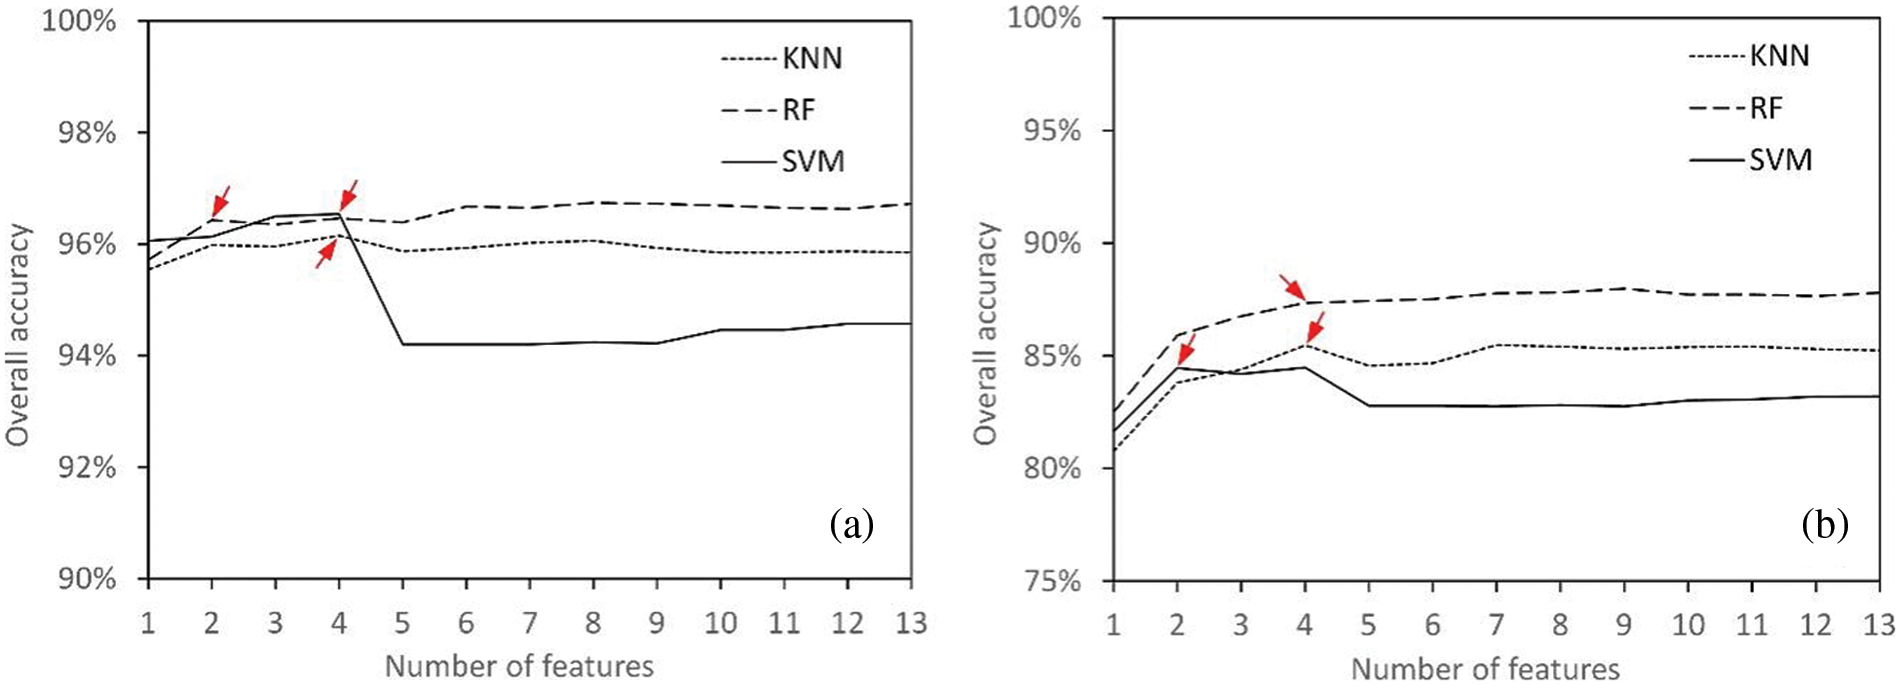
Figure 4: The relationship between the number of spectral features and overall accuracies of different models. (a) 2-class model. (b) 3-class model. The red arrows show the number of selected features
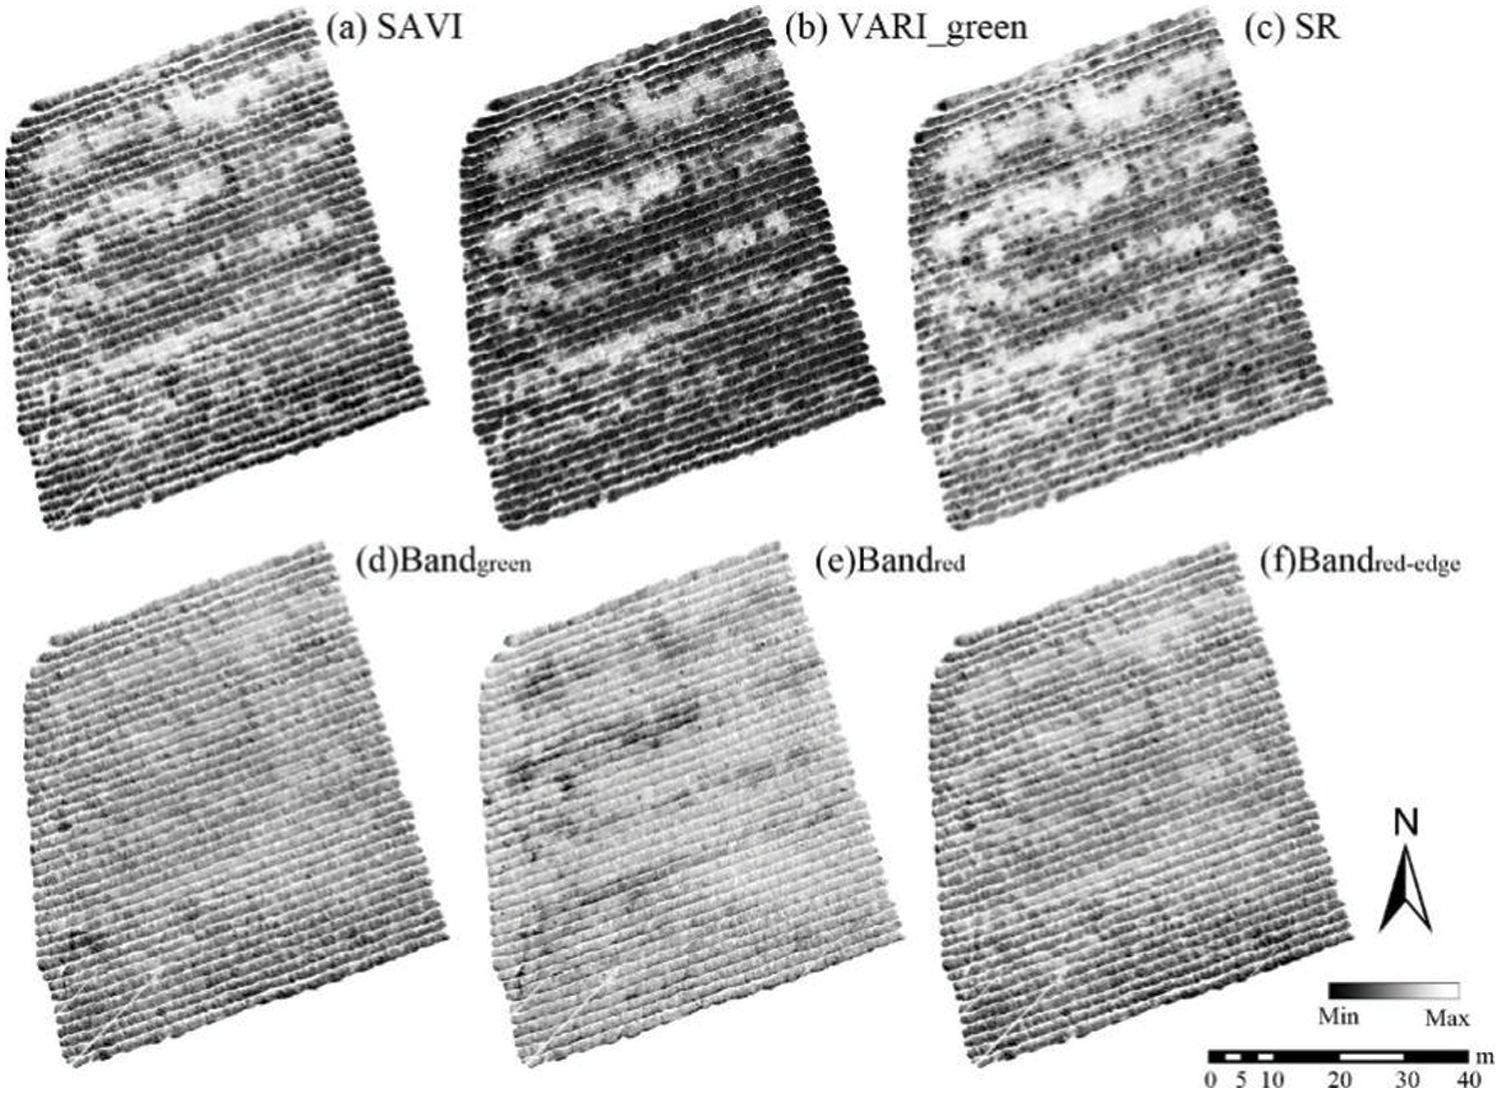
Figure 5: Maps of the top six features by mRMR in detecting TSW damage
The occurrence of diseases and pests can cause various changes in the morphology of the plant canopy (i.e., defoliation, leaf curling, leaf absence, and dead branches) and the physiological status of leaves (i.e., pigment system destruction, cell structure damage, water loss, etc.) [3,19]. These changes can be observed and captured by the remote sensing sensors in the form of spectra and images, thus forming a specific remote sensing response. This response forms the basis of remote sensing monitoring of plant diseases and pests. When tea trees are eaten by the TSW, the leaves of these trees are either broken, holed, or even bare rods remain, resulting in a significant decrease in LAI, canopy coverage, and green biomass. Therefore, both Bandred and Bandgreen are sensitive to the damages caused by the pests. As the increased exposure of soil background may interfere with the monitoring, SAVI effectively reduces the impact of soil background on vegetation spectrum and effectively reflects the changes in the green biomass of tea trees. This index has already been proven to be effective for the detection of Streak Gemini virus in maize [8]. During the estimation of green vegetation coverage, VARI_green minimizes the atmospheric influence and improves the relationship between spectral signals and plant states to a certain extent. In this work, VARI_green also has a good performance for monitoring the TSW. There are various works that have demonstrated the potential of Bandred-edge for the detection of plant diseases and pests [29,34]. In the 3-class model, as the pest incidence levels is further distinguished, the changes in the tea plant growth and biochemical components, such as leaf pigments, and the changes in the shape and position of red edge enable Bandred-edge in detecting the pest incidence levels. Generally, all the spectral features have the potential to discriminate symptomatic tea plants infected by TSW. Besides the spectral features, it is worth noting that the thermal and fluorescence sensors may have a potential in monitoring the early stage of diseases and pests. Therefore, it is expected to combine the spectral observations with thermal and fluorescence observations to promote the capability of the remote sensing system in early monitoring of the pest [3,35].
3.2 Mapping TSW Using Different Classification Algorithms
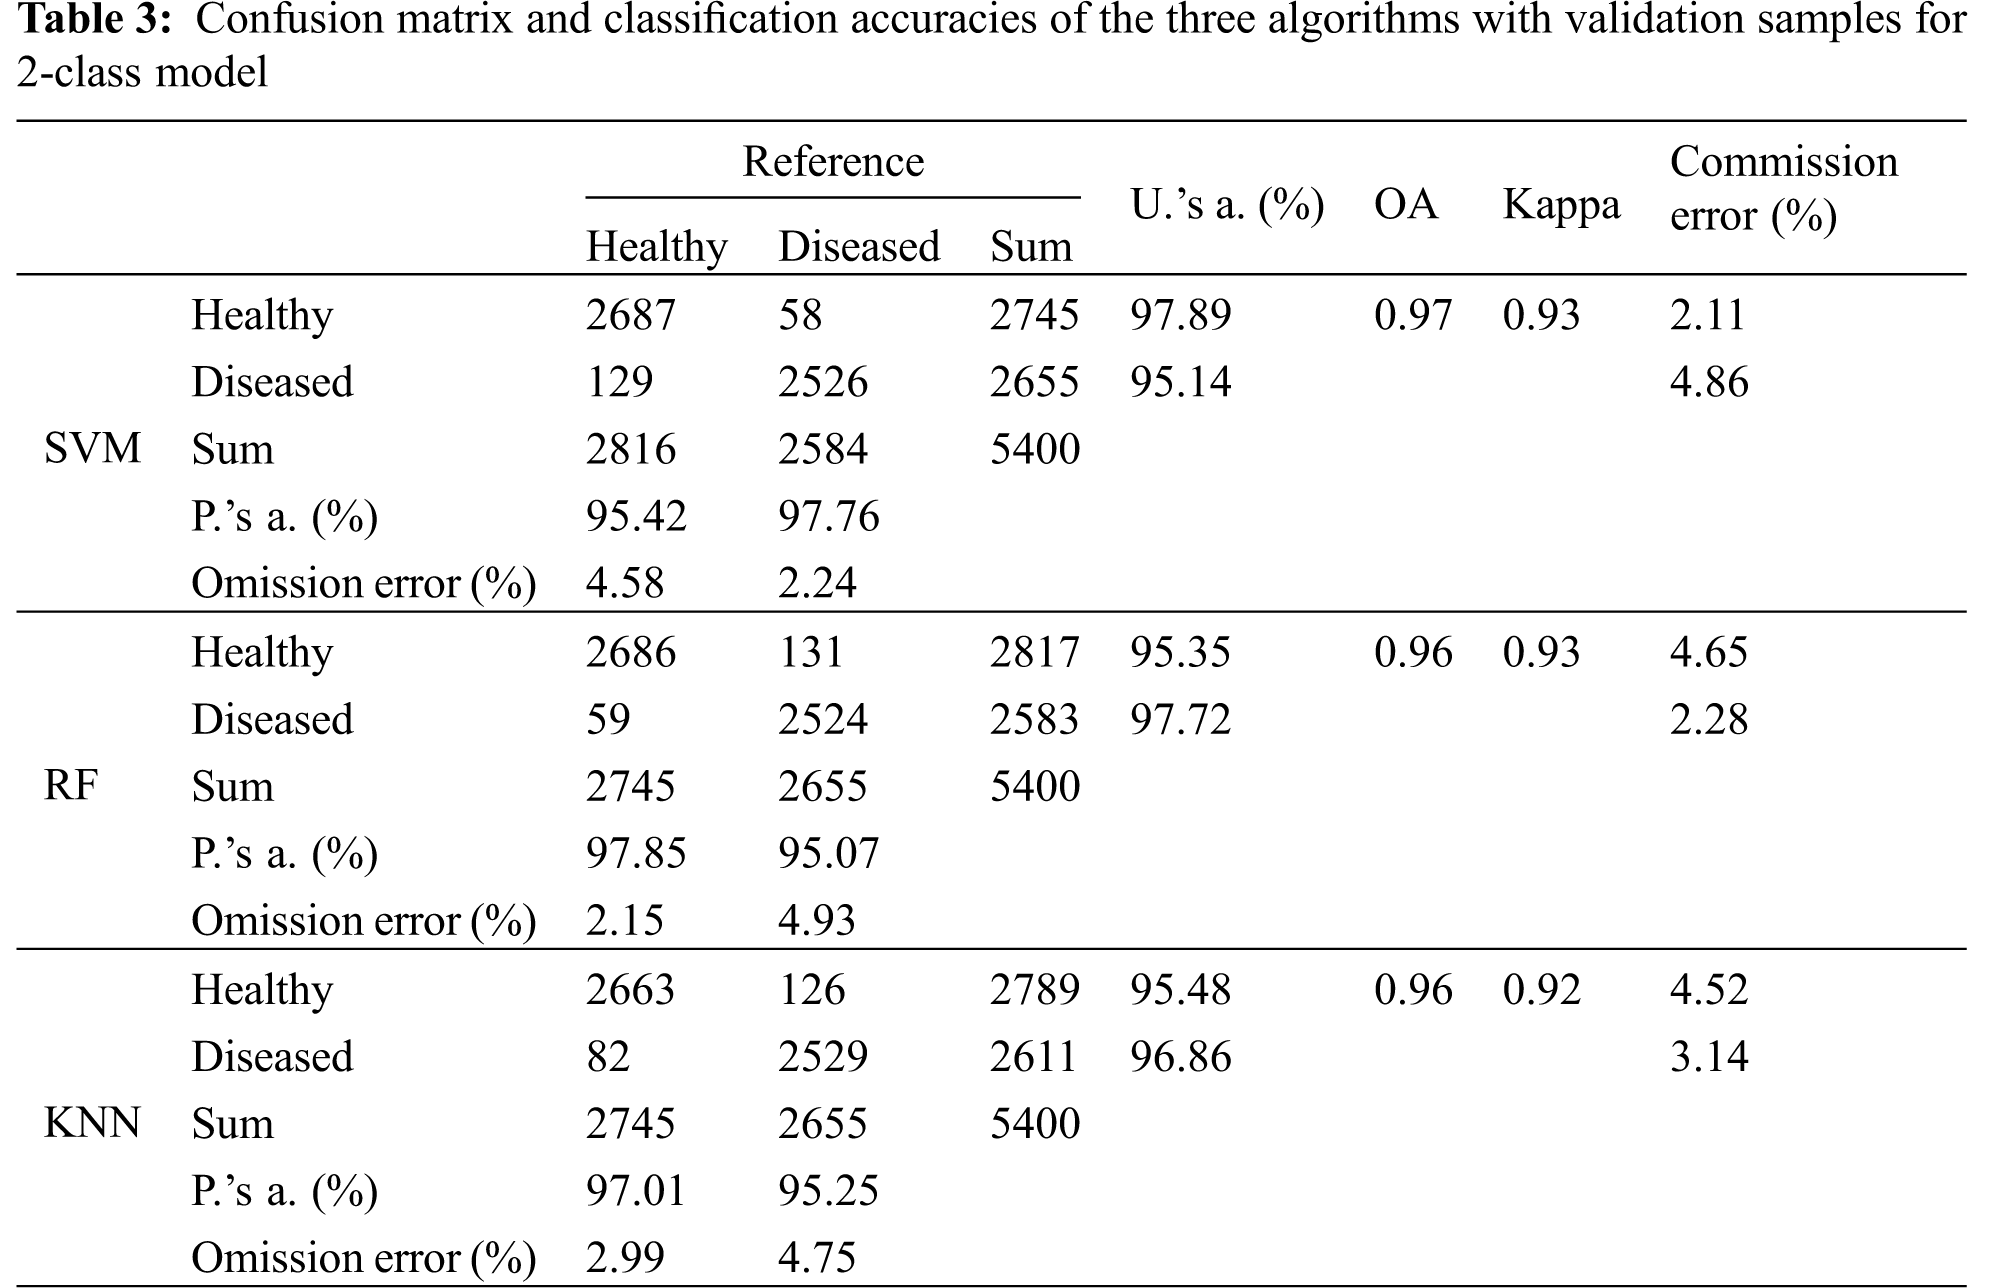
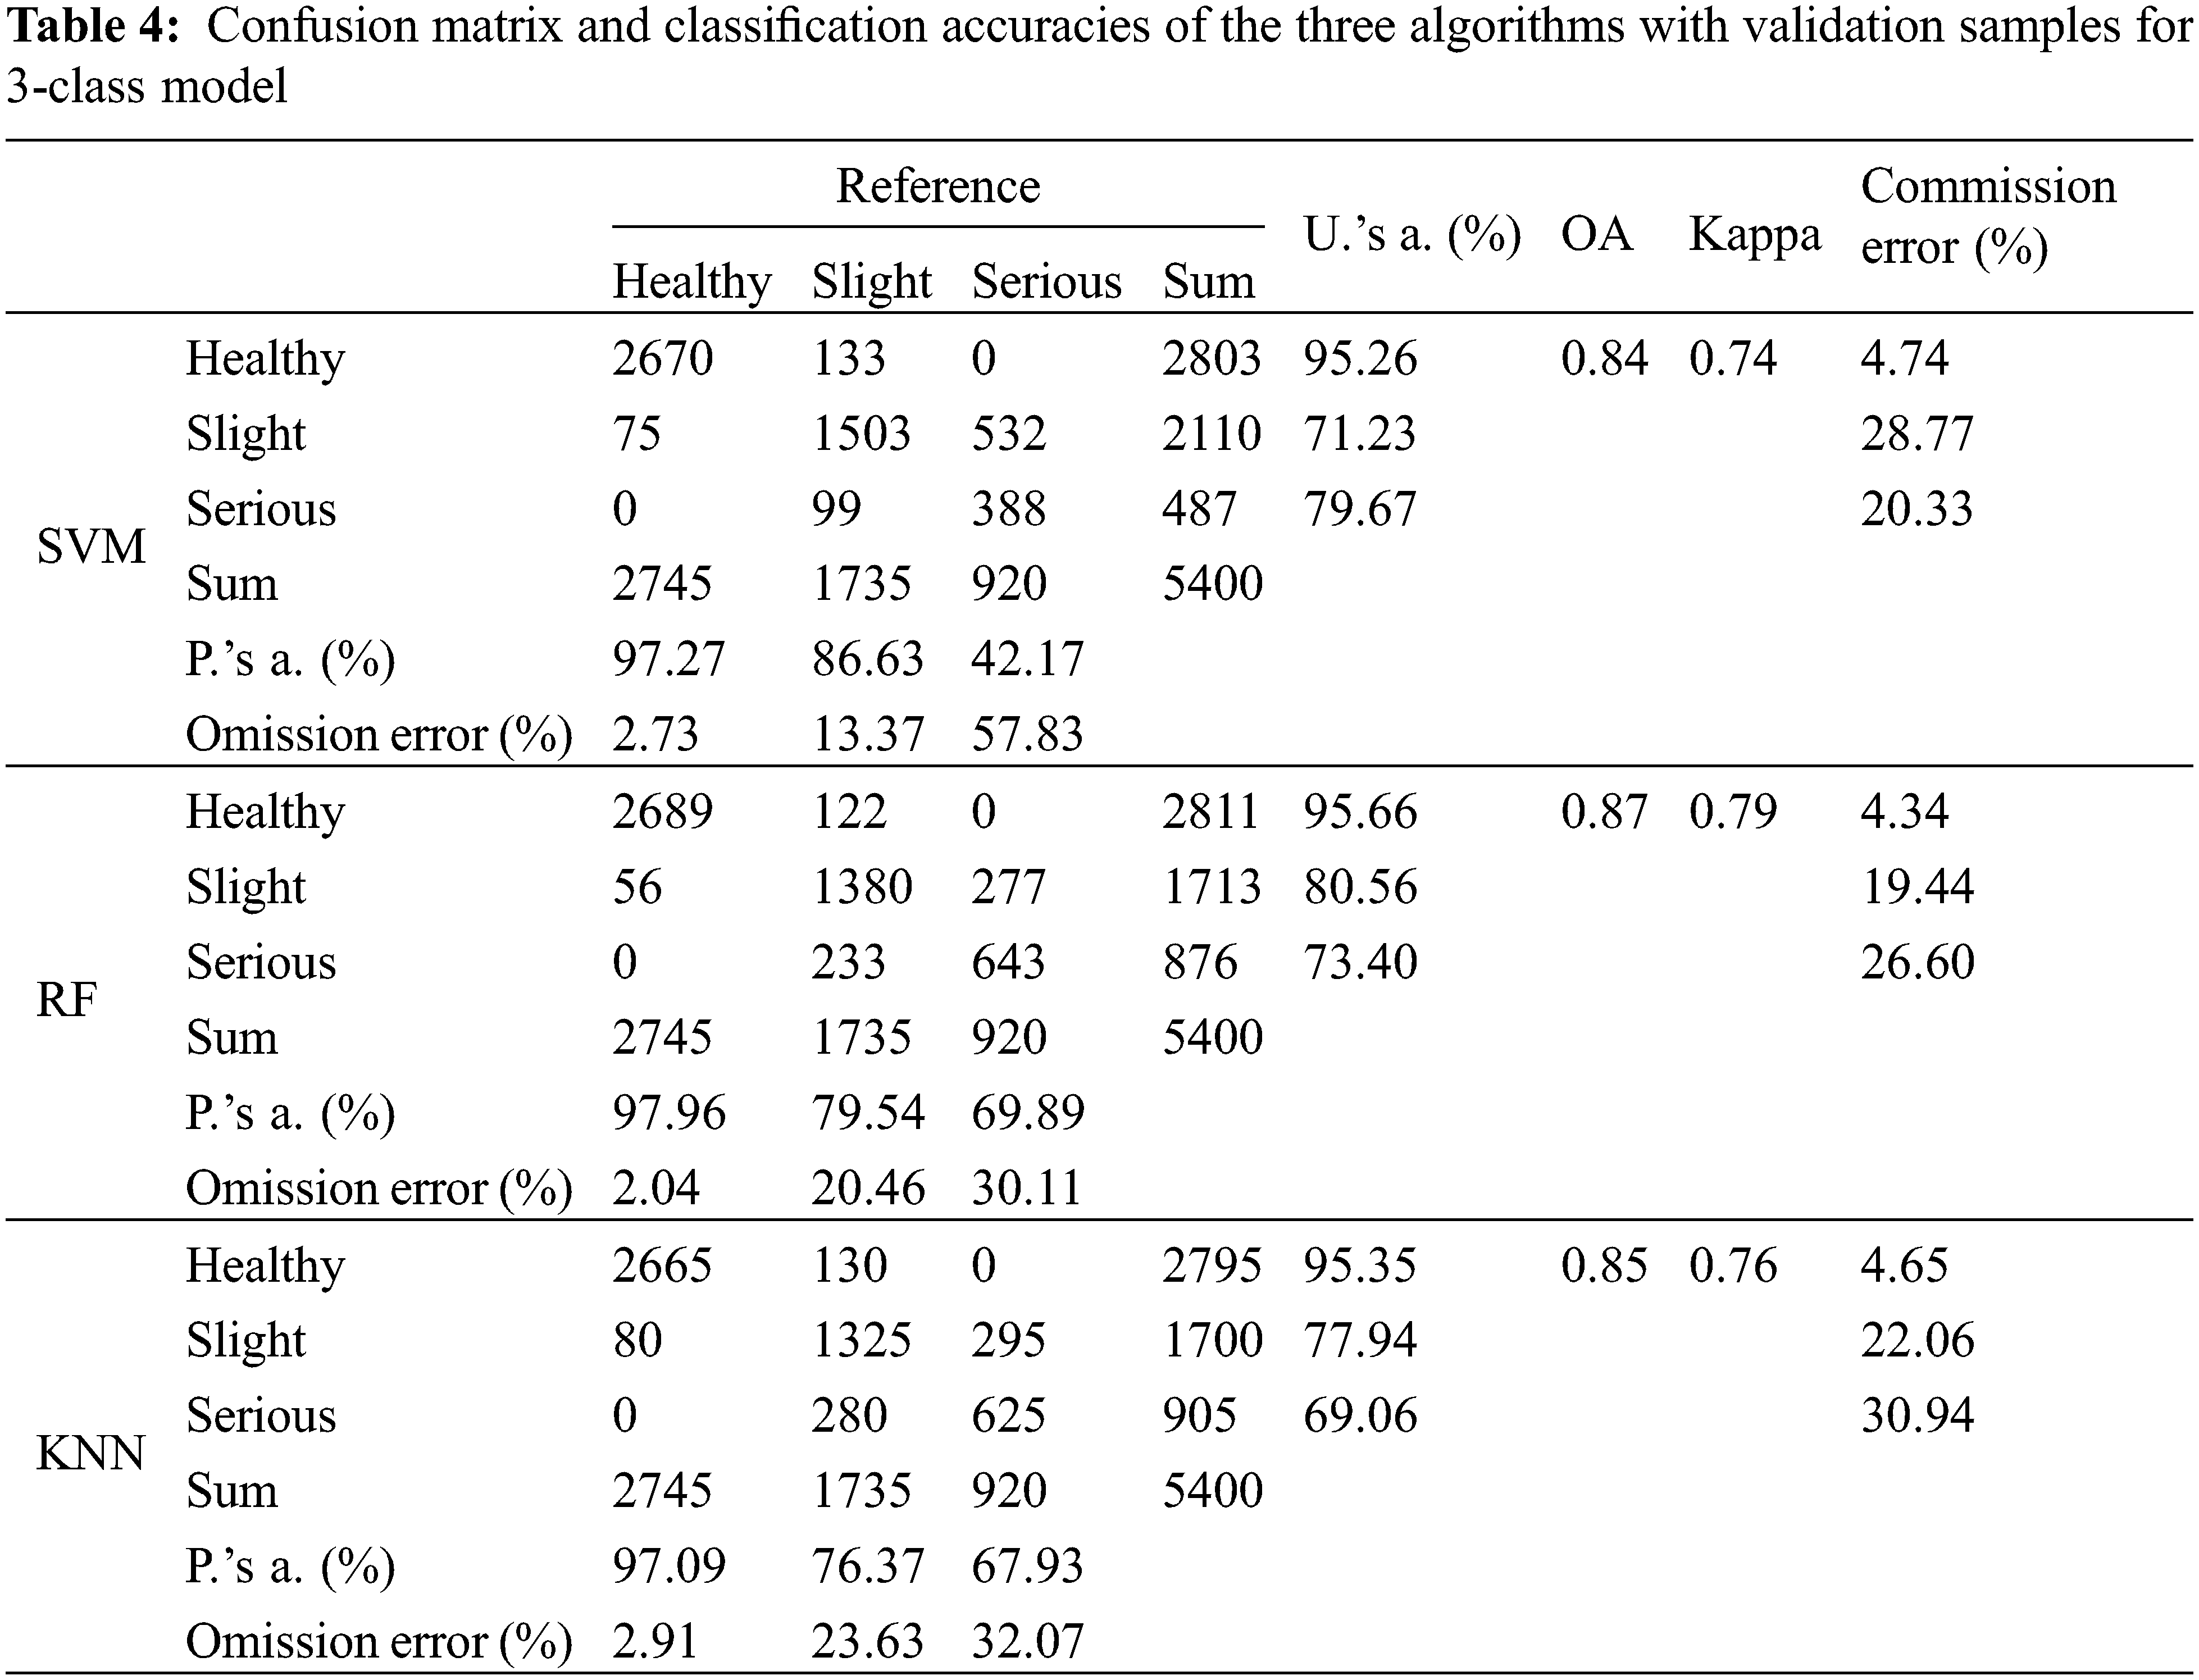
Based on the optimal spectral features presented in Table 2, the monitoring models of TSW in tea plantations with three algorithms were constructed under two classification strategies. The accuracies based on the independent validation samples under the three methods are summarized in Tables 3 and 4. Generally, the overall accuracies of the three models presented in this work reach more than 95% for the 2-class model, which is significantly better as compared to the 85% of the 3-class model. For the 2-class model, the accuracies of the three algorithms were very close, and the overall accuracy of the model ranged from 96%–97%. Among them, the SVM method achieved the highest accuracy, i.e., 97%, and kappa coefficient of 0.93. The pest-damaged areas can be successfully identified by all the three methods. For the 3-class model, the accuracy of the three algorithms was also close, and the overall accuracy of the model ranged from 84%–87%. Among them, the RF method achieveed the highest accuracy with an overall accuracy of 87% and kappa coefficient of 0.79. The analysis of the confusion matrix of 3-class model showed that the identification accuracy of the model for healthy samples was higher as compared to the other two classes. For all three models, the user’s accuracy for healthy samples reached more than 95%. Please note that the misclassification from severely damaged to slightly damaged pixels was the major error, which led to a high omission error (57.83% for SVM, 30.11% for RF, and 32.07% for KNN). The aforementioned results showed that the performance of different algorithms showed no obvious difference in the same classification strategy. Therefore, based on the comprehensive analysis of the number of features and the accuracies of the models, this work recommends the RF model with fewer features to be used for monitoring the TSW in tea plantations. The RF provides an effective way of handling the missing data and usually produces a reasonable prediction without requiring the hyper-parameter tuning [36]. Moreover, it reduces overfitting and increases the precision. The work presented by Tao et al. [14] which is based on multi-spectral UAV dataset and four machine learning algorithms, showed that the RF has the greatest potential with highest accuracy in terms of identifying the armyworm infected areas.
Furthermore, the spatial distribution pattern of the monitoring results yielded by the three algorithms was evaluated and compared, as presented in Fig. 6. A visual comparison shows that the spatial patterns of the identified pest damaged area are generally consistent among the three algorithms, under both 2-class and 3-class models. It is evident from Fig. 6 that the damage caused by the pests showed an aggregated pattern in the field. The infection process of TSW is the formation of pest clusters in some areas of the tea plantation, causing in situ damage, and then gradually spreading to other surrounding areas. In addition, the range of pests showed an obvious spreading trend along the rows. Please note that within a tea plantation, there was an obvious multi-point spread distribution. Based on the aforementioned mapping results and in combination with the characteristics of the infection and the damage caused by the TSW, in actual plant protection management of tea plantations, buffer areas can be set at certain distances as a key prevention and control areas based on the monitored harmed areas at the early stages of pest occurrence. In these key areas, prevention and control management should be strengthened to prevent the spreading of TSW in tea plantations through more precise prevention and control to improve the level of plant protection management of tea plantations and, yield and quality of the tea. Besides, to adapt the model to be applied in different regions and stages, it is important to tune some critical parameters with some optimization algorithms (i.e., genetic algorithm, GA), as well as use of some optimal spectral features.
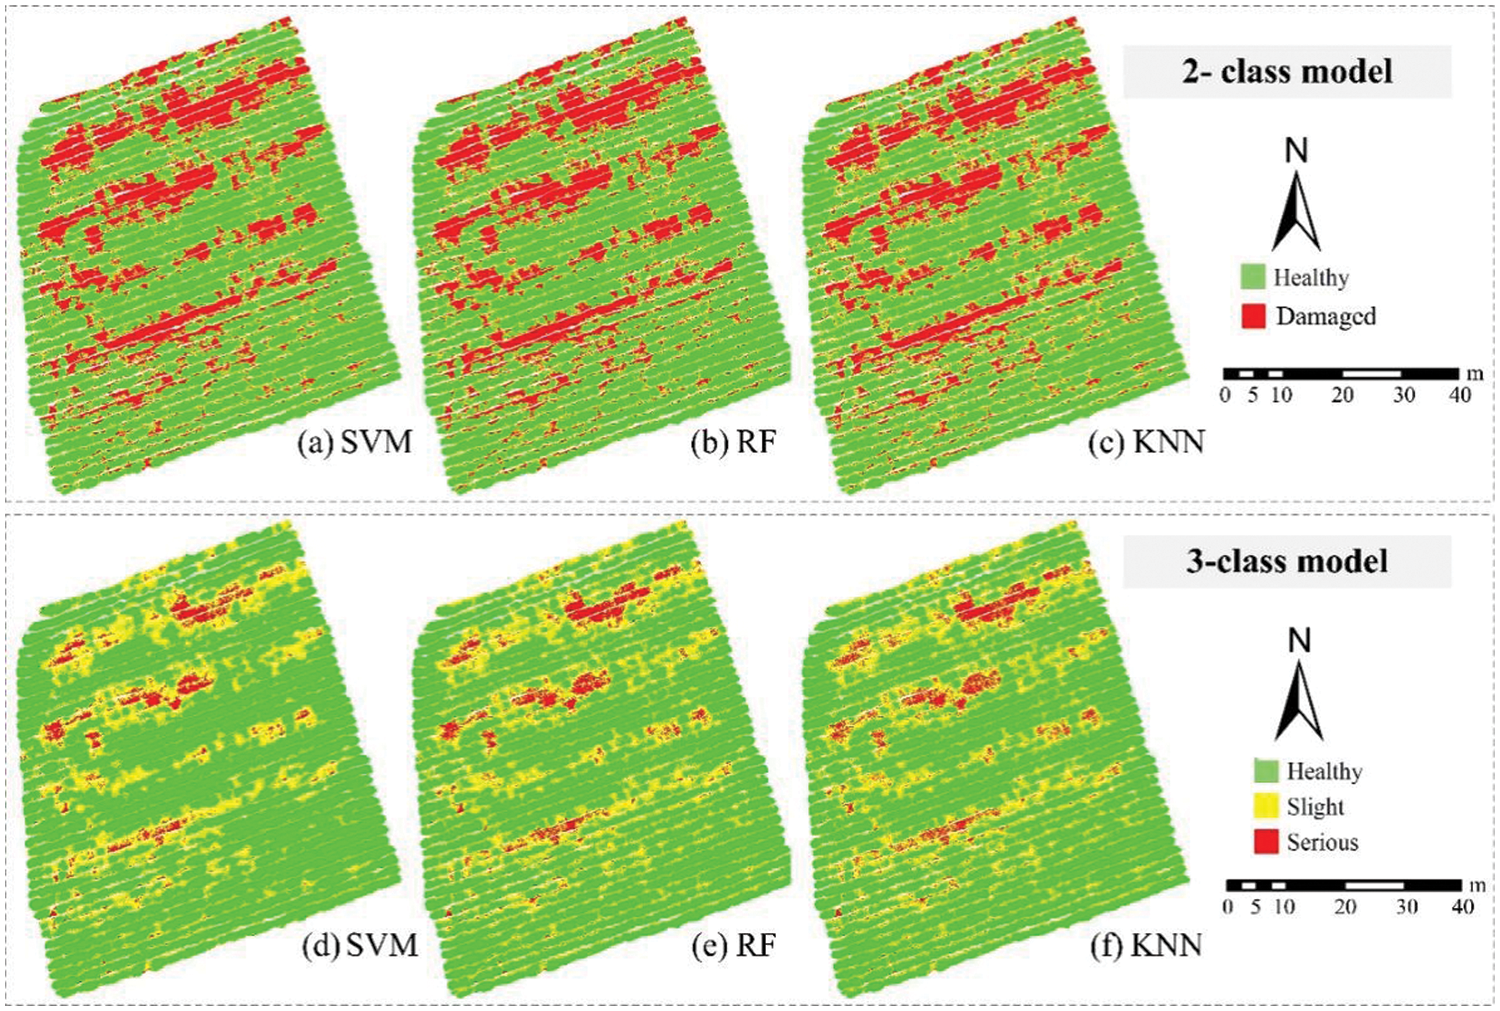
Figure 6: The spatial distribution of TSW damage in tea plantations based on SVM, RF, and KNN
The process of monitoring the pests is an important task in tea plantation monitoring and management via remote sensing technology. In this work, based on UAV multi-spectral remote sensing images, a comprehensive spectral features selection procedure was proposed, which significantly facilitated the development of the detection models for monitoring TSW in tea plantations. The main conclusions of this work are presented below:
(1)Based on the sensitive feature selection strategy proposed in this work, under both the damage occurrence monitoring (2-class model) and damage severity monitoring (3-class model), each model monitored the pest damage with fewer combinations of 2–4 features.
(2)The performance of different models in the same classification model wasconsistent. The accuracy of all the models in the 2-class model was above 95%, and the accuracy of all the models in the 3-class model was about 85%. This showed that the proposed method not only showed a good ability to identify the pest damage, but also had a certain monitoring ability for determining the pest incidence levels.
(3)Considering the number of features and the accuracies of the models, the RF algorithm was recommended in this work. In the 2-class model, only two features were used. The overall accuracy reached 96%, and the Kappa coefficient was 0.97. The overall accuracy of the 3-class model was 87%, and the Kappa coefficient was 0.79.
The UAV multi-spectral technology with red-edge bands is a low-cost solution for remotely monitoring the pest infections in tea plantations. Based on the technical system proposed in this work, in the future tea plantation plant protection precision management, we will: (1) apply continuous time phase observation for timely finding the abnormal areas in tea plantations and master the occurrence regularity of tea plantation stress; (2) monitoring should be performed in the critical period of high incidence of diseases and pests, and rapid monitoring mapping of abnormal areas in tea plantations should be performed by using a UAV for mastering the occurrence, distribution, and severity of stress in tea plantations, and formulate precise prevention and control strategies; (3) considering the possible discrimination problem of confounding stress in actual tea plantations, multi-source data, such as climate data, geographic data and wireless sensor networks, can be combined to perform monitoring. These technologies are expected to provide technical support for the precise management of tea plantation pests and diseases and other stresses in the future, which is of great significance for improving the quality and yield of tea.
Authorship: The authors confirm contribution to the paper as follows: Lin Yuan conceived and designed the study and wrote the initial manuscript. Yao Zhang supervised the project and designed the research. Qimeng Yu, Ouguan Xu and Wenjing Li analyzed the data. Lin Yuan and Yao Zhang conducted the experiments. Xiaochang Wang reviewed and edited the final version of the manuscript. All authors have read and agreed to the published version of the manuscript.
Funding Statement: This research was funded by the Zhejiang Agricultural Cooperative and Extensive Project of Key Technology (2020XTTGCY04-02; 2020XTTGCY01-05), and the Major Special Project for 2025 Scientific and Technological Innovation (Major Scientific and Technological Task Project in Ningbo City) (2021Z048).
Conflicts of Interest: The authors declare that they have no conflicts of interest to report regarding the present study.
References
1. Cui, L., Liu, Y. S. (2005). Occurrence and control of Thosea sinensis Walker in tea plantation. China Tea, 27(2), 21. [Google Scholar]
2. Wang, J. C., Jin, L., Liu, Z. R., Zhan, Z. G., Kuan, W. D. et al. (2020). Isolation and identification of Thosea sinensis nuclear polyhedrosis virus. Jiangxi Science, 38(1), 90–93. [Google Scholar]
3. Zhang, J. C., Huang, Y. B., Pu, R. L., Gonzalez-Moreno, P., Yuan, L. et al. (2019). Monitoring plant diseases and pests through remote sensing technology: A review. Computers and Electronics in Agriculture, 165, 104943. [Google Scholar]
4. Mahlein, A., Rumpf, T., Welke, P., Dehne, H. W., Plümer, L. et al. (2013). Development of spectral indices for detecting and identifying plant diseases. Remote Sensing of Environment, 128, 21–30. [Google Scholar]
5. Yuan, L., Huang, Y. B., Loraamm, R. W., Nie, C. W., Wang, J. H. et al. (2014). Spectral analysis of winter wheat leaves for detection and differentiation of diseases and insects. Field Crops Research, 156, 199–207. [Google Scholar]
6. Rebecca, L. W., Toby, W. W., Abdul, M. M. (2018). Hyperspectral measurements of yellow rust and fusarium head blight in cereal crops: Part 2: On-line field measurement. Biosystems Engineering, 167(384), 144–158. DOI 10.1016/j.biosystemseng.2018.01.004. [Google Scholar] [CrossRef]
7. Yuan, L., Zhang, J. C., Shi, Y. Y., Nie, C. W., Wei, L. G. et al. (2014). Damage mapping of powdery mildew in winter wheat with high resolution satellite image. Remote Sensing, 6(5), 3611–3623. DOI 10.3390/rs6053611. [Google Scholar] [CrossRef]
8. Dhau, I., Adam, E., Mutanga, O., Ayisi, K. K., Mutanga, O. (2018). Detection and mapping of maize streak virus using RapidEye satellite imagery. Geocarto International, 34(8), 856–866. DOI 10.1080/10106049.2018.1450448. [Google Scholar] [CrossRef]
9. Ruan, C., Dong, Y. Y., Huang, W. J., Huang, L., Ye, H. et al. (2021). Prediction of wheat striperust occurrence with time series sentinel-2 images. Agriculture, 11(11), 1079. DOI 10.3390/agriculture11111079. [Google Scholar] [CrossRef]
10. Marris, E. (2013). Drones in science: Fly, and bring me data. Nature, 498(7453), 156–158. DOI 10.1038/staging2_green_ontol_498156a. [Google Scholar] [CrossRef]
11. Gomez Selvaraj, M., Vergara, A., Montenegro, F., Alonso Ruiz, H., Safari, N. et al. (2020). Detection of banana plants and their major diseases through aerial images and machine learning methods: A case study in DR Congo and Republic of Benin. ISPRS Journal of Photogrammetry and Remote Sensing, 169, 110–124. DOI 10.1016/j.isprsjprs.2020.08.025. [Google Scholar] [CrossRef]
12. Neupane, K., Baysal-Gurel, F. (2021). Automatic identification and monitoring of plant diseases using unmanned aerial vehicles: A review. Remote Sensing, 13(19), 3841. DOI 10.3390/rs13193841. [Google Scholar] [CrossRef]
13. de Oca, A. M., Flores, G. (2021). The AgriQ: A low-cost unmanned aerial system for precision agriculture. Expert Systems with Applications, 182(C), 115163. DOI 10.1016/j.eswa.2021.115163. [Google Scholar] [CrossRef]
14. Tao, W. C., Wang, X. S., Xue, J. H., Su, W., Zhang, M. Z. et al. (2022). Monitoring the damage of armyworm as a pest in summer corn by unmanned aerial vehicle imaging. Pest Management Science, 78(6), 2265–2276. DOI 10.1002/ps.6852. [Google Scholar] [CrossRef]
15. Xavier, T. W. F., Souto, R. N. V., Statella, T., Galbieri, R., Santos, E. S. et al. (2019). Identification of ramularia leaf blight cotton disease infection levels by multispectral, multiscale UAV imagery. Drones, 3(2), 33. DOI 10.3390/drones3020033. [Google Scholar] [CrossRef]
16. Calou, V. B. C., Teixeira, A. D. S., Moreira, L. C. J., Lima, C. S., de Oliveira, J. B. et al. (2020). The use of UAVs in monitoring yellow sigatoka in banana. Biosystems Engineering, 193(2), 115–125. DOI 10.1016/j.biosystemseng.2020.02.016. [Google Scholar] [CrossRef]
17. Luo, D., Gao, Y., Wang, Y., Shi, Y., Chen, S. et al. (2022). Using UAV image data to monitor the effects of different nitrogen application rates on tea quality. Journal of the Science of Food and Agriculture, 102(4), 1540–1549. DOI 10.1002/jsfa.11489. [Google Scholar] [CrossRef]
18. Shi, Y., Gao, Y., Wang, Y., Luo, D., Chen, S. et al. (2022). Using unmanned aerial vehicle-based multispectral image data to monitor the growth of intercropping crops in tea plantation. Frontiers in Plant Science, 13, 820585. DOI 10.3389/fpls.2022.820585. [Google Scholar] [CrossRef]
19. West, J. S., Bravo, C., Oberti, R., Lemaire, D., Moshou, D. et al. (2003). The potential of optical canopy measurement for targeted control of field crop diseases. Annual Review of Phytopathology, 41(1), 593–614. DOI 10.1146/annurev.phyto.41.121702.103726. [Google Scholar] [CrossRef]
20. Huete, A. R., Didan, K., Miura, T., Rodriguez, E. P., Gao, X. et al. (2002). Overview of the radiometric and biophysical performance of the MODIS vegetation indices. Remote Sensing of Environment, 83(1–2), 195–213. DOI 10.1016/S0034-4257(02)00096-2. [Google Scholar] [CrossRef]
21. Jiang, Z., Huete, A. R., Didan, K., Miura, T. (2008). Development of a two-band enhanced vegetation index without a blue band. Remote Sensing of Environment, 112(10), 3833–3845. DOI 10.1016/j.rse.2008.06.006. [Google Scholar] [CrossRef]
22. Rouse, J. W., Haas, R. H., Schell, J. A., Deering, D. W. (1973). Monitoring vegetation systems in the great plains with ERTS. 3rd ERTS Symposium, pp. 309–317. Washington DC. [Google Scholar]
23. Huete, A. R. (1988). A soil-adjusted vegetation index (SAVI). Remote Sensing of Environment, 25(3), 295–309. DOI 10.1016/0034-4257(88)90106-X. [Google Scholar] [CrossRef]
24. Jordan, C. F. (1969). Derivation of leaf area index from quality of light on the forest floor. Ecology, 50(4), 663–666. DOI 10.2307/1936256. [Google Scholar] [CrossRef]
25. Gitelson, A. A., Kaufman, Y. J., Stark, R., Rundquist, D. (2002). Novel algorithms for remote estimation of vegetation fraction. Remote Sensing of Environment, 80(1), 76–87. DOI 10.1016/S0034-4257(01)00289-9. [Google Scholar] [CrossRef]
26. Gitelson, A. A. (2004). Wide dynamic range vegetation index for remote quantification of biophysical characteristics of vegetation. Journal of Plant Physiology, 161(2), 165–173. DOI 10.1078/0176-1617-01176. [Google Scholar] [CrossRef]
27. Li, D. Y., Wen, G. H. (2018). MRMR-based ensemble pruning for facial expression recognition. Multimedia Tools and Applications, 77(12), 15251–15272. DOI 10.1007/s11042-017-5105-z. [Google Scholar] [CrossRef]
28. Cheng, X. M., Shen, Z. F., Xing, T. Y. (2016). Efficiency and accuracy analysis of multispectral image classification based on m RMR feature selection method. International Journal of Geographical Information Science, 18(6), 815–823. [Google Scholar]
29. Huang, W. J., Guan, Q. S., Luo, J. H., Zhang, J. C., Zhao, J. L. et al. (2014). New optimized spectral indices for identifying and monitoring winter wheat diseases. IEEE Journal of Selected Topics in Applied Earth Observations and Remote Sensing, 7(6), 2516–2524. DOI 10.1109/JSTARS.2013.2294961. [Google Scholar] [CrossRef]
30. Mundra, P. A., Rajapakse, J. C. (2009). SVM-RFE with MRMR filter for gene selection. IEEE Transactions on Nanobioscience, 9(1), 31–37. DOI 10.1109/TNB.2009.2035284. [Google Scholar] [CrossRef]
31. Belgiu, M., Drăgu, L. (2016). Random forest in remote sensing: A review of applications and future directions. ISPRS Journal of Photogrammetry and Remote Sensing, 114, 24–31. DOI 10.1016/j.isprsjprs.2016.01.011. [Google Scholar] [CrossRef]
32. Mountrakis, G., Im, J., Ogole, C. (2011). Support vector machines in remote sensing: A review. ISPRS Journal of Photogrammetry and Remote Sensing, 66(3), 247–259. DOI 10.1016/j.isprsjprs.2010.11.001. [Google Scholar] [CrossRef]
33. Liao, Y. H., Vemuri, V. R. (2002). Use of K-nearest neighbor classifier for intrusion detection. Computers & Security, 21(5), 439–448. DOI 10.1016/S0167-4048(02)00514-X. [Google Scholar] [CrossRef]
34. Ye, H. C., Huang, W. J., Huang, S., Cui, B., Dong, Y. Y. et al. (2020). Cognition of banana fusarium wilt based on UAV remote sensing. Remote Sensing, 12(6), 938. DOI 10.3390/rs12060938. [Google Scholar] [CrossRef]
35. De Oca, A. M., Flores, G. (2021). A UAS equipped with a thermal imaging system with temperature calibration for crop water stress index computation. 2021 International Conference on Unmanned Aircraft Systems (ICUAS), pp. 714–720. Athens, Greece. [Google Scholar]
36. Rodriguez-Galiano, V. F., Ghimire, B., Rogan, J. (2012). An assessment of the effectiveness of a random forest classifier for land-cover classification. ISPRS Journal of Photogrammetry and Remote Sensing, 67(4), 93–104. DOI 10.1016/j.isprsjprs.2011.11.002. [Google Scholar] [CrossRef]
Cite This Article
 Copyright © 2023 The Author(s). Published by Tech Science Press.
This work is licensed under a Creative Commons Attribution 4.0 International License , which permits unrestricted use, distribution, and reproduction in any medium, provided the original work is properly cited.
 Downloads
 Citation Tools