
 Submit a Paper
 Propose a Special lssue
 Open Access
ARTICLE

Biochemical and Physiological Responses of Arabidopsis thaliana Leaves to Moderate Mechanical Stimulation
1 Department of Biology, Faculty of Science, University of Zagreb, Zagreb, 10000, Croatia
2 Faculty of Electrical Engineering and Computing, University of Zagreb, Zagreb, 10000, Croatia
* Corresponding Author: Željka Vidaković-Cifrek. Email:
# These authors contributed equally to this work
(This article belongs to the Special Issue: Plant–Environment Interactions)
Phyton-International Journal of Experimental Botany 2023, 92(3), 901-920. https://doi.org/10.32604/phyton.2023.025165
Received 24 June 2022; Accepted 16 September 2022; Issue published 29 November 2022
 View Full Text
 Download PDF
Abstract
Mechanical stimulation of plants can be caused by various abiotic and biotic environmental factors. Apart from the negative consequences, it can also cause positive changes, such as acclimatization of plants to stress conditions. Therefore, it is necessary to study the physiological and biochemical mechanisms underlying the response of plants to mechanical stimulation. Our aim was to evaluate the response of model plant Arabidopsis thaliana to a moderate force of 5 N (newton) for 20 s, which could be compared with the pressure caused by animal movement and weather conditions such as heavy rain. Mechanically stimulated leaves were sampled 1 h after exposure and after a recovery period of 20 h. To study a possible systemic response, unstimulated leaves of treated plants were collected 20 h after exposure alongside the stimulated leaves from the same plants. The effect of stimulation was assessed by measuring oxidative stress parameters, antioxidant enzymes activity, total phenolics, and photosynthetic performance. Stimulated leaves showed increased lipid peroxidation 1 h after treatment and increased superoxide dismutase activity and phenolic oxidation rate after a 20-h recovery period. Considering photosynthetic performance after the 20-h recovery period, the effective quantum yield of the photosystem II was lower in the stimulated leaves, whereas photochemical quenching was lower in the unstimulated leaves of the treated plants. Nonphotochemical quenching was lower in the stimulated leaves 1 h after treatment. Our study suggested that plants sensed moderate force, but it did not induce pronounced change in metabolism or photosynthetic performance. Principal component analysis distinguished three groups–leaves of untreated plants, leaves analysed 1 h after stimulation, while stimulated and unstimulated leaves of treated plants analysed 20 h after treatment formed together the third group. Observed grouping of stimulated and unstimulated leaves of treated plants could indicate signal transduction from the stimulated to distant leaves, that is, a systemic response to a local application of mechanical stimuli.Keywords
In both natural habitats and agricultural fields, plants are exposed to fluctuating environmental factors that are considered as stressful due to their negative effects on plant growth, development, and productivity. Stress factors can be biotic or abiotic. While biotic factors include plant interactions with other organisms, such as herbivore attack and pathogen infection, abiotic factors include environmental cues such as water and nutrient availability, temperature, and light intensity [1–3].
Plants also sense and respond to a variety of mechanical stimuli to which they may be exposed in nature. Considering the widespread effects on growth and development, plants respond to mechanical stress in different ways. It has been shown that the forces originated from touching inhibit growth and delay flowering in Arabidopsis thaliana (L.) Heynh. and can reduce the height of cotton plants but did not significantly affect cotton flowering and yield [4–9]. In the sensitive plant Mimosa pudica, the carnivorous plant Venus flytrap Dionaea muscipula, and sundews of the genus Drosera, touch causes distinct and very rapid movement of certain organs [10,11]. In addition, environmental conditions such as strong winds, frost, rain, hail, flooding, soil movement, trampling by animals, and various human activities cause mechanical stress to plants that can lead to bending, rubbing, movement of organs, or damage and even breakage of plant parts.
Acclimation of plants to disturbances caused by mechanical stimuli is based on developmental responses that modulate the mechanical properties of exposed tissues and organs [4,11–13]. It was shown that A. thaliana acclimates to mechanical stimulation in the form of brushing by inhibiting the length of the inflorescence stem and altering its mechanical properties [14,15]. When plants successfully recover from mechanical stress, they can maintain agronomically beneficial characteristics. In this context, Iida [5] described a method called “Mugifumi” that has been used by Japanese farmers for centuries. The method is based on empirical knowledge about the beneficial effects of mechanical stress. Wheat and barley sown in the fall were subjected to treading in winter period, which induced morphological changes such as strengthening of roots and shortening of plant height, resulting in higher grain yields. Nowadays, mechanical stress is the focus of much research that continues to expand our knowledge of morphological changes in plants exposed to mechanical stimuli [6,9,11,15–17]. Moreover, mechanically-induced stress can increase the content of specialized metabolites and antioxidant capacity of leafy vegetables [13]. It has also been reported [18] that mechanical stimulation can improve the nutritional properties of plants by increasing the absorption of elements and changes in metabolite profile. In addition, mechanical stimulation has been shown to lead to acclimation and tolerance to other stress conditions such as frost, cold, heat, salt, drought, and pathogen attack [19,20]. An example is the resistance of A. thaliana to the fungal pathogen Botrytis cinerea after exposure to mild mechanical stimulation [21,22].
The perception of mechanical stimuli begins at the cellular and tissue levels with the activation of specific signalling pathways. Induced molecular and physiological responses include alteration of enzyme activities, degradation of proteins, lipid peroxidation in the biological membranes, alteration of gene expression and de novo protein synthesis, accumulation of stress protective metabolites such as compatible osmolytes and various specialised metabolites, and changes in carbohydrate metabolism including modulation of photosynthetic activity [19,23–29]. In addition to local responses to stressors triggered at the site of exposure, certain environmental factors, particularly biotic stresses such as pathogen and herbivore attack, can induce a systemic response that ensures an effective stress response in tissues distant from the site of the initial attack [30–33]. The induction of a systemic response by mechanical stimulation or injury has been reported in several studies and is characterised by the accumulation of jasmonate, a well-characterised signalling molecule, and increased accumulation of ROS, followed by Ca2+ influx [34–37].
A common response to most stress factors, including mechanical stress, is increased production of reactive oxygen species (ROS) that are derivatives of molecular oxygen (O2) such as superoxide radicals, hydroxyl radicals, hydrogen peroxide (H2O2), and singlet oxygen, and are usually considered highly toxic to the cell [7,38,39]. A certain amount of ROS is regularly produced in cells during metabolic reactions and is involved in many cellular processes, such as cell wall strengthening, senescence, response to wounding and pathogen attack. In addition, ROS also serves as signals in developmental processes such as root growth and cellular differentiation [40], activation of various adaptive mechanisms to stress conditions, and defence against pathogens [41,42]. Apart from these beneficial functions, excessive production of ROS and its strong oxidising activity can seriously disrupt the structure and metabolic function of macromolecules such as proteins, nucleic acids, and membrane lipids [41,43,44]. The level of lipid peroxidation, often measured as malondialdehyde (MDA) content, is an indicator of oxidative damage to membrane lipids [45].
Plants have evolved an efficient antioxidant system consisting of enzymatic and non-enzymatic components distributed in different subcellular compartments, and which together play a role in mitigating the deleterious effects of excessive ROS production [41,43]. The most important antioxidant enzymes in plants are superoxide dismutase (SOD), catalase (CAT), and peroxidases (PODs) such as ascorbate peroxidase (APX) and guaiacol peroxidase (G-POD) [38,46]. The H2O2 content and activity of antioxidant enzymes are important indicators of plant response to various stimuli. Increased activities of antioxidant enzymes are reported in many studies on the effects of abiotic stress on plants [47,48].
Phenolic compounds, such as flavonoids, tannins, coumarins, lignans, and phenolic acids, play an important role in the interactions between plants and their environment. Phenolics are structural elements of the cell wall, and important components of the defence response to infection, excessive sunlight, injury, and heavy metal stress [49–52]. Therefore, the content of phenolics in plant tissues can vary under the influence of environmental conditions, and their accumulation serves as a good indicator of plant response to a specific stress [53–55]. Polyphenol oxidases (PPOs) are nearly ubiquitous enzymes in plants involved in biosynthetic and cross-linking reactions, as well as defence against abiotic and biotic stress factors [56,57]. No PPO genes have been identified in the genus Arabidopsis, and it has been suggested that the absence of PPO in this genus could be compensated by other oxidative enzymes such as laccases and peroxidases that could perform similar phenolic oxidations using O2 [58].
Plant growth and biomass production depend on photosynthesis, a complex process involving numerous cellular components such as photosynthetic pigments and all other elements of the electron transport chain, carbon dioxide assimilation, and biosynthesis of starch and sucrose. Adverse environmental conditions can affect photosynthesis [59,60]. The kinetics of chlorophyll fluorescence induction upon irradiation of dark-adapted leaves is one of the methods used to determine photosynthetic performance. Measured and calculated parameters obtained by this non-destructive and highly sensitive method provide useful information on photosystem II (PSII) efficiency and electron transport in chloroplasts [60–62]. Analysis of photosynthetic pigments in plants–the levels of chlorophyll a (Chl a), chlorophyll b (Chl b), and total carotenoids (Cars) as well as their ratios provides a useful tool for assessing the effects of environmental stress on light-absorbing efficiency and photosynthetic capacity [60,63,64].
According to our observations and data in the literature, mechanical stimulation has been less studied than effects of other abiotic and biotic environmental conditions. The studies conducted so far included different types of mechanical stimuli, however they were rarely quantified, making it difficult to compare data from different studies as pointed out by Coutand [65]. In most cases, mechanical stimuli have been quantified as the number of rubbing [22], touching [21], bending [66], and brushing treatments [15], and these studies have focused mainly on the effects on growth, morphological, and developmental changes [18,67]. Unlike these long-term effects, mechanical stimulation triggers numerous physiological and biochemical changes that can be detected in a much shorter time than phenotypic modifications. Interesting findings describing the generation of ROS, induction of the antioxidant system, hormonal modulation, and activation of gene expression upon mechanical stimulation have been published [7,21–23,68,69], but in general such effects are less studied compared to the previously mentioned morphological changes.
The main objective of our work was to apply an external, precisely quantified, moderate mechanical force of 5 N (newton) to the leaf blades of A. thaliana. Based on our personal sense and estimation, the stimuli could be compared to the pressure caused by the movement of animals, such as trampling, and by weather conditions, such as heavy rain. As mentioned earlier, mechanical force can have detrimental effects on plants, but various forms of mechanical stimuli such as wind, touch, brushing, or bending can improve plant defence responses and stress tolerance [22,32,70]. Therefore, mechanical stimulation has a potential for crop production [19,21]. However, for successful application of this method there is a need to understand the physiological and biochemical basis of the response to mechanical stimuli, including the mechanism of signal transduction to distant tissues. To contribute to the existing knowledge on the response to mechanical stimulation, we used a model plant A. thaliana to evaluate selected physiological and biochemical changes: oxidative stress parameters, activation of antioxidant enzymes, phenolics, photosynthetic performance, and pigment content. In our experiment, leaves of A. thaliana subjected to mechanical stimulation were sampled 1 h after short-term exposure to the mechanical force and after a recovery period of 20 h. To study a possible systemic response, unstimulated leaves of treated plants were collected alongside the stimulated leaves of the same plants 20 h after the treatment.
2.1 Plant Material and Growth Conditions
Seeds of A. thaliana, ecotype Columbia were sown in square plastic pots (6 cm × 5.5 cm) filled with soil. After watering the soil, the pots were covered with plastic wrap and placed in the dark at 4°C for stratification. After three days, the pots were moved to the growth chamber where the plants were grown at 20°C, relative humidity of ~60%, and a photoperiod of 10 h of light and 14 h of darkness. Illumination was provided by cool white fluorescent tubes (18 W) with a light intensity of 60–65 μmol m−2 s−1 at plant level. The plastic wrap was removed from the pots as soon as the germinated seedlings became visible. Plants were irrigated twice weekly by filling the trays with water that was absorbed into the soil through the perforated pot bottom.
According to Boyes et al. [71], the stage of the plants used for the experiment was: rosette growth complete (stage 3.90), before flowering, i.e., before the growth of the flower stalk and without a dark green rosette. Leaves reached their final size and mechanical stimulation was applied to the oval shaped leaf blade.
Two to three leaves per plant were subjected to moderate mechanical stimulation using a force of 5 N over an area of approximately 1 cm2 (a pressure of approximately 50 kPa) for 20 s. Leaves were pressed on both sides of the leaf blade; the lower side of the blade was pressed with a Force sensor (FlexiForce, model A201, Tekscan), while the upper side with the cap of an Eppendorf tube (its upper, smooth surface) attached to the finger (Fig. 1a). The applied force was measured with a force measurement system (Fig. 1b) and graphically observed in real time on a personal computer [72].
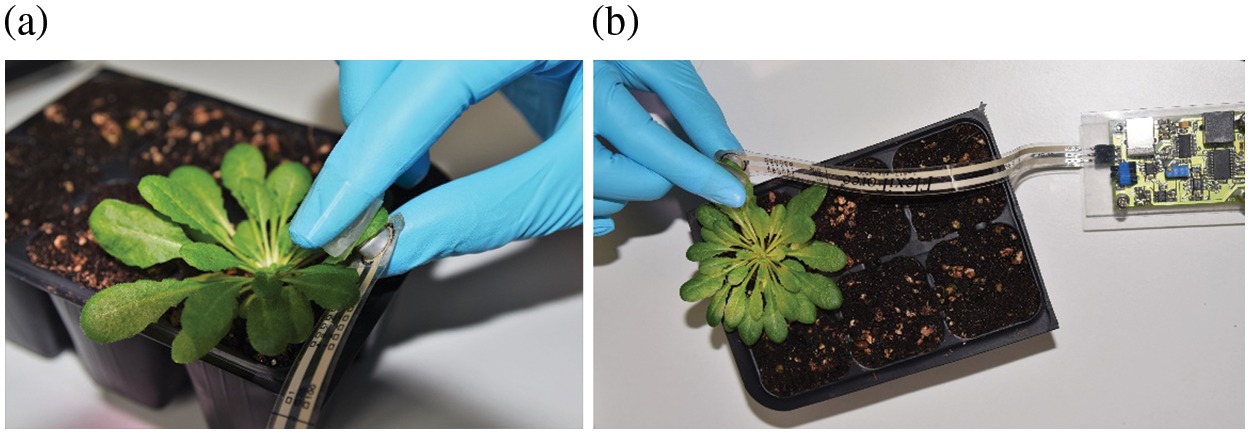
Figure 1: Exposure of A. thaliana leaves to mechanical stimuli: a force of 5 N was applied to a leaf area of approximately 1.0 cm2 (a pressure of approximately 50 kPa) for 20 s. Plant leaves were pressed on both sides of the leaf blade (a); for the application of mechanical stimulation a Force sensor FlexiForce, model A201, Tekscan was used (b)
Three groups of plants (with 5 to 6 plants per group) were used for the experiments: (1) control plants that were not subjected to mechanical stimulation, (2) plants subjected to mechanical stimulation from which stimulated leaves were sampled 1 h after stimulation, and (3) plants subjected to mechanical stimulation from which stimulated and unstimulated leaves were sampled 20 h after stimulation.
After collection, leaves were prepared for analysis. Selected parameters analysed in this work were the H2O2 content, the degree of lipid peroxidation measured as MDA content, the activity of antioxidant enzymes (CAT, G-POD and SOD), the content of total phenolics, the phenolic oxidation rate (POR), the activity of PSII and the content of photosynthetic pigments.
The amount of H2O2 was determined according to the method of Alexieva et al. [73]. Approximately 100 mg of fresh leaf tissue was homogenized in 1.0 mL of ice-cold 0.1% (w/v) trichloroacetic acid (TCA). The extract was centrifuged at 12,000 × g for 15 min at 4°C. For spectrophotometric measurement, 500 μL of supernatant, 500 μL of 10 mM potassium phosphate buffer (pH 7.0), and 1 mL of 1 M potassium iodide (KI) were added to the quartz cuvette, and the absorbance of the mixture was read at 390 nm. The H2O2 content was calculated using a standard curve and the results were expressed as ng H2O2 per mg of fresh tissue.
2.4 Determination of Lipid Peroxidation Level
The level of lipid peroxidation was expressed as the amount of MDA, a product of lipid peroxidation, according to the modified method of Heath and Packer [74]. Approximately 100 mg of fresh leaf tissue was homogenized in 1,300 μL of 0.25% (w/v) 2-thiobarbituric acid (TBA) in 10% (w/v) TCA. Samples were incubated at 90°C for 30 min, cooled on ice, and centrifuged at 15,000 × g for 10 min at 4°C. The absorbance of the supernatant was measured at 532 nm and corrected for non-specific turbidity by subtracting the absorbance at 600 nm. The degree of lipid peroxidation was calculated using an extinction coefficient of 155 mM−1 cm−1 and expressed as nmol MDA per gram of fresh tissue.
2.5 Protein Extraction and Measurement of Enzyme Activity
Leaf tissue (approximately 100 mg fresh weight) was homogenized in 1.5 mL of ice-cold 100 mM potassium phosphate buffer (pH 7.0) containing 0.1 mM ethylenediaminetetraacetic acid (EDTA) and 3% (w/v) polyvinylpolypyrrolidone (PVPP). Samples were centrifuged at 20,000 × g for 30 min at 4°C. The supernatants were used for spectrophotometric determination of proteins, measurement of SOD, CAT, G-POD activity and POR. Soluble protein content in the extracts was determined according to Bradford [75] using bovine serum albumin as a protein standard.
SOD (EC 1.15.1.1) activity was estimated as inhibition of nitroblue tetrazolium (NBT) reduction according to the method of Beauchamp et al. [76]. The content of superoxide anions converting NBT to a formazan dye was decreased by the activity of SOD in the experimental sample. The enzymatic system xanthine-xanthine oxidase was used to generate superoxide radicals. The rate of formazan formation was measured spectrophotometrically at 560 nm. The standard curve was obtained from linearized absorbance data plotted against SOD concentration using bovine SOD as standard. The SOD activity unit (1 U) was defined as the amount of enzyme that causes 50% inhibition of NBT reduction. Results were expressed in units per mg of protein.
CAT (EC 1.11.1.6) activity was determined according to the method of Aebi [77], which is based on the rate of H2O2 consumption, and measuring the decrease in absorbance at 240 nm. Catalase activity was calculated using an extinction coefficient of 40 mM−1 cm−1 and expressed in nmol H2O2 per min and mg of protein.
G-POD (EC 1.11.1.7) activity was measured as an increase in absorbance at 470 nm as a result of the H2O2-dependent oxidation of guaiacol to tetraguaiacol, according to Chance et al. [78]. The extinction coefficient used for the calculation was 26.6 mM−1 cm−1 and the results were expressed as nmol of tetraguaiacol per minute and mg of protein.
POR was monitored according to the method of Escalante-Minakata et al. [79] with slight modifications. The reaction mixture consisted of 200 μL protein extract and 800 μL 0.1 mM potassium phosphate buffer (pH 7.0) containing 0.5 mM EDTA and 50 mM catechol. Oxidation of catechol was recorded as the increase in absorbance at 420 nm and expressed as the change in absorbance (ΔA420) per minute per mg of protein.
2.6 Determination of Total Phenolic Content
The concentration of total phenolic compounds was determined according to the method of Humadi et al. [80] with slight modifications. Lyophilized leaf tissue (approximately 10 mg) was homogenized in 1.0 mL of ice-cold 80% (v/v) methanol. Samples were incubated in a water bath at 65°C for 45 min and then centrifuged at 15,000 × g for 10 min at 4°C. The reaction mixture consisted of 1,550 μL dH2O, 50 μL of the extract, and 100 μL of the Folin-Ciocalteu reagent. After the addition of 300 μL of 1.88 M sodium carbonate (Na2CO3), the samples were incubated at 45°C for 30 min. The absorbance was measured at 765 nm and compared with the standard curve obtained with solutions of gallic acid. The total phenolic content of the samples was expressed as µg gallic acid equivalents per g of dry tissue.
2.7 In Vivo Measurement of Chlorophyll Fluorescence
In vivo chlorophyll fluorescence was measured by the saturation pulse method [81] using the Chlorophyll Fluorescence Package (Quibit System Inc., Canada). Prior to measurement, plants were adapted to darkness for 30 min. After recording a fluorescence minimum (F0) using a weak red light (<5 µmol m−2 s−1), a short duration pulse of high intensity (~5,000 µmol m−2 s−1) was applied to induce the maximum fluorescence (Fm). After quenching of Fm in darkness, leaves were illuminated with continuous actinic light (intensity ∼150 µmol m−2 s−1), and saturation pulses were applied at 20-s intervals. Actinic irradiation was maintained until the values of maximum fluorescence (F′m) and steady-state fluorescence (Ft) became stable. At the end of the experiment (after the actinic light was turned off), the minimum fluorescence value (F′0) was measured under red illumination. The parameters measured during the experiment (F0, Fm, Ft, F′m, F′0) were used to calculate the maximum quantum yield of PSII (Fv/Fm), the effective quantum yield of PSII (ΦPSII), photochemical quenching (qP), and non-photochemical quenching (NPQ).
2.8 Measurement of Photosynthetic Pigments Content
Lyophilized and powdered leaf tissue (~30 mg) was homogenised in 1.5 mL of ice-cold 95% (v/v) acetone with the addition of ~50 mg calcium carbonate (CaCO3). After centrifugation at 5,000 × g for 10 min at 4°C, the supernatant was stored on ice while the remaining pellet was resuspended in acetone and centrifuged again. The supernatants from both cycles were combined and filled up to a constant volume with acetone. The absorbance of the extracts was measured spectrophotometrically (Specord 40, Analytik Jena) at 470, 646, and 663 nm. The content of photosynthetic pigments (Chl a, Chl b, and Cars) was calculated according to Wellburn [82] and expressed as µg of pigment per mg of dry tissue.
Data presented are means of five to six independent biological replicates ± standard error (SE). The values obtained were tested for the assumptions of normality and homogeneity of variance. To detect significant differences between groups (p ≤ 0.05), Kruskal-Wallis test, followed by Dunn’s test for non-parametric comparisons was performed. Statistical analysis was performed using the Statistica 13 software package (TIBCO Software Inc.).
Principal component analysis (PCA) was based on data from replicates for four sample groups– untreated leaves from control plants (C), stimulated leaves sampled 1 h after the treatment (1 h), stimulated leaves sampled 20 h after the treatment (20 h), and unstimulated leaves sampled from treated plants 20 h after the treatment (SR 20 h); and 15 variables–activity of three antioxidant enzymes (CAT, SOD, G-POD), POR and phenolic content (PC), H2O2 and MDA content, as well as fluorescence parameters (Fv/Fm, ΦPSII, qP, NPQ), pigment content (Chl a, Chl b, Cars) and the ratio of chlorophyll a to chlorophyll b (Chl a/Chl b). PCA analysis was performed using R 3.6.2. software and the “factoextra” package.
To assess the effects of mechanical stimuli on plant metabolism, leaf blades were subjected to a moderate force of 5 N for 20 s. The applied force did not cause visible damage such as chlorosis or necrosis of the stimulated leaves. After treatment, a series of biochemical and physiological parameters have been examined.
3.1 H2O2 Content and Lipid Peroxidation
Mechanical stimulation triggers H2O2 production and lipid peroxidation in A. thaliana leaves. Considering H2O2 content, there was no significant difference in H2O2 content between control (untreated) and treated plants. However, H2O2 content in stimulated leaves sampled 20 h after treatment was significantly increased compared to the content measured 1 h after stimulation (Fig. 2a).
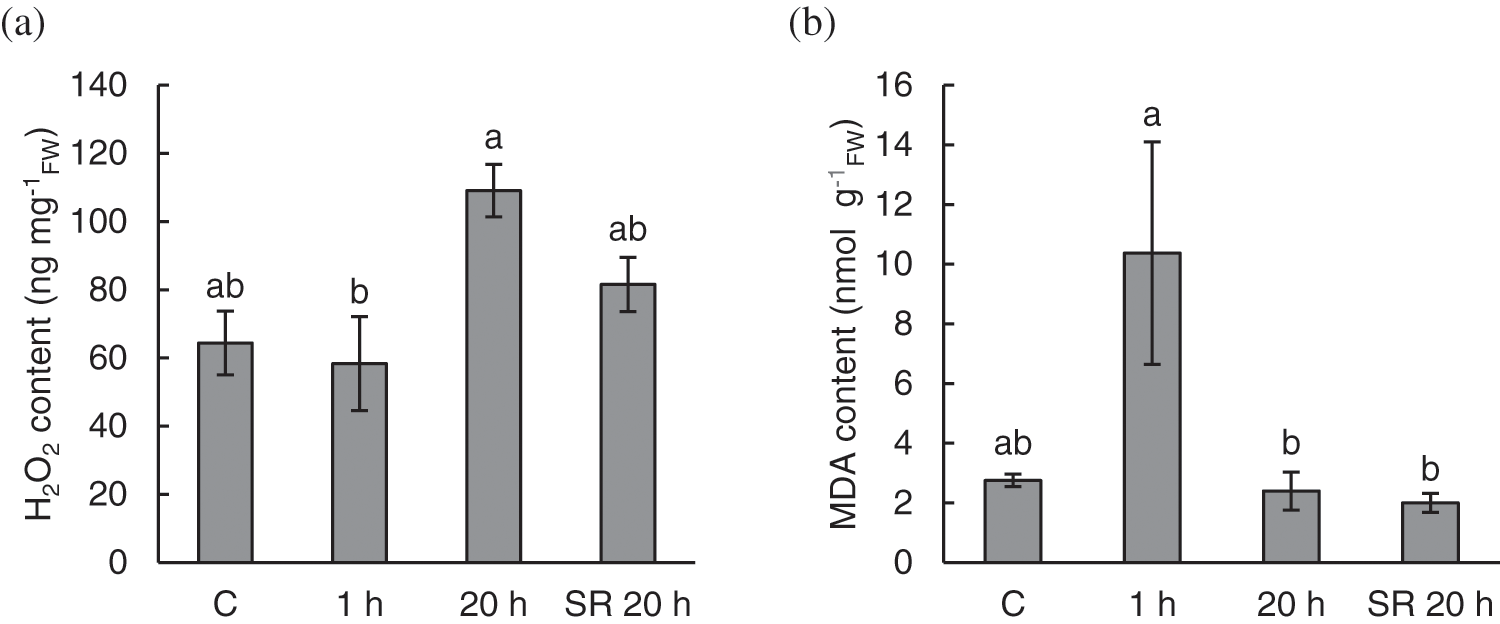
Figure 2: Hydrogen peroxide (H2O2) content (a) and level of lipid peroxidation, expressed as malondialdehyde (MDA) content (b) in A. thaliana exposed to mechanical stimulation (5 N, 20 s). Results are mean values of six biological replicates ± standard error. Different letters above the error bars represent significant differences (p ≤ 0.05), based on Dunn’s test
Note: C–control (untreated) plants; 1 h–leaves 1 h after mechanical stimulation; 20 h–leaves 20 h after mechanical stimulation; SR 20 h–unstimulated leaves (from treated plants) 20 h after mechanical stimulation.
The level of lipid peroxidation, expressed as MDA content, increased in leaf tissue 1 h after mechanical stimulation. Upon recovery, 20 h after the treatment, stimulated and unstimulated leaves showed similar levels of lipid peroxidation as the leaves of the control (untreated) plants (Fig. 2b).
Mechanical stimulation induced activity of antioxidant enzymes and POR. The activity of the antioxidant enzymes SOD, CAT, G-POD and POR showed a similar pattern in response to mechanical stimulation (Fig. 3). Enzyme activity was low in the control (untreated) plants. After mechanical stimulation, the activity of SOD and CAT almost doubled 1 h after the treatment and remained at the same level 20 h after the treatment (Figs. 3a and 3b). The activity of G-POD and POR gradually increased after mechanical stimulation (Figs. 3c and 3d). However, for CAT and G-POD the differences between the studied plant groups were not statistically significant (Figs. 3b and 3c).
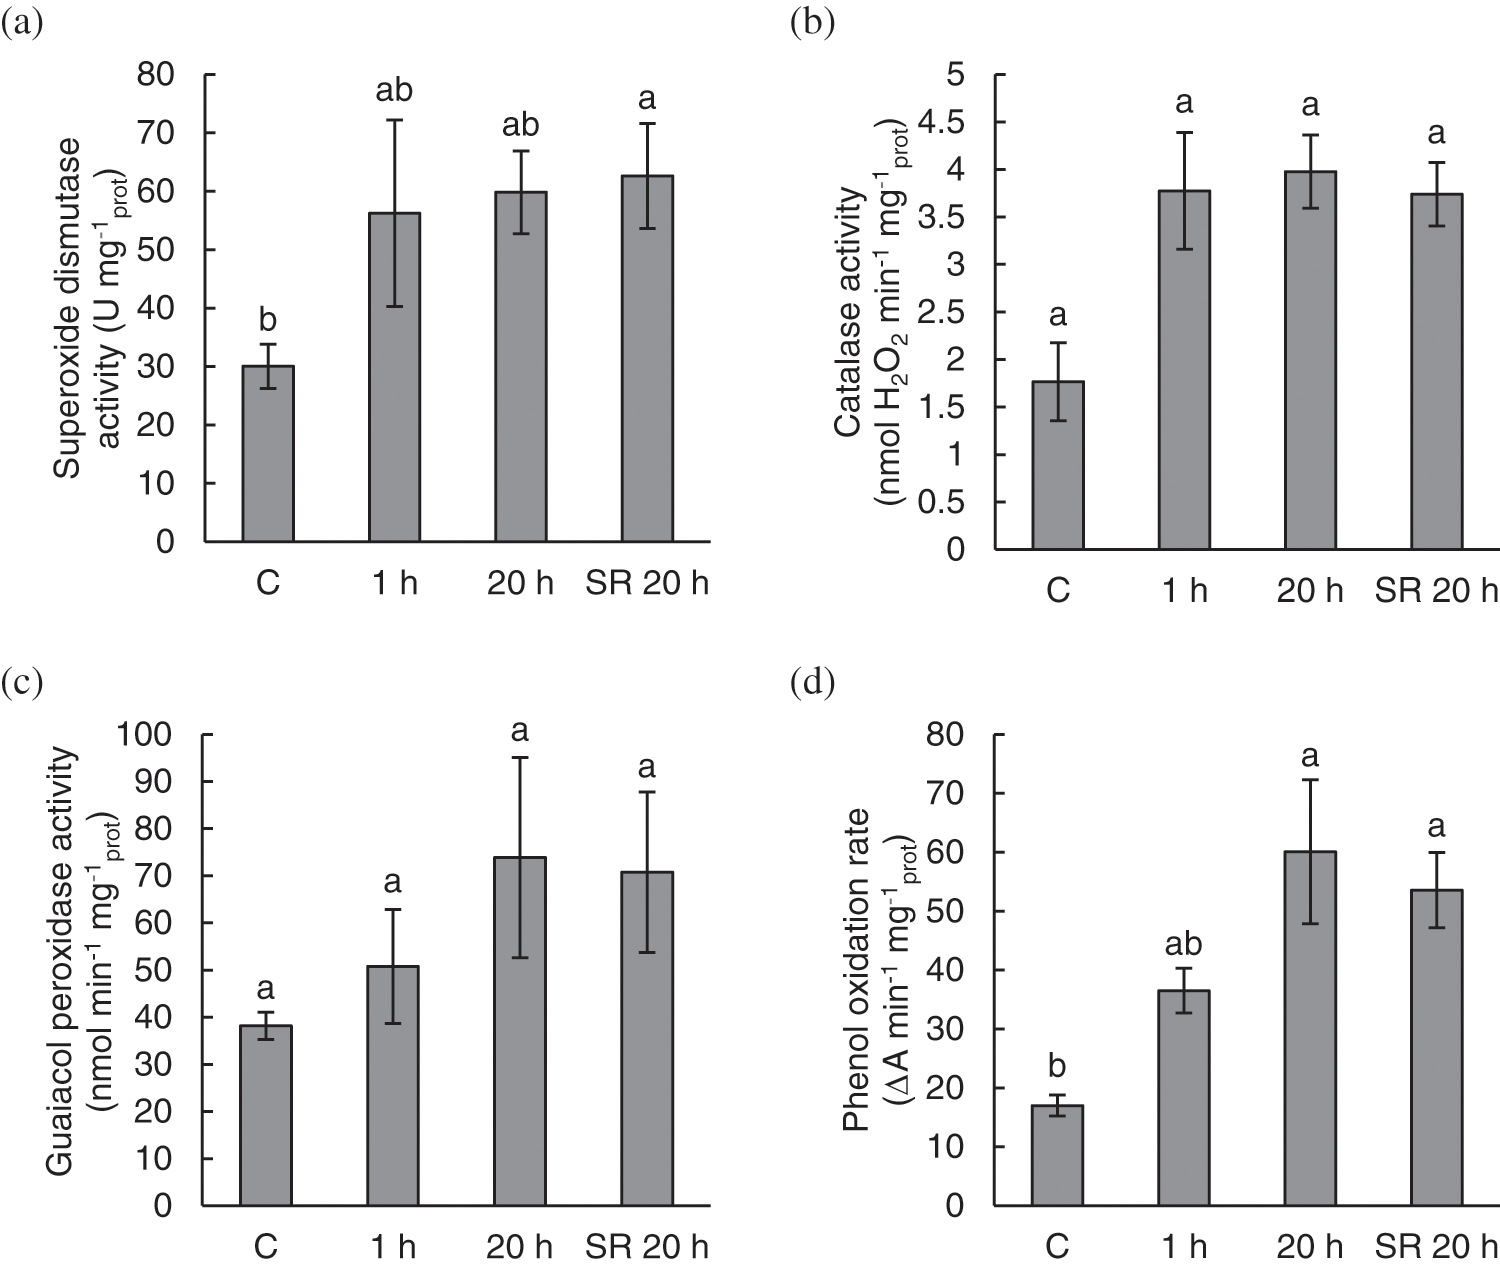
Figure 3: The activity of superoxide dismutase (SOD) (a); catalase (CAT) (b); guaiacol peroxidase (G-POD) (c); and phenol oxidation rate (POR) (d) in A. thaliana exposed to mechanical stimulation (5 N, 20 s). Results are mean values of five to six biological replicates ± standard error. Different letters above the error bars represent significant differences (p ≤ 0.05), based on Dunn’s test
Note: C–control (untreated) plants; 1 h–leaves 1 h after mechanical stimulation; 20 h–leaves 20 h after mechanical stimulation; SR 20 h–unstimulated leaves (from treated plants) 20 h after mechanical stimulation.
Compared with control leaves, unstimulated leaves analysed for systemic response (SR 20 h) showed a significant increase in the activity of SOD. Similarly, the activity of POR in leaves analysed 20 h after stimulation was significantly increased in both groups of samples–stimulated leaves (20 h) and unstimulated leaves analysed for systemic response (SR 20 h), compared with the control leaves (Figs. 3a–3d).
There was no effect of mechanical stimulation on phenolic content. Only slightly lower phenolic content was observed in both stimulated and unstimulated leaves of treated plants in tissue collected 20 h after mechanical stimulation (SR 20 h). The observed differences were not statistically significant (Fig. 4).
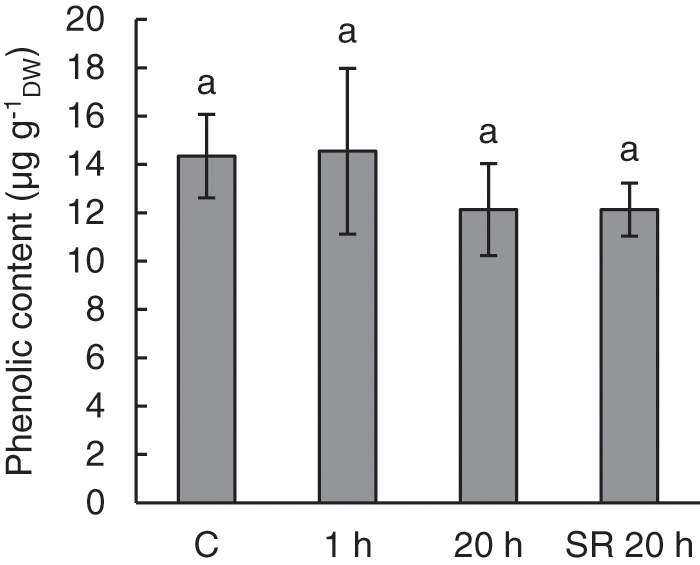
Figure 4: Phenolic content in leaves of A. thaliana exposed to mechanical stimulation (5 N, 20 s). Results are mean values of five to six biological replicates ± standard error. The same letters above the error bars indicate no significant differences between treatment groups (p ≤ 0.05), based on Dunn’s test
Note: C–control (untreated) plants; 1 h–leaves 1 h after mechanical stimulation; 20 h–leaves 20 h after mechanical stimulation; SR 20 h–unstimulated leaves (from treated plants) 20 h after mechanical stimulation.
3.4 Chlorophyll Fluorescence and Photosynthetic Pigment Content
In general, there was no prominent influence of mechanical stimulation on most chlorophyll fluorescence parameters and pigment content. The calculated parameters of chlorophyll fluorescence–Fv/Fm and qP–were not significantly different between leaves subjected to mechanical stimulation and those of control plants (Figs. 5a and 5c). However, qP was significantly lower in unstimulated leaves sampled from treated plants 20 h after exposure to the stimuli. ΦPSII was significantly lower in stimulated leaves sampled for measurement 20 h after mechanical stimulation (Fig. 5b). NPQ was significantly lower 1 h after the treatment (Fig. 5d) compared with all other groups of samples.
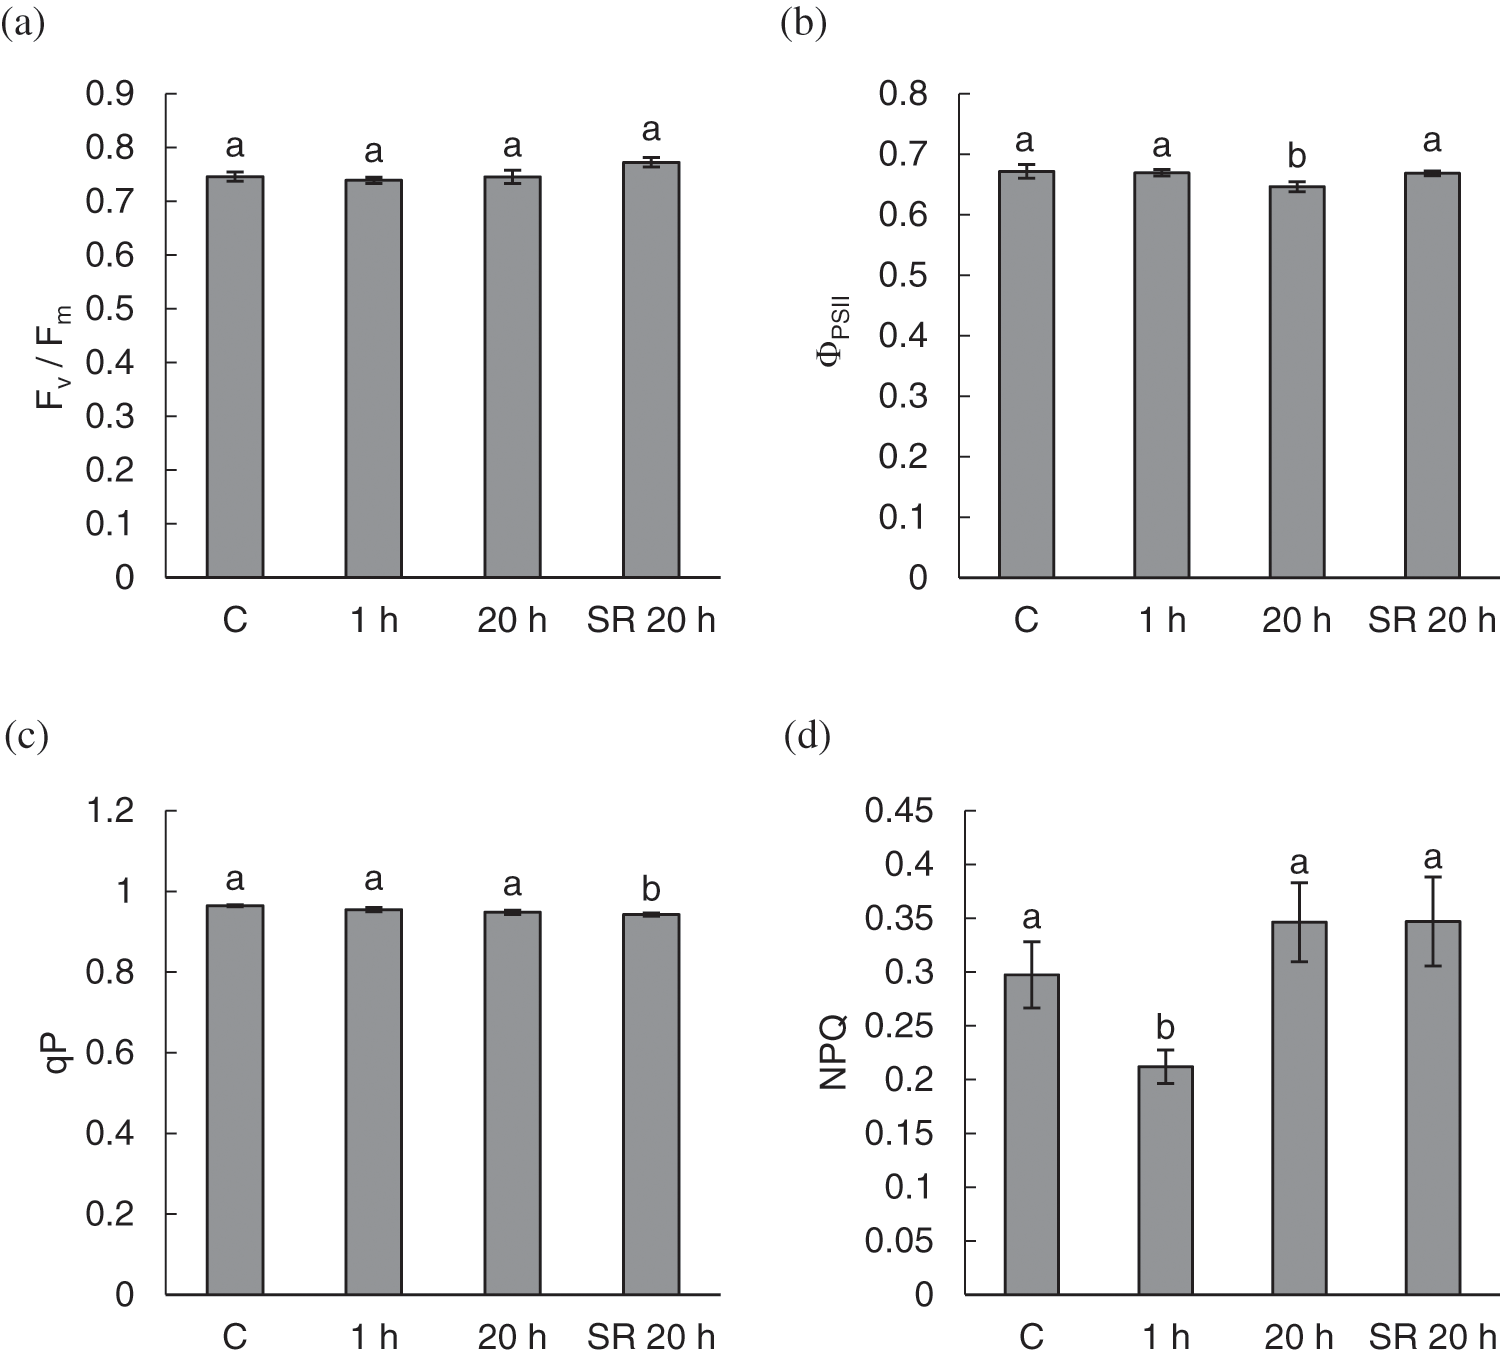
Figure 5: Chlorophyll fluorescence parameters–maximum quantum yield of photosystem II (Fv/Fm) (a); effective quantum yield of photosystem II (ΦPSII) (b); photochemical quenching (qP) (c) and non-photochemical quenching (NPQ) (d) in leaves of A. thaliana exposed to mechanical stimulation (5 N, 20 s). Results are mean values of six biological replicates ± standard error. Different letters above the error bars represent significant differences (p ≤ 0.05), based on Dunn’s test
Note: C–control (untreated) plants; 1 h–leaves 1 h after mechanical stimulation; 20 h–leaves 20 h after mechanical stimulation; SR 20 h–unstimulated leaves (from treated plants) 20 h after mechanical stimulation.
Although there were some perturbations in photosynthetic performance indicated by the parameters ΦPSII, qP, and NPQ, mechanical stimulation did not significantly alter Chl a, Chl b, and total Cars in leaves (Fig. 6). In addition, the Chl a/Chl b ratio, which is a common marker of stress, did not differ significantly between stimulated and unstimulated leaves. The calculated values ranged from 1.82 to 2.30.
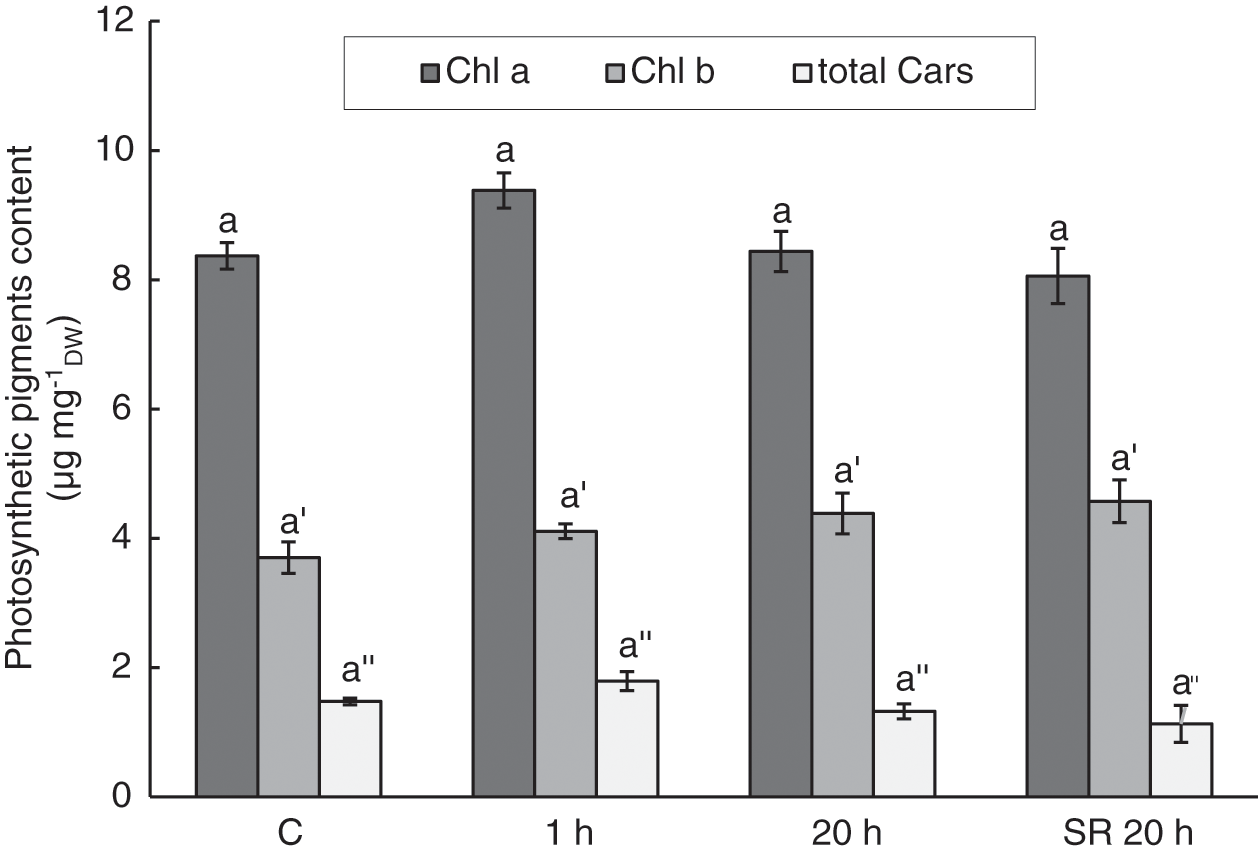
Figure 6: Chlorophyll a, chlorophyll b, and total carotenoids in A. thaliana leaves subjected to mechanical stimulation (5 N, 20 s). Results are mean values of six biological replicates ± standard error. The same letters above the error bars indicate no significant differences in chlorophyll a (Chl a), chlorophyll b (Chl b) or total carotenoids (total Cars) content between treatment groups (p ≤ 0.05), based on Dunn’s test
Note: C–control (untreated) plants; 1 h–leaves 1 h after mechanical stimulation; 20 h–leaves 20 h after mechanical stimulation; SR 20 h–unstimulated leaves (from treated plants) 20 h after mechanical stimulation.
The main purpose of PCA analysis was to analyse the time dependence of plant response to mechanical stimulation and the difference between the response of stimulated leaves and the systemic response of unstimulated leaves.
The first step was to determine how many principal components to evaluate. The first two PCA dimensions (PCA1 and PCA2) explained 72.73% of the total variance. PCA3 explained another 10.97% of the variance, but was excluded from further analysis because it did not provide additional information. The discrimination performed with PCA analysis (Fig. 7) showed the differences in plant response to mechanical stimulation as a function of time elapsed after stimulus application. Principal component PCA1 revealed two groups–control (untreated) plants and plants analysed 1 h after the application of the mechanical stimuli, which were characterised by strong negative loadings of Chl a/Chl b ratio, Cars and MDA content, whereas plants analysed 20 h after the stimuli were characterised by strong positive loadings of SOD, G-POD, and POR activity. In addition, the principal component PCA2 distinguished control plants from plants analysed 1 h after the application of the mechanical stimuli based on the moderate positive loadings of photosynthetic parameters (Fv/Fm, qP) and the strong negative loadings of MDA and Chl a content.
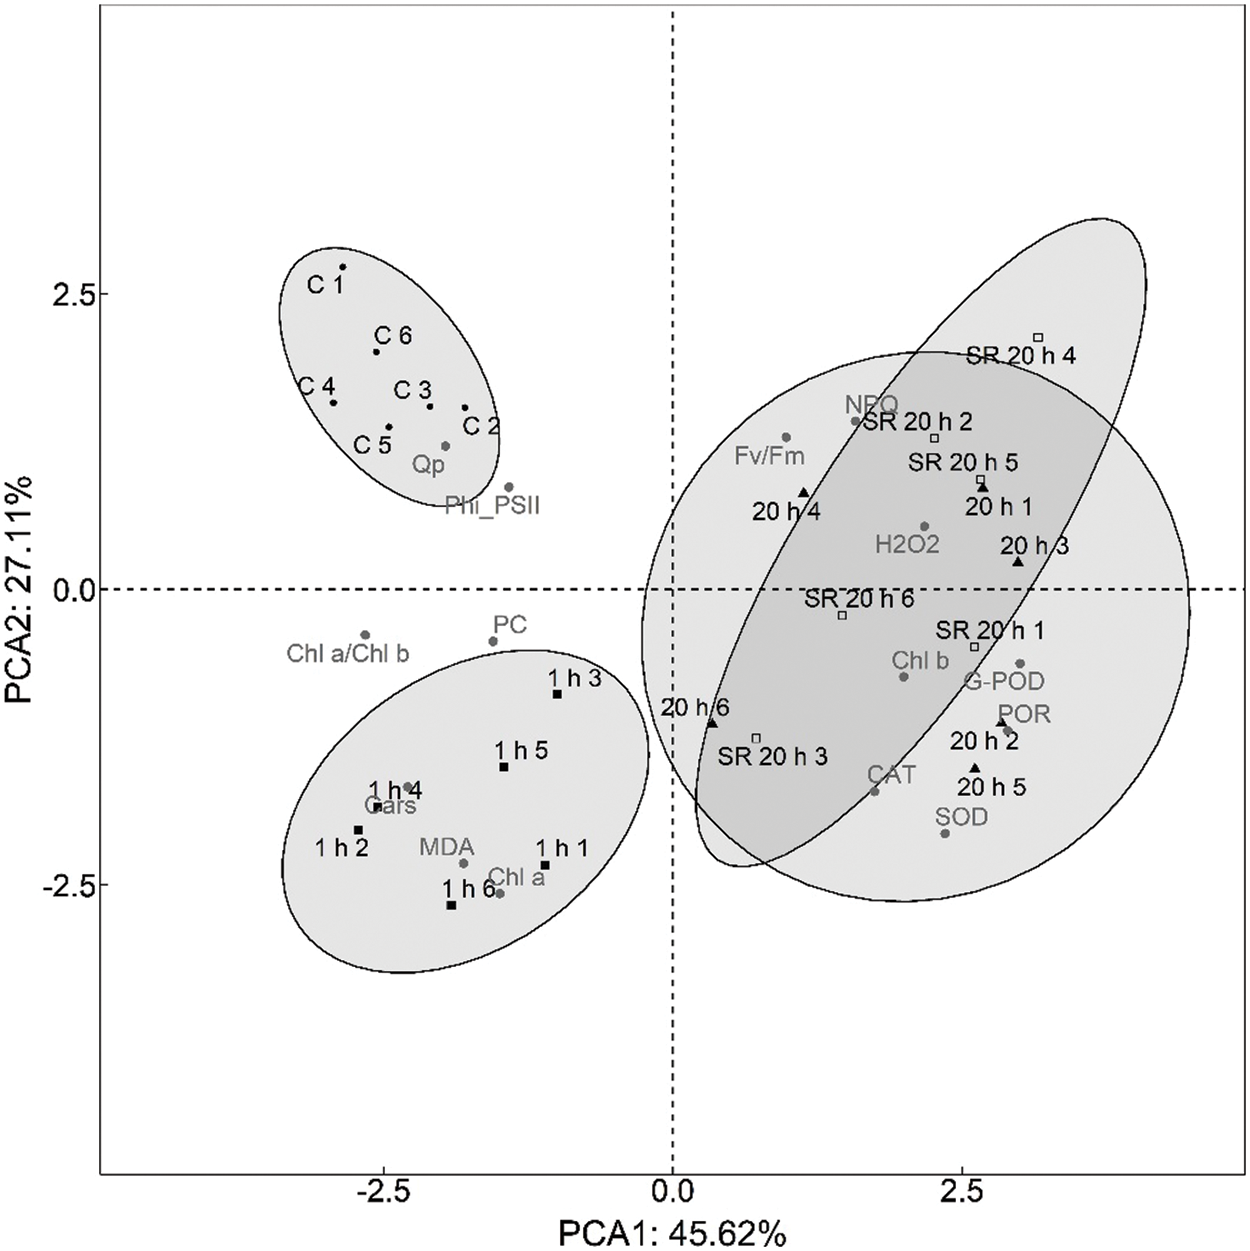
Figure 7: Principal component analysis biplot showing relationship between 15 measured parameters and treatment groups (C, 1 h, 20 h and SR 20 h)
Abbreviations for treatment groups: C–control (untreated) plants; 1 h–leaves 1 h after mechanical stimulation; 20 h–leaves 20 h after mechanical stimulation; SR 20 h–unstimulated leaves (from treated plants) 20 h after mechanical stimulation. Numbers 1–6 represent biological replicates.
In this study, a moderate mechanical force of 5 N was applied to A. thaliana leaf blades for a duration of 20 s. The strength and duration of the stimuli did not cause immediate or permanent damage of the treated leaves or premature tissue senescence.
The application of mechanical force is expected to cause certain changes in the treated tissue, such as the disruption of the interactions between the cell wall, plasma membrane, and cytoskeleton, resulting in the transfer of information to the interior of the cell [7,19]. Like other stress factors, mechanical stimulation also leads to production of ROS [7,39]. Due to their dual function, ROS can oxidise cellular components and disrupt their function, but they also serve as a signal to activate protective mechanisms, including cell wall strengthening [38,83]. In our study, H2O2 content was similar in the leaves of control (untreated) plants and leaves sampled 1 h after mechanical stimulation, but there was a significant difference in the amount of H2O2 between leaves sampled 1 and 20 h after mechanical stimulation. According to the literature, increased levels of ROS are expected shortly after stimulation as a result of the oxidative burst that occurs immediately after stress exposure [39]. Furthermore, Benikhlef et al. [22] investigated the induction of resistance to the fungus Botrytis cinerea by treating A. thaliana with gentle mechanical stimulation in the form of soft sweeping of leaf surfaces. Immediately after stimulation, a rapid burst of ROS was detected in leaf tissue. In addition, Depège et al. [84] noted increased H2O2 content in tomato internodes a few minutes after mechanical stimulation, but this decreased slowly over the following hours. In our experiment, stimulated leaves showed significantly increased H2O2 content 20 h after mechanical stimulation compared with the value 1 h after stimulation. This observation could be explained by the involvement of H2O2 in mechanisms such as signal transduction and cell wall repair through cross-linking of protein components and lignification [84]. Moreover, it is also consistent with previously published data on biphasic ROS production, where a primary phase is expected within minutes following the exposure to stress and a secondary phase within hours or days [39]. In our work, increased H2O2 content observed 20 h after the treatment might be due to its signalling function, as it is known that H2O2 has remarkable stability and is involved in signal transduction [85,86]. In addition, the increased rate of direct formation of H2O2 under stress conditions in various biochemical reactions and its relative stability in biological systems compared with its common precursor, the superoxide radical [87], may also contribute to its increased level 20 h after the treatment.
Increased MDA content indicates lipid peroxidation of cell membranes caused by environmental stress in plants [45]. In our experiment, a remarkable increase in lipid peroxidation level was confirmed in leaves sampled 1 h after mechanical stimulation. The oxidative damage of membrane lipids could be induced by ROS that accumulates after abiotic stress, including mechanical stimulation [7]. Since H2O2 may be involved in the production of MDA as one of the elements of ROS [41,88,89], increased H2O2 content could be expected in leaves with increased MDA, that is 1 h after stimulation. On the contrary, the amount of H2O2 was similar to that in control plants, as mentioned previously. A possible explanation for this observation is the increased activity of CAT, an antioxidant enzyme that scavenges H2O2. Considering the MDA level 20 h after stimulation, it was found that it returned to the control level. This could be explained by the trend of increased activity of antioxidant enzymes, suggesting that cells had sufficient capacity to limit the production of ROS and prevent further oxidative damage. Data on the increased level of lipid peroxidation induced by mechanical stress have been described in studies by other authors. Prasad et al. [29] detected products of lipid peroxidation in a short time after mechanical injury in leaves of A. thaliana using confocal laser scanning microscopy. Reis et al. [17] demonstrated the increased level of lipid peroxidation in Theobroma cacao plants subjected to mechanical stress caused by wind.
Compared to leaves of control plants, unstimulated leaves of plants subjected to mechanical stimulation showed a significant increase in SOD activity 20 h after the treatment. The activities of other two antioxidant enzymes, CAT and G-POD, slightly increased in both stimulated and unstimulated leaves of plants exposed to stress. Increased peroxidase activity after mechanical stimulation is well known and has been described by other authors. For example, Saidi et al. [68,69] described the induction of soluble peroxidases in internodes of young tomato plants 24 h after gentle rubbing. The reduced elongation of rubbed internodes observed in these studies was explained by a stiffening of the cell wall in which peroxidases were involved. A number of studies indicated the induction of peroxidases by different stress conditions, such as wounding and limited water availability, and their involvement in cell wall modifications including the synthesis and deposition of phenolics and the cross-linking of cell wall components using H2O2 as a co-substrate [90].
Activation of peroxidases and some enzymes of the phenylpropanoid pathway, which is the starting point for biosynthesis of lignin precursors and other phenolic compounds, has been reported as one of the most universal biochemical responses to environmental stress, including mechanical stimulation [19,91]. Since phenolic compounds play multiple and diverse roles in plant stress responses, i.e., structural components of the cell wall, regulation of growth and development, defence responses to abiotic and biotic stresses [55], we considered them as a possible biochemical marker of applied mechanical stimulation, and therefore, total phenolic content was also measured in this study. However, in this work, no changes in the amount of total phenolics were detected in the treated plants compared to the control and no differences were detected between the treatment groups.
Since PPOs, which are nearly ubiquitous enzymes in plants involved in many metabolic reactions including response to stress, have not been identified in the genus Arabidopsis [57,92], it appears that their role is compensated by laccases and peroxidases [58]. These two enzymes oxidise phenolic compounds [93], and as such may play a role in cell wall stiffening. We recorded a significant increase of POR in both stimulated and unstimulated leaves of treated plants 20 h after mechanical treatment. Compared to the control group, these samples had more than three times higher level of POR. This suggests that phenolics oxidation may play an important role in the systemic response of plants. Therefore, POR might be involved in the cell wall changes induced by mechanical stress. Interestingly, although a change of POR was observed in both stimulated and unstimulated leaves of treated plants 20 h after treatment, no difference in phenolic content was observed. These results could be explained by the increased accumulation of reducing interfering compounds during and after mechanical stimulation, such as ascorbic acid and reducing sugars, which in turn inaccurately affect the estimation of total phenolics [94]. Indeed, the study by Šic Žlabur et al. [13] showed that mechanical stimulation in the form of brushing induced a significant accumulation of ascorbic acid in leaves of lettuce and green chicory. Since the content of specific phenolic compounds can vary under different environmental conditions [53], data on the role of specific phenolic compounds are an interesting topic for future research on the response of plants to mechanical stimuli.
To assess the effects of mechanical stimulation on plant primary metabolism, photosynthetic performance of stimulated leaves of A. thaliana was evaluated using chlorophyll fluorescence analysis. Using several parameters, this method provides information on the status of PSII, which is indicative of the overall rate of photosynthesis [81]. The parameter Fv/Fm is a measure of the maximum efficiency of PSII. According to Lichtenthaler et al. [95], the normal value of this ratio is 0.74–0.85. In our experiment, the values ranged from 0.74 to 0.77, with no significant difference between control and stimulated leaves. ΦPSII refers to the efficiency of PSII achieved and indicates the proportion of light absorbed by chlorophyll associated with PSII used in photochemistry [81]. ΦPSII was decreased in stimulated leaves 20 h after the treatment, which may indicate some proportion of inactive PSII reaction centres. Elevated H2O2 content measured in these leaves at the same time point could possibly have resulted in damage to the components of the photosynthetic apparatus and lowered PSII efficiency. Photochemical quenching, qP, indicates the fraction of PSII reaction centres that are open, i.e., able to accept electrons, and a change in qP is due to the closure of reaction centres as a result of the saturation of photochemical reactions by light [81]. In our experiment, qP was decreased in unstimulated leaves 20 h after treatment. Although fluctuations in chlorophyll fluorescence often indicate changes in photosynthetic activity, Baker et al. [62] suggested that many metabolic reactions in leaves that are not directly involved in the photosynthetic process can affect the rate of synthesis of intermediates for photosynthetic reactions and thus indirectly affect photosynthesis and chlorophyll fluorescence parameters. Such perturbations of metabolism could be expected during the induction of a response to stress, including mechanical stimulation. Another quenching parameter, NPQ, involves photoprotective processes that remove excess excitation energy from chlorophyll-containing complexes and prevent the formation of harmful free radicals [96]. An increase in NPQ, as a measure of the efficiency of heat dissipation, occurs either as a result of processes that protect the leaf from light-induced damage or as a result of the damage itself [81]. Because the plants in our experiment were not exposed to high light intensity, the value of NPQ was generally low, but compared with control plants, leaves exposed to mechanical stimulation showed reduced NPQ 1 h after the treatment. This is consistent with the higher lipid peroxidation level measured in the leaves at this time point, which could be a possible reason for the disrupted NPQ mechanism.
Oxidative stress in leaf tissue, detected 1 h after the treatment as increased lipid peroxidation and 20 h after the treatment as increased H2O2 content, did not result in the degradation of photosynthetic pigments. The levels of Chl a, Chl b, and total Cars were not affected by gentle mechanical stimuli. Even the Chl a/Chl b ratio, commonly used as an indicator of stress [63], was not altered. Cars are pigments that, in addition to their role in photosynthesis, could contribute to oxidative stress defence mechanisms [38]. In addition to tocopherol, they could contribute to membrane protection against ROS [97], which could cause lipid peroxidation. Therefore, the induction of higher levels of Cars was expected to be due to increased lipid peroxidation and H2O2 content. However, the lack of a significant change in Cars content may indicate that protection by Cars was not a part of the response to oxidative stress caused by mild mechanical stimulation. Our results are in agreement with a study by Šic Žlabur et al. [13], in which mechanical stimulation by brushing had no significant effect on the content of pigments, including Chl a, Chl b, and Cars.
Principal component analysis (PCA) was performed to determine if there was a time dependence of plant response to mechanical stress and to reveal the difference between the response of stimulated leaves and the systemic response of unstimulated leaves of plants exposed to mechanical stress. PCA analysis revealed three groups–the first consisted of leaves from unstimulated plants (control), the second consisted of leaves sampled 1 h after the treatment, while the third group included both stimulated and unstimulated leaves from plants exposed to the mechanical force and sampled and analysed 20 h after the treatment. The results obtained indicate a time dependence of plant response to the applied treatment. In addition, the observation that stimulated and unstimulated leaves of treated plants sampled 20 h after mechanical stimulation were grouped together may indicate signal transduction from stimulated to unstimulated leaves, that is, a systemic response in distant leaves. These results are consistent with current knowledge of local and systemic responses to other types of abiotic stresses that have been studied to date. For example, Miller et al. [83] reported a rapid systemic signal associated with the accumulation of ROS in the extracellular space that spread at a rate of 8.4 centimetres per minute in A. thaliana exposed to various abiotic stress factors. In the extensive review, Baxter et al. [39] reported the contribution of H2O2 in cell-to-cell signal propagation, that is, its accumulation in extracellular spaces and generation of a “ROS wave” in systemic signalling. They also reported studies of responses to three types of abiotic stress (high light, heat, and cold) that elicited similar responses in local and systemic tissues.
Our study suggests that moderate mechanical stimulation is perceived by plants but does not induce prominent changes in plant metabolism and photosynthetic performance. The applied treatment resulted in a transient increase in the amount of H2O2 and level of lipid peroxidation, as well as an increase in SOD and POR. The activity of PSII was slightly affected, but there were no noticeable effects on photosynthetic pigments. PCA analysis separated three groups–1) leaves of control (untreated) plants, 2) stimulated leaves sampled 1 h after the treatment, and 3) stimulated and unstimulated leaves of treated plants 20 h after the treatment, which may indicate signal transduction from stimulated to unstimulated leaves, that is, a systemic response to a local application of mechanical stimuli in distant leaves. These results could be of particular interest in the context of applying moderate mechanical stimuli to prime and improve plant growth and yield under other adverse environmental conditions. However, more detailed physiological, biochemical, and molecular analyses are needed to identify and characterise pathways that may be part of the local and systemic plant response to mechanical stimuli, especially in agronomically important plant species.
Acknowledgement: Authors thank Professor Mirta Tkalec for helpful suggestions in the course of this work.
Authorship: Idea of the work: I. Š., K. K.; experimental work, analysis and interpretation of data, contribution to the conception of the work: I. Š., K. K., S. V.; initial experiments and conceptual design: Ž. V-C., N. B.; measurement system design and calibration: E. F., M. C.; draft preparation: I. Š., K. K., Ž. V-C. All authors have read, revised and approved the final version of the manuscript.
Funding Statement: This work was supported by the University of Zagreb Research Grant.
Conflicts of Interest: The authors declare that they have no conflicts of interest to report regarding the present study.
References
1. Bhatla, S. C. (2018). Abiotic stress. In: Bhatla, S. C., Lal, M. A. (Eds.Plant physiology, development and metabolism, pp. 969–1028. Singapore: Springer. DOI 10.1007/978-981-13-2023-1. [Google Scholar] [CrossRef]
2. Taiz, L., Zeiger, E. (2010). Plant physiology. Sunderland, MA: Sinauer Associates, Inc. [Google Scholar]
3. Freeman, B., Beattie, G. (2008). An overview of plant defenses against pathogens and herbivores. The Plant Health Instructor. DOI 10.1094/PHI-I-2008-0226-01. [Google Scholar] [CrossRef]
4. Sisodia, R., Bhatla, S. C. (2018). Plant movements. In: Bhatla, S. C., Lal, M. A. (Eds.Plant physiology, development and metabolism, pp. 907–935. Singapore: Springer. DOI 10.1007/978-981-13-2023-1. [Google Scholar] [CrossRef]
5. Iida, H. (2014). Mugifumi, a beneficial farm work of adding mechanical stress by treading to wheat and barley seedlings. Frontiers in Plant Science, 5, 453. DOI 10.3389/fpls.2014.00453. [Google Scholar] [CrossRef]
6. Zhang, Z., Zhang, X., Wang, S., Xin, W., Tang, J. et al. (2013). Effect of mechanical stress on cotton growth and development. PLoS One, 8(12), e82256. DOI 10.1371/journal.pone.0082256. [Google Scholar] [CrossRef]
7. Chehab, E. W., Eich, E., Braam, J. (2009). Thigmomorphogenesis: A complex plant response to mechano-stimulation. Journal of Experimental Botany, 60(1), 43–56. DOI 10.1093/jxb/ern315. [Google Scholar] [CrossRef]
8. Braam, J. (2005). In touch: Plant responses to mechanical stimuli. New Phytologist, 165(2), 373–389. DOI 10.1111/j.1469-8137.2004.01263.x. [Google Scholar] [CrossRef]
9. Latimer, J. G. (1991). Mechanical conditioning for control of growth and quality of vegetable transplants. HortScience, 26(12), 1456–1461. DOI 10.21273/HORTSCI.26.12.1456. [Google Scholar] [CrossRef]
10. Schulze, E. D., Beck, E., Müller-Hohenstein, K. (2005). Plant ecology. Heidelberg: Springer Science & Business Media. [Google Scholar]
11. Monshausen, G. B., Haswell, E. S. (2013). A force of nature: Molecular mechanisms of mechanoperception in plants. Journal of Experimental Botany, 64(15), 4663–4680. DOI 10.1093/jxb/ert204. [Google Scholar] [CrossRef]
12. Gardiner, B., Berry, P., Moulia, B. (2016). Wind impacts on plant growth, mechanics and damage. Plant Science, 245, 94–118. DOI 10.1016/j.plantsci.2016.01.006. [Google Scholar] [CrossRef]
13. Šic Žlabur, J., Radman, S., Uher, S. F., Opačić, N., Benko, B. et al. (2021). Plant response to mechanically-induced stress: A case study on specialized metabolites of leafy vegetables. Plants, 10(12), 2650. DOI 10.3390/plants10122650. [Google Scholar] [CrossRef]
14. Paul-Victor, C., Rowe, N. (2011). Effect of mechanical perturbation on the biomechanics, primary growth and secondary tissue development of inflorescence stems of Arabidopsis thaliana. Annals of Botany, 107(2), 209–218. DOI 10.1093/aob/mcq227. [Google Scholar] [CrossRef]
15. Zhdanov, O., Blatt, M. R., Zare-Behtash, H., Busse, A. (2022). Unidirectional versus bidirectional brushing: Simulating wind influence on Arabidopsis thaliana. Quantitative Plant Biology, 3, e7. DOI 10.1017/qpb.2021.14. [Google Scholar] [CrossRef]
16. Prebeg, T., Bedran, S., Žutić, I. (2019). The effect of mechanical stress on transplants of three ornamental Asteraceae species. Journal of Central European Agriculture, 20(1), 365–375. DOI 10.5513/JCEA01/20.1.2063. [Google Scholar] [CrossRef]
17. Reis, G. S. M., Almeida, A. A. F. D., Mangabeira, P. A. O., Santos, I. C. D., Pirovani, C. P. et al. (2018). Mechanical stress caused by wind on leaves of Theobroma cacao: Photosynthetic, molecular, antioxidative and ultrastructural responses. PLoS One, 13(6), e0198274. DOI 10.1371/journal.pone.0198274. [Google Scholar] [CrossRef]
18. Kurtser, P., Alves, V. C., Arunachalam, A., Sjöberg, V., Hanell, U. (2021). Development of novel robotic platforms for mechanical stress induction, and their effects on plant morphology, elements, and metabolism. Scientific Reports, 11(1), 23876. DOI 10.1038/s41598-021-02581-9. [Google Scholar] [CrossRef]
19. Li, Z. G., Gong, M. (2011). Mechanical stimulation-induced cross-adaptation in plants: An overview. Journal of Plant Biology, 54(6), 358–364. DOI 10.1007/s12374-011-9178-3. [Google Scholar] [CrossRef]
20. Jaffe, M. J., Forbes, S. (1993). Thigmomorphogenesis: The effect of mechanical perturbation on plants. Plant Growth Regulation, 12(3), 313–324. DOI 10.1007/BF00027213. [Google Scholar] [CrossRef]
21. Tomas-Grau, R. H., Requena-Serra, F. J., Hael-Conrad, V., Martínez-Zamora, M. G., Guerrero-Molina, M. F. et al. (2018). Soft mechanical stimulation induces a defense response against Botrytis cinerea in strawberry. Plant Cell Reports, 37(2), 239–250. DOI 10.1007/s00299-017-2226-9. [Google Scholar] [CrossRef]
22. Benikhlef, L., L’Haridon, F., Abou-Mansour, E., Serrano, M., Binda, M. et al. (2013). Perception of soft mechanical stress in Arabidopsis leaves activates disease resistance. BMC Plant Biology, 13(1), 1–12. DOI 10.1186/1471-2229-13-133. [Google Scholar] [CrossRef]
23. Kollist, H., Zandalinas, S. I., Sengupta, S., Nuhkat, M., Kangasjärvi, J. et al. (2019). Rapid responses to abiotic stress: Priming the landscape for the signal transduction network. Trends in Plant Science, 24(1), 25–37. DOI 10.1016/j.tplants.2018.10.003. [Google Scholar] [CrossRef]
24. Shinozaki, K., Uemura, M., Bailey-Serres, J., Bray, E. A., Elizabeth, W. (2015). Responses to abiotic stress. In: Buchanan, B. B., Gruissem, W., Jones, R. L. (Eds.Biochemistry and molecular biology of plants, pp. 1051–1100. Chichester, West Sussex: John Wiley & Sons. [Google Scholar]
25. Bartwal, A., Mall, R., Lohani, P., Guru, S. K., Arora, S. (2013). Role of secondary metabolites and brassinosteroids in plant defense against environmental stresses. Journal of Plant Growth Regulation, 32(1), 216–232. DOI 10.1007/s00344-012-9272-x. [Google Scholar] [CrossRef]
26. Farooq, M., Wahid, A., Kobayashi, N. S. M. A., Fujita, D. B. S. M. A., Basra, S. M. A. (2009). Plant drought stress: Effects, mechanisms and management. Sustainable Agriculture, 29(1), 185–212. DOI 10.1051/agro:2008021. [Google Scholar] [CrossRef]
27. Wu, G., Zhang, C., Chu, L. Y., Shao, H. B. (2007). Responses of higher plants to abiotic stresses and agricultural sustainable development. Journal of Plant Interactions, 2(3), 135–147. DOI 10.1080/17429140701586357. [Google Scholar] [CrossRef]
28. Chaves, M. M., Maroco, J. P., Pereira, J. S. (2003). Understanding plant responses to drought–From genes to the whole plant. Functional Plant Biology, 30(3), 239–264. DOI 10.1071/FP02076. [Google Scholar] [CrossRef]
29. Prasad, A., Sedlářová, M., Balukova, A., Rác, M., Pospíšil, P. (2020). Reactive oxygen species as a response to wounding: In vivo imaging in Arabidopsis thaliana. Frontiers in Plant Science, 10, 1660. DOI 10.3389/fpls.2019.01660. [Google Scholar] [CrossRef]
30. Hammond-Kosack, K. E., Jones, J. D. G. (2015). Responses to plant pathogens. In: Buchanan, B. B., Gruissem, W., Jones, R. L. (Eds.Biochemistry and molecular biology of plants, pp. 984–1050. Chichester, West Sussex: John Wiley & Sons. [Google Scholar]
31. Bhattacharjee, S. (2012). The language of reactive oxygen species signaling in plants. Journal of Botany, 2012, 985298. DOI 10.1155/2012/985298. [Google Scholar] [CrossRef]
32. Wang, B., Wang, J., Zhao, H., Zhao, H. (2006). Stress induced plant resistance and enzyme activity varying in cucumber. Colloids and Surfaces B: Biointerfaces, 48(2), 138–142. DOI 10.1016/j.colsurfb.2006.01.018. [Google Scholar] [CrossRef]
33. Zhao, H., Wang, B. C., Zhao, H. C., Wang, J. B. (2005). Stress stimulus induced resistance to Cladosporium cucumerinum in cucumber seeding. Colloids and Surfaces B: Biointerfaces, 44(1), 36–40. DOI 10.1016/j.colsurfb.2005.04.014. [Google Scholar] [CrossRef]
34. Chehab, E. W., Yao, C., Henderson, Z., Kim, S., Braam, J. (2012). Arabidopsis touch-induced morphogenesis is jasmonate mediated and protects against pests. Current Biology, 22(8), 701–706. DOI 10.1016/j.cub.2012.02.061. [Google Scholar] [CrossRef]
35. Braam, J., Davis, R. W. (1990). Rain-, wind-, and touch-induced expression of calmodulin and calmodulin-related genes in Arabidopsis. Cell, 60(3), 357–364. DOI 10.1016/00928674(90)90587-5. [Google Scholar] [CrossRef]
36. Monshausen, G. B., Bibikova, T. N., Weisenseel, M. H., Gilroy, S. (2009). Ca2+ regulates reactive oxygen species production and pH during mechanosensing in Arabidopsis roots. The Plant Cell, 21(8), 2341–2356. DOI 10.1105/tpc.109.068395. [Google Scholar] [CrossRef]
37. Kurusu, T., Yamanaka, T., Nakano, M., Takiguchi, A., Ogasawara, Y. et al. (2012). Involvement of the putative Ca2+-permeable mechanosensitive channels, NtMCA1 and NtMCA2, in Ca2+ uptake, Ca2+-dependent cell proliferation and mechanical stress-induced gene expression in tobacco (Nicotiana tabacum) BY-2 cells. Journal of Plant Research, 125(4), 555–568. DOI 10.1007/s10265-011-0462-6. [Google Scholar] [CrossRef]
38. Gill, S. S., Tuteja, N. (2010). Reactive oxygen species and antioxidant machinery in abiotic stress tolerance in crop plants. Plant Physiology and Biochemistry, 48(12), 909–930. DOI 10.1016/j.plaphy.2010.08.016. [Google Scholar] [CrossRef]
39. Baxter, A., Mittler, R., Suzuki, N. (2014). ROS as key players in plant stress signaling. Journal of Experimental Botany, 65(5), 1229–1240. DOI 10.1093/jxb/ert375. [Google Scholar] [CrossRef]
40. Dunand, C., Crèvecoeur, M., Penel, C. (2007). Distribution of superoxide and hydrogen peroxide in Arabidopsis root and their influence on root development: Possible interaction with peroxidases. New Phytologist, 174(2), 332–341. DOI 10.1111/j.1469-8137.2007.01995.x. [Google Scholar] [CrossRef]
41. Sharma, P., Jha, A. B., Dubey, R. S., Pessarakli, M. (2012). Reactive oxygen species, oxidative damage, and antioxidative defense mechanism in plants under stressful conditions. Journal of Botany, 2012(1), 1–26. DOI 10.1155/2012/217037. [Google Scholar] [CrossRef]
42. Mittler, R., Vanderauwera, S., Gollery, M., van Breusegem, F. (2004). Reactive oxygen gene network of plants. Trends in Plant Science, 9(10), 490–498. DOI 10.1016/j.tplants.2004.08.009. [Google Scholar] [CrossRef]
43. Xie, X., He, Z., Chen, N., Tang, Z., Wang, Q. et al. (2019). The roles of environmental factors in regulation of oxidative stress in plant. BioMed Research International, 2019(4), 1–11. DOI 10.1155/2019/9732325. [Google Scholar] [CrossRef]
44. Miller, G., Shulaev, V., Mittler, R. (2008). Reactive oxygen signaling and abiotic stress. Physiologia Plantarum, 133(3), 481–489. DOI 10.1111/j.1399-3054.2008.01090.x. [Google Scholar] [CrossRef]
45. Del Rio, D., Stewart, A. J., Pellegrini, N. (2005). A review of recent studies on malondialdehyde as toxic molecule and biological marker of oxidative stress. Nutrition, Metabolism and Cardiovascular Diseases, 15(4), 316–328. DOI 10.1016/j.numecd.2005.05.003. [Google Scholar] [CrossRef]
46. Gaspar, T., Penel, C., Hagege, D., Greppin, H. (1991). Peroxidases in plant growth, differentiation and development processes. In: Lobarzewski, J., Greppin, H., Penel, C., Gaspar, T. (Eds.Biochemical, molecular and physiological aspects of plant peroxidases, pp. 249–280. Geneva, Switzerland: University of Geneva. [Google Scholar]
47. Kusvuran, S., Kiran, S., Ellialtioglu, S. S. (2016). Antioxidant enzyme activities and abiotic stress tolerance relationship in vegetable crops. In: Shanker, A. K., Shanker, C. (Eds.Abiotic and biotic stress in plants-recent advances and future perspectives, pp. 481–506. IntechOpen. DOI 10.5772/62235. [Google Scholar] [CrossRef]
48. İşeri, Ö. D., Körpe, D. A., Sahin, F. I., Haberal, M. (2013). Hydrogen peroxide pretreatment of roots enhanced oxidative stress response of tomato under cold stress. Acta Physiologiae Plantarum, 35(6), 1905–1913. DOI 10.1007/s11738-013-1228-7. [Google Scholar] [CrossRef]
49. Hasanuzzaman, M., Bhuyan, M. B., Zulfiqar, F., Raza, A., Mohsin, S. M. et al. (2020). Reactive oxygen species and antioxidant defense in plants under abiotic stress: Revisiting the crucial role of a universal defense regulator. Antioxidants, 9(8), 681. DOI 10.3390/antiox9080681. [Google Scholar] [CrossRef]
50. Esmaeili, N., Ebrahimzadeh, H., Abdi, K. (2017). Correlation between polyphenol oxidase (PPO) activity and total phenolic contents in Crocus sativus L. corms during dormancy and sprouting stages. Pharmacognosy Magazine, 13(Suppl 3), 519–524. DOI 10.4103/0973-1296.216333. [Google Scholar] [CrossRef]
51. Boscaiu, M., Sánchez, M., Bautista, I., Donat, P., Lidón, A. et al. (2010). Phenolic compounds as stress markers in plants from gypsum habitats. Bulletin of the University of Agricultural Sciences & Veterinary Medicine Cluj-Napoca. Horticulture, 67(1), 44–49. DOI 10.15835/buasvmcn-hort:4903. [Google Scholar] [CrossRef]
52. Georgieva, K., Sárvári, E., Keresztes, A. (2010). Protection of thylakoids against combined light and drought by a lumenal substance in the resurrection plant Haberlea rhodopensis. Annals of Botany, 105(1), 117–126. DOI 10.1093/aob/mcp274. [Google Scholar] [CrossRef]
53. Sharma, A., Shahzad, B., Rehman, A., Bhardwaj, R., Landi, M. et al. (2019). Response of phenylpropanoid pathway and the role of polyphenols in plants under abiotic stress. Molecules, 24(13), 2452. DOI 10.3390/molecules24132452. [Google Scholar] [CrossRef]
54. Kutchan, T. M., Gershenzon, J., Møller, B. L., Gang, D. R. (2015). Natural products. In: Buchanan, B. B., Gruissem, W., Jones, R. L. (Eds.Biochemistry and molecular biology of plants, pp. 1132–1206. Chichester, West Sussex: John Wiley & Sons. [Google Scholar]
55. Cheynier, V., Comte, G., Davies, K. M., Lattanzio, V., Martens, S. (2013). Plant phenolics: Recent advances on their biosynthesis, genetics, and ecophysiology. Plant Physiology and Biochemistry, 72, 1–20. DOI 10.1016/j.plaphy.2013.05.009. [Google Scholar] [CrossRef]
56. Akhtar, W., Aziz, E., Koiwa, H., Mahmood, T. (2017). Characterization of rice polyphenol oxidase promoter in transgenic Arabidopsis thaliana. Turkish Journal of Botany, 41(3), 223–233. DOI 10.3906/bot-1609-19. [Google Scholar] [CrossRef]
57. Taranto, F., Pasqualone, A., Mangini, G., Tripodi, P., Miazzi, M. M. et al. (2017). Polyphenol oxidases in crops: Biochemical, physiological and genetic aspects. International Journal of Molecular Sciences, 18(2), 377. DOI 10.3390/ijms18020377. [Google Scholar] [CrossRef]
58. Tran, L. T., Taylor, J. S., Constabel, C. P. (2012). The polyphenol oxidase gene family in land plants: Lineage-specific duplication and expansion. BMC Genomics, 13(1), 1–12. DOI 10.1186/1471-2164-13-395. [Google Scholar] [CrossRef]
59. Morales, F., Ancín, M., Fakhet, D., González-Torralba, J., Gámez, A. L. et al. (2020). Photosynthetic metabolism under stressful growth conditions as a bases for crop breeding and yield improvement. Plants, 9(1), 88. DOI 10.3390/plants9010088. [Google Scholar] [CrossRef]
60. Ashraf, M., Harris, P. J. (2013). Photosynthesis under stressful environments: An overview. Photosynthetica, 51(2), 163–190. DOI 10.1007/s11099-013-0021-6. [Google Scholar] [CrossRef]
61. Melo, H. F. D., Souza, E. R. D., Cunha, J. C. (2017). Fluorescence of chlorophyll a and photosynthetic pigments in Atriplex nummularia under abiotic stresses. Revista Brasileira de Engenharia Agrícola e Ambiental, 21(4), 232–237. DOI 10.1590/1807-1929/agriambi.v21n4p232-237. [Google Scholar] [CrossRef]
62. Baker, N. R., Rosenqvist, E. (2004). Applications of chlorophyll fluorescence can improve crop production strategies: An examination of future possibilities. Journal of Experimental Botany, 55(403), 1607–1621. DOI 10.1093/jxb/erz535. [Google Scholar] [CrossRef]
63. Paul, V., Sharma, L., Kumar, R., Pandey, R., Meena, R. C. (2017). Estimation of chlorophylls/photosynthetic pigments–their stability is an indicator of crop plant tolerance to abiotic stresses. In: Manual of ICAR sponsored training programme for technical staff of ICAR Institutes on “Physiological Techniques to Analyze the Impact of Climate Change on Crop Plants”, pp. 8–14. New Delhi: Division of Plant Physiology, ICAR-Indian Agricultural Research Institute (IARI). DOI 10.13140/RG.2.2.13845.83680. [Google Scholar] [CrossRef]
64. Biswal, B., Joshi, P. N., Raval, M. K., Biswal, U. C. (2011). Photosynthesis, a global sensor of environmental stress in green plants: Stress signalling and adaptation. Current Science, 101(1), 47–56. [Google Scholar]
65. Coutand, C. (2020). The effect of mechanical stress on plant susceptibility to pests: A mini opinion review. Plants, 9(5), 632. DOI 10.3390/plants9050632. [Google Scholar] [CrossRef]
66. Zhdanov, O., Blatt, M. R., Cammarano, A., Zare-Behtash, H., Busse, A. (2020). A new perspective on mechanical characterisation of Arabidopsis stems through vibration tests. Journal of the Mechanical Behavior of Biomedical Materials, 112, 104041. DOI 10.1016/j.jmbbm.2020.104041. [Google Scholar] [CrossRef]
67. Zhdanov, O., Blatt, M. R., Zare-Behtash, H., Busse, A. (2021). Wind-evoked anemotropism affects the morphology and mechanical properties of Arabidopsis. Journal of Experimental Botany, 72(5), 1906–1918. DOI 10.1093/jxb/eraa541. [Google Scholar] [CrossRef]
68. Saidi, I., Ammar, S., Demont-Caulet, N., Thévenin, J., Lapierre, C. et al. (2009). Thigmomorphogenesis in Solanum lycopersicum: Morphological and biochemical responses in stem after mechanical stimulation. Plant Science, 177(1), 1–6. DOI 10.1016/j.plantsci.2009.03.002. [Google Scholar] [CrossRef]
69. Saidi, I., Ammar, S., Demont-Caulet, N., Thévenin, J., Lapierre, C. et al. (2010). Thigmomorphogenesis in Solanum lycopersicum: Morphological and biochemical responses in stem after mechanical stimulation. Plant Signaling & Behaviour, 5(1), 122–125. DOI 10.1016/j.plantsci.2009.03.002. [Google Scholar] [CrossRef]
70. Ghosh, R., Barbacci, A., Leblanc-Fournier, N. (2021). Mechanostimulation: A promising alternative for sustainable agriculture practices. Journal of Experimental Biology, 72(8), 2877–2888. DOI 10.1093/jxb/erab036. [Google Scholar] [CrossRef]
71. Boyes, D. C., Zayed, A. M., Ascenzi, R., McCaskill, A. J., Hoffman, N. et al. (2001). Growth stage-based phenotypic analysis of Arabidopsis: A model for high throughput functional genomics in plants. The Plant Cell, 13(7), 1499–1510. DOI 10.1105/tpc.010011. [Google Scholar] [CrossRef]
72. Fancev, E. (2010). A force measurement system for the vibration stimulator’s force (Master Thesis). Faculty of Electrical Engineering and Computing, University of Zagreb, Croatia. [Google Scholar]
73. Alexieva, V., Sergiev, I., Mapelli, S., Karanov, E. (2001). The effect of drought and ultraviolet radiation on growth and stress markers in pea and wheat. Plant, Cell and Environment, 24(12), 1337–1344. DOI 10.1046/j.1365-3040.2001.00778.x. [Google Scholar] [CrossRef]
74. Heath, R. L., Packer, L. (1968). Photoperoxidation in isolated chloroplasts: I. Kinetics and stoichiometry of fatty acid peroxidation. Archives of Biochemistry and Biophysics, 125(1), 189–198. DOI 10.1016/0003-9861(68)90654-1. [Google Scholar] [CrossRef]
75. Bradford, M. M. (1976). A rapid and sensitive method for the quantitation of microgram quantities of protein utilizing the principle of protein-dye binding. Analytical Biochemistry, 72(1–2), 248–254. DOI 10.1006/abio.1976.9999. [Google Scholar] [CrossRef]
76. Beauchamp, C., Fridovich, I. (1971). Superoxide dismutase: Improved assays and an assay applicable to acrylamyde gels. Analyticalss Biochemistry, 44(1), 276–287. DOI 10.1016/0003-2697(71)90370-8. [Google Scholar] [CrossRef]
77. Aebi, H. (1984). Catalase in vitro. Methods in Enzymology, 105, 121–126. DOI 10.1016/S0076-6879(84)05016-3. [Google Scholar] [CrossRef]
78. Chance, B., Maehly, A. C. (1955). Assay of catalases and peroxidases. Methods in Enzymology, 2, 764–775. DOI 10.1016/S0076-6879(55)02300-8. [Google Scholar] [CrossRef]
79. Escalante-Minakata, P., Ibarra-Junquera, V., Ornelas-Paz, J. D. J., García-Ibáñez, V., Virgen-Ortíz, J. J. et al. (2018). Comparative study of the banana pulp browning process of ‘Giant Dwarf’ and FHIA-23 during fruit ripening based on image analysis and the polyphenol oxidase and peroxidase biochemical properties. 3 Biotech, 8(1), 1–9. DOI 10.1007/s13205-017-1048-3. [Google Scholar] [CrossRef]
80. Humadi, S. S., Istudor, V. (2009). Lythrum salicaria (purple loosestrife). Medicinal use, extraction and identification of its total phenolic compounds. Farmacia, 57(2), 192–200. [Google Scholar]
81. Maxwell, K., Johnson, G. N. (2000). Chlorophyll fluorescence—A practical guide. Journal of Experimental Botany, 51(345), 659–668. DOI 10.1093/jexbot/51.345.659. [Google Scholar] [CrossRef]
82. Wellburn, A. R. (1994). The spectral determination of chlorophylls a and b, as well as total carotenoids, using various solvents with spectrophotometers of different resolution. Journal of Plant Physiology, 144(3), 307–313. DOI 10.1016/S0176-1617(11)81192-2. [Google Scholar] [CrossRef]
83. Miller, G., Schlauch, K., Tam, R., Cortes, D., Torres, M. A. et al. (2009). The plant NADPH oxidase RBOHD mediates rapid systemic signaling in response to diverse stimuli. Science Signaling, 2(84), ra45. DOI 10.1126/scisignal.2000448. [Google Scholar] [CrossRef]
84. Depège, N., Varenne, M., Boyer, N. (2000). Induction of oxidative stress and GPX-like protein activation in tomato plants after mechanical stimulation. Physiologia Plantarum, 110(2), 209–214. DOI 10.1034/j.1399-3054.2000.110210.x. [Google Scholar] [CrossRef]
85. Huang, H., Ullah, F., Zhou, D. X., Yi, M., Zhao, Y. (2019). Mechanisms of ROS regulation of plant development and stress responses. Frontiers in Plant Science, 10, 800. DOI 10.3389/fpls.2019.00800. [Google Scholar] [CrossRef]
86. Černý, M., Habánová, H., Berka, M., Luklová, M., Brzobohatý, B. (2018). Hydrogen peroxide: Its role in plant biology and crosstalk with signalling networks. International Journal of Molecular Sciences, 19(9), 2812. DOI 10.3390/ijms19092812. [Google Scholar] [CrossRef]
87. Smirnoff, N., Arnaud, D. (2019). Hydrogen peroxide metabolism and functions in plants. New Phytologist, 221(3), 1197–1214. DOI 10.1111/nph.15488. [Google Scholar] [CrossRef]
88. Sachdev, S., Ansari, S. A., Ansari, M. I., Fujita, M., Hasanuzzaman, M. (2021). Abiotic stress and reactive oxygen species: Generation, signaling, and defense mechanisms. Antioxidants, 10(2), 277. DOI 10.3390/antiox10020277. [Google Scholar] [CrossRef]
89. Bhattacharjee, S. (2014). Membrane lipid peroxidation and its conflict of interest: The two faces of oxidative stress. Current Science, 107(11), 1811–1823. [Google Scholar]
90. Tenhaken, R. (2015). Cell wall remodeling under abiotic stress. Frontiers in Plant Science, 5(204), 771. DOI 10.3389/fpls.2014.00771. [Google Scholar] [CrossRef]
91. CipolliniJr, D. F. (1997). Wind-induced mechanical stimulation increases pest resistance in common bean. Oecologia, 111(1), 84–90. DOI 10.1007/s004420050211. [Google Scholar] [CrossRef]
92. Mayer, A. M. (2006). Polyphenol oxidases in plants and fungi: Going places? A review. Phytochemistry, 67(21), 2318–2331. DOI 10.1016/j.phytochem.2006.08.006. [Google Scholar] [CrossRef]
93. Hoffmann, N., Benske, A., Betz, H., Schuetz, M., Samuels, A. L. (2020). Laccases and peroxidases co-localize in lignified secondary cell walls throughout stem development. Plant Physiology, 184(2), 806–822. DOI 10.1104/pp.20.00473. [Google Scholar] [CrossRef]
94. Sánchez-Rangel, J. C., Benavides, J., Heredia, J. B., Cisneros-Zevallos, L., Jacobo-Velázquez, D. A. (2013). The Folin-Ciocalteu assay revisited: Improvement of its specificity for total phenolic content determination. Analytical Methods, 5(21), 5990–5999. DOI 10.1039/C3AY41125G. [Google Scholar] [CrossRef]
95. Lichtenthaler, H. K., Buschmann, C., Knapp, M. (2005). How to correctly determine the different chlorophyll fluorescence parameters and the chlorophyll fluorescence decrease ratio RFd of leaves with the PAM fluorometer. Photosynthetica, 43(3), 379–393. DOI 10.1007/s11099-005-0062-6. [Google Scholar] [CrossRef]
96. Murchie, E. H., Lawson, T. (2013). Chlorophyll fluorescence analysis: A guide to good practice and understanding some new applications. Journal of Experimental Botany, 64(13), 3983–3998. DOI 10.1093/jxb/ert208. [Google Scholar] [CrossRef]
97. Ramel, F., Mialoundama, A. S., Havaux, M. (2013). Nonenzymic carotenoid oxidation and photooxidative stress signalling in plants. Journal of Experimental Botany, 64(3), 799–805. DOI 10.1093/jxb/ers223. [Google Scholar] [CrossRef]
Cite This Article
 Copyright © 2023 The Author(s). Published by Tech Science Press.
This work is licensed under a Creative Commons Attribution 4.0 International License , which permits unrestricted use, distribution, and reproduction in any medium, provided the original work is properly cited.
 Downloads
 Citation Tools