
 Submit a Paper
 Propose a Special lssue
 Open Access
ARTICLE

Selection of Stable Reference Genes for Quantitative Real-Time PCR on Herbaceous Peony (Paeonia lactiflora Pall.) in Response to Drought Stress
College of Horticulture and Landscape Architecture, Yangzhou University, Yangzhou, 225009, China
* Corresponding Authors: Jun Tao. Email: ; Daqiu Zhao. Email:
(This article belongs to the Special Issue: Identification of Genetic/Epigenetic Components Responding to Biotic and Abiotic Stresses in Crops)
Phyton-International Journal of Experimental Botany 2023, 92(3), 801-814. https://doi.org/10.32604/phyton.2023.024953
Received 15 June 2022; Accepted 08 September 2022; Issue published 29 November 2022
 View Full Text
 Download PDF
Abstract
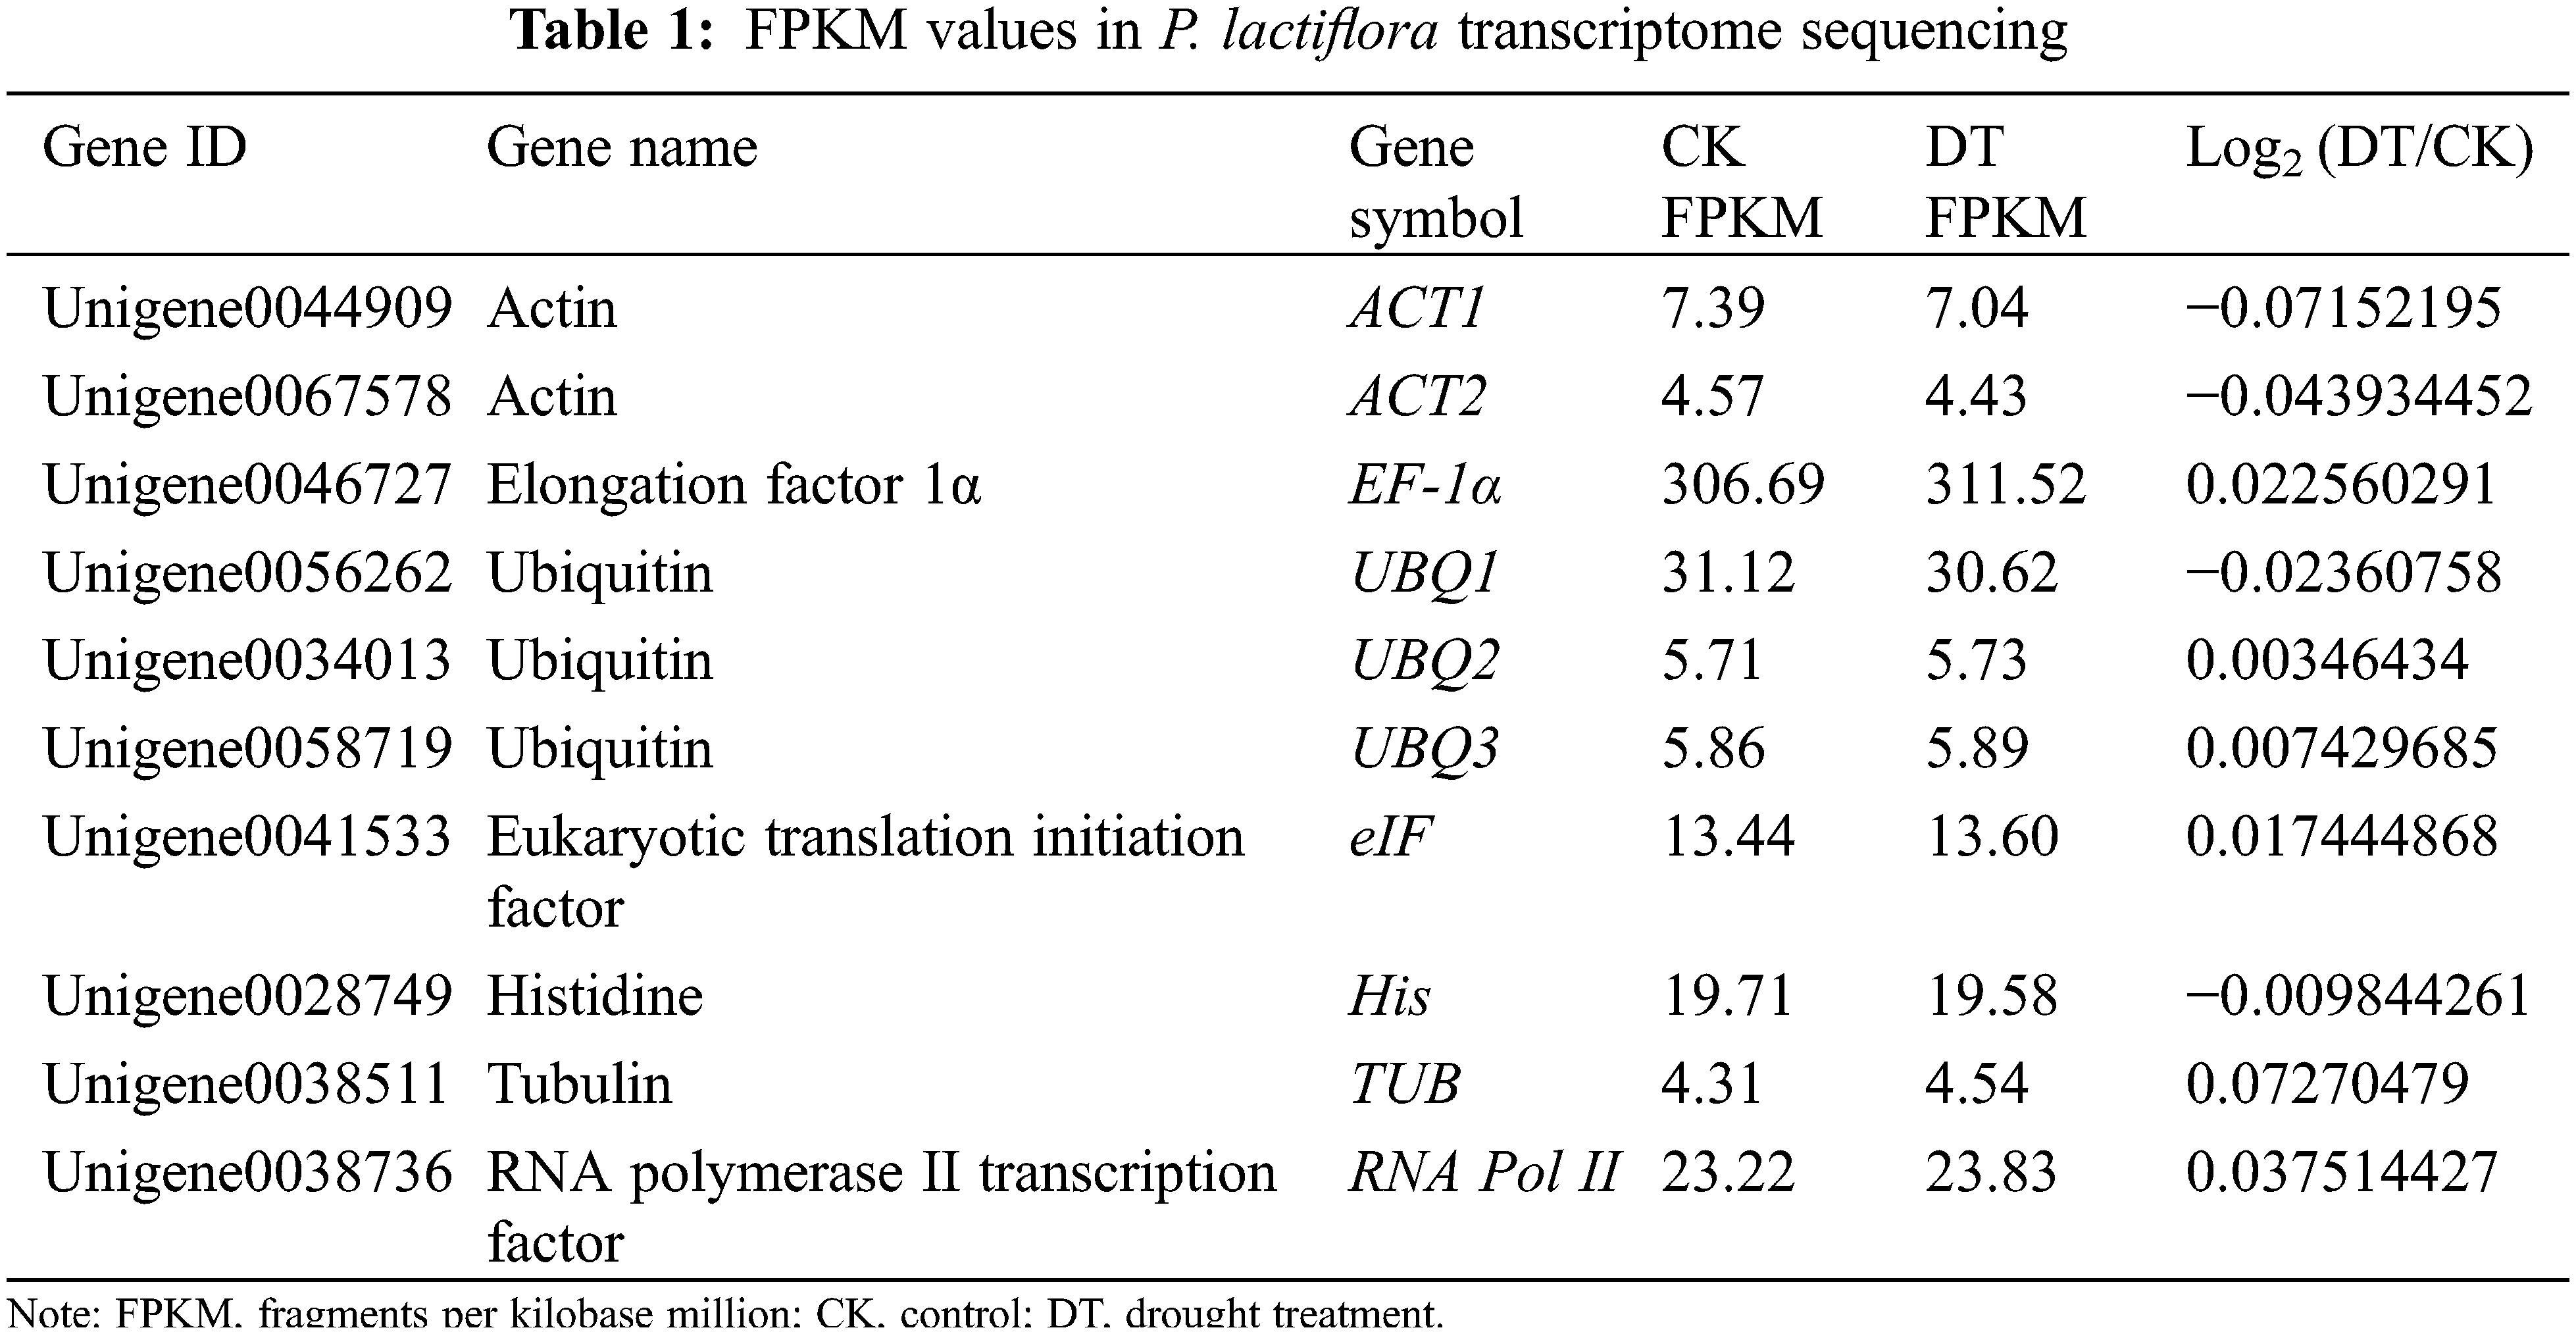
Herbaceous peony (Paeonia lactiflora Pall.), as a high-end cut flower in the international market, has high ornamental and medicinal values. But in Northern China, drought is a major environmental factor influencing the growth and development of P. lactiflora. Quantitative real-time polymerase chain reaction (qRT-PCR) can evaluate gene expression levels under different stress conditions, and stable internal reference is the key for qRT-PCR. At present, there is no systematic screening of internal reference for correcting gene expressions of P. lactiflora in response to drought stress. In this study, 10 candidate genes [ubiquitin (UBQ2), UBQ1, elongation factor 1-α (EF-1α), Histidine (His), eukaryotic initiation factor (eIF), tubulin (TUB), actin (ACT), UBQ3, ACT2, RNA polymerase II (RNA Pol II)] were chosen, and 4 analysis methods were used to compare the stabilities for these 10 genes coping with drought stress. Due to the difference of operation methods, the results of different analysis were distinct, and the final comprehensive analysis indicated that EF-1α was a relatively stable internal reference gene for P. lactiflora under drought stress. Also, UBQ1 and UBQ2 were the best reference gene combination according to GeNorm analysis. This study will lay a foundation for screening the key genes of P. lactiflora in response to drought stress.Keywords
Gene expression levels analysis has been widely applied in numerous fields of molecular biology to sieve key genes, identify specific regulatory mechanisms, and study new gene functions [1–6]. Compared to northern blotting and conventional reverse transcription-polymerase chain reaction (RT-PCR), quantitative real-time polymerase chain reaction (qRT-PCR), avoids the contamination that PCR products may carry. Thus, more accurate and faster flux analysis can be performed at the mRNA level [7,8]. However, the results of qRT-PCR analysis may be affected their accuracy by many factors, such as highly variable experimental results due to poor sample storage [9], the quality and presence of RNA degradation, and the specificity of primer selection [10], from the synthesis efficiency of DNA and the total transcriptional activity of tissues [11], etc. Therefore, to acquire more accurate experimental outcomes from qualitative and quantitative studies, it is essential to choose proper reference gene based on the particular experimental situations.
Reference genes (housekeeping genes), referring to the genes with the stable expression in different individuals, tissues and organs, are not affected by abiotic or biotic stresses such as environment. Reference gene studies are applied to plants, usually referring to genes that make up cells or participate in basic metabolic activities of cells. Currently, reference genes are commonly applied in qRT-PCR. These include 18S ribosomal RNA (18S), actin (ACT), glyceraldehyde-3-phosphate dehydrogenase (GAPDH), tubulin (TUB), Elongation factor 1-α (EF-1α), and ubiquitin (UBQ) [12–14], which are generally considered to be stable expression and applied as internal reference genes for data normalization [5,15]. However, most experimental studies have demonstrated that the transcription levels of internal reference genes differ in distinct species, or distinct tissues of the same species and under distinct stress conditions. Flyceraldehyde3-phosphate dehydrogenase (GAPC2) and DNA-directed RNA polymerase II subunit RPB2 (RPB2) were considered as reference genes for cycads to represent the stability of expression levels at different developmental phases and different tissue sites [16]. During soybean seed germination, the optimal reference genes for seed development were α-Tubulin (TUA5) and Hypothetical protein (UKN2), and the best reference genes for germination were Glyma05g37470 and Glyma08g28550 [17]. ACT1 was evaluated as the optimal reference gene for the shaping of pitaya fruit under different varieties, and different organs and tissues of the same variety, different growth and development periods and different temperature stress conditions [6]. Polypyrimidine tract-binding protein (PTB1), EF1, Clathrin adaptor complex subunit (CLATHRIN1), SAND family protein (SAND1) and Ubiquitin-conjugating enzyme (UBC1) were the top five proper reference genes in numerous experimental conditions for qRT-PCR in tea plants [18]. ACT2, Histidine (His) and TATA binding protein (TATA) represent stable expressions in different tissues of Metasequoia [19], and the optimal internal reference genes for leaves processed with flower-inducing hormone solution were ACT2, EF-1α and His, while 60 kDa chaperonin β-subunit (Cpn60β), GAPDH, EF1α, TATA and His are reference genes for the exact normalization reposed to abscisic acid signals. In normal growth, and abiotic and biotic stress conditions, TUA and β-Actin (ACT), and EF-1a, Clathrin adaptor complex subunit (CAC) and TUA were the most favorable combination for reference genes in watermelon tissues and organs [20]. In birch [21], EF-1α gene is the most stable one in distinct tissues; ACT, Translation elongation factor (TEF) and β-tubulin (TUB) are the most highly stable reference genes under normal conditions, salt stress conditions, and osmotic stress conditions, respectively. In Schima Superba [22], ACT was the most stable, and ACT and 60S ribosomal protein (RIB) were the most proper combination of reference genes in distinct tissues. The above-mentioned reference genes were mainly studied in food crops and fruit trees. Currently, studies on the selection of reference genes in ornamental plants are also increasing. Guan et al. found that, combining the Magnolia sieboldii seeds in five development periods, diverse organs, seeds under imbibition and stratification treatments, copper/zinc superoxide dismutase (Cu/Zn-SOD) fold was determined as the reference gene for qRT-PCR normalization [23]. Similarly, Dong et al. illustrated that, elongation factor 1-delta (EF-1δ) and 60S were finally determined as the best reference genes for Cymbidium lowianum [24]. Also, Cheng et al. found that, cytosolic phosphoglycerate kinase 2 (PGK2) was identified as the most stable reference gene during meiotic recombination [25].
The cultivation of Paeonia lactiflora owns a very long history of over 4000 years in China. In recent years, P. lactiflora has also made great achievements in potted plants, cut flowers and flower arrangement art, and has become an international high-end cut flower. Also, P. lactiflora has very high medicinal value, in terms of blood circulation, beauty, endocrine regulation and body immunity, etc. P. lactiflora is light-loving and cold-resistant, and grows in deep, moist, well-drained soil. However, drought stress, as a common abiotic stress, seriously affects the growth and development of P. lactiflora, resulting in greatly limited ornamental and medicinal values [26], particularly in arid and semi-arid areas of China. In recent years, arid and semi-arid districts in the world have covered more than one-third of the total soil area, while the arid and semi-arid area accounts for about 50% of the total land area in China. On top of that, the lack of water resources has become the major factor limiting the growth and development of plants in China. Drought has also become one of the most susceptible stresses to plants. Drought stress severely restricted the growth of P. lactiflora. Therefore, the most urgent need at present is to find a way to alleviate the drought stress of P. lactiflora to maximize its value. So far, there are very few studies on selection of reference genes in P. lactiflora, reported only in distinct growth phases or in different tissues and organs [27,28]. Many studies have emerged around the screening of reference genes in response to drought stress. In P. ostii, the most suitable reference gene was RNA polymerase II (RNA Pol II) under drought stress [29]. Eukaryotic initiation factor (eIF) and EF-1α are recommended as the steadiest ones in distinct tissues of grass pea [30] under drought stress. In luffa [31], TUB was determined as the most suitable reference gene in response to drought stress. Meanwhile, no report is published on the verification of internal reference genes in P. lactiflora in response to drought conditions. Therefore, short of reference genes of P. lactiflora that could be stably expressed in response to different conditions for qRT-PCR analysis, when elucidating the underlying molecular mechanisms in response to drought stress and searching for effective mitigation pathways for P. lactiflora.
In this study, we preliminarily screened 10 candidate genes (UBQ1, UBQ2, UBQ3, EF-1α, His, eIF, TUB, ACT1, ACT2, RNA Pol II) that are widely used as plant reference genes from the transcriptome data obtained in the previous stage response to drought stress. Thereafter, the stabilities of the above 10 genes expressions were verified by four analytical methods. Finally, the 10 candidate genes were comprehensively ranked. These results will provide a reference for a more convenient selection of reference genes in distinct drought stress conditions, and guarantee the precision and accuracy of gene expression analysis for P. lactiflora.
2.1 Stress Treatments and Sample Collections
Three-year-old P. lactiflora ‘Da Fugui’ were the plant materials in this experimental study. Twelve potted seedlings with 1000 mL at 17:00 every day, and after 3 days of continuous watering, they were subjected to natural drought treatment, that is, 25°C for 14 h during the day and 20°C for 10 h at night. In this study, leaves were separately collected at 0, 4, 8, and 12 days after treatments, and each group had 3 biological replicates. With liquid nitrogen, the collected samples were quickly freezed, and stored in an ultra-low temperature fridge at −80°C degrees for storage.
2.2 Total RNA Extraction and cDNA Synthesis
Frozen tissues were taken and ground with liquid nitrogen repeatedly in a mortar until they were ground into a fine powder. We took 0.05~0.1 g of samples and extracted total RNA with a plant total RNA extraction kit (Takara, Japan). We utilized 1.0% agarose gel electrophoresis to analyze the integrity of RNA, and RNA purity and quality were measured with a BioPhotometer D30 (Eppendorf AG, Hamburg, Germany). All RNA samples used in subsequent experiments had a D260/D280 ratio ranging from 1.8 to 2.0; D260/D280 ratio > 2.0. PrimeScript RT kit (Takara, Japan) was applied to compound the first-strand cDNA.
2.3 Selections of Candidate Reference Genes and Primer Design
According to previous transcriptome database of P. lactiflora ‘Da Fugui’ with drought treatment, we received 10 unigenes owning the highest stability of expressions, which were distributed in eight gene families as internal reference genes candidates for the following analysis. Primer Premier 5.0 was employed to design the qRT-PCR primers for each reference gene of P. lactiflora. The total sequences of the primers of the 10 genes were available in Table 1.
qRT-PCR was employed for the analysis at the gene expression levels with the system of Bio-Rad PCR CFX96 (Bio-Rad Laboratories, Hercules, CA, USA). 10 candidate genes were amplified by qRT-PCR from distinct drought stress treatments by SYBR Premix Ex Taq (Takara, Japan). A reaction without cDNA was employed as a negative control. The system of qRT-PCR was set up as follows: 95°C for 30 s, followed by 95°C for 5 s, 55°C for 30 s, and 72°C for 30 s (40 cycles). Three biological replicates were set in each group.
Each data was averaged from 3 biological replicates.
The GeNorm algorithm [32], NormFinder algorithm [10], and BestKeeper algorithm [33] with the software Bio-Rad CFX Manager were employed for the data analysis. RefFinder was employed to appraise the stabilities of expression of the different gene candidates to the different drought stress levels.
GeNorm analysis can use its unique algorithm to compute the expression stabilities for the candidate genes, which are represented by the M value. The highest the expression stability, the lower the M value. Unlike other assays, this assay also computes pairwise variation (Vn/Vn+1), resulting in the best combination of candidate genes for qRT-PCR analysis.
NormFinder analysis can also generate an M value by calculating the differences between samples to obtain a ranking of the expression stabilities of the candidate genes. This will allow to obtain the more appropriate candidate gene under this algorithm.
The BestKeeper analysis method compares the standard deviation (SD) and the coefficient of variation (CV) generated by the Ct value. The higher the expression stability of the candidate gene, the lower the SD and CV.
RefFinder (http://www.leonxie.com/referencegene.php) is an on-line tool program, integrated with the GeNorm, NormFinder, BestKeeper, and Delta Ct ranking results. It combines the outcomes of these four algorithms to get a comprehensive result and suggests the most appropriate reference gene.
3.1 Verification of PCR Assays
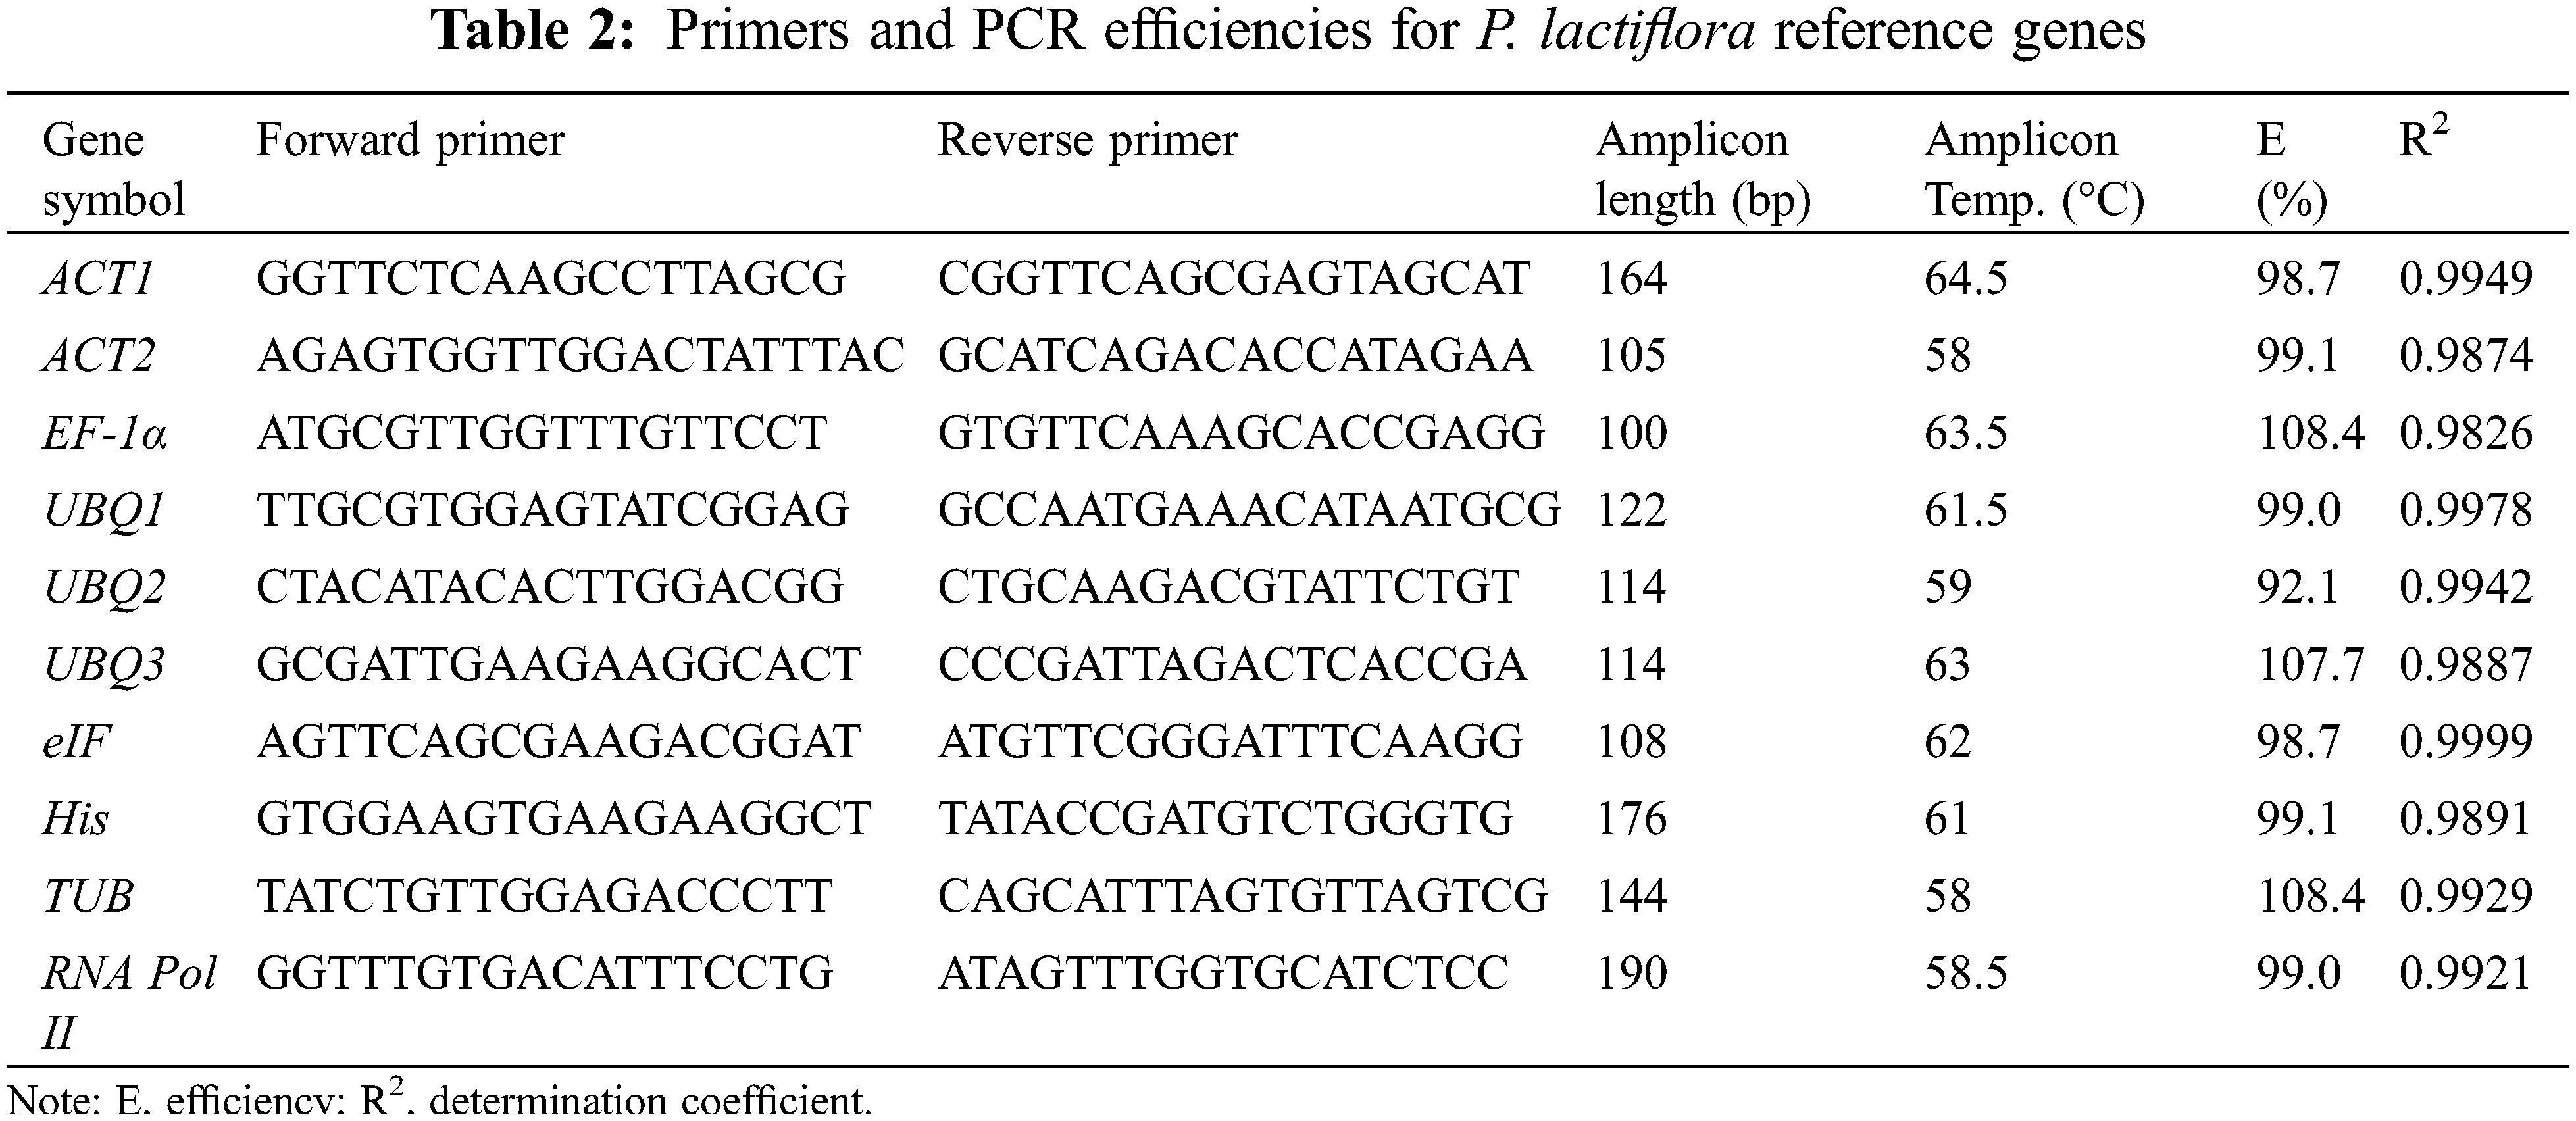
Based on the P. lactiflora transcriptome sequencing data obtained earlier, we designed primers for the candidate gene sequences. The lengths of amplified PCR fragments ranged from 100 to 190 bp (Fig. 1). Through comparison and verification, the lengths of the amplified PCR fragments were consistent with the transcriptome results. In addition, all the designed primers were found to have only one peak in the melting curves of the 10 candidates through quality analysis, representing that the specificity of each primer was appropriate (Fig. 2). PCR efficiencies, i.e., E values, were from 92.1% for UBQ2 to 108.4% for EF-1α and TUB, and the determination coefficients, i.e., R2, ranged from 0.9826 for EF-1α to 0.9999 for eIF (Table 2).
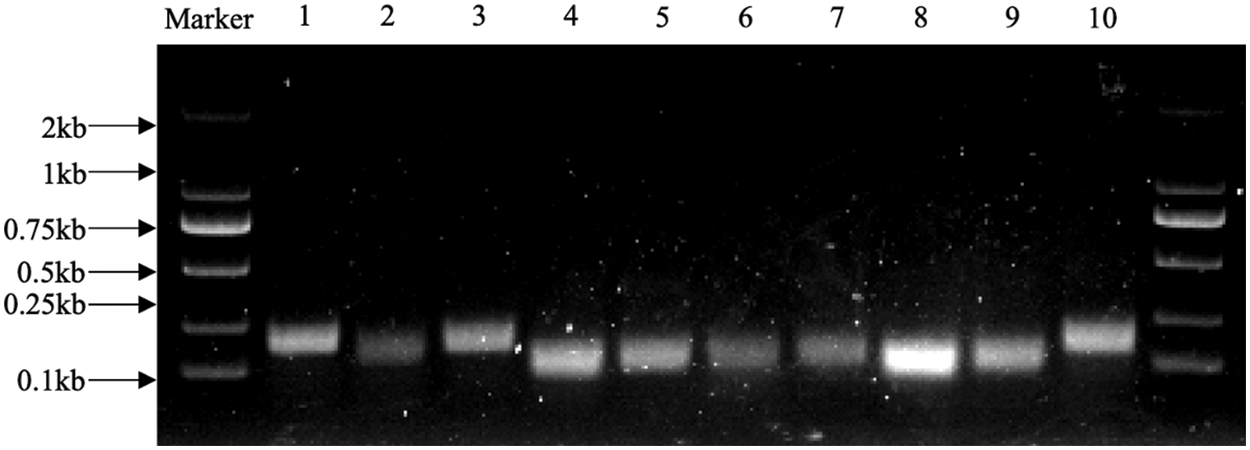
Figure 1: Agarose gel electrophoresis exhibiting the qRT-PCR amplification products of the candidate genes of P. lactiflora
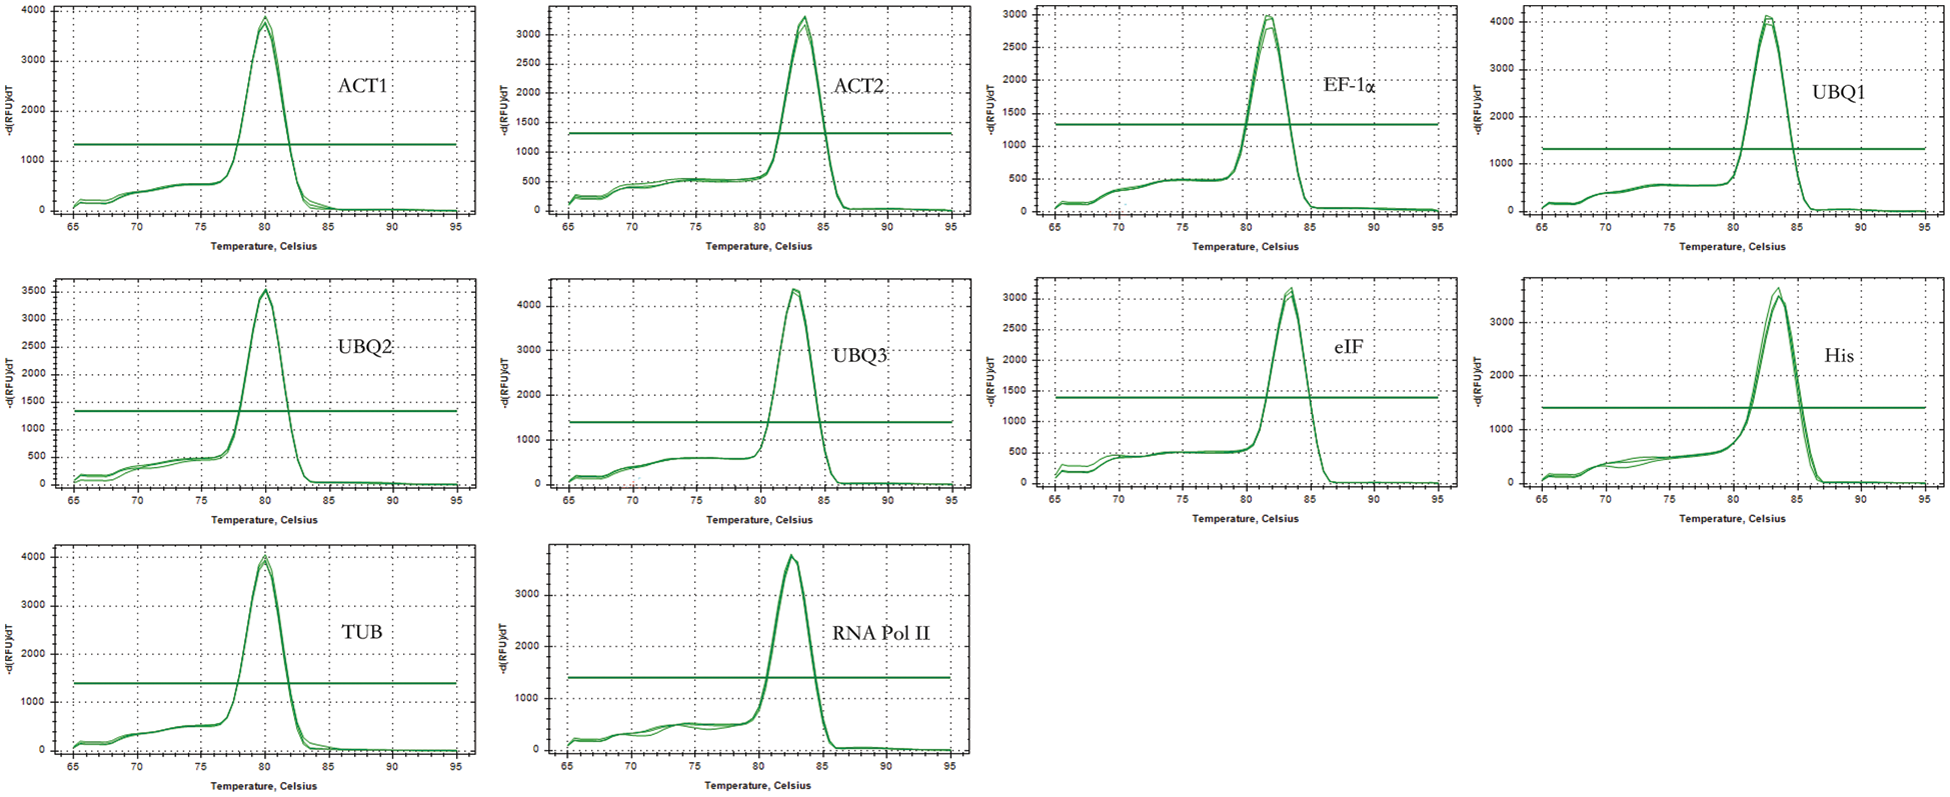
Figure 2: Melting curves of 10 candidates of P. lactiflora
Marker, DL 2000 marker; 1, ACT1; 2, ACT2; 3, EF-1α; 4, UBQ1; 5, UBQ2; 6, UBQ3; 7, eIF; 8, His; 9, TUB; 10, RNA Pol II.
3.2 Expression Characteristics of the Candidate Reference Genes
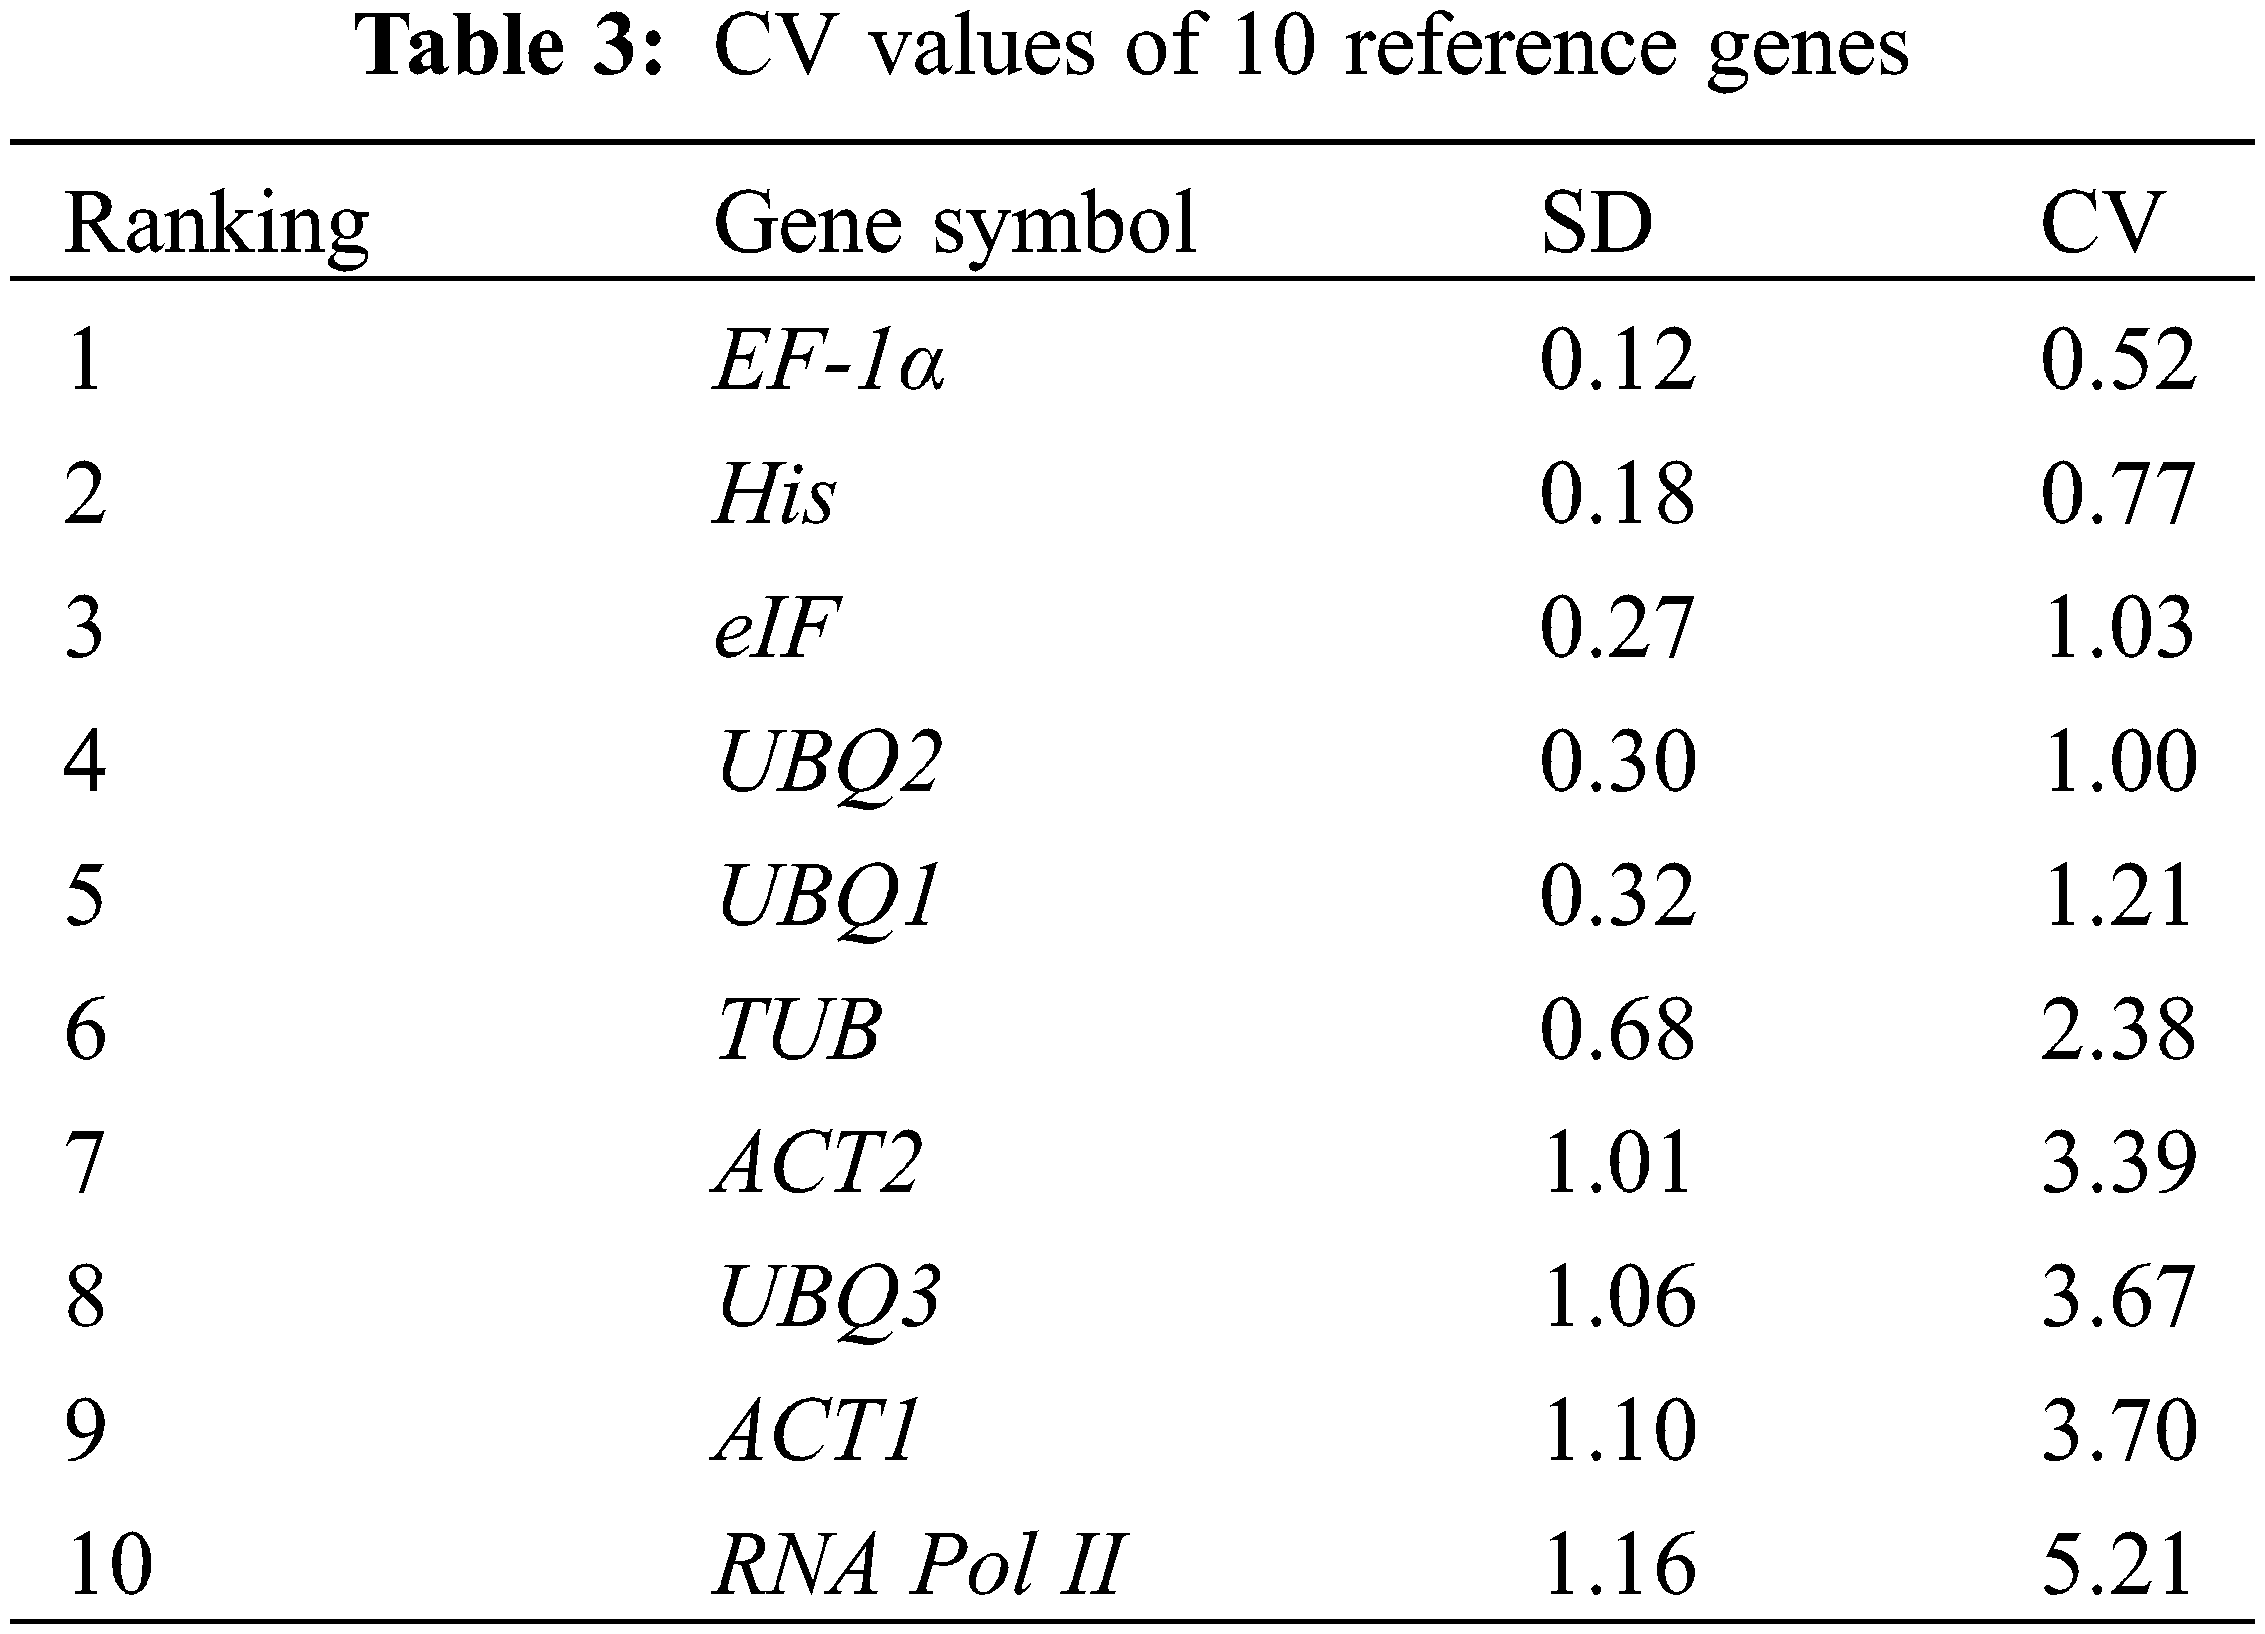
The Ct values of the screened 10 reference genes on days 0, 4, 8 and 12 after drought stress were shown in Fig. 3, and the Ct values were from 20.27 to 31.23. The mean value of Ct of RNA Pol II was the lowest (22.19), which proved that RNA Pol II presented the highest expressions at the mRNA level, while the mean value of Ct of UBQ2 was the highest (30.30), which proved that UBQ2 presented the smallest expression level at the mRNA level. CV value represents the stabilities of the gene expressions of the reference genes in response to different drought stress conditions (Table 3). According to the CV values, the ranking from small to large was EF-1α, His, eIF, UBQ2, UBQ1, TUB, ACT2, UBQ3, ACT1, RNA Pol II. Among the 10 selected reference genes, the variation span of EF-1α was the smallest, which meant that the expression stability was the best, and the RNA Pol II gene had the largest variation span.
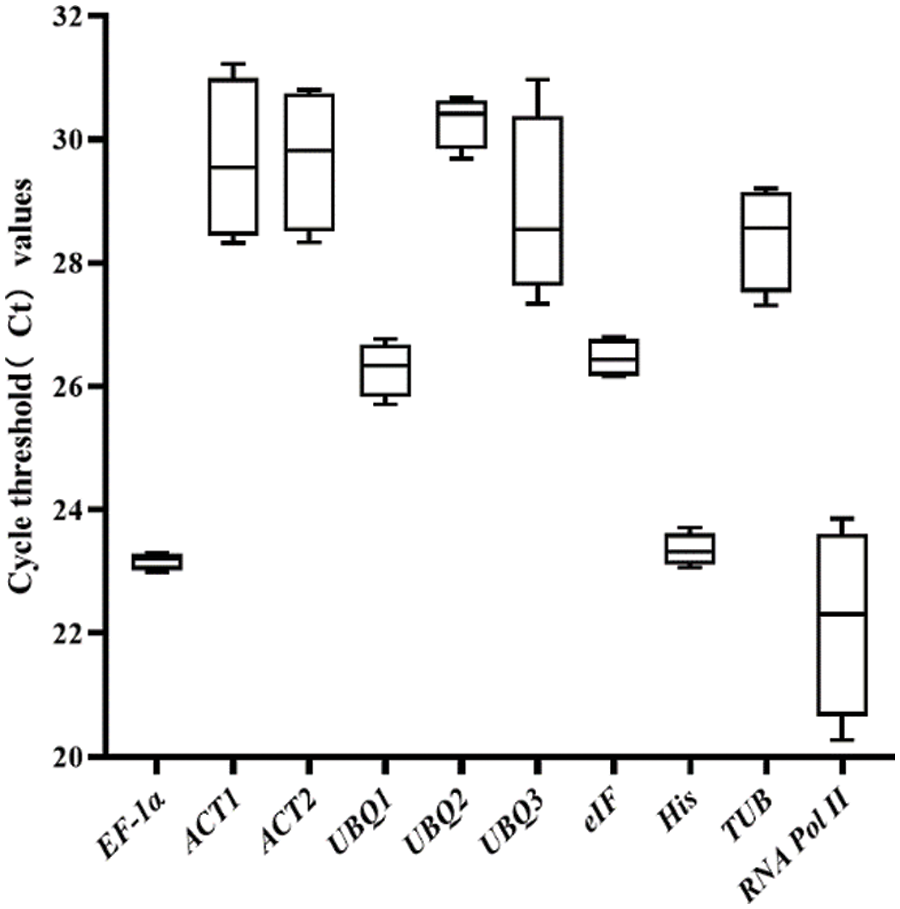
Figure 3: qRT-PCR CT values. The expression data demonstrate the Ct value for each reference gene of P. lactiflora maximum and minimum Ct values were presented
The software GeNorm selects the reference genes with more stability by computing the M value for the stability. The default value of the software is 1.5. Genes could serve as reference genes with an M value smaller than 1.5. The candidate gene expression stabilities were inversely proportional to the M value, with a minimum value of 0.29. It means that UBQ2 and UBQ1 were the most stable. Meanwhile, the maximum value was 1.24, indicating that the RNA Pol II was the most unstable. Except for UBQ2, UBQ1 and RNA Pol II, we ranked the stabilities of the other candidates as follows, EF-1α > His > eIF > TUB > ACT1 > UBQ3 > ACT2 (Fig. 4).
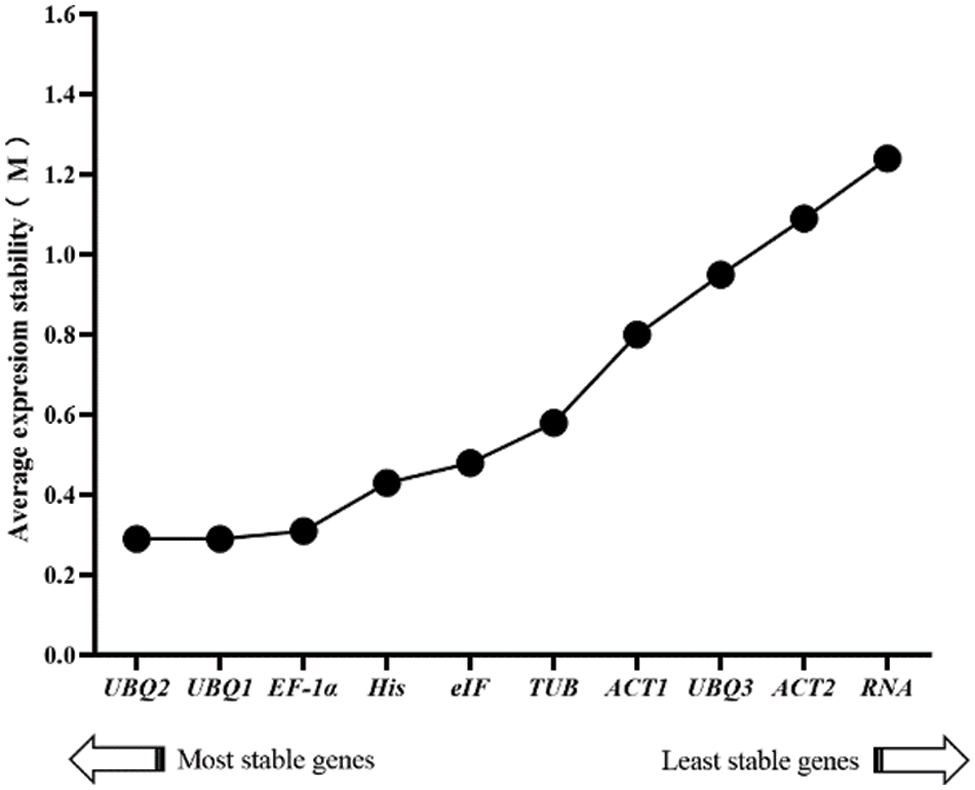
Figure 4: Expression stability values and ranking of the 10 candidate genes by using the GeNorm algorithm
Additionally, GeNorm analysis determines the proper count of reference genes by computing the pairwise variation between the normalization factors of the two gene sequences (Vn/n+1). If Vn/n+1 is lower than 0.15, n is applied as the count of optimal internal reference genes; if Vn/n+1 is greater than 0.15, n+1 is applied as the chosen count. In this research, UBQ1 and UBQ2 were chosen as the best combinations for exact qRT-PCR analysis with a V2/V3 value of 0.097 in response to different drought stress in P. lactiflora (Fig. 5).
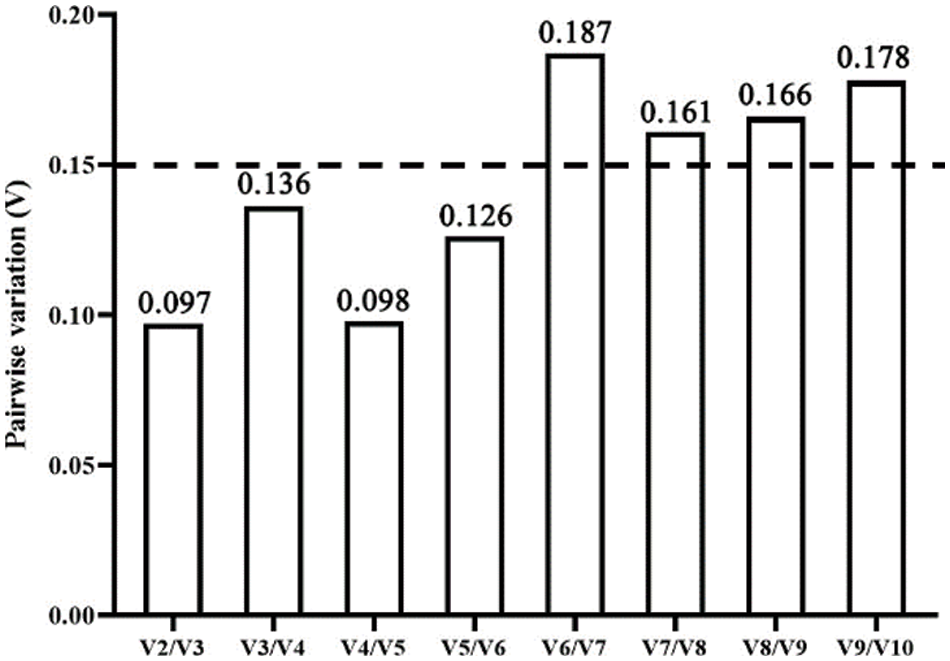
Figure 5: Pairwise variation (V) analyses of 10 candidates by using the GeNorm algorithm
NormFinder is like the GeNorm program, which can compute the stabilities of candidate genes expression levels in response to different drought stress conditions. Normfinder analysis shows that the lower the M value is, the more stable the gene expressionsis. ACT2 and EF-1α showed the smallest M value of 0.003, while RNA Pol II had the largest M value. Therefore, EF-1α and ACT2 were the most stable candidate genes in the Normfinder analysis, while RNA Pol II was the most unstable. The other candidate genes were ranked as follows in order of the M value: TUB > UBQ3 > ACT1 > UBQ2 > His > eIF > UBQ1 (Fig. 6).
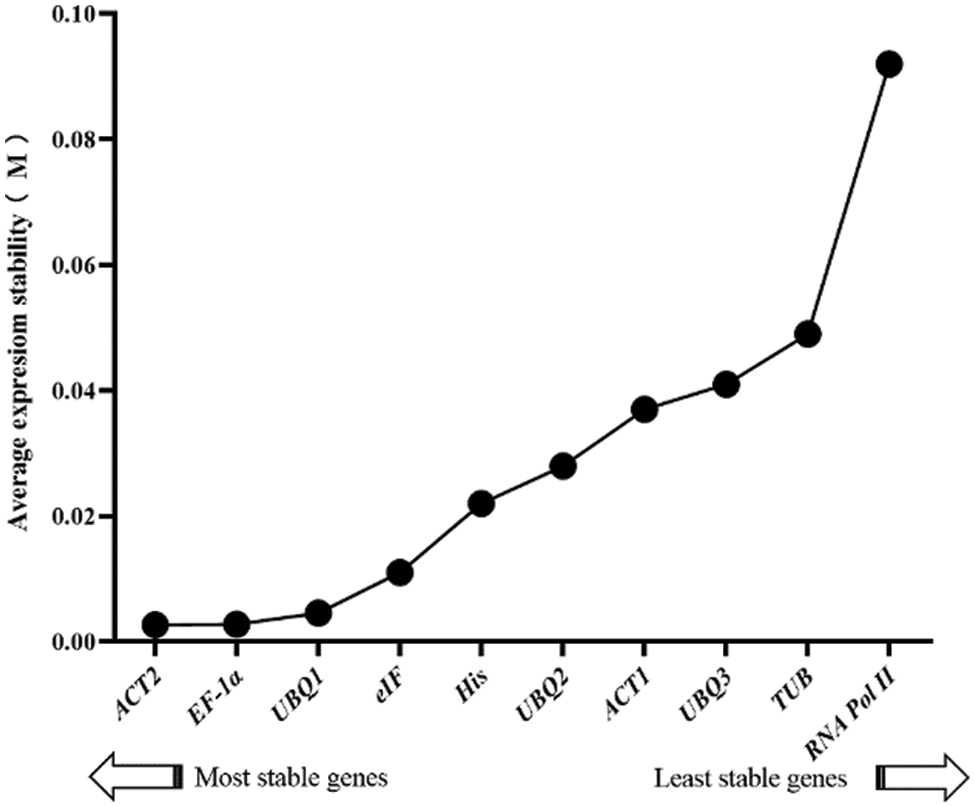
Figure 6: Expression stability values and ranking of 10 candidates genes according to the NormFinder algorithm
3.5 BestKeeper Software Analysis
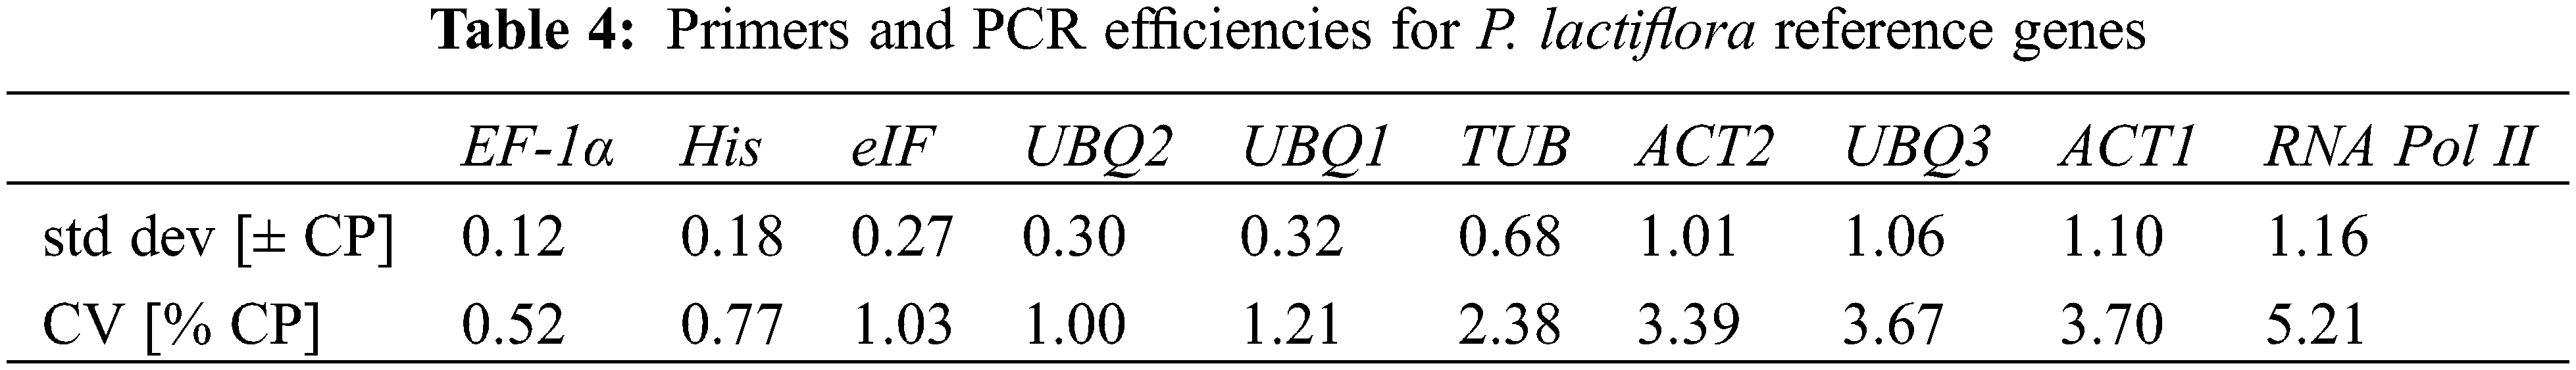
BestKeeper analysis uses the CV and SD values to compare the Ct values for measuring the stability of genes. If the SD value is greater than 1, the gene cannot be stably expressed; otherwise, it can be stably expressed. The SD values of ACT2 (1.01), UBQ3 (1.06), ACT1 (1.10), and RNA Pol II (1.16) were all greater than 1 (Table 4), so they could not be stably expressed. The SD values of the remaining candidate genes were all smaller than 1, so they could be expressed stably. Among them, EF-1α had the most stable expression, due to its lowest SD value (0.12), which was the most suitable selection of the candidate reference gene in response to drought stress.
RefFinder, is an analysis method composed of GeNorm, Normfinder, BestKeeper and comparative ∆Ct, which is a comprehensive tool. Each program comprehensively ranks the selected genes based on their Ct value, assigns appropriate weights to each gene according to the ranking of each program, and computes the geometric means of the weights to receive the final entire rankings.
The result of the re-rank order analysis was as follows: ACT2 > EF-1α > UBQ1 > His > eIF > UBQ2 > UBQ3 > ACT1 > TUB > RNA Pol II. Thereby, ACT2 was the most stable gene, while RNA Pol II presented the most unstable expression (Fig. 7).
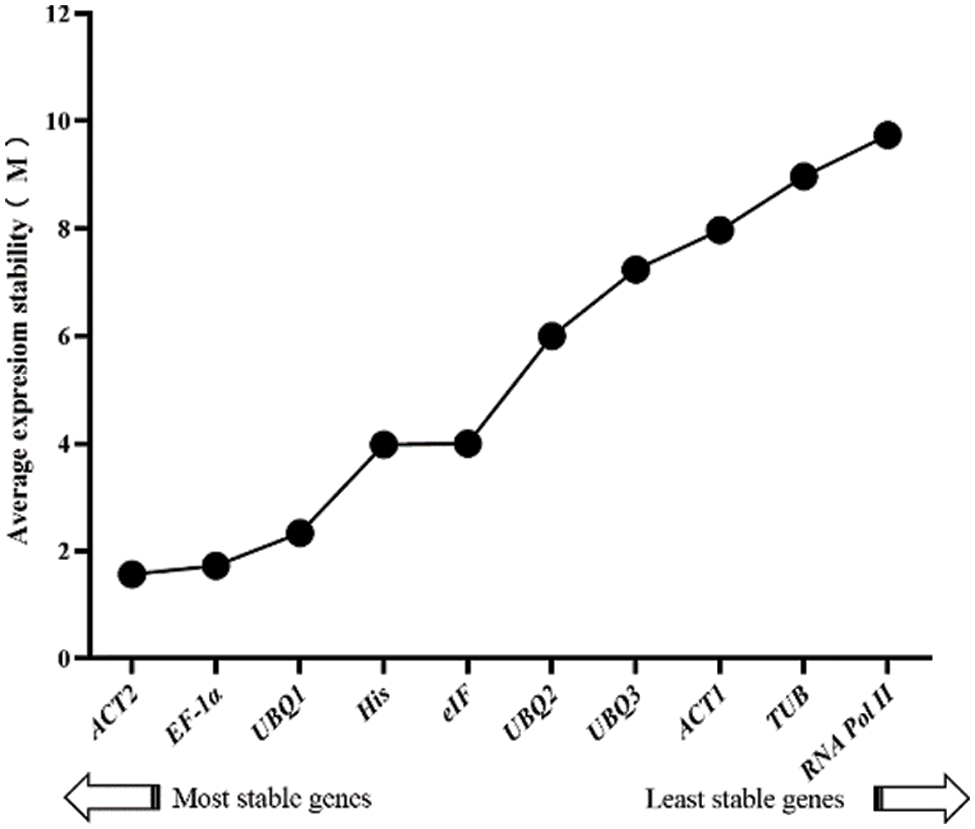
Figure 7: Comprehensive stability analysis of 10 candidates with RefFinder
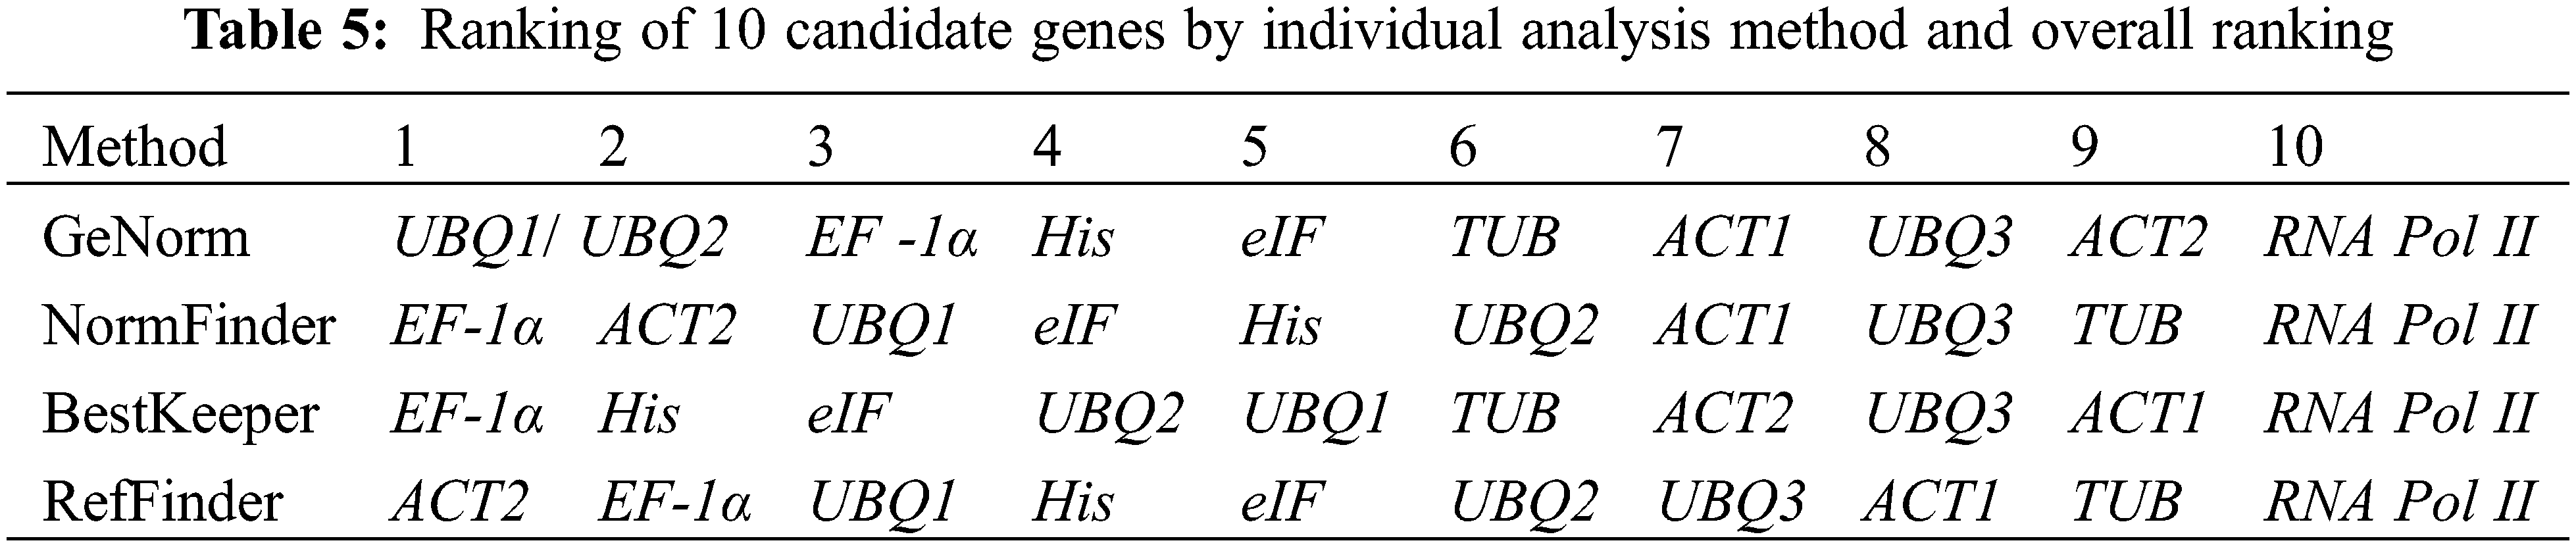
In summary, combined with the four analyses (GeNorm, BestKeeper, NormFinder and RefFinder), an overall ranking for 10 reference genes was performed (Table 5), EF-1α > UBQ1 > His > eIF > UBQ2 > ACT2 > TUB > ACT1 ≥ UBQ3 > RNA Pol II. EF-1α had a good ranking, and EF-1α could serve as the best reference gene in response to drought stress. Besides, the 0.15 threshold was proposed by GeNorm to determine the optimal reference gene numbers, and the standard was as follows: if Vn/Vn+1 value < 0.15, the optimal number is n; otherwise, the optimal number is n+1. In this study, UBQ1 and UBQ2 were the optimal combination for accurate qRT-PCR analysis in P. lactiflora with a 0.097 of V2/V3 value in various drought stress conditions.
qRT-PCR has been extensively applied in numerous fields of molecular biology because of the high throughput at the mRNA level, its high sensitivity and specificity [7,8]. However, no reference gene can be consistently expressed without a species restriction, biological stress, or abiotic stress. Accordingly, it is remarkably significant to identify distinct reference genes in distinct species and external conditions, which is pivotal to achieving the expressions of target genes.
However, no study has been reported on reference gene selection for P. lactiflora in response to environmental stress, and the reference gene screening for P. lactiflora has only been studied in different development stages and different tissues and organs of flowers [34]. The results showed that, accurate gene expression results can be obtained by using the combination of GAPDH and UBQ with the most stable expression [34]. Regarding the further development of experimental research, reference genes upon different stress conditions are able to be screened for specific scientific problems, such as exogenous material stress [35], water stress [36], temperature stress [37], salt stress [38], etc. With the increase of the medicinal and industrial value of P. lactiflora, its planting scale is also expanding. Due to the physiological properties of P. lactiflora, cultivation in semi-arid and arid regions are limited. More and more studies on P. lactiflora in response to drought stress have been reported. Hence, it is remarkably significant to obtain proper reference genes to reveal the key mechanisms of drought stress.
GeNorm, BestKeeper, NormFinder, and RefFinder were selected to analyze the stabilities of the selected candidate genes. GeNorm is applied in the screening of any count of reference genes in any experiment, and finally the selected two or more reference gene combinations are applied to rectify the data, which can improve the accuracy. The program picks reference genes with more stability by calculation of the M value. The criterion was that the lower the M value, the better the stability of the reference gene. NormFinder analysis algorithm is like GeNorm analysis. It also received the stable expression values of internal reference genes first, and then chooses the most appropriate internal reference gene with the size of the stable expression value. The criterion for judgment is that the internal reference gene with the smallest stable expression value represents the most suitable internal reference gene. BestKeeper analysis is conducted to identify the reference genes with better stability by the comparisons of the standard deviation (SD), correlation coefficient (R) and coefficient of variation (CV) generated within each gene, while RefFinder analysis obtains a relatively comprehensive ranking of internal reference gene stability by combining GeNorm, BestKeeper and NormFinder with a special algorithm. The results obtained by the four analysis methods are different because of their unique calculation methods. Therefore, it is necessary to determine the final comprehensive ranking with the analysis outcomes of each algorithm.
In our research, we selected suitable reference genes using the FPKM values of unigenes in the transcriptomic data of P. lactiflora in response to drought stress, and set a certain threshold, namely log2 (DT/CK), set the range of −0.1~0.1. At this point, we obtained 10 candidate reference genes, and then evaluated the 10 candidate genes using four analysis methods to choose the optimal reference genes, including GeNorm Analysis, BestKeeper Software Analysis, NormFinder Analysis, and RefFinder Analysis. There were certain differences in each evaluation result in that the above 5 analysis methods adopt different algorithms. According to GeNorm Analysis, β-TUB and RNA Pol II were the optimal internal reference genes for P. ostii in response to different drought stresses [29]. It is different from P. ostii that even though P. ostii and P. lactiflora share 99% homology, the selections of reference genes are different in this research. UBQ1 and UBQ2 were confirmed as the steadiest reference gene combination according to GeNorm analysis of P. lactiflora in response to different drought stress levels, indicating their stable expressions. NormFinder Analysis measures the stabilities of gene expression by the comparisons of the M values. Smaller M value demonstrates more stable the gene expression. ACT2 and EF-1α had the smallest M values (0.03), and EF-1α also ranked well in GeNorm Analysis. Meanwhile, EF-1α was also the candidate gene with the most stable expression in BestKeeper Analysis, which was consistent with NormFinder Analysis outcomes. RefFinder Analysis showed that RNA Pol II was the most stably expressed reference gene in response to numerous drought stress conditions, which was consistent with the results of the homologous plant P. lactiflora. Due to the different algorithms of the four analysis methods, EF-1α was the most stable internal reference gene in response to various levels of gratitude stress (Table 4) after the comprehensive evaluation.
In this research, the selection of 10 candidate reference genes (UBQ2, UBQ1, EF-1α, His, eIF, TUB, ACT1, UBQ3, ACT2 and RNA Pol II) was conducted by using GeNorm, NormFinder, BestKeeper and RefFinder to appraise the expression stabilities of 10 candidate genes selected from P. lactiflora RNA-seq in response to different drought stress conditions. The results showed that EF-1α was the best choice among the 10 reference genes which can be utilized to relatively quantify the expression level of the target gene. Besides, UBQ1 and UBQ2 could also be considered as the best reference gene combination by GeNorm analysis. Our study provides the selection of reference genes of P. lactiflora in response to different drought stress conditions and ensures the accuracy and precision of gene expression analysis.
Authorship: Conceptualization, Z.S. and D.Z.; methodology, D.Z.; software, Z.S.; validation, J.T. and D.Z.; formal analysis, Z.S., Y.L. and C.X.; investigation, Z.S., Y.L. and C.X.; resources, D.Z.; data curation, Z.S., Y.L. and C.X.; writing—original draft preparation, S.Z. and L.Y.; writing—review and editing, D.Z. and J.T.; visualization, Z.S. and D.Z.; supervision, D.Z. and J.T.; project administration, D.Z.; funding acquisition, D.Z. All authors have read and agreed to the published version of the manuscript.
Funding Statement: This research was funded by Jiangsu Agricultural Science and Technology Innovation Fund [CX (20)2030 to J.T.], Qing Lan Project of Jiangsu Province and High-Level Talent Support Program of Yangzhou University. The Key Disciplines of Jiangsu Province.
Conflicts of Interest: The authors declare that they have no conflicts of interest to report regarding the present study.
References
1. Martínez-Beamonte, R., Navarro, M. A., Larraga, A., Strunk, M., Barranquero, M. et al. (2011). Selection of reference genes for gene expression studies in rats. Journal of Biotechnology, 151(4), 325–334. DOI 10.1016/j.jbiotec.2010.12.017. [Google Scholar] [CrossRef]
2. Li, H., Ni, D. H., Duan, Y. B., Chen, Y., Li, J. et al. (2013). Quantitative detection of the rice false smut pathogen Ustilaginoidea virens by real-time PCR. Genetics and Molecular Research, 12(4), 6433–6441. DOI 10.4238/2013.December.10.4. [Google Scholar] [CrossRef]
3. Yu, S. H., Yang, P., Sun, T., Qi, Q., Wang, X. Q. et al. (2016). Identification and evaluation of reference genes in the Chinese white wax scale insect Ericerus pela. SpringerPlus, 5(1), 791. DOI 10.1186/s40064-016-2548-z. [Google Scholar] [CrossRef]
4. Tan, Y., Zhou, X. R., Pang, B. P. (2017). Reference gene selection and evaluation for expression analysis using qRT-PCR in Galeruca daurica (Joannis). Bulletin of Entomological Research, 107(3), 359–368. DOI 10.1017/s0007485316000948. [Google Scholar] [CrossRef]
5. Dong, Z., Chen, P., Zhang, N., Huang, S., Zhang, H. et al. (2019). Evaluation of reference genes for quantitative real-time PCR analysis of gene expression in Hainan medaka (Oryzias curvinotus). Gene Reports, 14(1), 94–99. DOI 10.1016/j.genrep.2018.11.008. [Google Scholar] [CrossRef]
6. Chen, C., Wu, J., Hua, Q., Tel-Zur, N., Xie, F. et al. (2019). Identification of reliable reference genes for quantitative real-time PCR normalization in pitaya. Plant Methods, 15(1), 70. DOI 10.1186/s13007-019-0455-3. [Google Scholar] [CrossRef]
7. Heid, C. A., Stevens, J., Livak, K. J., Williams, P. M. (1996). Real time quantitative PCR. Genome Research, 6(10), 986–994. DOI 10.1101/gr.6.10.986. [Google Scholar] [CrossRef]
8. Ginzinger, D. G. (2002). Gene quantification using real-time quantitative PCR: An emerging technology hits the mainstream. Experimental Hematology, 30(8), 503–512. DOI 10.1016/s0301-472x(02)00806-8. [Google Scholar] [CrossRef]
9. Bustin, S. A., Benes, V., Garson, J. A., Hellemans, J., Huggett, J. et al. (2009). The MIQE guidelines: Minimum information for publication of quantitative real-time PCR experiments. Clinical Chemistry, 55(4), 611–622. DOI 10.1373/clinchem.2008.112797. [Google Scholar] [CrossRef]
10. Andersen, C. L., Jensen, J. L., Ørntoft, T. F. (2004). Normalization of real-time quantitative reverse transcription-PCR data: A model-based variance estimation approach to identify genes suited for normalization, applied to bladder and colon cancer data sets. Cancer Research, 64(15), 5245–5250. DOI 10.1158/0008-5472.Can-04-0496. [Google Scholar] [CrossRef]
11. Expósito-Rodríguez, M., Borges, A. A., Borges-Pérez, A., Pérez, J. A. (2008). Selection of internal control genes for quantitative real-time RT-PCR studies during tomato development process. BMC Plant Biology, 8(1), 131. DOI 10.1186/1471-2229-8-131. [Google Scholar] [CrossRef]
12. Shin, R., Schachtman, D. P. (2004). Hydrogen peroxide mediates plant root cell response to nutrient deprivation. PNAS, 101(23), 8827–8832. DOI 10.1073/pnas.0401707101. [Google Scholar] [CrossRef]
13. Li, L., Xu, J., Xu, Z. H., Xue, H. W. (2005). Brassinosteroids stimulate plant tropisms through modulation of polar auxin transport in Brassica and Arabidopsis. Plant Cell, 17(10), 2738–2753. DOI 10.1105/tpc.105.034397. [Google Scholar] [CrossRef]
14. Jeong, Y. M., Mun, J. H., Lee, I., Woo, J. C., Hong, C. B. et al. (2006). Distinct roles of the first introns on the expression of Arabidopsis profilin gene family members. Plant Physiology, 140(1), 196–209. DOI 10.1104/pp.105.071316. [Google Scholar] [CrossRef]
15. Wang, X., Wu, Z., Bao, W., Hu, H., Chen, M. et al. (2019). Identification and evaluation of reference genes for quantitative real-time PCR analysis in Polygonum cuspidatum based on transcriptome data. BMC Plant Biology, 19(1), 498. DOI 10.1186/s12870-019-2108-0. [Google Scholar] [CrossRef]
16. Hu, Y., Deng, T., Chen, L., Wu, H., Zhang, S. (2016). Selection and validation of reference genes for qRT-PCR in Cycas elongata. PLoS One, 11(4), e0154384. DOI 10.1371/journal.pone.0154384. [Google Scholar] [CrossRef]
17. Li, Q., Fan, C. M., Zhang, X. M., Fu, Y. F. (2012). Validation of reference genes for real-time quantitative PCR normalization in soybean developmental and germinating seeds. Plant Cell Reports, 31(10), 1789–1798. DOI 10.1007/s00299-012-1282-4. [Google Scholar] [CrossRef]
18. Hao, X., Horvath, D. P., Chao, W. S., Yang, Y., Wang, X. et al. (2014). Identification and evaluation of reliable reference genes for quantitative real-time PCR analysis in tea plant (Camellia sinensis (L.) O. Kuntze). International Journal of Molecular Science, 15(12), 22155–22172. DOI 10.3390/ijms151222155. [Google Scholar] [CrossRef]
19. Wang, J. J., Han, S., Yin, W., Xia, X., Liu, C. (2018). Comparison of reliable reference genes following different hormone treatments by various algorithms for qRT-PCR analysis of metasequoia. International Journal of Molecular Science, 20(1), 34. DOI 10.3390/ijms20010034. [Google Scholar] [CrossRef]
20. Kong, Q., Yuan, J., Gao, L., Zhao, S., Jiang, W. et al. (2014). Identification of suitable reference genes for gene expression normalization in qRT-PCR analysis in watermelon. PLoS One, 9(2), e90612. DOI 10.1371/journal.pone.0090612. [Google Scholar] [CrossRef]
21. Li, Z., Lu, H., He, Z., Wang, C., Wang, Y. et al. (2019). Selection of appropriate reference genes for quantitative real-time reverse transcription PCR in Betula platyphylla under salt and osmotic stress conditions. PLoS One, 14(12), e0225926. DOI 10.1371/journal.pone.0225926. [Google Scholar] [CrossRef]
22. Yang, Z., Zhang, R., Zhou, Z. (2021). Identification and validation of reference genes for gene expression analysis in Schima superba. Genes, 12(5), 732. DOI 10.3390/genes12050732. [Google Scholar] [CrossRef]
23. Guan, S., Qiu, S., Mei, M., Hao, X., Zhang, X. et al. (2022). Assessment of appropriate reference genes for quantitative real-time polymerase chain reaction normalisation in Magnolia sieboldii K. Koch across various experimental conditions. Polish Journal of Environmental Study, 31(3), 2103–2116. DOI 10.15244/pjoes/143508. [Google Scholar] [CrossRef]
24. Dong, X., Zhang, W., Zhang, S. (2022). Selection and validation of reference genes for quantitative real-time PCR analysis of development and tissue-dependent flower color formation in cymbidium lowianum. International Journal of Molecular Sciences, 23(2), 738. DOI 10.3390/ijms23020738. [Google Scholar] [CrossRef]
25. Li, F., Cheng, Y., Ma, L., Li, S., Wang, J. (2022). Identification of reference genes provides functional insights into meiotic recombination suppressors in Gerbera hybrida. Horticultural Plant Journal, 8(1), 123–132. DOI 10.1016/j.hpj.2020.09.008. [Google Scholar] [CrossRef]
26. Wu, Y., Li, T., Cheng, Z., Zhao, D., Tao, J. (2021). R2R3-MYB transcription factor PlMYB108 confers drought tolerance in herbaceous peony (Paeonia lactiflora Pall.). International Journal of Molecular Sciences, 22(21), 11884. DOI 10.3390/ijms222111884. [Google Scholar] [CrossRef]
27. Wan, Y., Hong, A., Zhang, Y., Liu, Y. (2019). Selection and validation of reference genes of Paeonia lactiflora in growth development and light stress. Physiology and Molecular Biology of Plants, 25(4), 1097–1105. DOI 10.1007/s12298-019-00684-2. [Google Scholar] [CrossRef]
28. Zhao, D., Tao, J., Han, C., Ge, J. (2012). Actin as an alternative internal control gene for gene expression analysis in herbaceous peony (Paeonia lactiflora Pall.). African Journal of Agricultural Research, 7(14), 2153–2159. DOI 10.5897/AJAR11.1613. [Google Scholar] [CrossRef]
29. Luan, Y., Xu, C., Wang, X., Zhao, D., Tao, J. (2022). Selection of stable reference genes for quantitative real-time PCR on Paeonia ostii T. Hong et J. X. Zhang leaves exposed to different drought stress conditions. Phyton-International Journal of Experimental Botany, 91(5), 1045–1059. [Google Scholar]
30. Zhang, Y., Liu, F., Guo, H., Ma, H., Chen, H. et al. (2022). Selection of reference genes for quantitative real-time PCR analysis in Lathyrus sativus L. under different development stages and drought stress. Genetic Resources and Crop Evolution, 69(7), 2319–2330. DOI 10.1007/s10722-022-01374-x. [Google Scholar] [CrossRef]
31. Chen, M. D., Wang, B., Li, Y. P., Zeng, M. J., Liu, J. T. et al. (2021). Reference gene selection for qRT-PCR analyses of luffa (Luffa cylindrica) plants under abiotic stress conditions. Scientific Reports, 11(1), 3161. DOI 10.1038/s41598-021-81524-w. [Google Scholar] [CrossRef]
32. Vandesompele, J., de Preter, K., Pattyn, F., Poppe, B., van Roy, N. et al. (2002). Accurate normalization of real—time quantitative RT-PCR data by geometric averaging of multiple internal control genes. Genome Biology, 3(7), 1–12. DOI 10.1186/gb-2002-3-7-research0034. [Google Scholar] [CrossRef]
33. Pfaffl, M. W., Tichopad, A., Prgomet, C., Neuvians, T. P. (2004). Determination of stable housekeeping genes, differentially regulated target genes and sample integrity: BestKeeper-Excel-based tool using pair-wise correlations. Biotechnology Letters, 26(6), 509–515. DOI 10.1023/b:bile.0000019559.84305.47. [Google Scholar] [CrossRef]
34. Li, J. (2017). Selection and validation of reference genes for quantitative real-time PCR in herbaceous peony. Molecular Plant Breeding, 15, 2544–2549. [Google Scholar]
35. Zhou, L. Y., Mo, G., Wang, S., Tang, J. F., Yue, H. et al. (2014). Stability analysis of reference gene based on real-time PCR in Artemisia annua under cadmium treatment. Zhongguo Zhong Yao Za Zhi, 39, 777–784 (in Chinese). [Google Scholar]
36. de Andrade, L. M., Dos Santos Brito, M., Fávero Peixoto Junior, R., Marchiori, P. E. R., Nóbile, P. M. et al. (2017). Reference genes for normalization of qPCR assays in sugarcane plants under water deficit. Plant Methods, 13(1), 28. DOI 10.1186/s13007-017-0178-2. [Google Scholar] [CrossRef]
37. Ding, A., Bao, F., Zhang, T., Yang, W., Wang, J. et al. (2020). Screening of optimal reference genes for qRT-PCR and preliminary exploration of cold resistance mechanisms in Prunus mume and Prunus sibirica varieties. Molecular Biology Reports, 47(9), 6635–6647. DOI 10.1007/s11033-020-05714-x. [Google Scholar] [CrossRef]
38. Zhu, X., Wang, B., Wang, X., Wei, X. (2021). Screening of stable internal reference gene of Quinoa under hormone treatment and abiotic stress. Physiology and Molecular Biology of Plants, 27(11), 2459–2470. DOI 10.1007/s12298-021-01094-z. [Google Scholar] [CrossRef]
Cite This Article
 Copyright © 2023 The Author(s). Published by Tech Science Press.
This work is licensed under a Creative Commons Attribution 4.0 International License , which permits unrestricted use, distribution, and reproduction in any medium, provided the original work is properly cited.
 Downloads
 Citation Tools