
 Submit a Paper
 Propose a Special lssue
 Open Access
ARTICLE
B Class Floral Homeotic Genes are Involved in the Petal Identity and Flower Meristem Determinations in Chrysanthemum morifolium
State Key Laboratory of Crop Genetics and Germplasm Enhancement, Key Laboratory of Landscaping, Ministry of Agriculture and Rural Affairs, Key Laboratory of Biology of Ornamental Plants in East China, National Forestry and Grassland Administration, College of Horticulture, Nanjing Agricultural University, Nanjing, 210095, China
* Corresponding Author: Fadi Chen. Email:
Phyton-International Journal of Experimental Botany 2023, 92(2), 311-331. https://doi.org/10.32604/phyton.2022.023896
Received 17 May 2022; Accepted 20 June 2022; Issue published 12 October 2022
 View Full Text
 Download PDF
Abstract
Chrysanthemum morifolium, an ornamental crop with diverse forms of inflorescence, is a good model for studying flower development in Asteraceae. However, the genetic background is complex and the mechanisms of regulating flower development are still unclear. Here, we identified two natural mutant lines of chrysanthemum and named them M1 and M2 according to the severity of the phenotype. Both lines showed defects in petal identity, and the petals of the M1 line had a mild phenotype: partially loss of petal identity and conversion of petals into green, leaf-like organs. The M2 line had severe phenotypes: in addition to severe petal defects, secondary inflorescences were produced in the capitulum to replace the normal ray and disc florets, which indicated a transformation of a flower meristem into an inflorescence meristem. Transcriptome sequencing of WT and M2 inflorescences was performed and found altered expression of floral organ development A, B and E class genes, where B and E class genes were significantly down-regulated. qRT-PCR analysis in both M1 and M2 lines revealed that the expression of three chrysanthemum class B genes CmAP3.1, CmAP3.2 and CmPI, was negatively correlated with phenotypic severity. This suggests that class B genes in chrysanthemum not only have conserved functions in determining petal identity but also were involved in the determinacy of the flower meristem. This study provides insights into the functions of class B genes in flower development, and is informative for dissecting the molecular mechanisms of flower development in chrysanthemum.Keywords
In the plant kingdom, the morphological structure of the flower and its arrangement in the inflorescence is important for its reproductive and evolutionary success [1]. Asteraceae, a widespread plant phamily, bears a unique and complex inflorescence that is composed of structurally and functionally different types of flowers, which is the key morphological innovation associated with its evolutionary success [2]. Chrysanthemum morifolium (chrysanthemum), bears two types of florets in its inflorescence, female ray florets with pistil and zygomorphic petals, and hermaphroditic disc florets with pistil, stamen and actinomorphic petals [3]. The inflorescence morphology of chrysanthemum is defined by the morphology of the ray and disc floret and their relative number, which directly determines its ornamental value. Therefore, it is quite important to dissect the floral developmental molecular regulatory network of chrysanthemum.
The early ABC model of flower development proposed that class A genes regulate sepal development, classes A and B genes regulate petal development, classes B and C genes regulate stamen development and class C genes regulate carpel development [4,5]. Later, several class E genes are proposed to be involved in the development of all four whorls of floral organs [6,7]. The flower organ development ABCE model is relatively conserved in flowering plants except A class genes, which appear to function only in Arabidopsis and its relatives [2,5]. In Asteraceae, the functions of class A genes have diverged. There are at least six APETALA1(AP1)-like genes in Gerbera hybrida (gerbera), Gerbera SQUAMOSA (GSQUA) 1-6, which have different expression patterns and are not exclusively expressed in the perianth whorl. Ectopic expression of GSQUA2 causes early flowering and defective vegetative growth in gerbera, while an ortholog of AGAMOUS-LIKE 6 (AGL6), GRCD3 with A-function, is involved in the development of gerbera pappus [8]. Ectopic expression of the AP1-like gene Chrysanthemum Dendrathema grandiflorum MADS (CDM) 111 or sunflower Helianthus annuus MADS (HAM) 75 and HAM92 resultes in early flowering [9], and overexpression of AP1-like gene CmAP1L1 in chrysanthemum also leads to the same phenotype [10]. As for class B genes, down-regulation of the expression of Gerbera DEFICIENS (GDEF) 2 and Gerbera GLOBOSA-like (GGLO) 1 in gerbera leads to developmental defects in stamen and petal. Although the GDEF1 transgenic gerbera had a mild phenotype, developmental defects in stamens and petals also occurred. These results suggest that class B genes in gerbera are functionally conserved and involved in the regulation of petal and stamen development [11]. However, ectopic expression of chrysanthemum CDM19 (ortholog of AtAP3) in the Arabidopsis affects carpel development, and can partially complement the phenotypes of ap3-3 mutant in Arabidopsis, revealing that the chrysanthemum AP3-like gene may have a novel function. Two C class genes, Gerbera AGAMOUS-LIKE (GAGA) 1 and GAGA2, with very high sequence similarity, have been identified in gerbera, and after overexpression of GAGA2, the corona of all florets appears stamen-like form. And in the lines with reduced expression of GAGA2, the ray florets develop corolla-like organs in the third whorl instead of the wild-type staminodes, while in all florets the pistillode and corolla replace the pistil as the fourth whorl, suggesting that gerbera GAGA1 and GAGA2 have the typical functions of C class genes [12]. In chrysanthemum, down-regulation of the class C gene CAG results in the conversion of stamens and pistils into corolla-like tissue, suggesting that the function of class C genes in chrysanthemum is also relatively conserved [13]. As for E class genes, the first reported class E gene in Asteraceae was GERBERA REGULATOR OF CAPITULUM DEVELOPMENT1 (GRCD1). GRCD1 was expressed in all four whorls of floral organs, with the highest expression in the third whorl. Down-regulation of GRCD1 expression results in the conversion of the staminodes of the third whorl florets into petals, suggesting that GRCD1 may be involved in determining the identity of the third whorl of floral organs in gerbera [14]. GRCD2 is highly expressed in early inflorescence tissues, and down-regulation of GRCD2 leads to the replacement of carpels by petal-like organs, suggesting that GRCD2 is involved in the determination of the identity of the fourth whorl floral organ in gerbera [8]. GRCD4 and GRCD5 are two partially functionally redundant SEP genes, both highly expressed in the pappus and petals (whorl 1 and 2 floral organs). Down-regulation of the expression of both genes leads to defects in petal development, suggesting that they may be involved in the development of the second whorl floral organs in gerbera [8].
In this study, we found two natural mutant lines of chrysanthemum, the M1 line with a mild phenotype showed defect in petal development, and the M2 line with the severe phenotype exhibited a transition from the flower meristem (FM) to the inflorescence meristem (IM) in addition to a significant petal developmental defect. Therefore, we performed transcriptome sequencing and gene expression analysis, aiming to identify genes associated with chrysanthemum petal development and floral meristem determinacy. The results suggested that class B and class E genes are involved in petal specification, and class B genes may be involved in FM identity determination.
2.1 Plant Materials, Tissue Collection, and Morphological Analysis
The WT and mutants of chrysanthemum were cultivated in a greenhouse, which is under artificial short daylight conditions of 8 h light/16 h dark. Temperature and humidity are managed using standard cultivation practices of a day/night temperature of 26°C/18°C and ∼70% relative humidity. Morphological observations were performed using the inflorescence at full bloom stage. The morphological structure of the florets was observed using a stereomicroscope (Olympus, Japan) and the entire inflorescence were taken for RNA extraction.
2.2 RNA Extraction and RNA-seq Analysis
We used commercial kits (Huayueyang, China) and performed RNA extraction from plant tissues according to the manufacturer’s instructions. Six RNA samples were obtained, including three biological replicates each of wild type and M2. The RNA samples were used for library preparation with NEBNext® Ultra™ RNA Library Prep Kit for Illumina. After removing adapters, tracts of poly N and low-quality reads, the remaining reads were assembled using Trinity software (v2.4.0) [15]. The unpublished chrysanthemum genome was used as the reference genome. Clean reads were aligned to the reference genome with hisat2 (2.0.5), and the alignment results were processed using featureCounts (1.5.0-p3) [16] for gene quantification. Differential expression analysis of two samples (each with three biological replications) was performed using the DESeq2 R package (1.16.1). The resulting P-values were adjusted using Benjamini and Hochberg’s approach for controlling the false discovery rate. Genes with an adjusted P-value < 0.05 found by DESeq2 were assigned as differentially expressed genes. The RNA-seq raw data of 6 samples generated in this study have been deposited in the National Center for Biotechnology Information (NCBI) under accession number PRJNA838643.
2.3 GO and KEGG Enrichment Analysis
Gene Ontology (GO) enrichment analysis of differentially expressed genes was implemented by the clusterProfiler R package, in which gene length bias was corrected. GO terms with corrected P-value < 0.05 were considered significantly enriched by differential expressed genes.
KEGG is a database resource for understanding high-level functions and utilities of the biological system. We used clusterProfiler R package to test the statistical enrichment of differential expression genes in KEGG pathways.
2.4 Heatmap and Construction of Phylogenic Trees
TBtools was used to generate heatmap using log2 normalized FPKMs of samples. The sequences of A, B and E class genes were obtained from NCBI, TAIR databases, and our transcriptome data. Multiple sequence alignment of protein sequences was performed by MUSCLE software [17]. A phylogenetic tree based on the maximum likelihood method of the JTT matrix model [18] was constructed using MEGA-X [19]. Internal branch support was estimated using 500 bootstrap replicates.
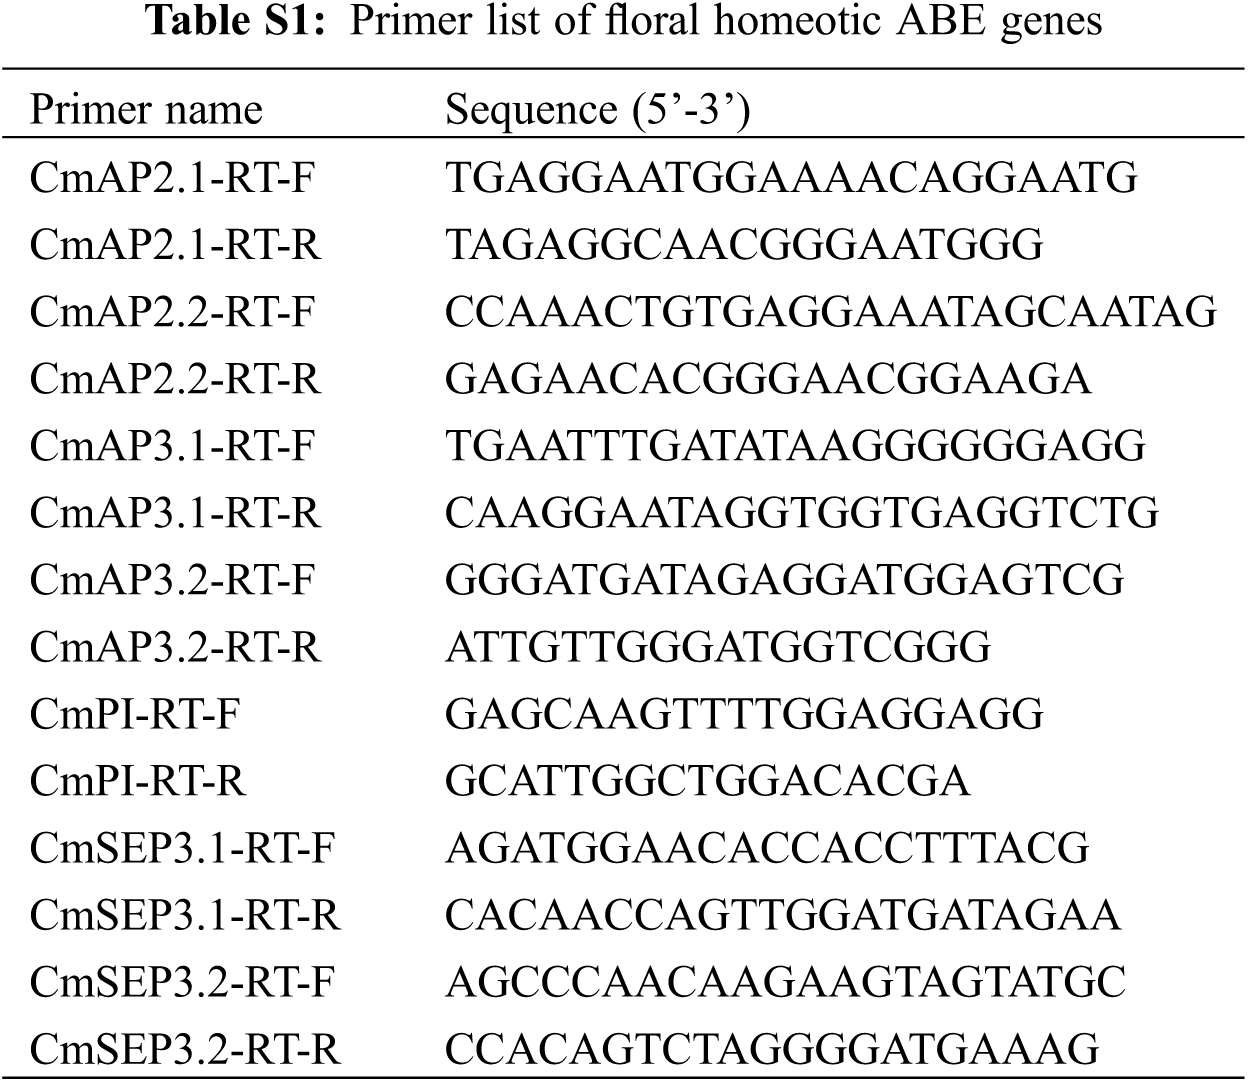
RNA was extracted from the inflorescences at the full bloom stage, which was used in the next reverse transcription experiments. The PrimeScript RT reagent kit (TaKaRa, Japan) were used for cDNA synthesis and SYBR Premix Ex Taq II kit (TaKaRa, Japan) for the qRT-PCR which was performed on LightCycler 480 (Roche, Switzerland). Three biological replicates and three technical replicates were applied to each sample of qRT-PCR analysis. CmEF1α [20] was used as a reference gene for the 2−ΔΔCT method [21]. The primer sequences were obtained using Primer Premier (v5.0) (Table S1).
3.1 Characterization of the Chrysanthemum Mutants
Two flower development mutant lines with different phenotypic severity were found in a greenhouse. The line with the mild phenotype was named Mutant 1 (M1) and the one with the severe phenotype was named Mutant 2 (M2). There was no significant difference between the wild type and the mutants in terms of stature and plant height (Figs. 1A–1C). Both the M1 and M2 lines showed highly modified inflorescence phenotypes, which were significantly distinct from the WT plants. In the mild M1 line, we found loss of petal identity and transformation of petals to green, leaf-like, or bract-like organs. In the more severe line M2, we found not only the loss of floral organ identity, but also the production of many secondary inflorescences instead of normal ray and disc florets, indicating the conversion of a floret into an inflorescence (Fig. 2G). Further analysis showed the florets of the wild-type line with typical pink ray floret petals (Fig. 2B) and yellow disc floret petals (Fig. 2C). The florets of M1 differentiated normally and still had the typical bilateral symmetrical ray florets (Fig. 2E) and radiate disc florets (Fig. 2F), but their colors all turned green and its ray flower petals showed the partial transformation of petals into leaf-like structures (Fig. 2E). The florets of M2 were not differentiated into ray and disk flowers, but developed into an inflorescence-like structure with multiple whorls of bract-like organs (Figs. 2G and 2H). After dissecting the peripheral bract-like structures, a developing inflorescence primordium-like structure was seen in the center (Fig. 2I, red arrow).

Figure 1: Phenotype analysis of wild type and mutant lines. (A)–(C) Side view of the plants of wild type, Mutant 1 and Mutant 2, respectively; (D)–(F) Top view of the plants of wild type, Mutant 1 and Mutant 2, respectively; Bar = 3 cm

Figure 2: Morphological observation of inflorescences and florets of wild type and mutant lines. (A) Inflorescence morphology at the early bloom stage of the wild type, Bar = 2 mm; (B)–(C) Ray and disc floret morphology at the early bloom stage of the wild type, Bar = 1 mm; (D) Inflorescence morphology at the early bloom stage of the Mutant 1, Bar = 2 mm; (E)–(F) Ray and disc floret morphology at the early bloom stage of the Mutant 1, Bar = 1 mm; (G) Inflorescence morphology of the Mutant 2, Bar = 1 cm; (H)–(I) Secondary inflorescence of the Mutant 2; the secondary inflorescence and the IM were pointed by the red arrows in G and I, respectively. Bar = 1 mm
To obtain gene expression profiles of chrysanthemum mutant inflorescences, RNA sequencing (RNA-seq) data were generated from the whole inflorescence of M2 and WT lines, each sample with three biological replicates. The mean number of reads was 44,279,558 (range 41,043,916–46,786,004), and 81.69% were able to map to the genome on average (range 81.33%–82.02%). Normalized read counts (Fragments Per Kilobase of exon model per Million mapped fragments, FPKM) for each gene were calculated, and genes with FPKM values lower than 0.5 were considered not expressed.
The FPKM-based estimates of transcript abundance were highly correlated between the replicates of each sample (Pearson correlation coefficient [PCC] 0.80–1.00) (Fig. 3B). Principal component analysis (PCA) proved that biological replicates of each sample were very similar to each other (Fig. 3A). These results demonstrate that the samples had good repeatability. There were 54,032 genes expressed in both samples (Fig. 3C), and we identified a total of 22,970 significantly differentially expressed genes, of which 12,551 were down-regulated and 10,419 were up-regulated (Fig. 3D).

Figure 3: Sample correlation analysis and number of differentially expressed genes. (A) Principal component analysis. Principal component analysis of transcriptional profiles in WTIF (wild type inflorescence) and MIF (Mutant 2 inflorescence). (B) Pearson correlation analysis. Pearson correlation between the sample of WTIF and MIF with three biological replicates. (C) The overlap of differential transcription between WTIF and MIF. (D) Number of significantly differentially expressed genes in the transcriptome
We performed GO enrichment analysis and KEGG (Kyoto Encyclopedia of Genes and Genomes) enrichment analysis on the differentially expressed genes. The gene expression patterns of 19832 DEGs were subjected to enrichment analysis.
GO is a comprehensive database describing the function of genes and is divided into three sections: biological process (BP), cellular component (CC) and molecular function (MF). GO enrichment analysis revealed multiple stress-related pathways in DEGs (Fig. 4). As the GO enrichment analysis showed, in the BP section, DEGs were significantly enriched in response to chemical (GO:0042221), response to oxygen-containing compound (GO:1901700), response to abiotic stimulus (GO:0009628), response to acid chemical (GO:0001101) and response to stress (GO:0006950) (Fig. S2). In the MF part, DEGs were mainly enriched in catalytic activity (GO:0003824), transcription regulatory region sequence-specific DNA binding (GO:0000976), transcription regulatory region DNA binding (GO:0044212), regulatory region DNA binding (GO:0000975) and regulatory region nucleic acid binding (GO:0001067) (Fig. S3). And in the CC part, genes were significantly enriched in cell (GO:0005623), cell part (GO:0044464), intracellular membrane-bounded organelle (GO:0043231), membrane-bounded organelle (GO:0043227) and intracellular part (GO:0044424) (Fig. S4). The GO enrichment analysis of BP showed that abiotic stress-related genes were significantly differentially expressed in the mutant, including water stress, chemical stress and etc., suggesting that the phenotypes of flower development may be related to the multiple stresses to which plants are exposed.

Figure 4: Top 20 terms of GO enrichment analysis. Terms of response to multiple stress were pointed by red asterisks
KEGG enrichment analysis showed DEGs mainly enriched in Metabolic pathways (ko01100), Biosynthesis of secondary metabolites (ko01110), MAPK signaling pathway (ko04016), Plant-pathogen interaction (ko04626), Linoleic acid metabolism (ko00591), alpha-Linolenic acid metabolism (ko00592), Phenylpropanoid biosynthesis (ko00940), Biosynthesis of unsaturated fatty acids (ko01040), Fatty acid metabolism (ko01212) and Flavonoid biosynthesis (ko00941) (Fig. 5). KEGG enrichment results showed that the DEGs were mainly enriched in plant secondary metabolic processes including phenylpropanoid biosynthesis and flavonoid biosynthesis and lipid metabolism related to plant defense. Lipids are an important component of biological membranes and have a vital role in the interaction between plant cells and environment. In response to abiotic stresses such as temperature and drought, lipid metabolic signaling pathways can respond rapidly and function in stress resistance [22]. Lipid metabolism is also involved in plant defense against biotic stresses, and the common fatty acids in plants are palmitic, stearic, oleic, linoleic and linolenic acids, of which the levels of 18:1, 18:2 and 18:3 unsaturated fatty acids significantly affect the plant defense response [23]. The results of the KEGG enrichment analysis indicated that the DEGs were enriched in lipid metabolic processes, which are involved in plant defense and stress response, suggesting that the phenotypes of flower development may be related to defense and stress response. Moreover, the DEGs are enriched in phytohormone-related pathways, including tryptophan metabolism (ko00380), zeatin biosynthesis (ko00908) and Brassinosteroid biosynthesis (ko00905), indicating that in addition to lipid metabolism, auxin, cytokinin and brassinosteroid signaling pathways may also be involved in regulating flower development.

Figure 5: Top 20 terms of KEGG enrichment analysis. Lipid-related terms were pointed by asterisks
3.4 Flower Development Genes Differentially Expressed in Mutant Line
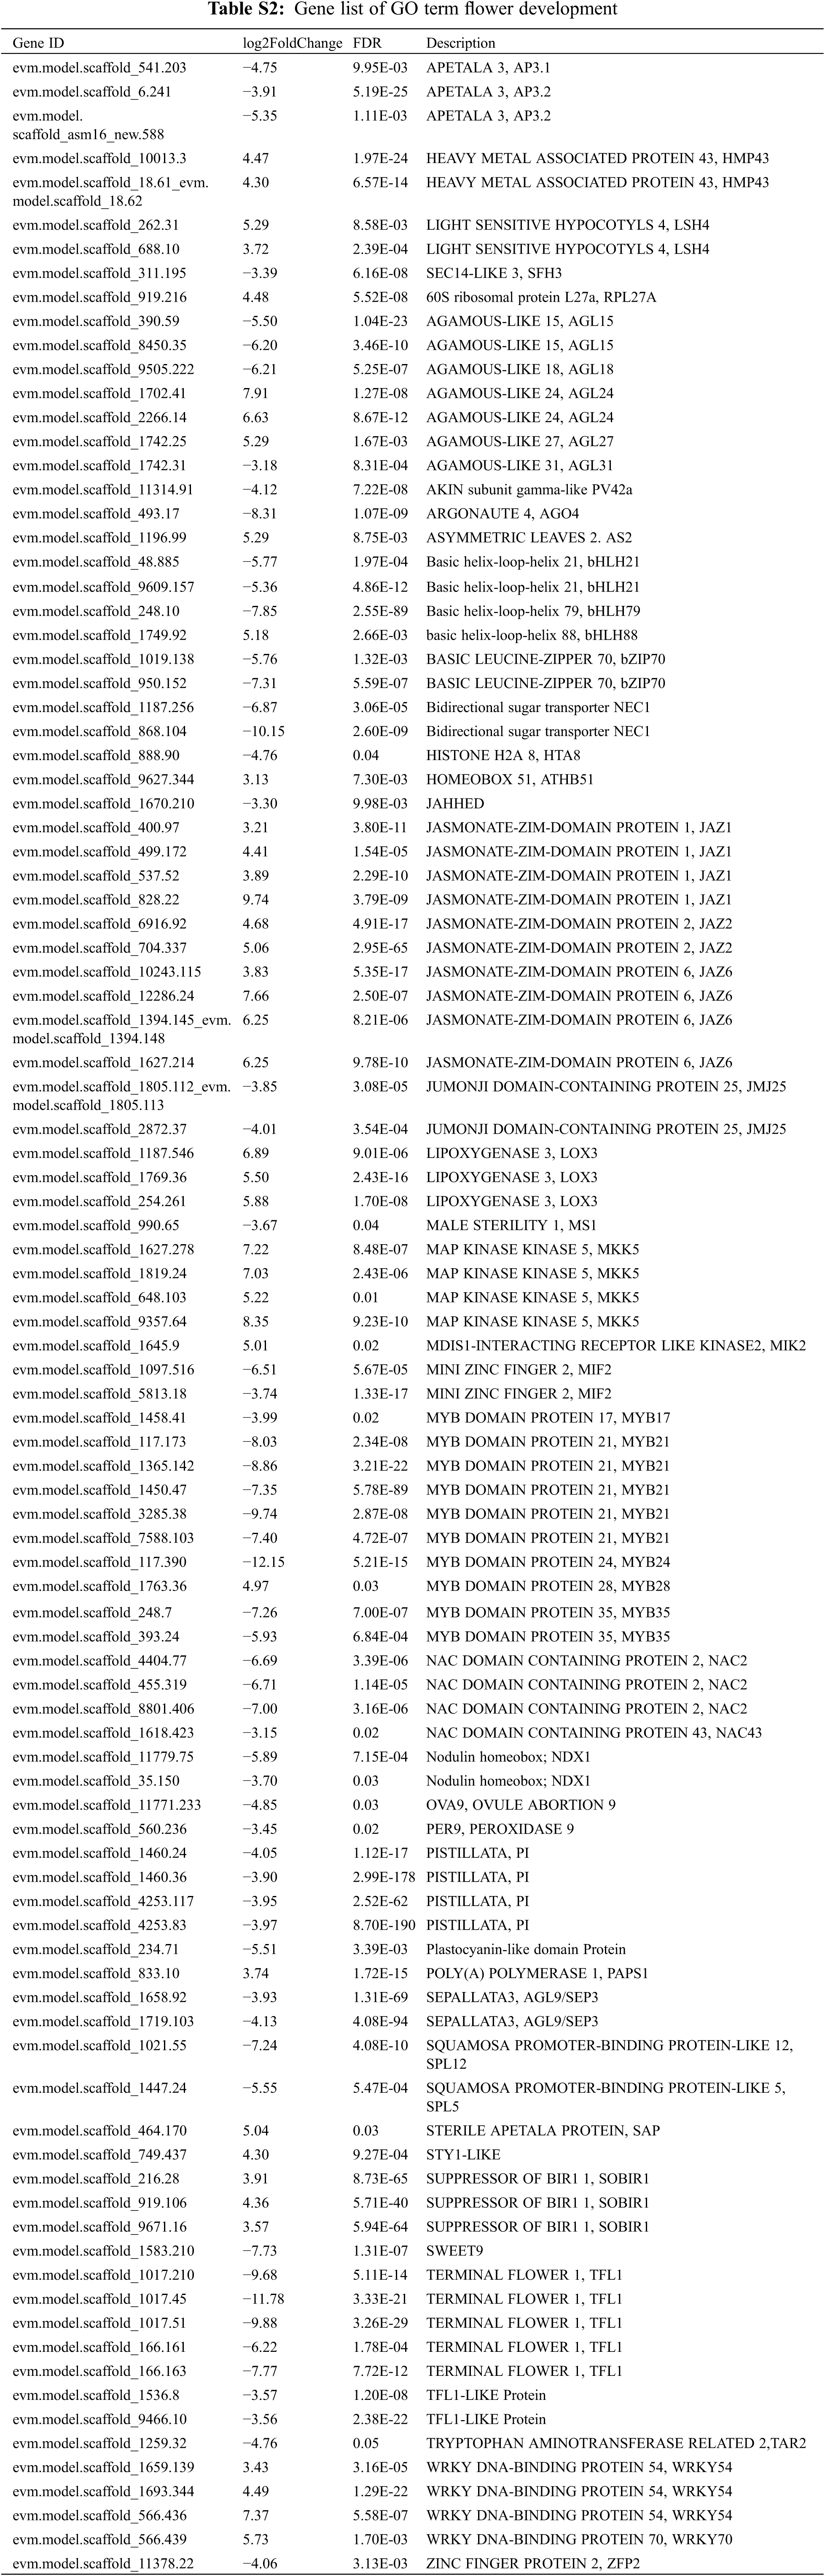
To further identify the DEGs responsible for this phenotype, we investigated the results of GO enrichment analysis. We found significant enrichment in flower development terms, which contains 129 genes, including the orthologs of flower development B&E class genes (CmAP3, CmPI and CmSEP3), AGAMOUS-LIKE Genes (CmAGL15, CmAGL18, CmAGL24, CmAGL27 and CmAGL31), JAZs (CmJAZ1, CmJAZ2 and CmJAZ6), MYBs (CmMYB17, CmMYB21, CmMYB24, CmMYB28 and CmMYB35), WRKYs (CmWRKY54 and CmWRKY70), etc. (Fig. S1 and Table S2). Among them, multiple genes are involved in the regulation of flowering and flower development. AGL15 is involved in the regulation of Arabidopsis embryo development [24], AGL24 interacts with SOC1 to mediate the expression of LEAFY to regulate floral induction and floral development [25], and AGL27 and AGL31 are highly homologous to the flowering-time gene FLC in Arabidopsis [26]. This indicates that they may be related to flowering and flower development. JAZ1 responds to a wide range of stresses, including mechanical damage, shade and salt, and interacts with COI1, to regulate plant stress tolerance and multiple growth and developmental processes in Arabidopsis [27–29]. Otherwise, CmJAZ1 regulates the flower transition in chrysanthemum [30]. MYB17 is regulated by LEAFY and AGL15 to regulate inflorescence development in Arabidopsis [31]. MYB21 and MYB24 interact with the DELLA proteins to regulate filament elongation in Arabidopsis [32]. In this term we identified many genes that regulate flowering and flower development, and many of them were associated with stress. Therefore, we concluded that changes in the expression of genes related to flower development caused by multiple stresses contribute to this phenotype.
The floral homeotic genes, which constitute the ABCE model, are well-studied and control the development of the four whorls of floral organs [33]. In this study, we also found that several of these genes were significantly differentially expressed between WT and M2 (Table 1). We identified two A class genes and named them CmAP2.1/2.2, the orthologs of AtAP2, which are highly expressed in M2. The expression of class B genes CmAP3.1/3.2 and CmPI, which are the orthologs of AtAP3 and AtPI, respectively, was significantly downregulated in M2. The expression of three E class genes CmSEP1 and CmSEP3.1/3.2 was significantly changed, in which the expression of CmSEP1 was elevated and the expression of CmSEP3.1/3.2 was decreased (Fig. 6). Moreover, there was no change in the expression of A class gene CmAP1 and C class genes CmAG.


Figure 6: Heatmap of differentially expressed ABE-like genes in chrysanthemum. The heatmap (with col scaled) showed that several class A genes were upregulated, while class B genes and class E gene CmSEP3.1/3.2 were significantly downregulated
We also used qRT-PCR analysis to validate the reliability of the RNA-Seq analysis and found that the qRT-PCR results were consistent with the data in the transcriptome (Fig. S5). To clarify the relationship between these homologous genes in chrysanthemum and those in gerbera and Arabidopsis, we constructed a phylogenetic tree of floral developmental ABCE-like genes of chrysanthemum, Arabidopsis and gerbera. The results showed that CmAP3.1/3.2 and CmPI were highly homologous to the class B genes GDEF2 and GGLO1 of gerbera, respectively, and CmSEP3.1 and CmSEP3.2 were highly homologous to the class E genes GRCD1 and GRCD5 of gerbera, respectively (Fig. 7).

Figure 7: The phylogenetic tree of ABE proteins from Chrysanthemum morifolium (Cm), Gerbera hybrida (G), and Arabidopsis thaliana (At). The ABE proteins identified from our transcriptome were marked by blue, red, and green arrows, respectively. Maximum likelihood method and 500 bootstrap replications were used to generate the tree
To further illustrate the relationship between changes in the expression of classes B and E genes and alteration in floret identity, we verified the expression of classes A, B and E genes in the M1 line with mild phenotype. M1 did not show significant changes in inflorescence structure. The capitulum of M1 contained the peripheral ray florets and the inner disc florets, while its disc and ray floret morphology also did not show significant changes (Figs. 2A–2F). The results indicated that CmAP2.1 was significantly up-regulated, but the change was only about 2-fold, unlike the approximately 50-fold up-regulation in M2. The expression pattern of class B genes was consistent with that of M2, but the degree of down-regulation was significantly less than that of M2. The relative expression level of CmAP3.1, CmAP3.2 and CmPI in M1 were 0.35, 0.09 and 0.10, respectively, while the relative expressions of CmAP3.1, CmAP3.2 and CmPI in M2 were 0.12, 0.02 and 0.04, respectively. The trend of class E genes was also in agreement with M2, except that the down-regulation of CmSEP3.1 was slightly less than that of M2 (Fig. 8). In summary, M1 largely matched M2 in terms of trends in A, B, and E class genes, and showed a moderate level of variation in class B genes, consistent with its mild phenotype, indicating that B genes contribute to the loss of petal identity and flower meristem determinacy.

Figure 8: qRT-PCR analysis of ABE-like genes in WT, M1, and M2 lines. Different letters (e.g., a, b and c) indicate significant differences of relative expression levels between WT, M1 and M2 (Duncan’s new multiple range test, P < 0.05)
4.1 Abiotic Stresses and Mads-Box Transcription Factors Affect Flower Development
Plant development and their responses to stresses are often regulated by multiple regulatory networks, and MADS-box transcription factors (TFs) are a vital part of regulatory networks [3]. MADS-box genes were also involved in many periods of plant flower development, including floral transition, floral organ development, and fruit differentiation [33–35]. Environmental conditions can regulate flower development by influencing the expression of MADS-box TFs. In Arabidopsis, drought induced SOC1 expression, while the drought response was also dependent on the FLC/SVP complex to regulate flowering time [36,37]. In Arabidopsis and tomato, AGL15 and its orthologs were involved in ROS response-related regulation [38,39]. TOMATO APETALA3 (TAP3) was highly induced under cold stress conditions, and TAP3, TOMATO MADS BOX GENE6 (TM6), Lycopersicon esculentum PISTILLATA (LePI) were repressed in anther under mild heat conditions [40]. OsMADS3 affected the expression of many other ROS-scavenging enzymes, suggesting that this MADS gene regulated the male reproductive development partly through ROS homeostasis [38]. Multiple adversity-related terms such as response to chemical (GO:0042221), response to oxidative stress (GO:0006979), response to water (GO:0009415), and response to abiotic stimulus (GO:0009628) were significantly enriched. Many MADS-box genes including orthologs of AP3, PI, SEP3, AGL15, SOC1, etc. were significantly differentially expressed. Those results suggested that the changes in the expression of the MADS-box transcription factors due to stresses may be responsible for these phenotypes.
4.2 B Class Genes May Be Involved in Regulating the Flower Identity and in Chrysanthemum
All flowering plants have A, B, C, and E class genes and their variants that determine flower organ development. However, class A genes appeared to function only in Arabidopsis and its relatives [5,7]. In the Asteraceae, the ABCE model of gerbera has been studied. GSQUA-like genes and GRCD3 (ortholog of AtAGL6) likely contributed to the A function. Especially, GRCD3 was reported to be associated with pappus identity. GGLO1/GDEF2 belong to class B function genes, and GAGA1/GAGA2 to class C function genes. Class E genes were functionally differentiated in gerbera, with GRCD4/5 regulating petal development, GRCD1 regulating stamen, and GRCD2/7 regulating carpel [8,41]. In particular, we found that in addition to GRCDs affecting florets identity, as mentioned in gerbera, class B genes may be involved in the determination of FM identity in chrysanthemum, as s we found significant differences in class B genes between the two mutants with different severity of variation. More significant down-regulation of class B genes resulted not only in petal defects, but also in the conversion of FMs to IMs. In this study, we identified CmAP3.1/3.2 and CmPI as B class genes and CmSEP3.1/3.2 as E class genes in chrysanthemum. We propose that the second whorl of flower organ defect and altered identity of florets in chrysanthemums was due to significant down-regulation of multiple class B genes. In addition, we found that LFY and UFO, which have been reported to regulate the FM identity in gerbera [1], were not differentially expressed in the M2 mutant. These indicated that the function of class B genes in regulating the determination of IM identity may be downstream or independent of LFY and UFO.
Authorship: The authors confirm contribution to the paper as follows: study conception and design: Liu J. Y., Ding L.; data collection: Liu J. Y.; analysis and interpretation of results: Liu J. Y., Ding L., Zhang X., Li S., Jia D. W., Song A. P.; draft manuscript preparation: Liu J. Y., Ding L., Chen F. D., Zhang X., Li S., Guan Y. X.; provision of plant materials: Jiang J. F. All authors reviewed the results and approved the final version of the manuscript.
Compliance with Ethical Standards: The authors declare that this article is in compliance with ethical standards of the journal.
Funding Statement: This work was financially supported by the National Natural Science Foundation of China (32171855), China Agriculture Research System (CARS-23-A18), Seed Industry Project of Jiangsu Province (JBGS [2021]020), the China Postdoctoral Science Foundation (2019M661870), the National Key Research and Development Program of China (2020YFD1000400) and a Project Funded by the Priority Academic Program Development of Jiangsu Higher Education Institutions.
Conflicts of Interest: The authors declare that they have no conflicts of interest to report regarding the present study.
References
1. Zhao, Y., Zhang, T., Broholm, S. K., Tahtiharju, S., Mouhu, K. et al. (2016). Evolutionary co-option of floral meristem identity genes for patterning of the flower-like Asteraceae inflorescence. Plant Physiology, 172(1), 284–296. [Google Scholar]
2. Broholm, S. K., Teeri, T. H., Elomaa, P. (2014). Molecular control of inflorescence development in Asteraceae. Advances in Botanical Research, pp. 297–333. Department of Agricultural Sciences, Finland: University of Helsinki. [Google Scholar]
3. Ding, L., Song, A., Zhang, X., Li, S., Su, J. et al. (2020). The core regulatory networks and hub genes regulating flower development in Chrysanthemum morifolium. Plant Molecular Biology, 103(6), 669–688. DOI 10.1007/s11103-020-01017-8. [Google Scholar] [CrossRef]
4. Coen, E. S., Meyerowitz, E. M. (1991). The war of the whorls: Genetic interactions controlling flower development. Nature, 353(6339), 31–37. DOI 10.1038/353031a0. [Google Scholar] [CrossRef]
5. Soltis, D. E., Chanderbali, A. S., Kim, S., Buzgo, M., Soltis, P. S. (2007). The ABC model and its applicability to basal angiosperms. Annals of Botany, 100(2), 155–163. DOI 10.1093/aob/mcm117. [Google Scholar] [CrossRef]
6. Ditta, G., Pinyopich, A., Robles, P., Pelaz, S., Yanofsky, M. F. (2004). The SEP4 gene of Arabidopsis thaliana functions in floral organ and meristem identity. Current Biology, 14(21), 1935–1940. DOI 10.1016/j.cub.2004.10.028. [Google Scholar] [CrossRef]
7. Pelaz, S., Ditta, G. S., Baumann, E., Wisman, E., Yanofsky, M. F. (2000). B and C floral organ identity functions require SEPALLATA MADS-box genes. Nature, 405(6783), 200–203. DOI 10.1038/35012103. [Google Scholar] [CrossRef]
8. Zhang, T., Zhao, Y., Juntheikki, I., Mouhu, K., Broholm, S. K. et al. (2017). Dissecting functions of SEPALLATA-like MADS box genes in patterning of the pseudanthial inflorescence of Gerbera hybrida. New Phytologist, 216(3), 939–954. DOI 10.1111/nph.14707. [Google Scholar] [CrossRef]
9. Shulga, O. A., Mitiouchkina, T. Y., Shchennikova, A. V., Skryabin, K. G., Dolgov, S. V. (2011). Overexpression of AP1-like genes from Asteraceae induces early-flowering in transgenic Chrysanthemum plants. Vitro Cellular & Developmental Biology-Plant, 47(5), 553–560. DOI 10.1007/s11627-011-9393-0. [Google Scholar] [CrossRef]
10. Zhao, K., Ding, L., Xia, W., Zhao, W., Zhang, X. et al. (2020). Characterization of an APETALA1 and a FRUITFUL-like homolog in chrysanthemum. Scientia Horticulturae, 272, 109518. DOI 10.1016/j.scienta.2020.109518. [Google Scholar] [CrossRef]
11. Broholm, S. K., Pollanen, E., Ruokolainen, S., Tahtiharju, S., Kotilainen, M. et al. (2010). Functional characterization of B class MADS-box transcription factors in Gerbera hybrida. Journal of Experimental Botany, 61(1), 75–85. DOI 10.1093/jxb/erp279. [Google Scholar] [CrossRef]
12. Yu, D., K, M. (1999). Organ identity genes and modified patterns of flower development in Gerbera hybrida (Asteraceae). The Plant Journal, 17, 51–62. DOI 10.1046/j.1365-313X.1999.00351.x. [Google Scholar] [CrossRef]
13. Aida, R., Komano, M., Saito, M., Nakase, K., Murai, K. (2008). Chrysanthemum flower shape modification by suppression of chrysanthemum-AGAMOUS gene. Plant Biotechnology, 25(1), 55–59. DOI 10.5511/plantbiotechnology.25.55. [Google Scholar] [CrossRef]
14. Kotilainen, M., Elomaa, P., Uimari, A., Albert, V. A., Yu, D. et al. (2000). GRCD1, an AGL2-like MADS box gene, participates in the C function during stamen development in Gerbera hybrida. The Plant Cell, 12(10), 1893–1902. DOI 10.1105/tpc.12.10.1893. [Google Scholar] [CrossRef]
15. Haas, B. J., Papanicolaou, A., Yassour, M., Grabherr, M., Blood, P. D. et al. (2013). De novo transcript sequence reconstruction from RNA-seq using the trinity platform for reference generation and analysis. Nature Protocols, 8(8), 1494–1512. DOI 10.1038/nprot.2013.084. [Google Scholar] [CrossRef]
16. Liao, Y., Smyth, G. K., Shi, W. (2013). FeatureCounts: An efficient general purpose program for assigning sequence reads to genomic features. Bioinformatics, 30(7), 923–930. DOI 10.1093/bioinformatics/btt656. [Google Scholar] [CrossRef]
17. Edgar, R. C. (2004). MUSCLE: A multiple sequence alignment method with reduced time and space complexity. BMC Bioinformatics, 5, 113. DOI 10.1186/1471-2105-5-113. [Google Scholar] [CrossRef]
18. Jones, D. J. (1992). The rapid generation of mutation data matrices from protein sequences. Bioinformatics, 8(3), 275–282. DOI 10.1093/bioinformatics/8.3.275. [Google Scholar] [CrossRef]
19. Kumar, S., Stecher, G., Li, M., Knyaz, C., Tamura, K. et al. (2018). MEGA X: Molecular evolutionary genetics analysis across computing platforms. Molecular Biology and Evolution, 35(6), 1547–1549. DOI 10.1093/molbev/msy096. [Google Scholar] [CrossRef]
20. Wang, H., Chen, S., Jiang, J., Zhang, F., Chen, F. (2015). Reference gene selection for cross-species and cross-ploidy level comparisons in Chrysanthemum spp. Scientific Reports, 5, 8094. DOI 10.1038/srep08094. [Google Scholar] [CrossRef]
21. Livak, K. J., Schmittgen, T. D. (2001). Analysis of relative gene expression data using real-time quantitative PCR and the 2−ΔΔCT method. Methods, 25(4), 402–408. DOI 10.1006/meth.2001.1262. [Google Scholar] [CrossRef]
22. Hou, Q., Ufer, G., Bartels, D. (2016). Lipid signalling in plant responses to abiotic stress. Plant Cell Environ, 39(5), 1029–1048. DOI 10.1111/pce.12666. [Google Scholar] [CrossRef]
23. Lim, G. H., Singhal, R., Kachroo, A., Kachroo, P. (2017). Fatty acid- and lipid-mediated signaling in plant defense. Annual Review of Phytopathology, 55, 505–536. DOI 10.1146/annurev-phyto-080516-035406. [Google Scholar] [CrossRef]
24. Heck, G. R., Perry, S. E., Nichols, K. W., Fernandez, D. E. (1995). AGL15, A MADS domain protein expressed in developing embryos. Plant Cell, 7, 1271–1282. [Google Scholar]
25. Lee, J., Oh, M., Park, H., Lee, I. (2008). SOC1 translocated to the nucleus by interaction with AGL24 directly regulates leafy. The Plant Journal, 55(5), 832–843. DOI 10.1111/j.1365-313X.2008.03552.x. [Google Scholar] [CrossRef]
26. Alvarez-Buylla, E. R., Liljegren, S. J. (2000). MADS-box gene evolution beyond flowers: Expression in pollen, endosperm, guard cells, roots and trichomes. The Plant Journal, 24, 457–466. DOI 10.1046/j.1365-313x.2000.00891.x. [Google Scholar] [CrossRef]
27. Liu, B., Seong, K., Pang, S., Song, J., Gao, H. et al. (2021). Functional specificity, diversity, and redundancy of Arabidopsis JAZ family repressors in jasmonate and COI1-regulated growth, development, and defense. New Phytologist, 231(4), 1525–1545. DOI 10.1111/nph.17477. [Google Scholar] [CrossRef]
28. Robson, F., Okamoto, H., Patrick, E., Harris, S. R., Wasternack, C. et al. (2010). Jasmonate and phytochrome A signaling in Arabidopsis wound and shade responses are integrated through JAZ1 stability. Plant Cell, 22(4), 1143–1160. DOI 10.1105/tpc.109.067728. [Google Scholar] [CrossRef]
29. Zhao, G., Song, Y., Wang, Q., Yao, D., Li, D. et al. (2020). Gossypium hirsutum salt tolerance is enhanced by overexpression of G. arboreum JAZ1. Frontiers in Bioengineering and Biotechnology, 8, 157. DOI 10.3389/fbioe.2020.00157. [Google Scholar] [CrossRef]
30. Guan, Y., Ding, L., Jiang, J., Shentu, Y., Zhao, W. et al. (2021). Overexpression of the CmJAZ1-like gene delays flowering in Chrysanthemum morifolium. Horticulture Research, 8(1), 87. DOI 10.1038/s41438-021-00525-y. [Google Scholar] [CrossRef]
31. Zhang, Y., Cao, G., Qu, L. J., Gu, H. (2009). Characterization of Arabidopsis MYB transcription factor gene AtMYB17 and its possible regulation by LEAFY and AGL15. Journal of Genetics and Genomics, 36(2), 99–107. DOI 10.1016/S1673-8527(08)60096-X. [Google Scholar] [CrossRef]
32. Huang, H., Gong, Y., Liu, B., Wu, D., Zhang, M. et al. (2020). The DELLA proteins interact with MYB21 and MYB24 to regulate filament elongation in Arabidopsis. BMC Plant Biology, 20(1), 64. DOI 10.1186/s12870-020-2274-0. [Google Scholar] [CrossRef]
33. Krizek, B. A., Fletcher, J. C. (2005). Molecular mechanisms of flower development: An armchair guide. Nature Reviews Genetics, 6(9), 688–698. DOI 10.1038/nrg1675. [Google Scholar] [CrossRef]
34. Kaufmann, K., Wellmer, F., Muiño, J. M., Ferrier, T., Wuest, S. E. et al. (2010). Orchestration of floral initiation by APETALA1. Science, 328(5974), 85–89. DOI 10.1126/science.1185244. [Google Scholar] [CrossRef]
35. Smaczniak, C., Immink, R. G., Angenent, G. C., Kaufmann, K. (2012). Developmental and evolutionary diversity of plant MADS-domain factors: Insights from recent studies. Development, 139(17), 3081–3098. DOI 10.1242/dev.074674. [Google Scholar] [CrossRef]
36. Riboni, M., Galbiati, M., Tonelli, C., Conti, L. (2013). GIGANTEA enables drought escape response via abscisic acid-dependent activation of the florigens and suppressor of overexpression of constans. Plant Physiology, 162(3), 1706–1719. DOI 10.1104/pp.113.217729. [Google Scholar] [CrossRef]
37. Riboni, M., Robustelli Test, A., Galbiati, M., Tonelli, C., Conti, L. (2016). ABA-dependent control of GIGANTEA signalling enables drought escape via up-regulation of Flowering Locus T in Arabidopsis thaliana. Journal of Experimental Botany, 67(22), 6309–6322. DOI 10.1093/jxb/erw384. [Google Scholar] [CrossRef]
38. Castelan-Munoz, N., Herrera, J., Cajero-Sanchez, W., Arrizubieta, M., Trejo, C. et al. (2019). MADS-box genes are key components of genetic regulatory networks involved in abiotic stress and plastic developmental responses in plants. Frontiers in Plant Science, 10, 853. DOI 10.3389/fpls.2019.00853. [Google Scholar] [CrossRef]
39. Cosio, C., Ranocha, P., Francoz, E., Burlat, V., Zheng, Y. et al. (2017). The class III peroxidase PRX17 is a direct target of the MADS-box transcription factor AGAMOUS-LIKE15 (AGL15) and participates in lignified tissue formation. New Phytologist, 213(1), 250–263. DOI 10.1111/nph.14127. [Google Scholar] [CrossRef]
40. Muller, F., Xu, J., Kristensen, L., Wolters-Arts, M., de Groot, P. F. et al. (2016). High-temperature-induced defects in tomato (Solanum lycopersicum) anther and pollen development are associated with reduced expression of B-class floral patterning genes. PLoS One, 11(12), e0167614. DOI 10.1371/journal.pone.0167614. [Google Scholar] [CrossRef]
41. Laitinen, R. A., Broholm, S., Albert, V. A., Teeri, T. H., Elomaa, P. (2006). Patterns of MADS-box gene expression mark flower-type development in Gerbera hybrida (Asteraceae). BMC Plant Biology, 6, 11. DOI 10.1186/1471-2229-6-11. [Google Scholar] [CrossRef]
Supplement Information

Figure S1: Heatmap of the genes of GO term flower development

Figure S2: GO enrichment of biological processes

Figure S3: GO enrichment of molecular function

Figure S4: GO enrichment of cellular component

Figure S5: Expression pattern of chrysanthemum A, B and E class genes verified by RNA-Seq and qRT-PCR analysis in WT and M2
Cite This Article
 Copyright © 2023 The Author(s). Published by Tech Science Press.
This work is licensed under a Creative Commons Attribution 4.0 International License , which permits unrestricted use, distribution, and reproduction in any medium, provided the original work is properly cited.
 Downloads
 Citation Tools