
 Submit a Paper
 Propose a Special lssue
 Open Access
ARTICLE
Differentiation of Wheat Diseases and Pests Based on Hyperspectral Imaging Technology with a Few Specific Bands
1 School of Information Engineering, Zhejiang University of Water Resources and Electric Power, Hangzhou, 310018, China
2 School of Automation, Hangzhou Dianzi University, Hangzhou, 310018, China
3 Aerospace Information Research Institute, Chinese Academy of Sciences, Beijing, 100094, China
* Corresponding Author: Jingcheng Zhang. Email:
(This article belongs to the Special Issue: Symbiotic Associations for Nutrients Management and Complexes Formation for Better Agricultural Crops Productivity under Biotic and Abiotic Stresses)
Phyton-International Journal of Experimental Botany 2023, 92(2), 611-628. https://doi.org/10.32604/phyton.2022.023662
Received 09 May 2022; Accepted 11 July 2022; Issue published 12 October 2022
 View Full Text
 Download PDF
Abstract
Hyperspectral imaging technique is known as a promising non-destructive way for detecting plants diseases and pests. In most previous studies, the utilization of the whole spectrum or a large number of bands as well as the complexity of model structure severely hampers the application of the technique in practice. If a detection system can be established with a few bands and a relatively simple logic, it would be of great significance for application. This study established a method for identifying and discriminating three commonly occurring diseases and pests of wheat, i.e., powdery mildew, yellow rust and aphid with a few specific bands. Through a comprehensive spectral analysis, only three bands at 570, 680 and 750 nm were selected. A novel vegetation index namely Ratio Triangular Vegetation Index (RTVI) was developed for detecting anomalous areas on leaves. Then, the Support Vector Machine (SVM) method was applied to construct the discrimination model based on the spectral ratio analysis. The validating results suggested that the proposed method with only three spectral bands achieved a promising accuracy with the Overall Accuracy (OA) of 83%. With three bands from the hyperspectral imaging data, the three wheat diseases and pests were successfully detected and discriminated. A stepwise strategy including background removal, damage lesions recognition and stresses discrimination was proposed. The present work can provide a basis for the design of low cost and smart instruments for disease and pest detection.Keywords
Crop diseases and pests are among the major agricultural concerns and they are characterized with multiple types, large impacts, and frequent outbreaks, which have a significant impact on the global agricultural production and food security [1]. At present, the monitoring of wheat diseases and pests is mainly through manual investigation combined with sampling. However, these conventional investigation methods lack of efficiency and prone to be subjective. Hyperspectral remote sensing has been widely used and has shown great potential in the monitoring of plants diseases and pests, due to its ability to detect the spectral changes in the visible-near-infrared spectrum of plants [2,3]. Prabhakar et al. [4] observed significant spectral signatures from leafhopper infested cotton canopies at bands 496, 691, 761, 1124 and 1457 nm, and indicated that two new hyperspectral indices proposed in this study have the potential to be used for detection of leafhopper in cotton. The study of Yu et al. [5] found that a number of sensitive spectral indices are suitable for detecting Septoria tritici blotch disease in winter wheat. Based on the sensitive spectral bands and the constructed vegetation index, Oerke et al. [6] tested the ability of hyperspectral data to detect the resistance of different grape varieties to Plasmopara viticola disease in phenotyping. The results showed that the hyperspectral characterization is suitable for obtaining information about the resistance mechanisms of plants to pathogens at the tissue level. Generally, most of the studies that use hyperspectral technology for the monitoring of plant diseases and pests at the leaf or canopy scale are carried out in specific experimental environments and for a single type of disease or pest. However, the selected experimental environment is often relatively simple, while the actual farmland is complex and has different types of diseases and pests in certain time periods. Accordingly, different measures should be taken to prevent or treat diseases and pests. The lack of targeted pesticide or biological controls fails to effectively manage the diseases and pests, and can lead to a series of problems (e.g., unintentional pesticide damage to plants, soil pollution, etc.) [7]. Therefore, real-time and effective identification and differentiation of crop diseases and pests are keys in achieving contemporary precision agriculture and crop management. It is also important to effectively identify and distinguish crop diseases and pests for phenotypic studies of crop resistance, pest breeding and plant protection [8].
To differentiate the powdery mildew and take-all diseases in wheat, Graeff et al. [9] assessed the changes in leaf spectral reflectance of wheat during its infection. The study found that the range of 490–780 nm showed the most sensitive response to damage caused by the investigated diseases, which indicates that the early detection and discrimination of infection can be obtained from specific wavelength ranges. Mahlein et al. [10] developed the plant disease spectral indices that are based on single wavelengths and normalized wavelength differences, by applying the RELIEF-F algorithm for detecting and identifying plant diseases in sugar beet plants. The results from this study showed that the discriminant model can achieve a satisfactory accuracy. The abovementioned studies showed that the hyperspectral technology has the potential for the identification and differentiation of diseases and pests. If the spectral discrimination modeling can be achieved for diseases and pests that are easily mixed, then, it is possible to facilitate the precise management of plant diseases and pests in complex environments. At present, when applying the hyperspectral data in the crop stress classification, many methods use the whole spectral information. For example, Zhao et al. [11] aimed to detect the fungal infection of rapeseed petals by applying the hyperspectral imaging, principal component analysis (PCA) and ANOVA, and selecting six optimal wavelengths (1190, 1460, 1463, 1524, 1446, and 1656 nm). This study found that the LS-SVM model based on the combination of all optimal wavebands, had the best performance in detection of fungal infection on rapeseed petals. Furthermore, Zhang et al. [12] used the continuous wavelet analysis and hyperspectral data to obtain the discrimination model for differentiating various diseases and pests in winter wheat. The results from this study showed that the wavelet spectral features have more advantages than the conventional spectral features. However, the above-mentioned detection method needs hyperspectral information of the whole spectrum. This indicates that the instrument based on this principle is often costly and this greatly limits its popularization and application. The effective identification and differentiation of crop diseases and pests based on only several specific bands may contribute to the low-cost instrument development.
In summary, the authors suggest the development of portable instruments for identification and distinguishing of diseases and pests that is based on hyperspectral imaging data. Fewer bands should be selected when considering the cost of instrument development and the feasibility of algorithm implementation. Considering that the hyperspectral imaging technique can obtain both the detailed spectral information on the disease and pest lesion area on plant leaves and the image information of each wavelength, this data is ideal for feature selection. Therefore, instead of directly apply the expensive hyperspectral imaging technique in practice, this study takes the hyperspectral imaging data as an experimental setting for understanding spectral response, development of features and models.
This study aims to decrease the spectral confusion of different diseases and pests during their detection. Based on the hyperspectral imaging system, the methods and models are studied for detecting and discriminating three typical wheat diseases and pests, including powdery mildew (Blumeria graminis f. sp. tritici), yellow rust (Puccinia striiformis West. f. sp. tritici) and aphid (Rhopalosiphum padi L.). Firstly, this work studies the spectral characteristics of different wheat diseases and pests and attempts to identify a few sensitive spectral bands for their detection and discrimination. Secondly, based on the selected bands and a constructed novel index, a step-by-step strategy for identifying and differentiating diseases and pests was proposed. Finally, the performance of the proposed method was evaluated and the feasibility of differentiating diseases and pests with only few bands was assessed.
Leaf samples used in this study were taken from the experimental field of the Beijing Academy of Agricultural and Forestry Sciences (39°56’ N, 116°16’ E). In this paper, three types of winter wheat leaf’s diseases and pests were selected: yellow rust (YR), powdery mildew (PM), and aphid (AH). Hyperspectral imaging data were collected from a hyperspectral imaging system (ImSpector V10E-QE, Spectral Imaging, Ltd., Finland) in a dark box, with the halogen lamps as a light source (Fig. 1). The leaf samples were placed on a black cloth with very low reflectance for hyperspectral imaging testing. Red-Green-Blue (RGB) image were taken by a digital camera. The imaging spectrometer was in linear array scanning mode with the spectral range of 326.7–1098 nm, spectral resolution of 0.8 nm, and image size of 1004 × 1000. After image acquisition, it was calibrated into reflectance values with whiteboard and blackboard. Due to low light output in the visible (VIS) bands <510 nm, and low quantum efficiency of the charge coupled device (CCD) in the near infrared (NIR) bands >900 nm [13], only 510–900 nm spectral bands were selected for subsequent analysis. Data processing and analysis were performed in ENVI 5.1 (ITTVIS, https://www.ittvis.com/envi) and MATLAB 2013 (The MathWorks, Inc., https://www.mathworks.com/products/matlab.html) softwares.
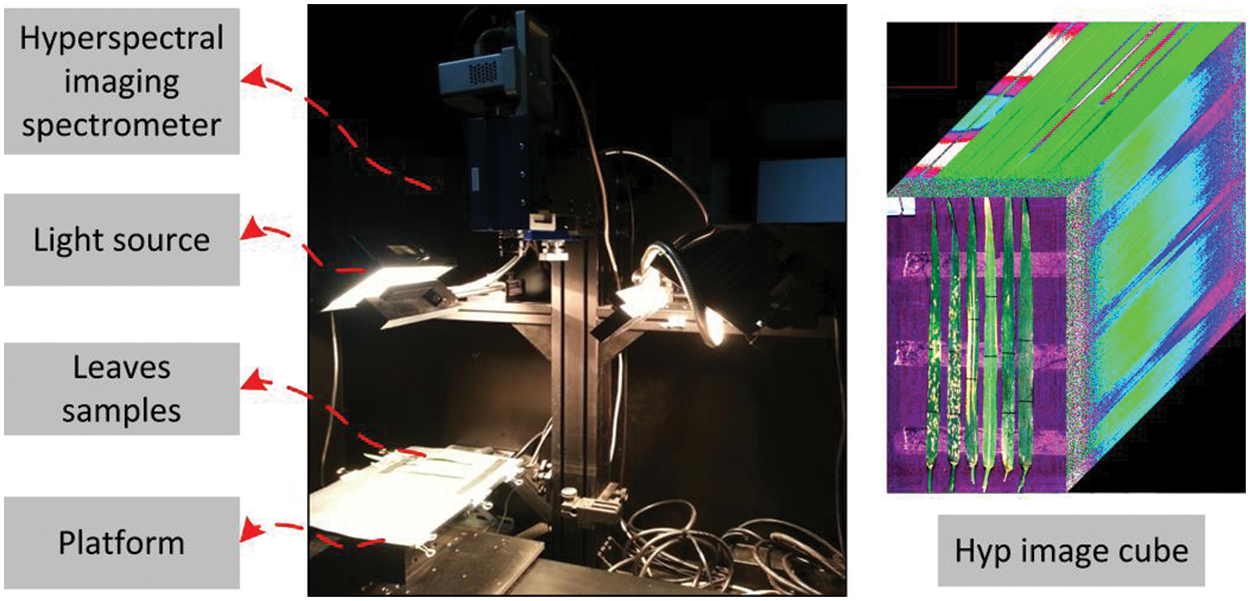
Figure 1: Composition of hyperspectral imaging system
In this study, the spectral signals for model training were extracted from hyperspectral images corresponding to six infected leaves with high representativeness (two per each with PM, YR, and AH), while the spectral signals for model validation were extracted from hyperspectral images corresponding to 23 leaves (12 with PM, seven with YR, and four with AH).
2.2 Spectral Response Analysis and Detection Feature Construction
2.2.1 Selection of Region of Interest (ROI) and Spectral Extraction of Leaves
In this study, typical spectra of diseases, pest and corresponding healthy samples were investigated for band optimization. For selection of ROI, considering that some natural variations of the physiological and biochemical states among leaves will result in spectral heterogeneity, selecting both normal and lesion areas within one leaf can mitigate this background difference, and facilitate the spectral comparison between the spots. The spectral curves are extracted from the ROIs based on the six modeling samples. The center pixels of stress lesions and the healthy pixels that were parallel to the selected stress lesions along the scanning direction were selected in order to avoid the difference in illumination (i.e., the radiation intensity was equal in the vertical scanning direction). Each ROI was composed of 3 × 3 pixels, while the spectral curve corresponding to the ROI was obtained after averaging all ROI pixels. The standard deviations of the spectral reflectance within the ROI (3 × 3 pixel) of each disease/pest were derived. The coefficients of variation (CV = Standard deviation/mean) among each type of samples were lower than 0.05, indicating that the spectral signals have a certain degree of variation within the ROI, but the reflectance curves were relatively stable. On this basis, 18 typical spectral curves were obtained from different leaf samples (Fig. 2a). Fig. 2b shows the spectral ratios between the mean spectral curves of YR, PM, AH and their corresponding healthy ROIs within the band range of 510–900 nm.
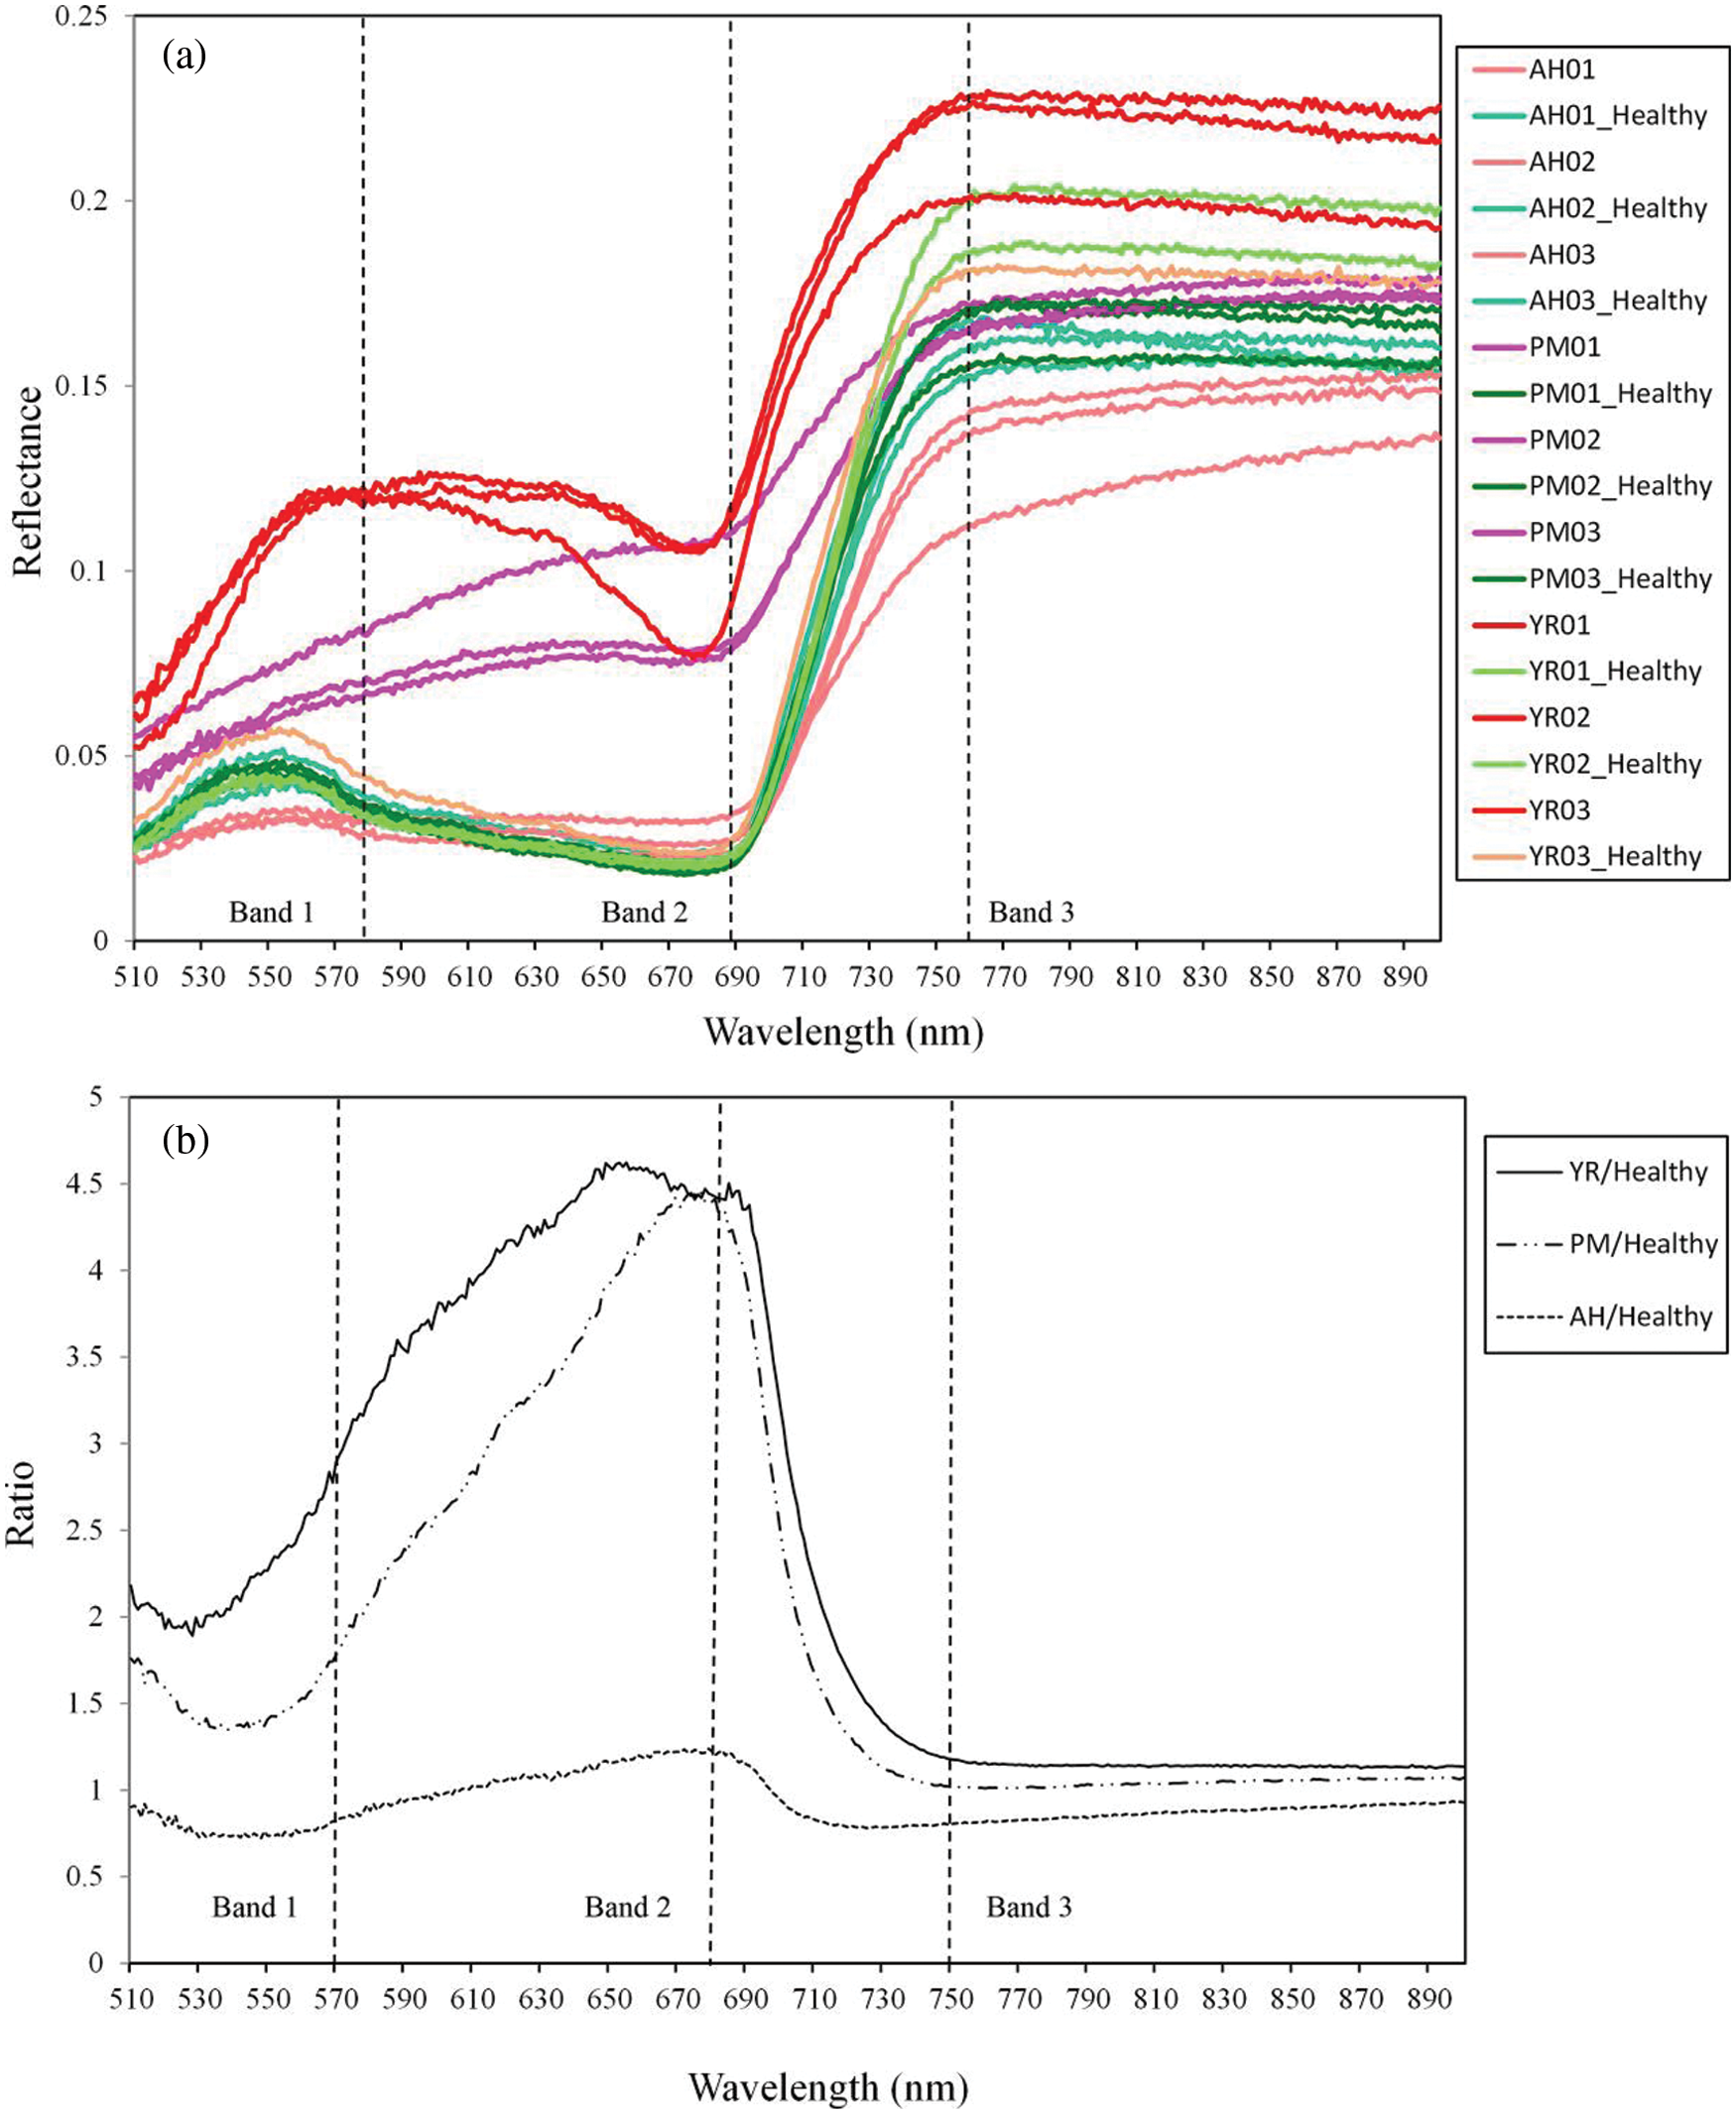
Figure 2: Curves of raw reflectance (a) and spectral ratios between damaged and healthy samples (b) (The dash lines indicate the positions of three selected bands. The numbers 01–03 represent the replicates of ROI samples)
2.2.2 Construction of the Spectral Feature for Detecting Anomalous Areas on Leaves
When crops are affected by diseases and pests, chlorophyll and cell structure will change and affect the position and area of red valley in the spectral curve of stressed crops [14]. Despite some spectral shape analysis (e.g., spectral derivative features, continuous removal transformed features, continuous wavelet features, etc.) are advantageous in detecting diseases and pests [12], the application of such methods requires the complete hyperspectral information, which is expensive for instrument development. This study used as few bands as possible to achieve disease differentiation by balancing the necessary amount of bands information and the number of bands. As a classic Vegetation Index (VI), the Triangular Vegetation Index (TVI) was designed to describe the spectral characteristics of vegetation, which represents the triangle area constructed by three spectral feature points: green peak (550 nm), red valley (670 nm), and the start of near infrared platform (750 nm). The spectral changes of plants under vigorous growth or stresses will affect the area of this triangle, and thus it can reflect the status or stress condition of plants [15,16].
The aim of this study was to propose a novel vegetation index, based on the phenomenon observed from the TVI, which will respond to different types of diseases and pests. Fig. 3 shows the original spectral curves of typical stressed samples with YR and the corresponding healthy samples. It can be noticed that the original spectral curve of the samples with disease was significantly changed when compared with the healthy samples. A significant rise was noticed at the green peak, the red valley, and the near infrared platform. However, it is worth noting that the reflectance of the three positions was rising integrally. Therefore, there was no obvious change when comparing triangle areas of TVI in stressed samples (triangle ABC) with healthy samples (triangle A’B’C’). It is hard to directly distinguish stressed from healthy samples with TVI under a similar spectral change. To solve this problem, this study proposes a novel vegetation index named Ratio Triangular Vegetation Index (RTVI). This index modifies the TVI index in order to calculate the ratio of the area of the triangle ABC and the area of the trapezoid ABED (i.e., the proportion of the yellow area in the sum area of yellow and blue areas). Its expression is:

Figure 3: Comparison between YR and healthy samples based on the geometric meaning of RTVI (Dotted lines indicate the position of three selected bands (570, 680, and 750 nm), the yellow area indicates the area of triangle ABC, and both blue area and yellow area constructed the area of the trapezoid)
where, SABC refers to the area of triangle ABC and SABED is the area of trapezoidal ABED. Furthermore, the area of triangle ABC and trapezoidal ABED is calculated as follows:
Therefore, the calculation formula of RTVI is:
where, band1, band2, and band3 are the values of the three bands, respectively. Furthermore, Refband1, Refband2, and Refband3 are the reflectance values of band1, band2, and band3, respectively.
To evaluate the sensitivity of bands, two statistical analyses, including an independent t-test (healthy vs. stress) and an ANOVA analysis (among YR, PM and AH), and spectral ratio analysis were conducted and jointly analyzed. The feature selection in this study follows some premises: (1) Use as few bands as possible, to simplify the feature set; (2) Adopting a stepwise detecting strategy, to simplify the classification scenario, with a Healthy vs. Stress differentiation step and a three stresses classification step; (3) Consider the results from both quantitative (sensitivity analysis) and qualitative analysis (bands importance in classic vegetation indices) to enhance the stability and generality of features. Based on these premises, the response bands were selected from the green peak (530–590 nm) and red valley (670–700 nm), whereas the reference band was selected from the near infrared (730–770 nm). By referring to bands in some existing classic vegetation indices such as MTCI, PRI, mARI, CI, PSRI, SIPI, NPCI, and mND680 [17–24], the bands of 570 and 680 nm served as response bands, and they were sensitive in detecting the abnormal areas. The 750 nm failed to pass the test, and it thereby served as the reference band (invariant band). The other bands were selected for constructing the RTVI. In addition, the results of the ANOVA analysis suggested that all three bands were sensitive in differentiating YR, PM and AH.
2.2.3 Spectral Ratio Characteristics of Diseases and Pests Discrimination
The majority of the existing research related to the recognition and diagnosis of plant diseases and pests by hyperspectral imaging technology uses original spectral reflectance or vegetation index as input variables for modeling and analysis. The model based on the previously described approach will ignore the subtle spectral differences among various stress types due to differences in the test sample, time, testing conditions, etc. In order to overcome the abovementioned problems, this study proposes a new method that applies the spectral ratio of stressed to healthy samples as the model input, which can strengthen the differences obtained between different sample spectrums. Instead of original spectral reflectance, the spectral ratio is able to overcome some possible spectral baseline differences among leaves. Specifically, three selected bands (570, 680, and 750 nm) were calculated according to formula (5) in order to obtain the relative band intensity image of the three bands:
where, i represents band i (e.g., 570, 680, and 750 nm), D represents pixels in leaf diseased area, H represents pixels in normal leaf area, Ref(i,D) represents reflectance intensity of each pixel in leaf diseased area of band i, Ref(i,H) represents the average value of all pixels in the normal leaf area of band i. Here the diseased area and normal area refer to the identified abnormal area and normal area in the step of leaf lesion detection. The Ratio(i,D) represents the ratio of Ref(i,D) and Ref(i,H).
2.3 Methods for Diseases and Pests Identification and Differentiation
The specific research methods applied in this study are: (1) Mask the original hyperspectral images to remove the background. In this regard, the influence of background noise on the subsequent leaf extraction and the area extraction of disease and pest lesions is eliminated; (2) The area extraction of disease and pest lesions based on RTVI; (3) Combining the spectral ratio characteristics and SVM method to construct the disease discrimination model; and (4) Model accuracy evaluation. The main steps are presented in Fig. 4.
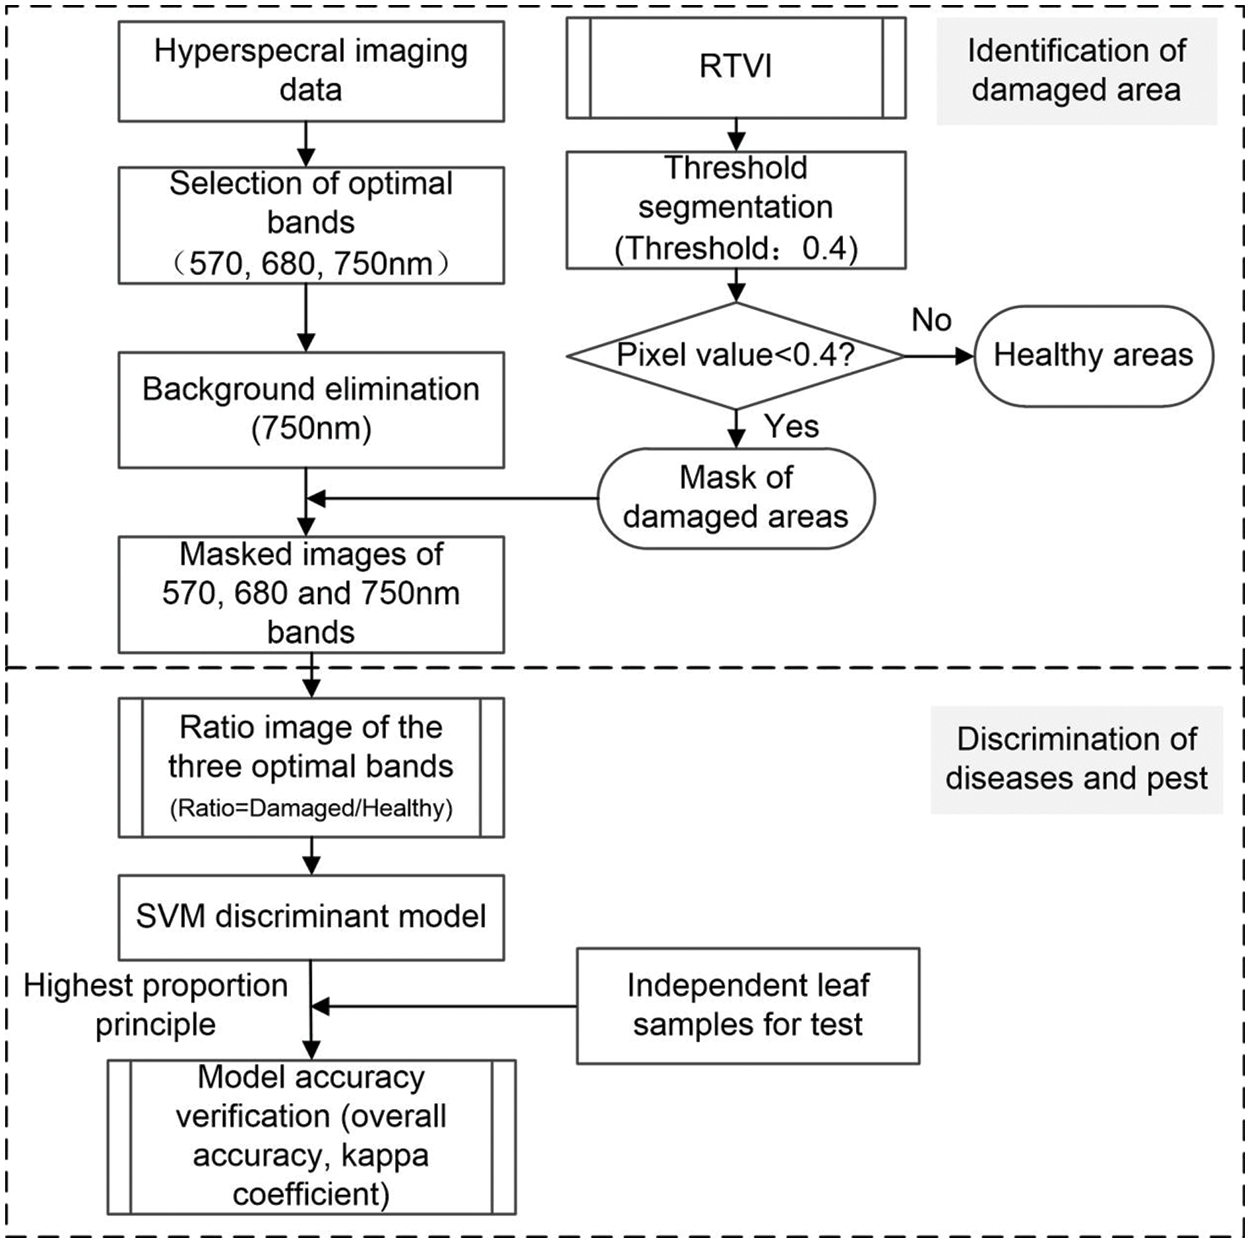
Figure 4: Flowchart for discriminating different winter wheat diseases and pests based on the hyperspectral imaging technology
In the first processing step, the plant pixels are separated from the background pixels according to the simple, intuitive, and effective threshold segmentation method. Plant clusters are selected by using a 750 nm threshold of 0.08. At the same time, 750 nm has been selected to create the RTVI index. Accordingly, the information can be reused and the cost of instrument development can be reduced. Only the pixels from plant clusters are regarded in further analysis.
2.3.2 Identification of Leaf Lesions Caused by Diseases and Pests
Based on the masked leaf images obtained in 2.3.1, the RTVI index was calculated to obtain the RTVI grayscale images. Since the RTVI index can distinguish well healthy from stressed samples, there is a significant difference between the gray value of the diseased lesion and the healthy area. Therefore, the threshold segmentation method is applied to identify the diseased lesion on the leaves. The optimization method is also adopted for obtaining the accurate segmentation threshold. Based on the preliminary experimental results, the total precision and kappa coefficient values extraction under different thresholds were calculated based on the step length of 0.05 in the range of 0.25 to 0.5 of the RTVI index. The threshold results were compared and subsequently, the threshold value with the best classification effect was selected as the final threshold value for determination. Apart from the identified lesion area, the rest leaf areas were considered as normal areas. And those boundaries are used for extraction of the spectral ratio value in the discriminating model.
2.3.3 Discrimination Model Based on the Spectral Ratio and SVM Method
Based on the calculated spectral ratio image, the SVM method was applied to construct the discriminant model. This paper selects the RBF kernel function for model training [25] as it can consider samples with a higher-dimensional space nonlinearly, thus solving the nonlinear relationship between class tags and attributes. The SVM model was trained based on the training dataset using n-fold cross-validation (n = 5), which determined the best c = 128 and best g = 5.66. The training pixel samples were selected by visually examining six selected leaf images. Based on the RGB images, the ROI of the typical diseases and pests lesions were selected. Finally, a total of 1338 samples (562 of PM, 540 of YR, and 236 of AH) were selected for the discriminant model at a pixel level (Fig. 5).
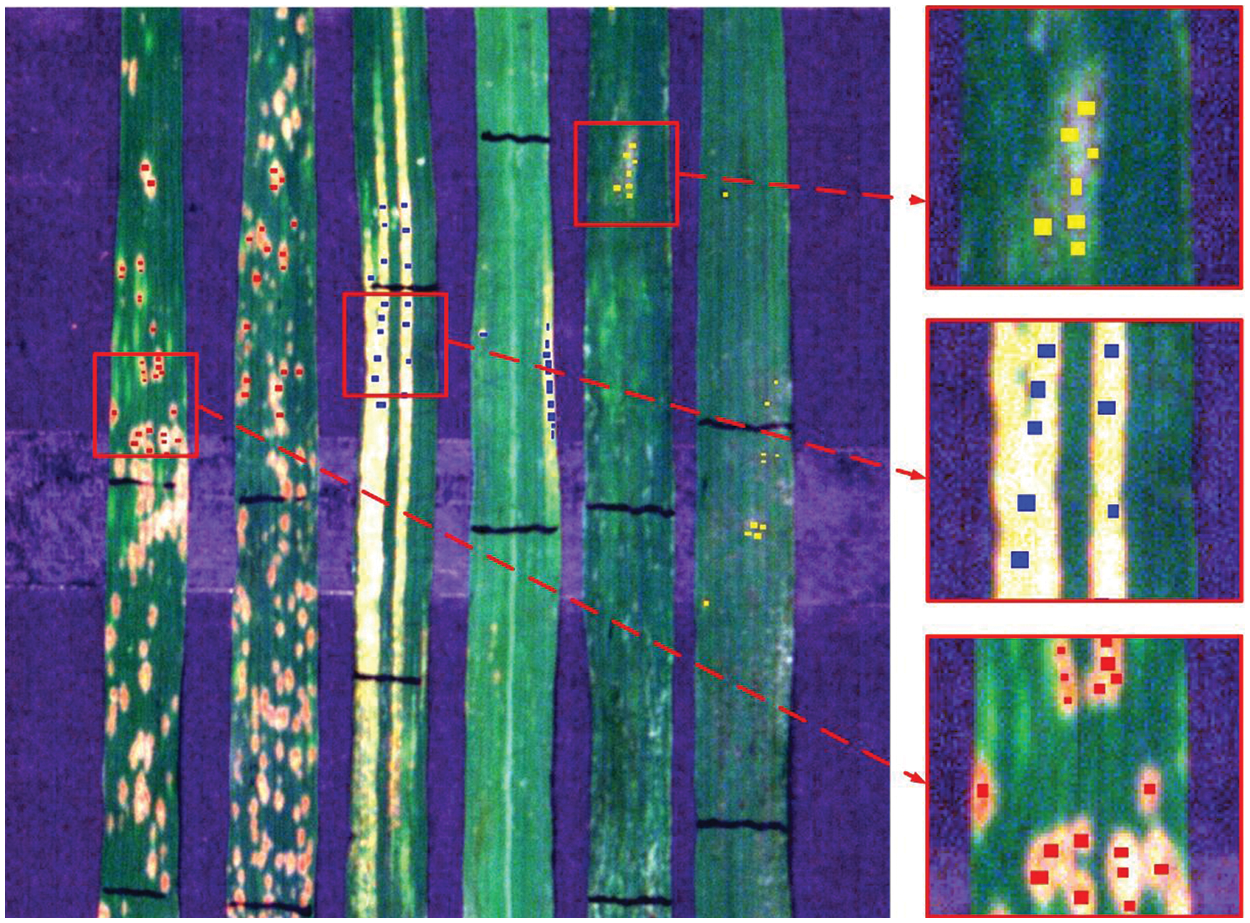
Figure 5: Distribution of visually selected ROIs on leaves for discrimination of wheat diseases and pest
The ratio characteristics of the three bands of the selected ROIs were considered as the model training samples, and the classification model was trained based on the SVM method. To determine the type of leaf stress, it was necessary to input the image data into the model after it was processed for leaf background separation (see 2.3.1) and for leaf lesion identification (see 2.3.2), then to carry out pixel-by-pixel discrimination of diseases and pest lesion in the image, and determine the types of stress in each pixel of the leaf. For determining the stress type at a leaf level, given that all leaf samples used in this experiment have only one stress type per leaf, the highest proportion principle, that considers counting the total number of each type of stress on one leaf, was adopted. To avoid some confusing or suspicious results, as a valid determination, a restriction was applied that required the class with highest proportion >40%.
The accuracy evaluation of the discrimination model was conducted at the pixel and leaf levels. Six statistical parameters were calculated from the confusion matrix to reflect the accuracy of the discriminant model. They include the overall accuracy (OA), producers accuracy (P.’s a. (%)), user accuracy (U.’s a.(%)), kappa coefficient, commission error (%), and omission error (%).
3.1 Detection and Discrimination of Spectral Features of Diseases and Pests
The spectral ratio curve can reflect the change (increase or decrease) in a certain stress spectral reflection at each band relative to the normal spectrum (Fig. 2). It can be noticed that the reflectance spectra of three diseases and pests were significantly different when compared to the healthy samples. YR and PM showed a similar pattern, i.e., the reflectance of the diseased samples increased within 510–900 nm when compared with the healthy samples. The AH samples showed a specific pattern with a decrease near the green peak, then an increase near the red valley, and finally a decrease near the infrared platform. We noticed that the optimized bands of 570, 680, and 750 nm, effectively reflected the differences in the mechanisms and symptoms among different diseases and pests. The AH infected leaf surface was covered by a pest secretion and showed a gray color integrally. Accordingly, the reflectance was significantly lower when compared to other diseases at 570 and 680 nm bands of visible light. A certain reflectance decrease was also noticed at 750 nm band (in the near-infrared area) due to multiple scattering. Both PM and YR are fungal diseases that form disease lesions on the leaf surface, yet there were substantial differences in color and texture of lesions. This led to noticeable differences in the spectral reflectance at 570 nm, while their spectral reflectance was similar at 680 nm. Some previous studies showed that the changes of biochemical, physiological status and visible symptoms induced by diseases and pests is critical in understanding the corresponding spectral responses. For powdery mildew, Zhang et al. [26] found that the spectral response of the disease was related to the breakdown of pigments, the destruction of cell structures and the color of pustules, and a significant difference was observed for Chla, Chlb and Car contents between normal and diseased samples. For aphids, Luo et al. [27] found that the pest would pierce the leaf and suck out leaf juice, which caused a reduction in chlorophyl and leaf water content. A negative correlation between chlorophyll content and aphid amount was observed with an R2 of 0.55. For yellow rust, Li et al. [28] found that the disease can induce the reduction of chlorophyll content, the water loss and visual symptoms; the Chla concentration was negatively correlated with the disease severity.
The new index, RTVI, introduced the trapezoidal area (ABED in Fig. 3) on the spectral curve, and let the triangle area (ABC in Fig. 3) to divide into the trapezoidal area. Such a change retained the sensitivity of the RTVI in cases leading to integral spectral changes as above mentioned. It was observed that the differences of the spectral indices between infected and healthy samples were significant for YR and PM, whereas they were insignificant for AH (Fig. 6). The RTVI showed higher sensitivity than TVI in detecting YR and PM. The infected area of AH was mainly characterized by pest secretion and sap-sucking damage, which had different spectral response mechanisms from those of YR and PM that were characterized by disease pustules.
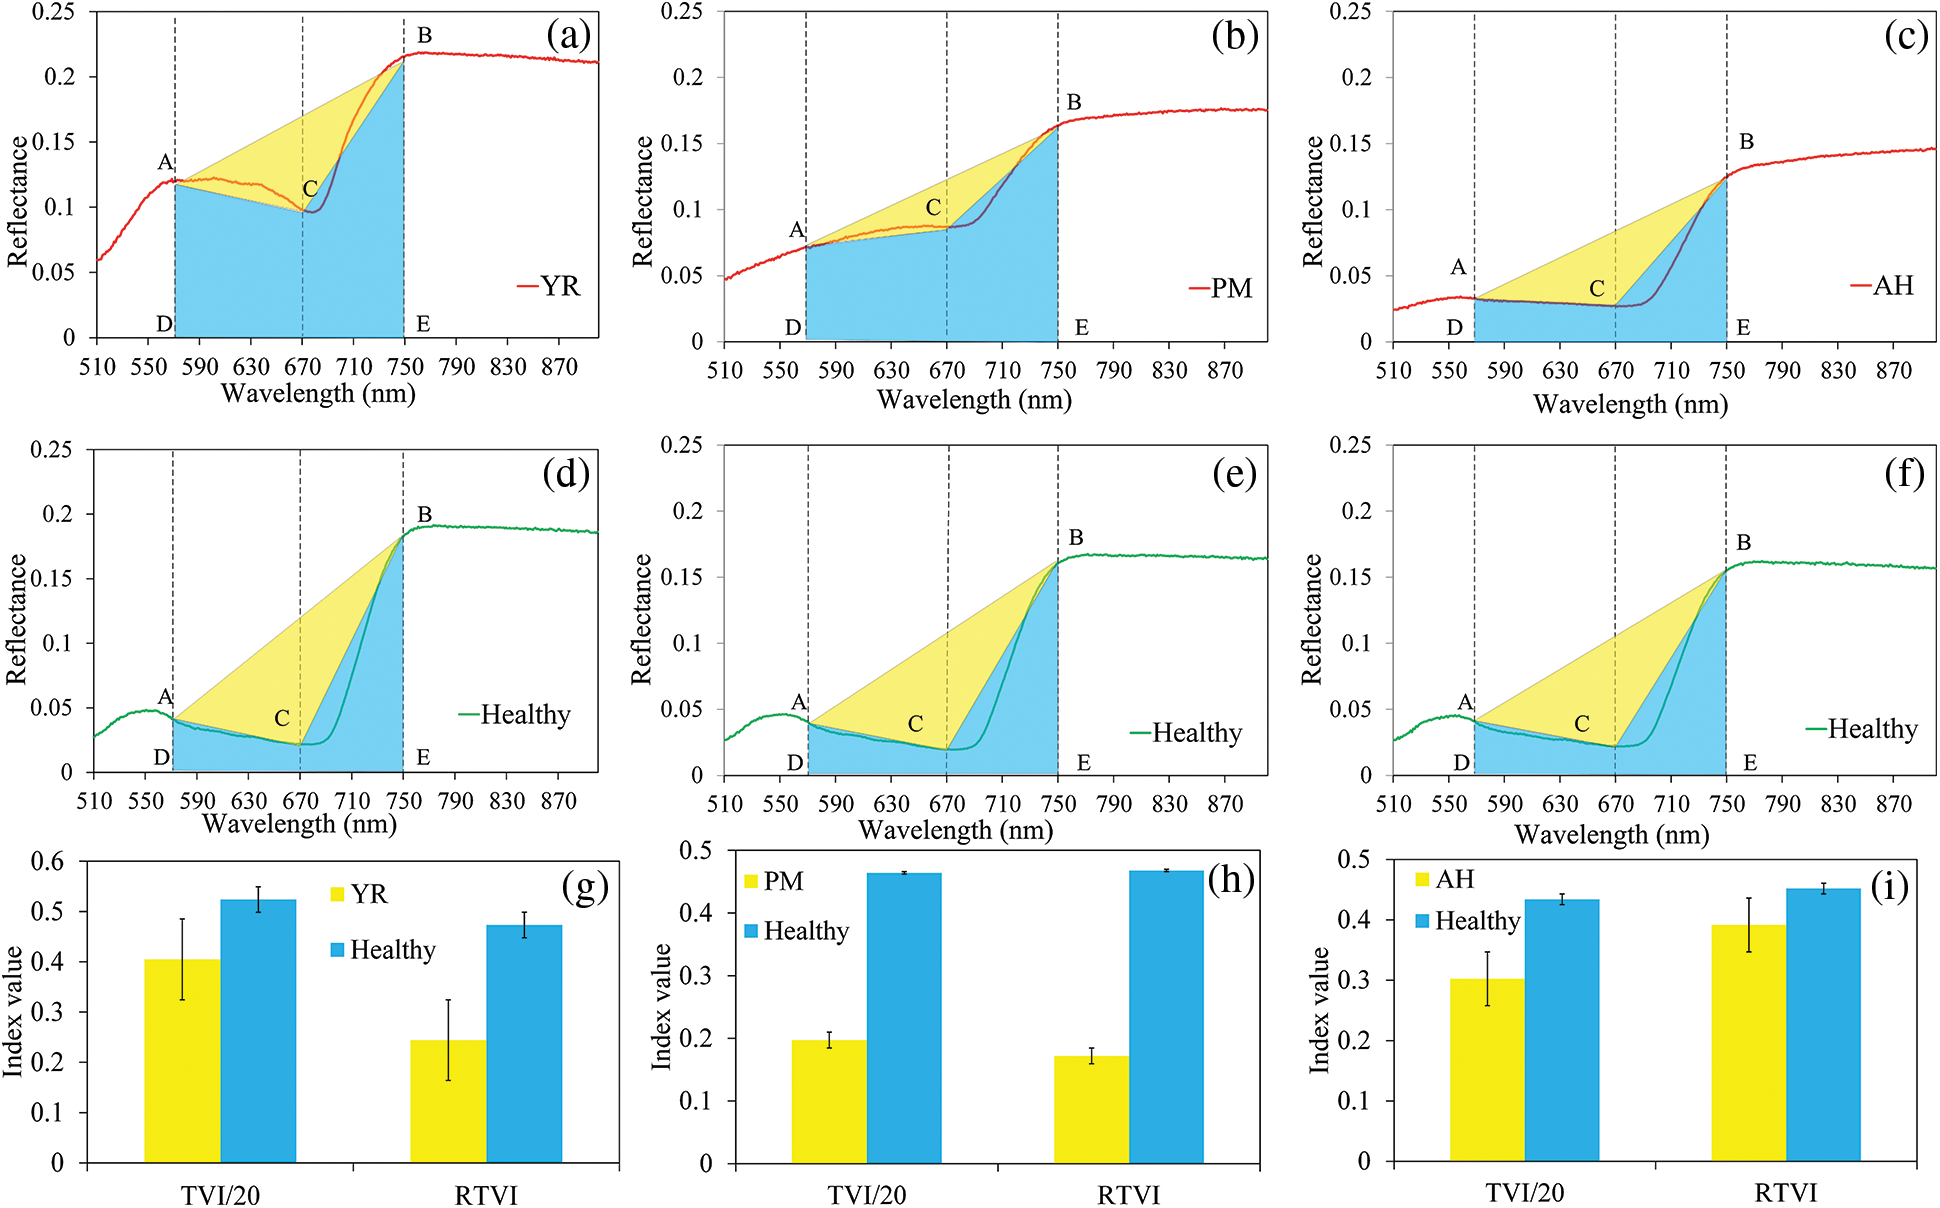
Figure 6: Schematic diagram of TVI and the proposed RTVI in detecting the three diseases and pest ((a), (b), and (c) show the average spectral curve of YR, PM and AH samples; (d), (e), and (f) show the average spectral curve of the healthy samples; (g), (h), and (i) show the comparison of TVI and RTVI between healthy and damaged samples (The two indices were scaled to an approximate range to facilitate the comparison). Dotted lines indicate the position of three selected bands (570, 680, and 750 nm), the yellow area indicates the area of triangle ABC, and both blue and yellow areas constructed the area of the trapezoid. The error bars in (g), (h), and (i) indicate the standard deviation of the indices)
3.2 Leaf Abnormal Area Identification
Leaf abnormal area identification as the basis of leaf diseases and pests identification included leaf and background separation and leaf lesion area extraction. Fig. 7 shows RGB image of modeling samples, image at 750 nm band and generated mask image based on the 750 nm band image. It can be observed that the constructed mask image based on the threshold value (i.e., the pixel value greater than 0.08 at the 750 nm band was judged as the leaf area) was successfully used to mask the image and to remove the background. Accordingly, the background was effectively eliminated and subsequent analysis focused only on the plant leaves was enabled. The non-plant background removal is important in disease detection with hyperspectral imaging data since it permits the subsequent analysis focusing only on the plant leaves. In detecting rice sheath blight disease with an in-situ hyperspectral imaging data, a more complex strategy was used combining K-means clustering and spectral feature space analysis [29]. While considering the relatively simple experimental environment, the high-quality background removal results can be achieved with this simple method, and the 750 nm band can also be used in subsequent steps.
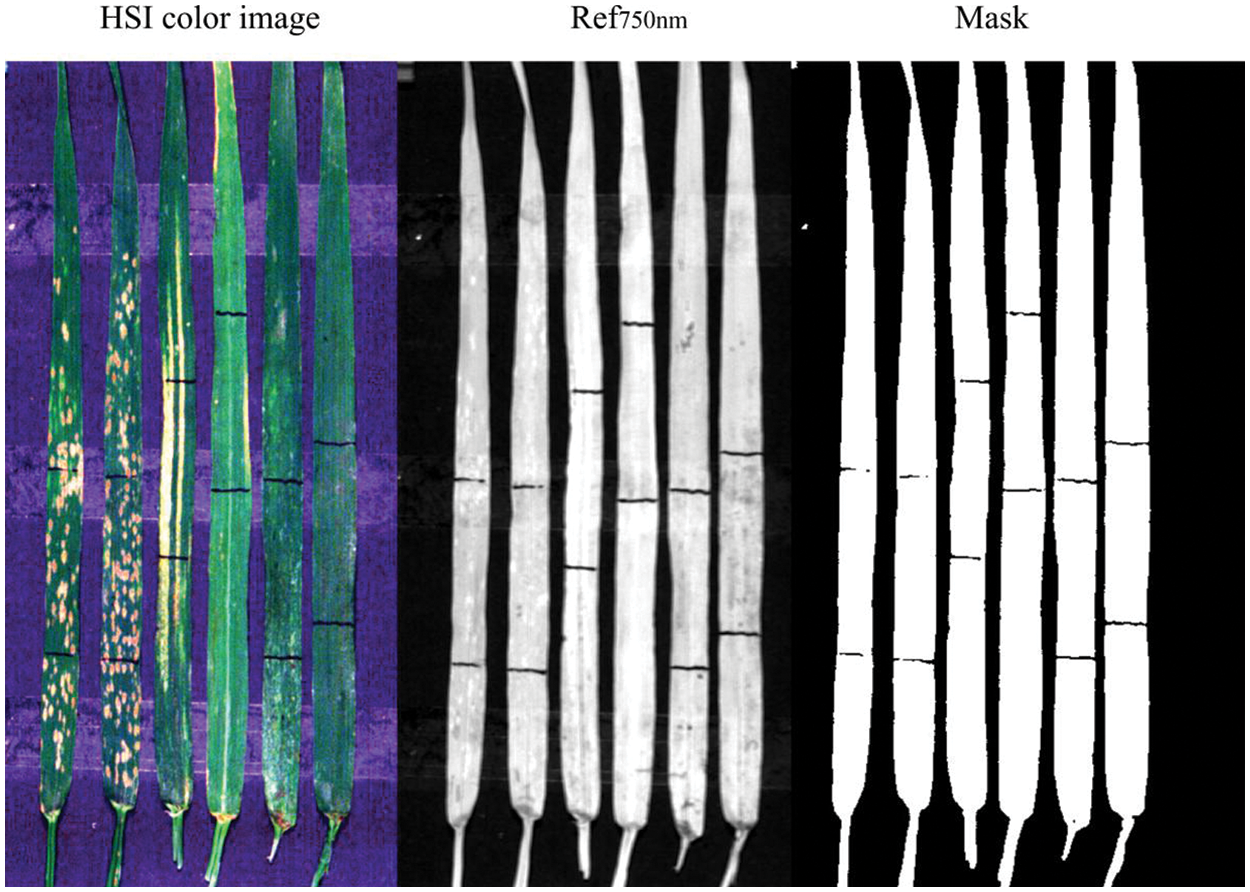
Figure 7: Mask image based on the 750 nm band image (The black bars on the leaves are made with black markers for locating different regions in leaves for comparison)
Based on the RTVI index image, a threshold segmentation method was used to identify the lesion areas. According to a stepwise threshold optimization within a range of 0.25–0.50, the threshold of RTVI was determined as 0.4 in subsequent analysis. Fig. 8 shows the segmentation results of damaged and healthy areas in six leaves based on the selected RTVI threshold. The similar stepwise threshold optimization is also adopted in finding the threshold of spectral feature for mapping the damage of maize armyworm with satellite multispectral images [30]. The promising results in both studies suggested the effectiveness of the simple and straightforward approach in classifying healthy and damaged areas. The results showed that RTVI combined with the optimized threshold segmentation identified three diseases and pests with better accuracy and strong robustness. This method utilizes only a few hyperspectral bands and relatively simple feature forms and recognition methods for effective identification of leaf abnormal areas (disease and pest lesions). Therefore, it can provide a relatively simple and ideal environment for further classification and identification of diseases and pests. Such idea of normalization of vegetation index is also found to be effective in estimation of the disease severity level of cotton root rot [31].
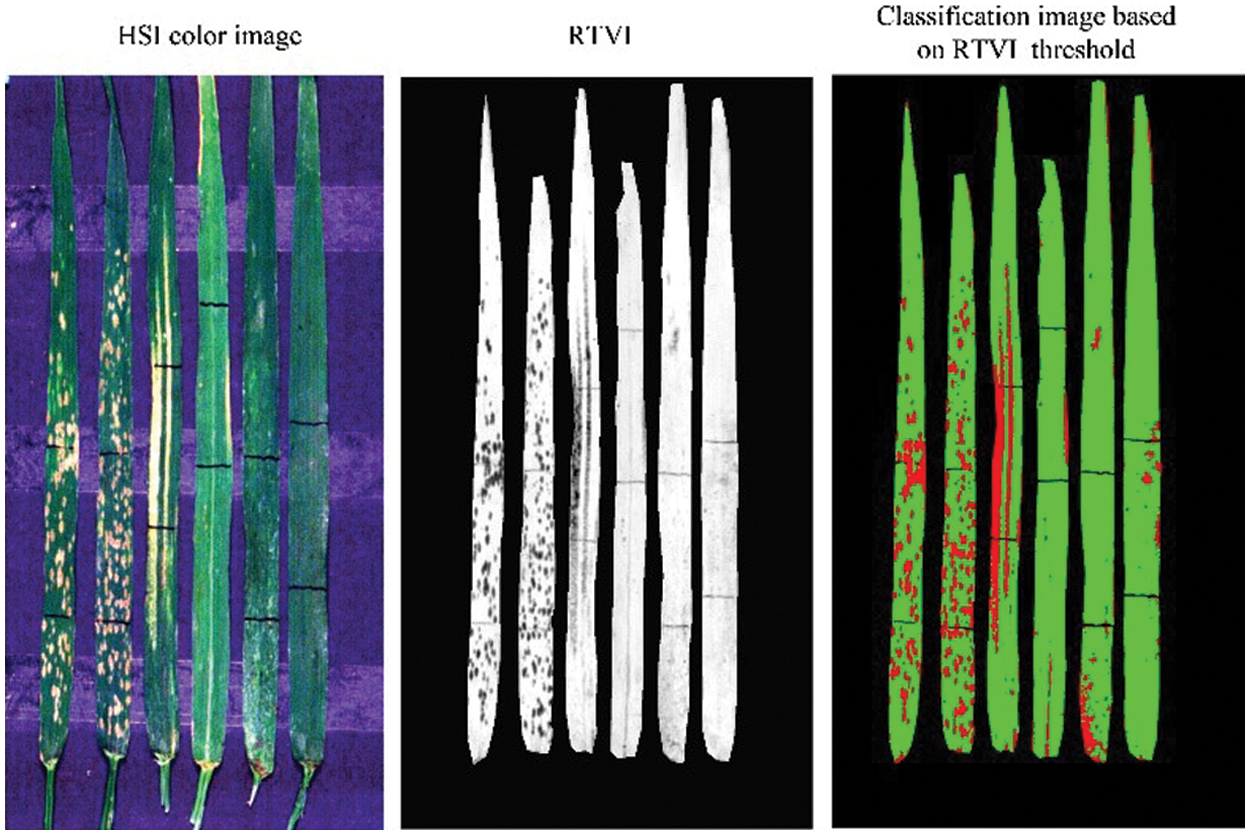
Figure 8: Schematic diagram of segmenting damaged and healthy areas based on the selected threshold of RTVI
3.3 Modeling and Accuracy Evaluation of Diseases and Pests Lesions Discrimination Based on the Spectral Ratio Characteristics
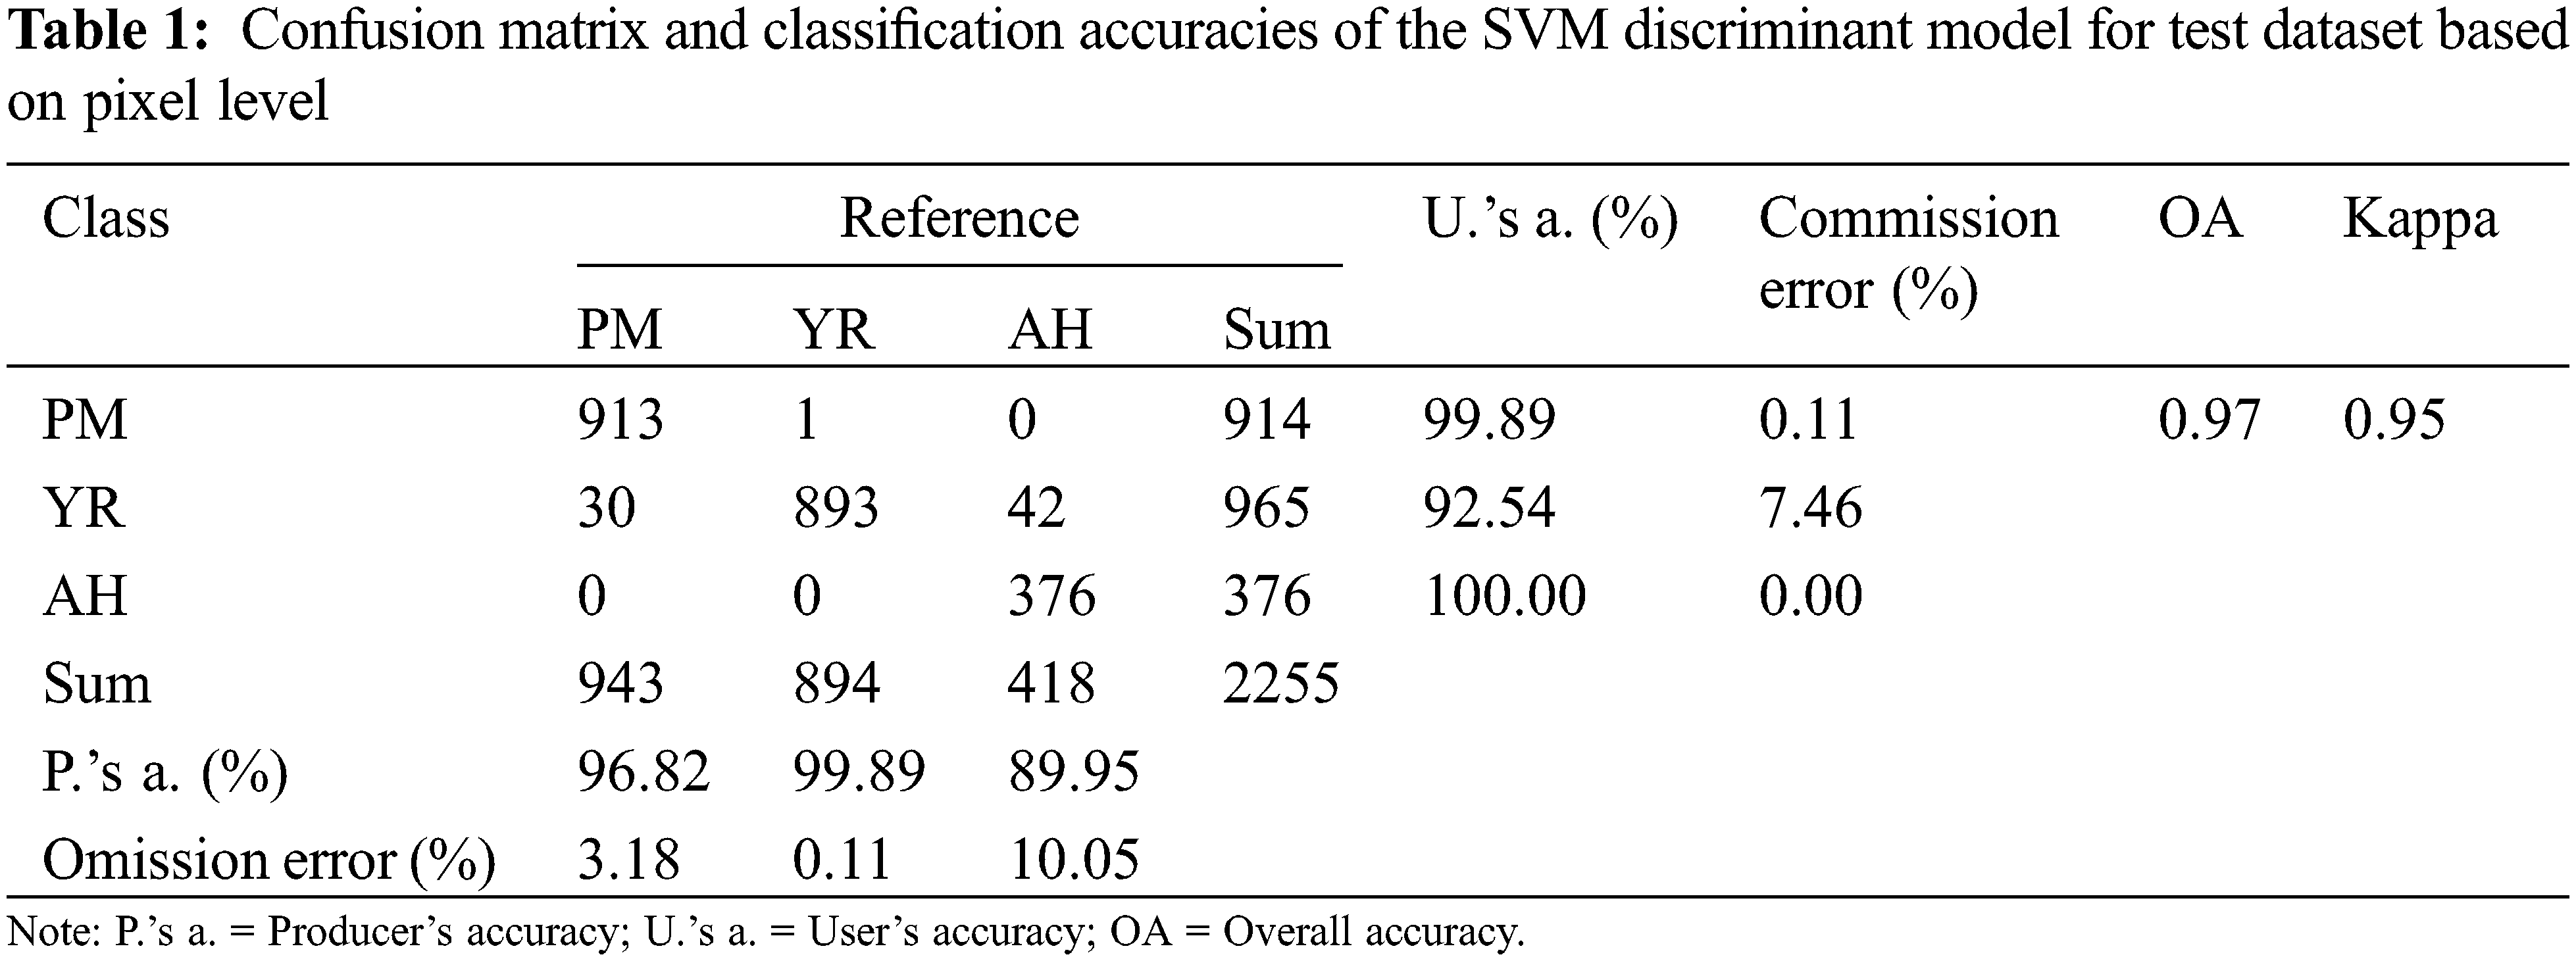
The spectral ratio feature images show the spectral response of affected lesions. The direction (increase or decrease) and amplitude of reflectance changes at representative bands of vegetation can be understood as a spectral fingerprint of infection specific for different diseases and pests. In this study, extracted spectral ratio feature images (according to Section 2.3.3) were used as input for the model, while the types of diseases and pests were used as the output results of it. Fig. 9 shows the discrimination results of training samples based on the SVM model. A total of 2255 independent verification samples (943 pixels of PM, 894 pixels of YR, and 418 pixels of AH) were selected and included typical leaves with three types of diseases and pests for conducting a classification accuracy validation at pixel level. The results of the confusion matrix are presented in Table 1. It is noted that the overall accuracy of the SVM discriminant model can reach 97% with the kappa coefficient of 0.95. By analyzing the confusion matrix, the misclassification from YR pixels to PM and AH pixels was the major type of error, which led to a relatively high commission error for YR (7.46%), moderate and high omission errors for PM (3.18%) and AH (10.05%), respectively. According to the highest proportion principle, the model correctly judged all six leaf samples on the leaf level with the classification accuracy of 100%. As reviewed by Zhang et al. [32], the SVM have been widely applied in the detection of a variety of plant diseases and pests. The capability of the SVM in projecting the data to a high-dimensional space with a kernel function makes it competent in complicated classification tasks.
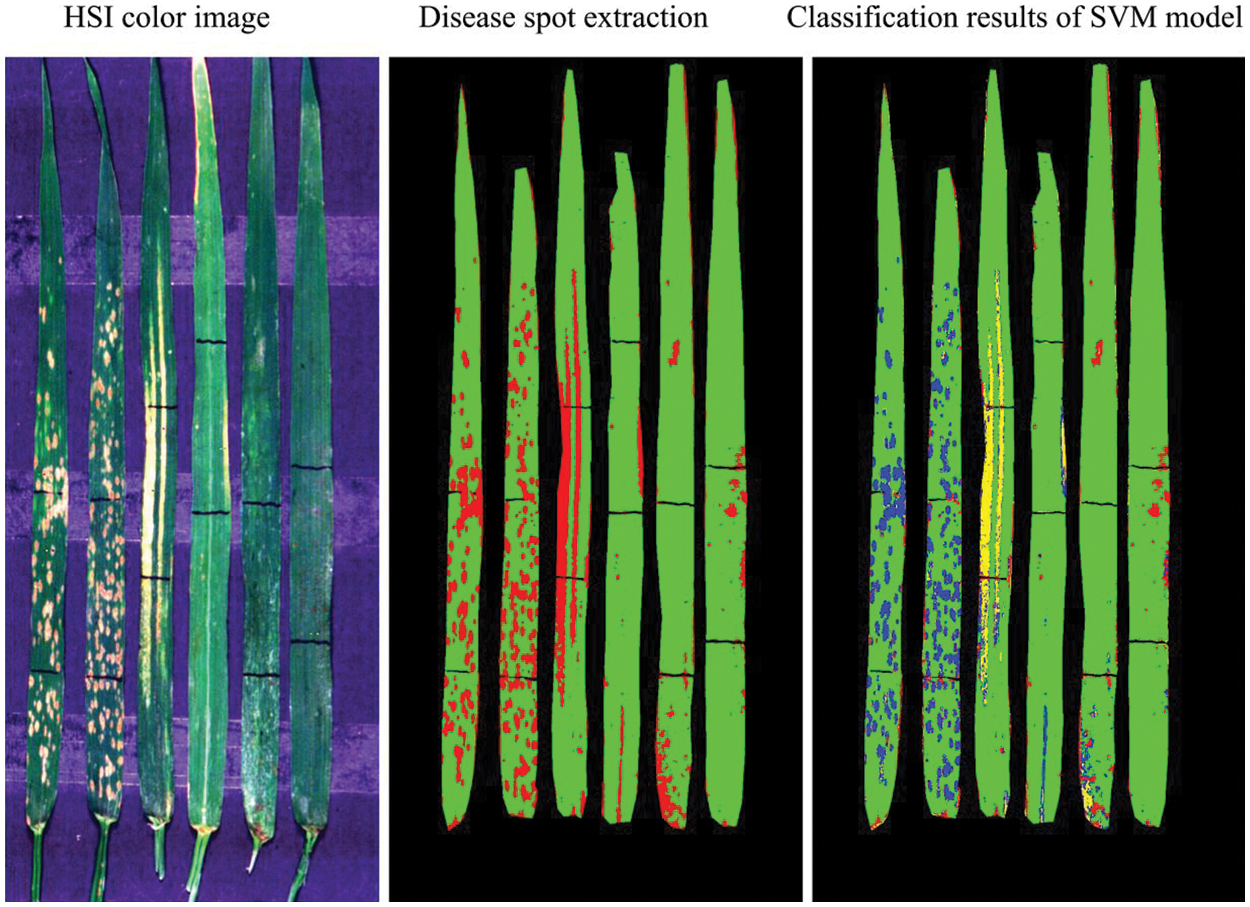
Figure 9: Schematic diagram of the classification of different types of diseases and pest based on the SVM discriminant model (Yellow represents YR, blue represents PM, and red represents AH in the classification image of SVM model)
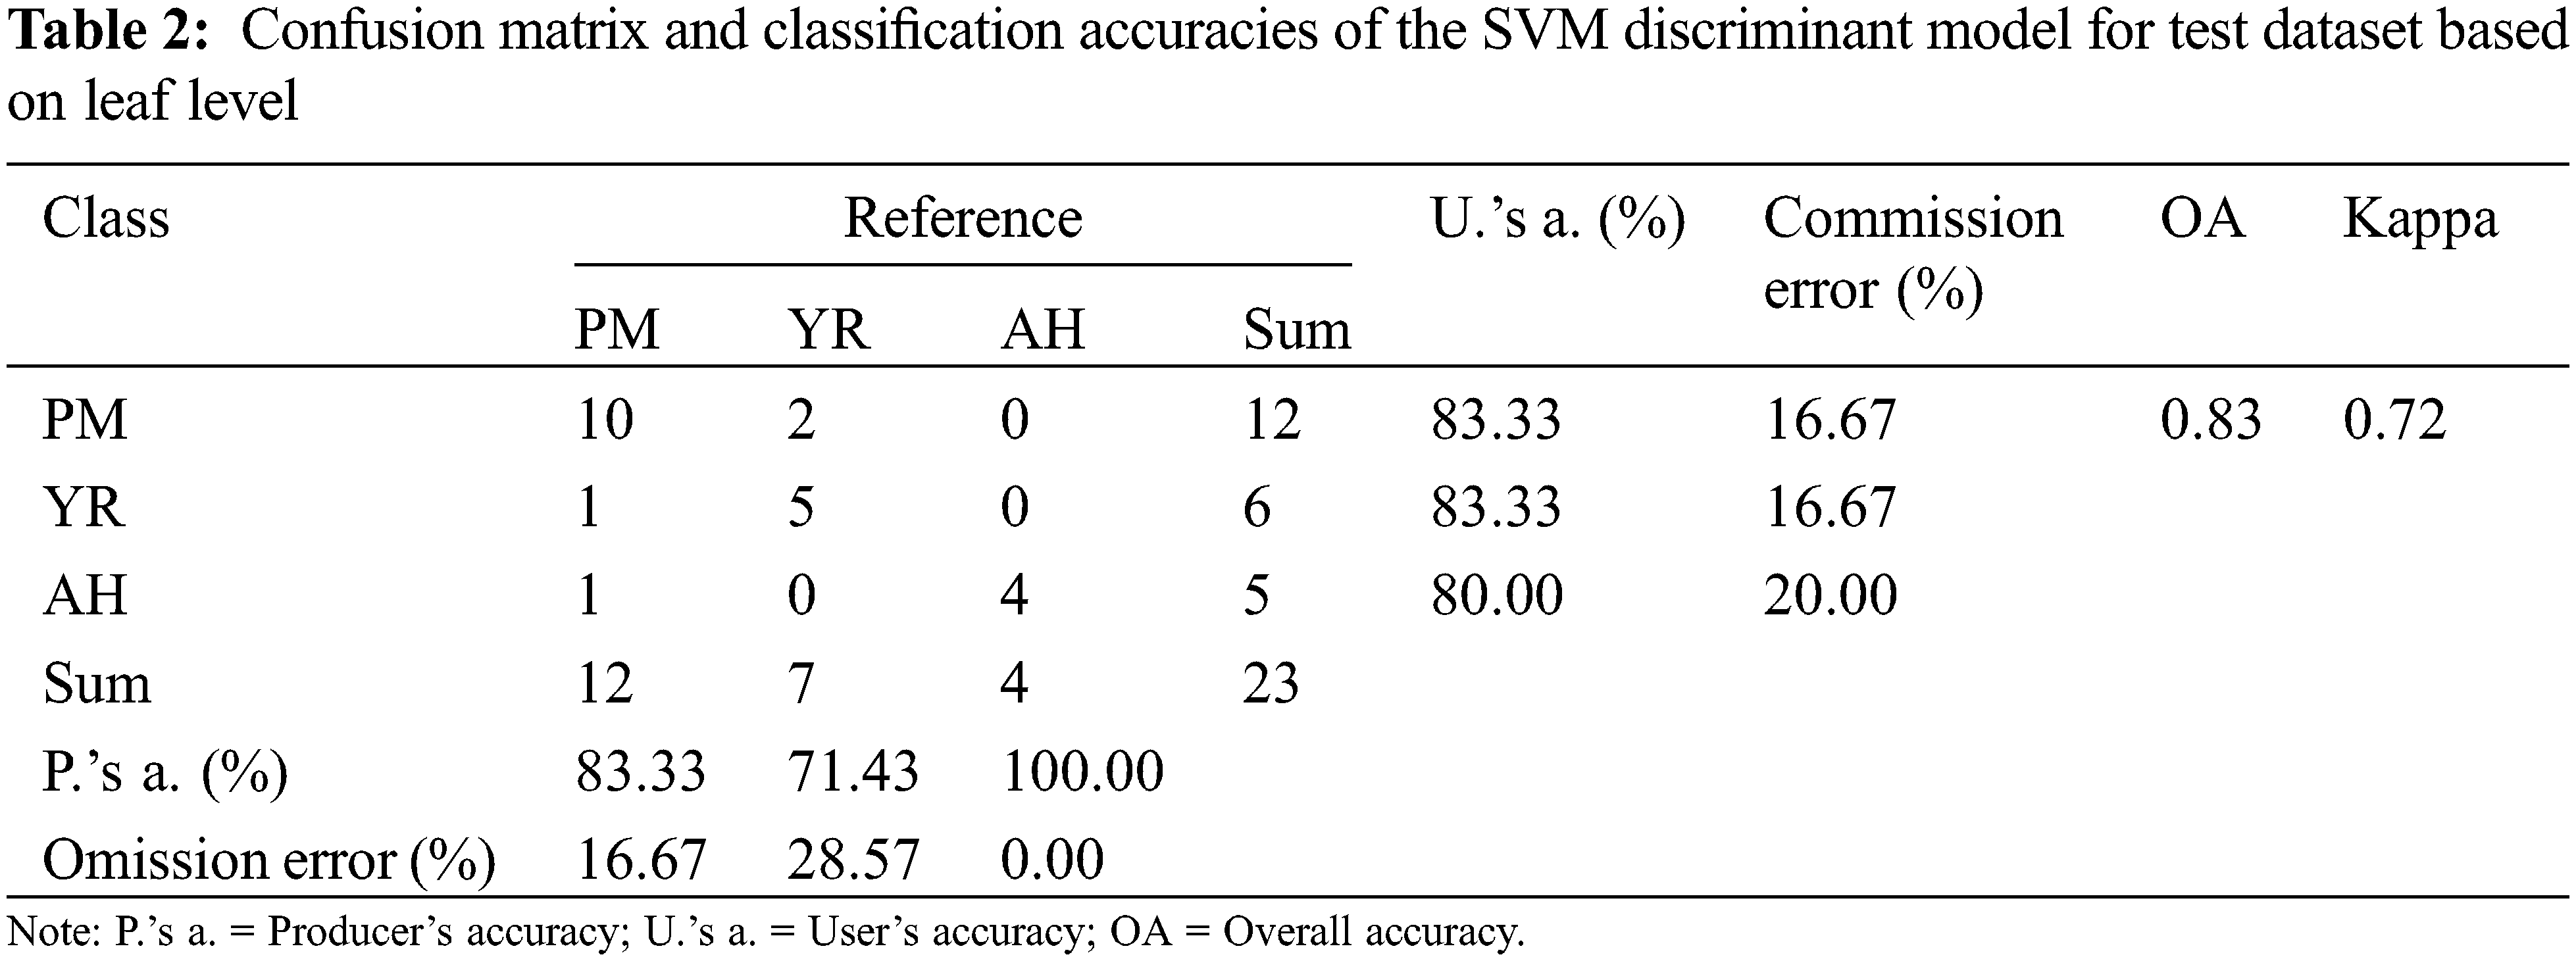
The accuracy of the SVM discriminant model was verified with 23 independent leaf samples. The confusion matrix of classification accuracy is presented in Table 2. It is noted that the overall accuracy of the independent verification samples was 83% and kappa was 0.72. By analyzing the confusion matrix, the misclassification mainly occurred between the YR and PM samples, which led to equivalent commission errors for YR (16.67%) and PM (16.67%). As indicated by the spectral ratio curves (Fig. 2b), the spectral response of YR and PM are approached to some extent, which thereby explained the confusion between the two classes.
The discriminant results of several representative samples are given in Fig. 10. It can be noticed that the core areas of diseases and pests lesions have higher accuracy, while misjudgments mostly occur for leaf edges, peripheral lesion areas, and leaf veins. The core areas of diseases and pests lesions show the typical spectral information of each disease and pest, so the discrimination accuracy is relatively high for these areas. The edges of lesions are in the primary stage of the infection with obscure symptoms, which leads to high misjudgment rates between diseases and pests types. Additionally, veins and leaf edges are easily mixed in the discrimination process. In the future, image analysis (e.g., texture features) could be combined in order to eliminate to a certain extent the influence of leaf edges and veins and to improve the accuracy of discrimination. Fig. 10 shows the discriminant results of the SVM model for the independent validation samples at the leaf level. It can be noticed that the number of correctly judged pixels was dominant, which indicates that the model has a good discriminative ability. However, the last sample with PM was wrongly judged as YR. It can be noticed that this result was mainly affected by the wrong judgment of the veins part. It is worth noting that the proportional voting procedure can be applied only in the context that there is only one stress type per leaf. However, it may not be true in reality [33], so the leaf level multiple-type infection needs to be considered in future works, to account for some more complicated scenarios. Besides, given that a relatively small number of samples were used in this study, it is necessary to further validate the proposed features and models with larger sample sizes.
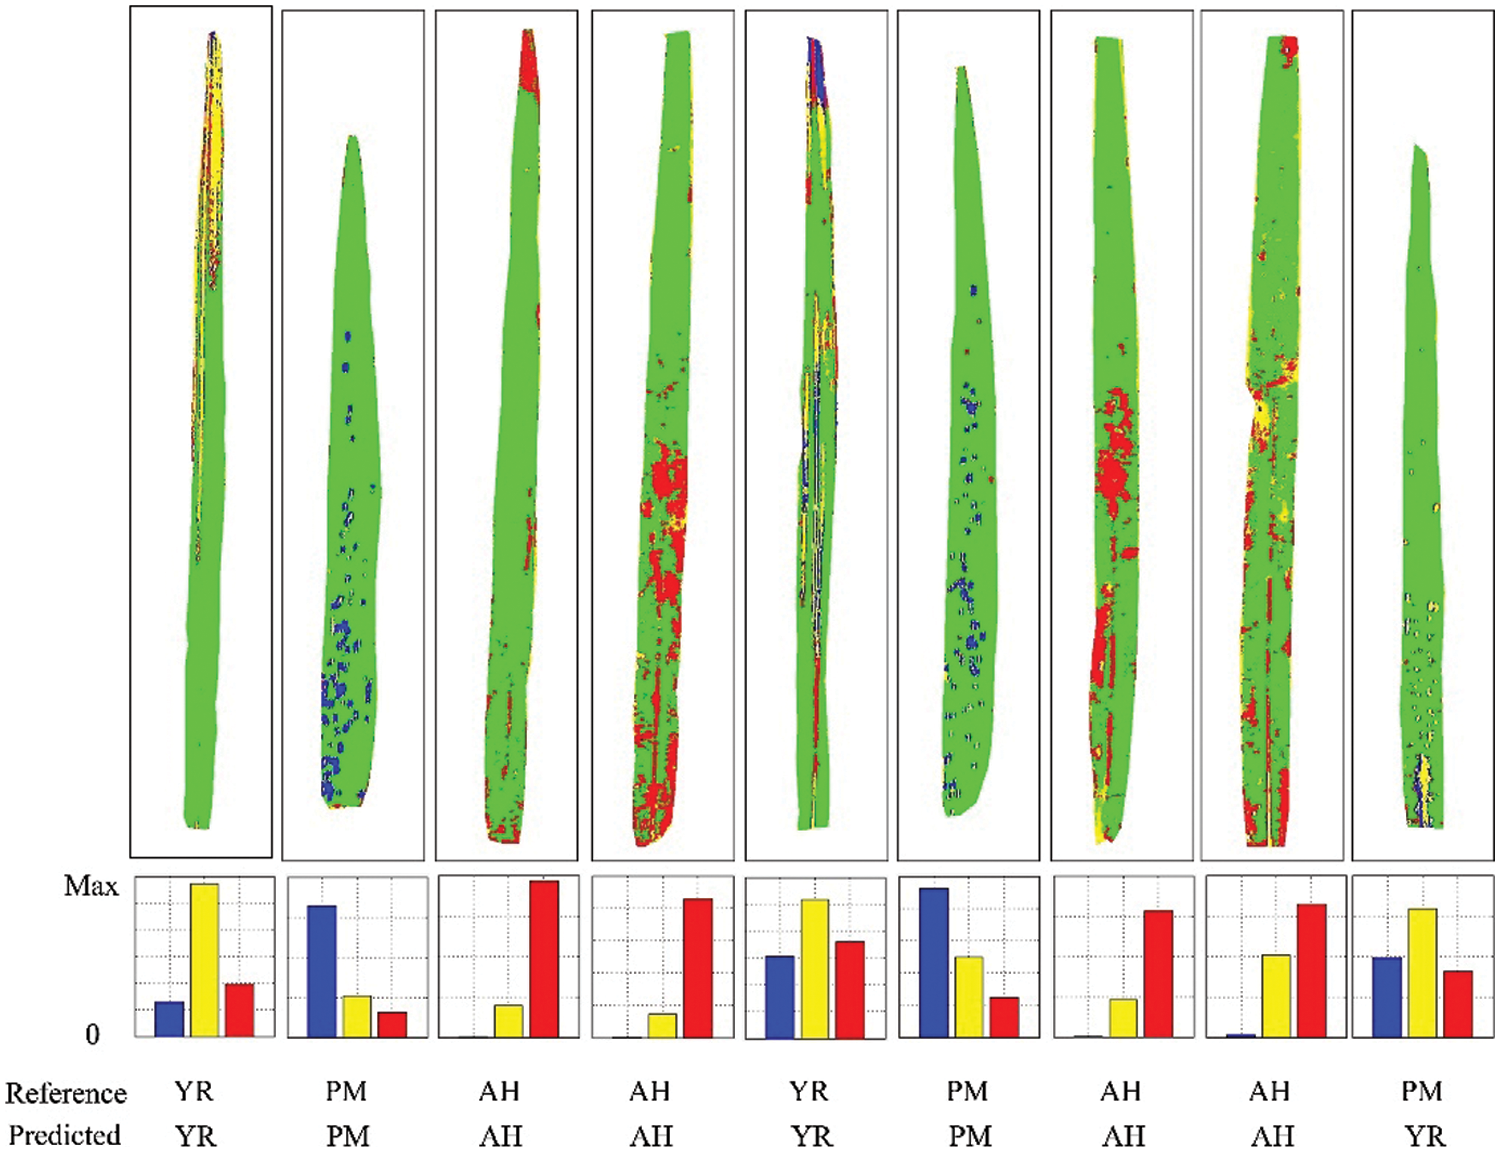
Figure 10: Schematic diagram of the discriminant results of the SVM model for independent validation samples at the leaf level (Yellow represents YR, blue represents PM, and red represents AH)
3.4 Potential for Instrument Development and Practical Application
In this study, the hyperspectral imaging technique was used as an experimental system, which may provide insights in understanding the spectral characteristic of the stresses, selection of optimal spectral bands or features, establishment of models for detection and discrimination. However, from a practical perspective, the application of the corresponding techniques in the real world requires the development of portable instruments. Instead of using the entire hyperspectral bands, instruments with some specific bands are able to achieve the trade-off between costs and functionality [15,32]. As indicated in the present study, it is encouraging that damages of plant diseases and pests can be successfully detected and discriminated with only a few bands. More importantly, the selected bands at 570, 680, and 750 nm are commonly used in the filter based optical sensors which ensure the high stability and low price. To examine the feasibility and applicability of the developed instrument in real field situations, it is necessary to conduct canopy level experiments and analysis. The development of the low-cost instruments that can be used at near-ground or mounted on the UAV should be the first step of its application. Schirrmann et al. [34] applied RGB images that acquired from UAV, and deep learning approaches to detect yellow rust in winter wheat yielded 57%–76% accuracy at an early stage. The findings in the current study thus provided valuable information on another dimension (i.e., spectral dimension), which may serve as a complementary way to the image based features. Some advanced network, such as 3-D convolution network that can combine spatial and spectral information is worth attempting to further enhance the data mining capability of hyperspectral imaging data [35]. Then, with the advance of the satellite sensors (with higher spectral and spatial resolution), it can be further attempt to use these remote sensing images to conduct the monitoring of diseases and pests over large areas.
Given the complexity of the type of the abnormality under field conditions, some abiotic stresses (e.g., nutrient stress, water stress) may co-occur with the biotic stresses, which thereby also need to be taken into account. It is encouraging that the identified three bands were also included in some relevant vegetation indices. For example, Photochemical/Physiological Reflectance Index (PRI; including 570 nm bands) and MERIS Terrestrial Chlorophyll Index (MTCI; including 680 and 750 nm bands) could be potentially used in N-stress estimation [18,24]. Besides, some prior knowledge and auxiliary information (e.g., relevant phenological information, meteorological conditions) can also help to determine the occurrence likelihood of these stresses. In the future, a control experiment that includes temporal continuous field measurements and investigations are expected, to facilitate the analysis on temporal changes of spectral characteristics and seek the possibility for early detection of diseases and pests at the field.
Identification and differentiation of different plant diseases and pests is a practically important task in plant monitoring via remote sensing technology. In this study, based on hyperspectral imaging technique, a detection and discrimination method was proposed and successfully applied in differentiating three typical diseases and pests of winter wheat (powdery mildew, yellow rust, and aphid) in Northern China. The main conclusions are as follows:
(1) The wheat diseases and pests can be effectively detected and discriminated through a proposed stepwise procedure that includes background elimination, extraction of spectral features, identification of damaged areas, and discrimination of stresses. A relatively satisfactory accuracy is achieved of the discriminant model, with OA of 83% and kappa coefficient of 0.72.
(2) It is encouraging that the detecting procedure was successfully established on only three specific bands at 570, 680, and 750 nm, which significantly reduced the computational load. Based on these bands, an improved index (RTVI) was proposed for distinguishing damaged areas on leaves, that was able to facilitate further discrimination of diseases and pests.
(3) Based on the constructed spectral ratio fingerprint and the SVM algorithm, the wheat diseases and pests can be effectively differentiated on a leaf level. While the feasibility of the discrimination model on canopy level is still unknown, it needs to be tested in future research. Its adaptability to some more complex scenarios is also worth studied.
The proposed method for detecting and differentiating wheat diseases and pests is established on only a few spectral bands and some simple algorithms. It has great potential to serve as a core method in designing a customized optical sensor for detecting plants’ stresses. Such non-contact and low-cost techniques may bring new insights in crop protection and phenotypic studies of crop resistance to diseases and pests.
Authorship: The authors confirm contribution to the paper as follows: Lin Yuan conceived and designed the study and wrote the initial manuscript. Jingcheng Zhang supervised the project and designed the research. Quan Deng, Haolin Wang and Xiankun Du analyzed the data. Lin Yuan and Yingying Dong conducted the experiments. Jingcheng Zhang reviewed and edited the final version of the manuscript. All authors have read and agreed to the published version of the manuscript.
Funding Statement: This work was subsidized by National Natural Science Foundation of China (Grant No. 42071420), External Cooperation Program of the Chinese Academy of Sciences (183611KYSB20200080), National Key R&D Program of China (2019YFE0125300), and Beijing Nova Program of Science and Technology (Z191100001119089).
Conflicts of Interest: The authors declare that they have no conflicts of interest to report regarding the present study.
References
1. El-Ghany, A., Nersreen, M., El-Aziz, A., Shadia, E., Marei, S. S. (2020). A review: Application of remote sensing as a promising strategy for insect pests and diseases management. Environmental Science and Pollution Research, 27(27), 33503–33515. DOI 10.1007/s11356-020-09517-2. [Google Scholar] [CrossRef]
2. Lowe, A., Harrison, N., French, A. P. (2017). Hyperspectral image analysis techniques for the detection and classification of the early onset of plant disease and stress. Plant Methods, 13(1), 80. DOI 10.1186/s13007-017-0233-z. [Google Scholar] [CrossRef]
3. Barreto, A., Paulus, S., Varrelmann, M., Mahlein, A. K. (2020). Hyperspectral imaging of symptoms induced by Rhizoctonia solani in sugar beet: Comparison of input data and different machine learning algorithms. Journal of Plant Diseases and Protection, 127(4), 441–451. DOI 10.1007/s41348-020-00344-8. [Google Scholar] [CrossRef]
4. Prabhakar, M., Prasad, Y. G., Thirupathi, M., Sreedevi, G., Dharajothi, B. et al. (2011). Use of ground based hyperspectral remote sensing for detection of stress in cotton caused by leafhopper (Hemiptera: Cicadellidae). Computers and Electronics in Agriculture, 79(2), 189–198. DOI 10.1016/j.compag.2011.09.012. [Google Scholar] [CrossRef]
5. Yu, K., Anderegg, J., Mikaberidze, A., Karisto, P., Mascher, F. et al. (2018). Hyperspectral canopy sensing of wheat Septoria tritici blotch disease. Frontiers in Plant Science, 9, 01195. DOI 10.3389/fpls.2018.01195. [Google Scholar] [CrossRef]
6. Oerke, E. C., Herzog, K., Toepfer, R. (2016). Hyperspectral phenotyping of the reaction of grapevine genotypes to Plasmopara viticola. Journal of Experimental Botany, 67(18), 5529–5543. DOI 10.1093/jxb/erw318. [Google Scholar] [CrossRef]
7. de Costa, D. M., de Costa, J. M., Weerathunga, M. T., Prasannath, K., Bulathsinhalage, V. N. (2021). Assessment of management practices, awareness on safe use of pesticides and perception on integrated management of pests and diseases of chilli and tomato grown by small-scale farmers in selected districts of Sri Lanka. Pest Management Science, 77(11), 5001–5020. DOI 10.1002/ps.6542. [Google Scholar] [CrossRef]
8. Sun, D., Robbins, K., Morales, N., Shu, Q., Cen, H. (2022). Advances in optical phenotyping of cereal crops. Trends in Plant Science, 27(2), 191–208. DOI 10.1016/j.tplants.2021.07.015. [Google Scholar] [CrossRef]
9. Graeff, S., Link, J., Claupein, W. (2006). Identification of powdery mildew (Erysiphe graminis sp. tritici) and take-all disease (Gaeumannomyces graminis sp. tritici) in wheat (Triticum aestivum L.) by means of leaf reflectance measurements. Central European Journal of Biology, 1(2), 275–288. [Google Scholar]
10. Mahlein, A. K., Rumpf, T., Welke, P., Dehne, H. W., Plümer, L. et al. (2013). Development of spectral indices for detecting and identifying plant diseases. Remote Sensing of Environment, 128(4), 21–30. DOI 10.1016/j.rse.2012.09.019. [Google Scholar] [CrossRef]
11. Zhao, Y. R., Yu, K. Q., Li, X., He, Y. (2016). Detection of fungus infection on petals of rapeseed (Brassica napus L.) using NIR hyperspectral imaging. Scientific Reports, 6(1), 38878. DOI 10.1038/srep38878. [Google Scholar] [CrossRef]
12. Zhang, J., Wang, N., Yuan, L., Chen, F., Wu, K. (2017). Discrimination of winter wheat disease and insect stresses using continuous wavelet features extracted from foliar spectral measurements. Biosystem Engineering, 162, 20–29. DOI 10.1016/j.biosystemseng.2017.07.003. [Google Scholar] [CrossRef]
13. Polder, G., van der Heijden, G. W., Keizer, L. P., Young, I. T. (2003). Calibration and characterization of imaging spectrographs. Journal of Near Infrared Spectroscopy, 11(3), 193–210. DOI 10.1255/jnirs.366. [Google Scholar] [CrossRef]
14. West, J. S., Bravo, C., Oberti, R., Lemaire, D., Moshou, D. et al. (2003). The potential of optical canopy measurement for targeted control of field crop diseases. Annual Review of Phytopathology, 41(1), 593–614. DOI 10.1146/annurev.phyto.41.121702.103726. [Google Scholar] [CrossRef]
15. Pu, R. (2017). Hyperspectral remote sensing: Fundamentals and practices, 1st edition. USA, Boca Raton: CRC Press. [Google Scholar]
16. Broge, N. H., Leblanc, E. (2001). Comparing prediction power and stability of broadband and hyperspectral vegetation indices for estimation of green leaf area index and canopy chlorophyll density. Remote Sensing of Environment, 76(2), 156–172. DOI 10.1016/S0034-4257(00)00197-8. [Google Scholar] [CrossRef]
17. Gitelson, A. A., Merzlyak, M. N. (1996). Signature analysis of leaf reflectance spectra: Algorithm development for remote sensing of chlorophyll. Journal of Plant Physiology, 148(3–4), 494–500. DOI 10.1016/S0176-1617(96)80284-7. [Google Scholar] [CrossRef]
18. Gamon, J. A., Peñuelas, J., Field, C. B. (1992). A Narrow-waveband spectral index that tracks diurnal changes in photosynthetic efficiency. Remote Sensing of Environment, 41(1), 35–44. DOI 10.1016/0034-4257(92)90059-S. [Google Scholar] [CrossRef]
19. Gitelson, A. A., Keydan, G. P., Merzlyak, M. N. (2006). Three-band model for noninvasive estimation of chlorophyll, carotenoids, and anthocyanin contents in higher plant leaves. Geophysical Research Letters, 33(11), 431–433. DOI 10.1029/2006GL026457. [Google Scholar] [CrossRef]
20. Merzlyak, M. N., Gitelson, A. A., Chivkunova, O. B., Rakitin, V. Y. (1999). Non-destructive optical detection of pigment changes during leaf senescence and fruit ripening. Physiologia Plantarum, 106(1), 135–141. DOI 10.1034/j.1399-3054.1999.106119.x. [Google Scholar] [CrossRef]
21. Peñuelas, J., Baret, F., Filella, I. (1995). Semi-empirical indices to assess carotenoids/Chlorophyll-a ratio from leaf spectral reflectance. Photosynthetica, 31(2), 221–230. [Google Scholar]
22. Peñuelas, J., Gamon, J. A., Fredeen, A. L., Merino, J., Field, C. B. (1994). Reflectance indices associated with physiological changes in nitrogen- and water-limited sunflower leaves. Remote Sensing of Environment, 48(2), 135–146. DOI 10.1016/0034-4257(94)90136-8. [Google Scholar] [CrossRef]
23. Sims, D. A., Gamon, J. A. (2002). Relationships between leaf pigment content and spectral reflectance across a wide range of species, leaf structures and developmental stages. Remote Sensing of Environment, 81(2–3), 337–354. DOI 10.1016/S0034-4257(02)00010-X. [Google Scholar] [CrossRef]
24. Dash, J., Curran, P. J. (2004). The MERIS terrestrial chlorophyll index. International Journal of Remote Sensing, 25(23), 5403–5413. DOI 10.1080/0143116042000274015. [Google Scholar] [CrossRef]
25. Mountrakis, G., Im, J., Ogole, C. (2011). Support vector machines in remote sensing: A review. ISPRS Journal of Photogrammetry and Remote Sensing, 66(3), 247–259. DOI 10.1016/j.isprsjprs.2010.11.001. [Google Scholar] [CrossRef]
26. Zhang, J., Pu, R., Wang, J., Huang, W., Yuan, L. et al. (2012). Detecting powdery mildew of winter wheat using leaf level hyperspectral measurements. Computers and Electronics in Agriculture, 85, 13–23. DOI 10.1016/j.compag.2012.03.006. [Google Scholar] [CrossRef]
27. Luo, J., Huang, W., Zhao, J., Zhang, J., Zhao, C. et al. (2013). Detecting aphid density of winter wheat leaf using hyperspectral measurements. IEEE Journal of Selected Topics in Applied Earth Observations and Remote Sensing, 6(2), 690–698. DOI 10.1109/JSTARS.4609443. [Google Scholar] [CrossRef]
28. Li, J., Jiang, J., Chen, Y., Wang, Y., Su, W. et al. (2007). Using hyperspectral indices to estimate foliar chlorophyll a concentrations of winter wheat under yellow rust stress. New Zealand Journal of Agricultural Research, 50(5), 1031–1036. DOI 10.1080/00288230709510382. [Google Scholar] [CrossRef]
29. Zhang, J., Tian, Y., Yan, L., Wang, B., Wang, L. et al. (2021). Diagnosing the symptoms of sheath blight disease on rice stalk with an in-situ hyperspectral imaging technique. Biosystems Engineering, 209, 94–105. DOI 10.1016/j.biosystemseng.2021.06.020. [Google Scholar] [CrossRef]
30. Zhang, J., Huang, Y., Yuan, L., Yang, G., Chen, L. et al. (2015). Using satellite multispectral imagery for damage mapping of armyworm (Spodoptera frugiperda) in maize at a regional scale. Pest Management Science, 72(2), 335–348. DOI 10.1002/ps.4003. [Google Scholar] [CrossRef]
31. Zhao, H., Yang, C., Guo, W., Zhang, L., Zhang, D. (2020). Automatic estimation of crop disease severity levels based on vegetation index normalization. Remote Sensing, 12(12), 1930. DOI 10.3390/rs12121930. [Google Scholar] [CrossRef]
32. Zhang, J., Huang, Y., Pu, R., Gonzalez-Moreno, P., Yuan, L. et al. (2019). Monitoring plant diseases and pests through remote sensing technology: A review. Computers and Electronics in Agriculture, 165, 104943. DOI 10.1016/j.compag.2019.104943. [Google Scholar] [CrossRef]
33. Biswas, K. K., Tarafdar, A., Kumar, A., Dikshit, H. K., Malathi, V. G. (2009). Multiple infection in urdbean (Vigna mungo) in natural condition by begomovirus, tospovirus and urdbean leaf crinkle virus complex. Indian Phytopathology, 62(1), 75–82. [Google Scholar]
34. Schirrmann, M., Landwehr, N., Giebel, A., Garz, A., Dammer, K. H. (2021). Early detection of stripe rust in winter wheat using deep residual neural networks. Frontiers in Plant Science, 12, 469689. DOI 10.3389/fpls.2021.469689. [Google Scholar] [CrossRef]
35. Tang, X., Meng, F., Zhang, X., Cheung, Y. M., Ma, J. et al. (2020). Hyperspectral image classification based on 3-D octave convolution with spatial-spectral attention network. IEEE Transactions on Geoscience and Remote Sensing, 59(3), 2430–2447. DOI 10.1109/TGRS.36. [Google Scholar] [CrossRef]
Cite This Article
 Copyright © 2023 The Author(s). Published by Tech Science Press.
This work is licensed under a Creative Commons Attribution 4.0 International License , which permits unrestricted use, distribution, and reproduction in any medium, provided the original work is properly cited.
 Downloads
 Citation Tools