
 Submit a Paper
 Propose a Special lssue
 Open Access
ARTICLE
Integrated Data Reveal the Flavonoid Biosynthesis Metabolic Pathway in Semen Ziziphi Spinosae Using Transcriptomic and Metabolomic
1 Institute of Cash Crops, Hebei Academy of Agricultural and Forestry Sciences, Shijiazhuang, 050051, China
2 State Key Laboratory of Research & Development of Characteristic Qin Medicine Resources (Cultivation), Shaanxi University of Chinese Medicine, Xianyang, 712046, China
* Corresponding Author: Tao Jiang. Email:
(This article belongs to the Special Issue: Biotechnology of Plant Secondary Metabolites)
Phyton-International Journal of Experimental Botany 2023, 92(2), 369-382. https://doi.org/10.32604/phyton.2022.023184
Received 14 April 2022; Accepted 26 May 2022; Issue published 12 October 2022
 View Full Text
 Download PDF
Abstract
The extract from Semen Ziziphi Spinosae (SZS) contains many secondary metabolites (flavonoids, alkaloids, and terpenoids), widely reported for their high medicinal value. In order to know the number and type of flavonoids and the regulating mechanism of flavonoid biosynthesis during the growth and development of SZS, we identified and analyzed the flavonoid metabolites and genes in SZS using metabolomic and transcriptomic. A total of 13,232 differentially expressed genes and 83 flavonoid metabolites were identified at three different growth and development stages (T1, T2, and T3) of SZS. The main flavonoid metabolic components of SZS were catechin, L-epicatechin, (–)-epigallocatechin, (+)-gallocatechin, spinosin and its derivatives. A total of 53 unigenes encoding 15 enzymes were identified as candidate genes involved in flavonoid biosynthesis in SZS. Among, PAL, C4H, 4CL, CHS, CHI, FLS, FNS, ANS, ANR, LAR, and UFGT genes were all downregulated in T3 than in T1. The expression levels of these genes influence the accumulation of flavonoids in SZS. Our results should provide valuable information for flavonoid metabolites and candidate genes involved in flavonoid biosynthesis on SZSKeywords
Supplementary Material
Supplementary Material FileSemen Ziziphi Spinosae (SZS, the seeds of Ziziphus jujuba Mill. var. spinosa (Bunge) Hu ex H. F. Chou), is a traditional Chinese medicine that has been widely used to treat neurasthenia, insomnia, anxiety, and other symptoms in China for a long time [1,2,3]. SZS was recorded as an herb with sedative and hypnotic effects in the Shennong bencao jing (medicine monograph of China) 2500 years ago and is chiefly grown in Hebei, Shanxi, Henan, and Shandong provinces in China [4,5]. Modern analytical chemistry studies showed that SZS contains many bioactive components, such as flavonoids, alkaloids, and terpenoids [6–8]. The flavonoids of SZS are the main bioactive compounds that have been proven to be responsible for its sedative effects [9]. Especially, the SZS spinosin content is higher than 0.08% (w/w); spinosin is considered to be an active flavonoid for improving sleep [10].
Flavonoids are known for their high medicinal value and widely found in medicinal plants, including Perilla frutescens [11], Salvia miltiorrhiza [12], and Dendrobium catenatum [13]. These compounds can be classified into several categories, e.g., flavonols, flavones, flavanones, isoflavones, and anthocyanins. Their basic skeletons include kaempferol, apigenin, and quercetin [14]. Flavonoids are biosynthesized via the phenylpropanoid pathway, isoflavonoid pathway, flavone and flavonol pathway, and anthocyanin pathway in high plants. The key enzymes are phenylalanine ammonia-lyase (PAL), cinnamic acid 4-hydroxylase (C4H), chalcone synthase (CHS), chalcone isomerase (CHI), favonol synthase (FLS), and flavone synthase (FNS), etc. Wu et al. first reported 24 unigenes that were identified using transcriptomic technology, which were related to ginsenosides biosynthesis in Panax quinquefolius [15]. In recent years, transcriptomic technology has widely used to mine the key gene in secondary metabolites biosynthesis in plants [16,17].
On the other hand, ultra-performance liquid chromatography (UPLC/ESI-Q TRAP-MS/MS) is used for identification and analysis of plant metabolites and has the advantages of wide coverage, rapid separation, and high throughput and sensitivity [18,19]. To date, one hundred and forty-one metabolites were detected in SZS by UPLC-Q-Orbitrap-MS, including thirty primary metabolites and one hundred and eleven secondary metabolites [20]. Although some bioactive compounds have been identified in SZS, the number and type of flavonoids and the regulating mechanism of flavonoid biosynthesis in SZS are still unclear. In our study, we identified and analyzed the flavonoid metabolites and genes involving the biosynthesis of flavonoid metabolites in SZS using metabolomic and transcriptomic.
Z. jujuba var. spinosa were cultivated in the germplasm resources center of jujube at the Baijiazhuang Village, Taizijing Township, Xingtai City, Hebei Province, China. It is a common species that belongs to the plant family Rhamnaceae. The SZS were collected from the same tree in the germplasm resources center of jujube every two weeks, on 15 August (T1), 1 September (T2), and 15 September (T3) 2021. We confirm that the collection of plant material is compliant with relevant institutional, national, and international guidelines and legislation. All samples were frozen using liquid nitrogen and stored at −80°C for RNA and metabolite extraction.
Freeze-dried SZS samples were crushed using zirconia beads and a mixer mill (MM 400, VERDER RETSCH, Shanghai, China). The powder was weighed and 100 mg was resuspended in 1.0 mL 70% aqueous methanol and incubated overnight at 4°C. The solution (i.e., extract) was centrifuged at 10,000 g for 10 min. The supernatant was added to the CNWBOND Carbon-GCB SPE Cartridge (250 mg, 3 mL; ANPEL, Shanghai, China; www.anpel.com.cn/) and then filtered (SCAA-104, 0.22 μm pore size; ANPEL) before UPLC-MS/MS analysis.
2.3 Ultra Performance Liquid Chromatography (UPLC) Conditions
The extracts were analyzed using an UPLC-ESI-MS/MS system (UPLC, Shim-pack UFLC SHIMADZU CBM30A system, Shanghai, China). The analytical conditions were as follows: UPLC: column, Waters ACQUITY UPLC HSS T3 C18 (1.8 µm, 2.1 mm × 100 mm); solvent system, water (0.04% acetic acid): acetonitrile (0.04% acetic acid); gradient program, 100:0 (v/v) at 0 min, 5:95 (v/v) at 11.0 min, 5:95 (v/v) at 12.0 min, 95:5 (v/v) at 12.1 min, 95:5 (v/v) at 15.0 min; flow rate, 0.40 mL/min; temperature, 40°C; and injection volume: 2 μL. After UPLC, the effluent was alternatively connected to an ESI-triple quadrupole-linear ion trap (Q TRAP)-MS.
The LIT and triple quadrupole (QQQ) scans were acquired using the API 6500 Q TRAP LC-MS/MS system equipped with an ESI Turbo Ion-Spray interface. The system was operated in the positive ion mode and was controlled using the Analyst 1.6 software (AB Sciex). The ESI source operation parameters were as follows: ion source, turbo spray; source temperature, 500°C; ion spray voltage, 5,500 V; ion source gas I, gas II, and curtain gas were set at 55, 60, and 25.0 psi, respectively; and the collision gas was high. Instrument tuning and mass calibration were performed using 10 and 100 μmol/L polypropylene glycol solutions in the QQQ and LIT modes, respectively. The QQQ scans were acquired in MRM experiments, with the collision gas (nitrogen) set at 5 psi. The declustering potential and collision energy were optimized for individual MRM transitions. A specific set of MRM transitions was monitored for each period according to the metabolites eluted within the period.
2.5 Identification and Quantitative Analysis of Metabolites
A publicly available standard metabolite database (Metware Biotechnology Co., Ltd., Wuhan, China), which was built on the basis of multiple ion monitoring–enhanced product ions, was used for the qualitative analysis of metabolites. The quantitative analysis of metabolites was completed using a published multiple reaction monitoring method [21,22]. An unsupervised principal component analysis, hierarchical cluster analysis, and partial least-squares discriminant analysis were performed using the prcomp function within R (www.r-project.org). Metabolites that were significantly differentially abundant between groups were identified according to the following criteria: variable importance in projection value ≥1 and an absolute log2 (fold change) ≥1.
2.6 RNA Extraction and Illumina Sequencing
Total RNA was extracted from frozen leaves using the RNAprep Pure Plant Kit (TIANGEN Biotech, Beijing, China), after which RNA degradation and contamination were monitored by 1.2% agarose gel electrophoresis. The purified RNA concentrations were quantified using the NanoDropTM 1000 spectrophotometer (ThermoFisher Scientific, Shanghai, China). Poly (A) mRNA was enriched from the total RNA using Oligo (dT) magnetic beads. The poly (A) mRNA was subsequently fragmented by an RNA Fragmentation Kit (Ambion, Austin, TX, USA). The fragmented RNA was transcribed into first-strand cDNA using reverse transcriptase and random hexamer primers. Second-strand cDNA was synthesized using DNA polymerase I and RNase H (Invitrogen, Carlsbad, CA, USA). After end repair and the addition of a poly (A) tail, suitable length fragments were isolated and connected to the sequencing adaptors. The fragments were sequenced on the Illumina HiSeqTM 2500 platform [23].
2.7 RNA Sequencing (RNA-seq) Data Analysis and Annotation
To acquire high-quality reads, the raw reads in FASTQ format were processed through in-house Perl scripts. Clean reads were obtained from raw data by removing adaptor sequences, low-quality reads, and reads containing ploy-N. All downstream analyses were based on clean data with high quality. Transcriptome assembly was accomplished using Trinity software (version 2.5.1) [24]. Genes were functionally annotated according to the Kyoto Encyclopedia of Gene and Genome (KEGG) pathway database (http://www.genome.jp/kegg), the NCBI non-redundant (Nr) database (version 2018.4), the Swiss-Prot protein database (http://www.uniprot.org), the euKaryotic Clusters of Orthologous Groups (KOG) database (version 1.0), the Gene Ontology (GO) database (http://www.geneontology.org), and the Pfam database (version 33.0).
Gene expression levels were estimated by RSEM (version 1.2.26) [25]. Analysis of DEGs of the two groups was performed with the DESeq R package (1.10.1). DESeq provides statistical routines for determining DEGs using a model based on the negative binomial distribution. The results of all statistical tests underwent a Benjamini and Hochberg false discovery rate multiple testing correction. Genes were determined to be significantly differentially expressed at an adjusted P-value < 0.05. The GO enrichment analysis of the DEGs was performed using the topGO R package based on the Kolmogorov-Smirnov test. The pathways significantly associated with the DEGs were identified using the KEGG database (http://www.genome.jp/kegg) [26–28] and KOBAS software [29]. The complete RNA sequence raw data of SZS can be found in NCBI BioProject database (ID: PRJNA839422).
Each experiment was three biological replicates. Data were analyzed using Microsoft Office Excel 2013 software and presented as the means ± standard deviations. The significance of any differences was analyzed using P < 0.05 as the threshold.
3.1 Flavonoid Metabolites in SZS
We used a UPLC/ESI-Q TRAP-MS/MS system to identify the variation of differential flavonoid metabolites during the growth and development of SZS (Fig. 1). A total of 83 (T1, 81; T2, 82; T3, 81) flavonoid metabolites were identified. R software program was used to draw the heatmap of metabolites after unit variance scaling (UV), and the accumulation pattern of metabolites were described using hierarchical cluster analysis (HCA) (Fig. 2A). The 83 flavonoid metabolites were classified into 9 categories, including 3 chalcones, 5 dihydroflavones, 2 dihydroflavonols, 14 flavonols, 9 flavanols, 18 other flavonoids, 22 flavonoid carbonosides, 5 isoflavones, and 5 anthocyanins (Fig. 2B and Table S1).
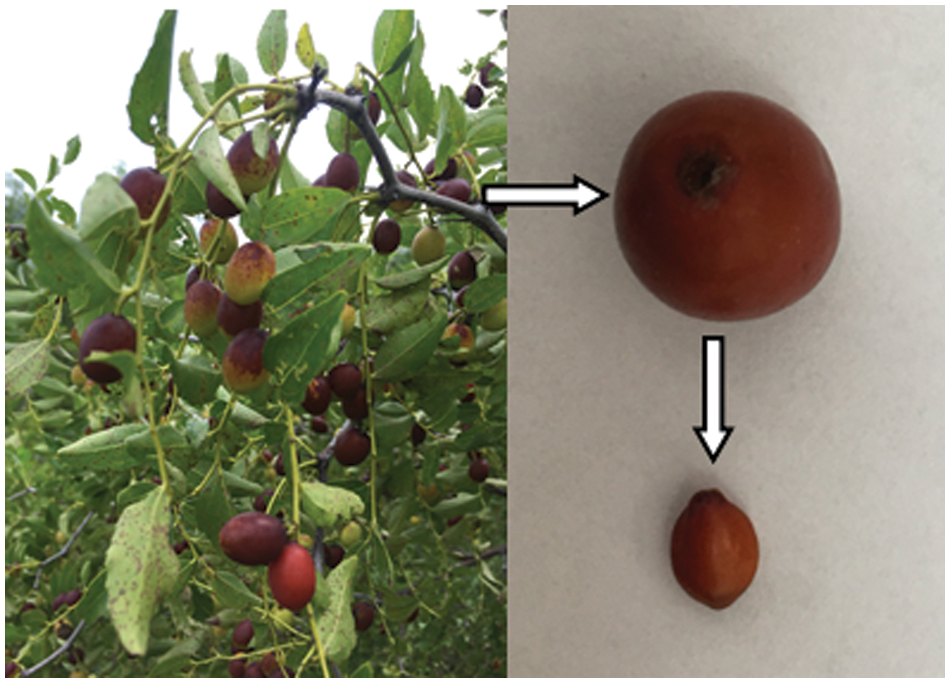
Figure 1: Sampling process of Z. Spinosae. The arrow indicated the sampling process from tree to fruit, and from fruit to seed
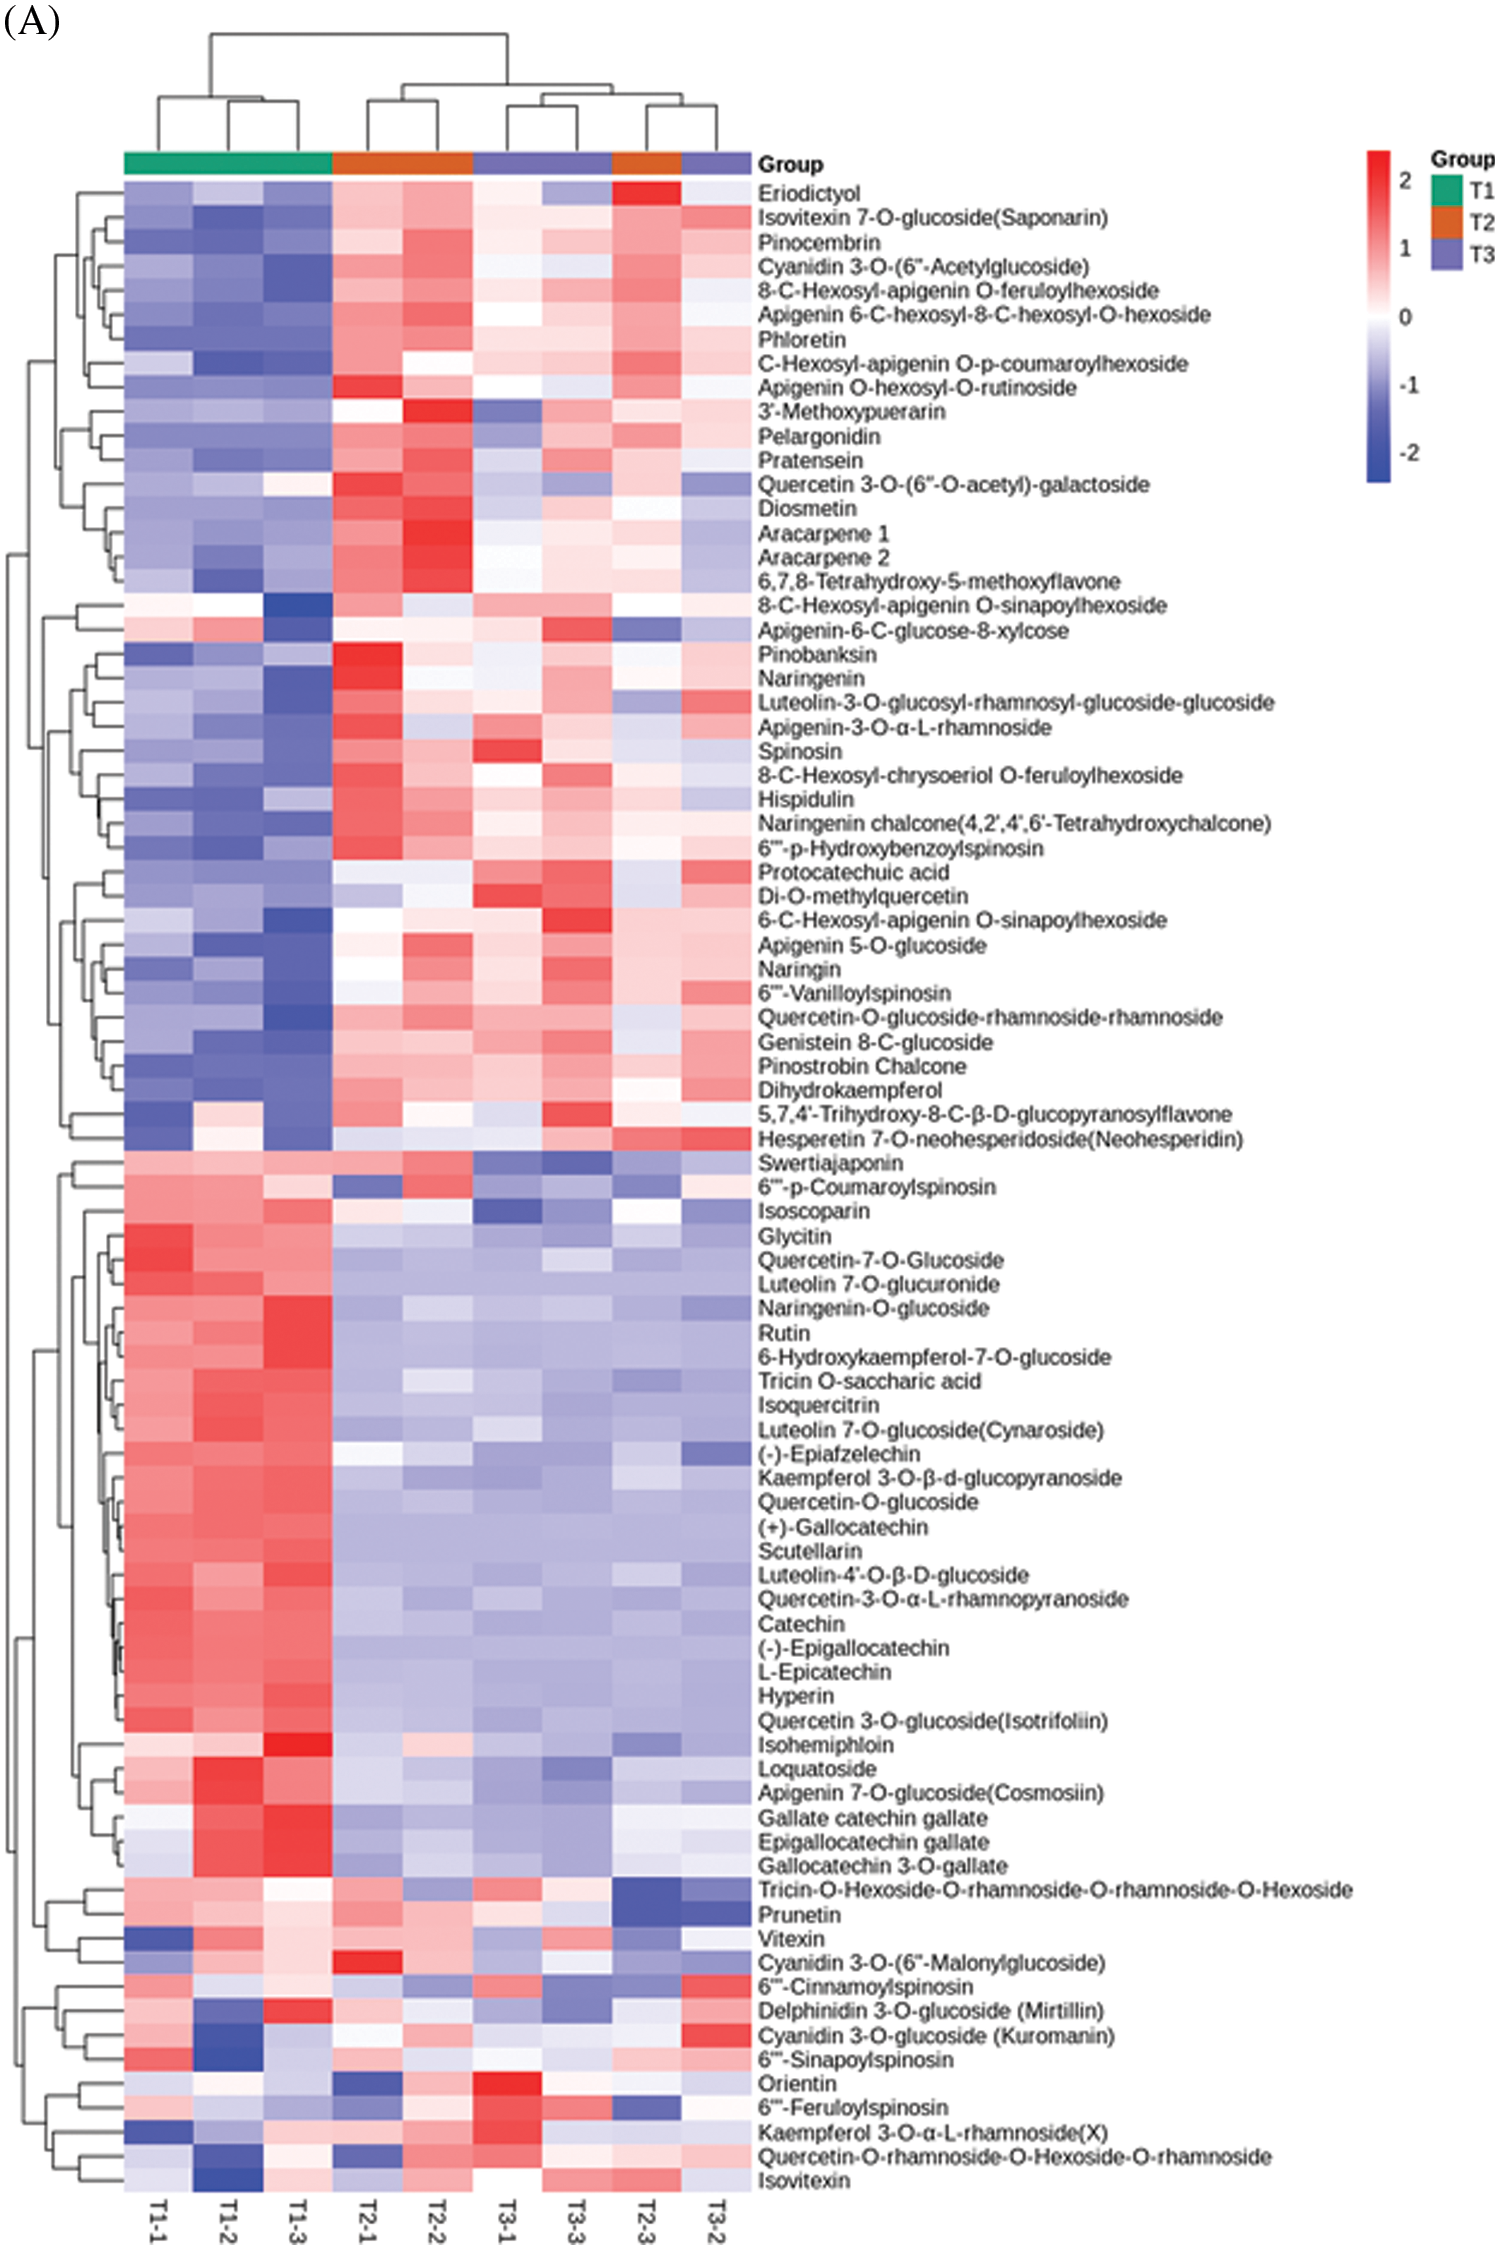
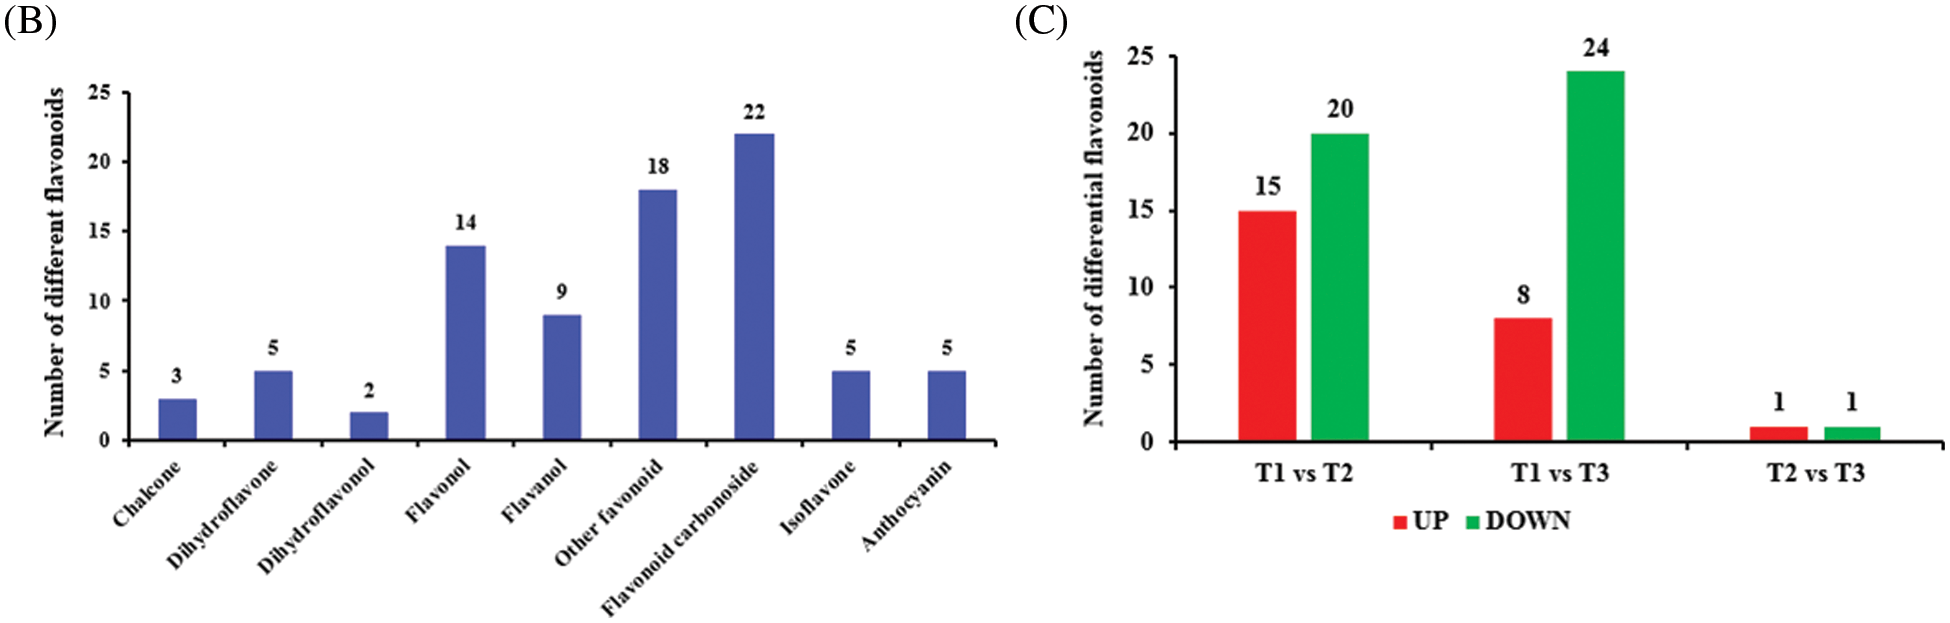
Figure 2: Analysis of flavonoid metabolites in Z. Spinosae. (A) Cluster heat map of flavonoid metabolites between groups T1, T2, and T3. The abundance of each metabolite is represented with a different color. Red indicates highly abundant metabolites, whereas metabolites with low abundance are shown in blue. (B) The number of flavonoid metabolites in different categories. (C) The number of differential flavonoids between T1, T2, and T3
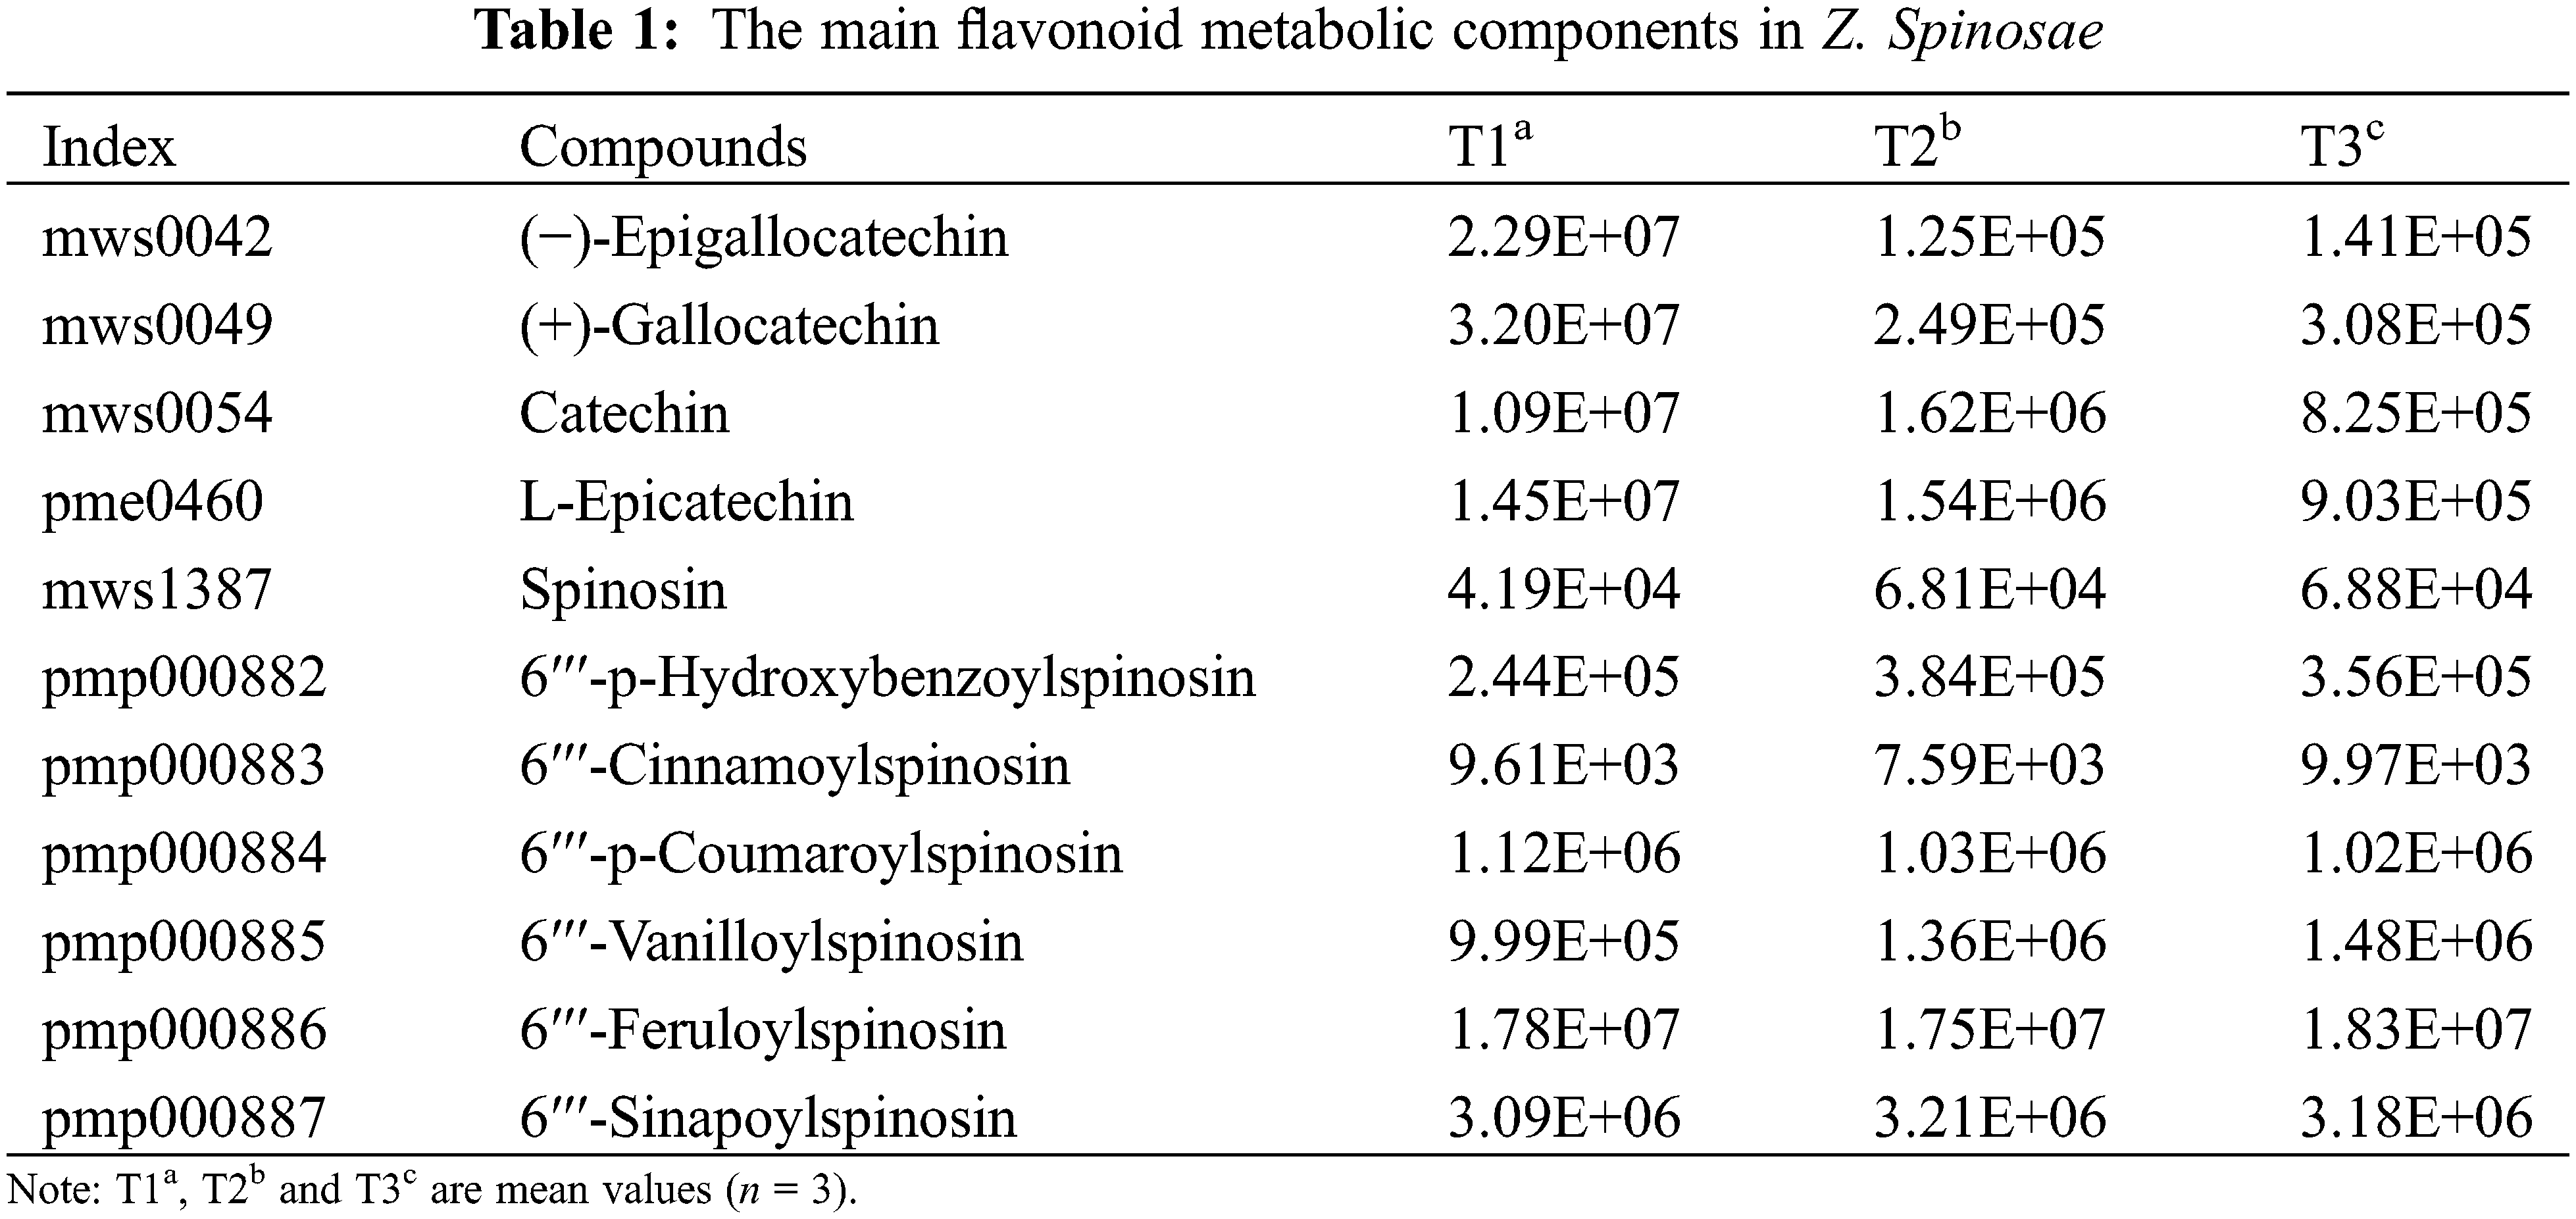
Differential flavonoids were screened by combining the absolute Log2 (fold change) ≥1 and a variable importance in projection value ≥1; 35 of 83 flavonoid metabolites were identified as significantly differentially accumulated between T1 and T2 (20 downregulated and 15 upregulated), 32 flavonoids were identified as significantly differentially accumulated between T1 and T3 (24 downregulated and 8 upregulated), and 2 flavonoids were identified as significantly differentially accumulated between T2 and T3 (1 downregulated and 1 upregulated) (Fig. 2C). Analysis of data indicated that the flavonoid metabolites was higher content in T1 than in T2 or T3. More specially, catechin, L-epicatechin, (−)-epigallocatechin, (+)-gallocatechin were abundant in T1, accounting for more than 50% of the total flavonoid metabolites content. The content of spinosin and its derivatives, with sedative and hypnotic functions, was not significantly different in T1, T2 and T3 (Table 1).
3.2 RNA Sequencing and Functional Annotation
To elucidate the molecular basis of the flavonoid biosynthesis metabolic pathway during the growth and development of SZS, transcriptomes were analyzed to identify the differentially expressed genes (DEGs). A total of 61.82 Gb clean data were produced from SZS. The number of clean data of each sample ranged from 6.49 Gb to 7.26 Gb. The Q30 percentages of all samples were more than 91.23%. The GC content of each sample was 44.19% to 45.16%. For functional annotations, all clean data were searched in the KEGG, NR, Swiss-Prot, Trembl, KOG, GO, and Pfam databases. A total of 27,241 genes were annotated functionally according to the BLASTX program, including 25,150 and 24,012 genes annotated according to the GO and KEGG databases, respectively (Table S2).
Based on the GO annotation, 25,150 genes were classified into 58 groups and involved in 3 major categories (cellular component, molecular function, and biological process) (Fig. 3A). In cellular component category, 17,963 genes and 10,028 genes were annotated with the cell and membrane, respectively. In biological process category, cellular process (14,698 genes) and metabolic process (12,622 genes) were the two most commonly assigned GO terms. In molecular function category, 14,077 and 12,615 genes were annotated with the binding and catalytic activity, respectively. To identify the genes involved in flavonoid biosynthesis, 24,012 genes were classified into 141 metabolism and biosynthesis pathways in KEGG database. Among, 473 genes were belonged to the phenylpropanoid biosynthesis (ko00940), 148 genes were related to the flavonoid biosynthesis (ko00941), 12 genes contributed to the anthocyanin biosynthesis (ko00942), 63 genes influenced isoflavonoid biosynthesis (ko00943), and 41 genes were involved in flavone and flavonol biosynthesis (ko00944) (Fig. 3B).
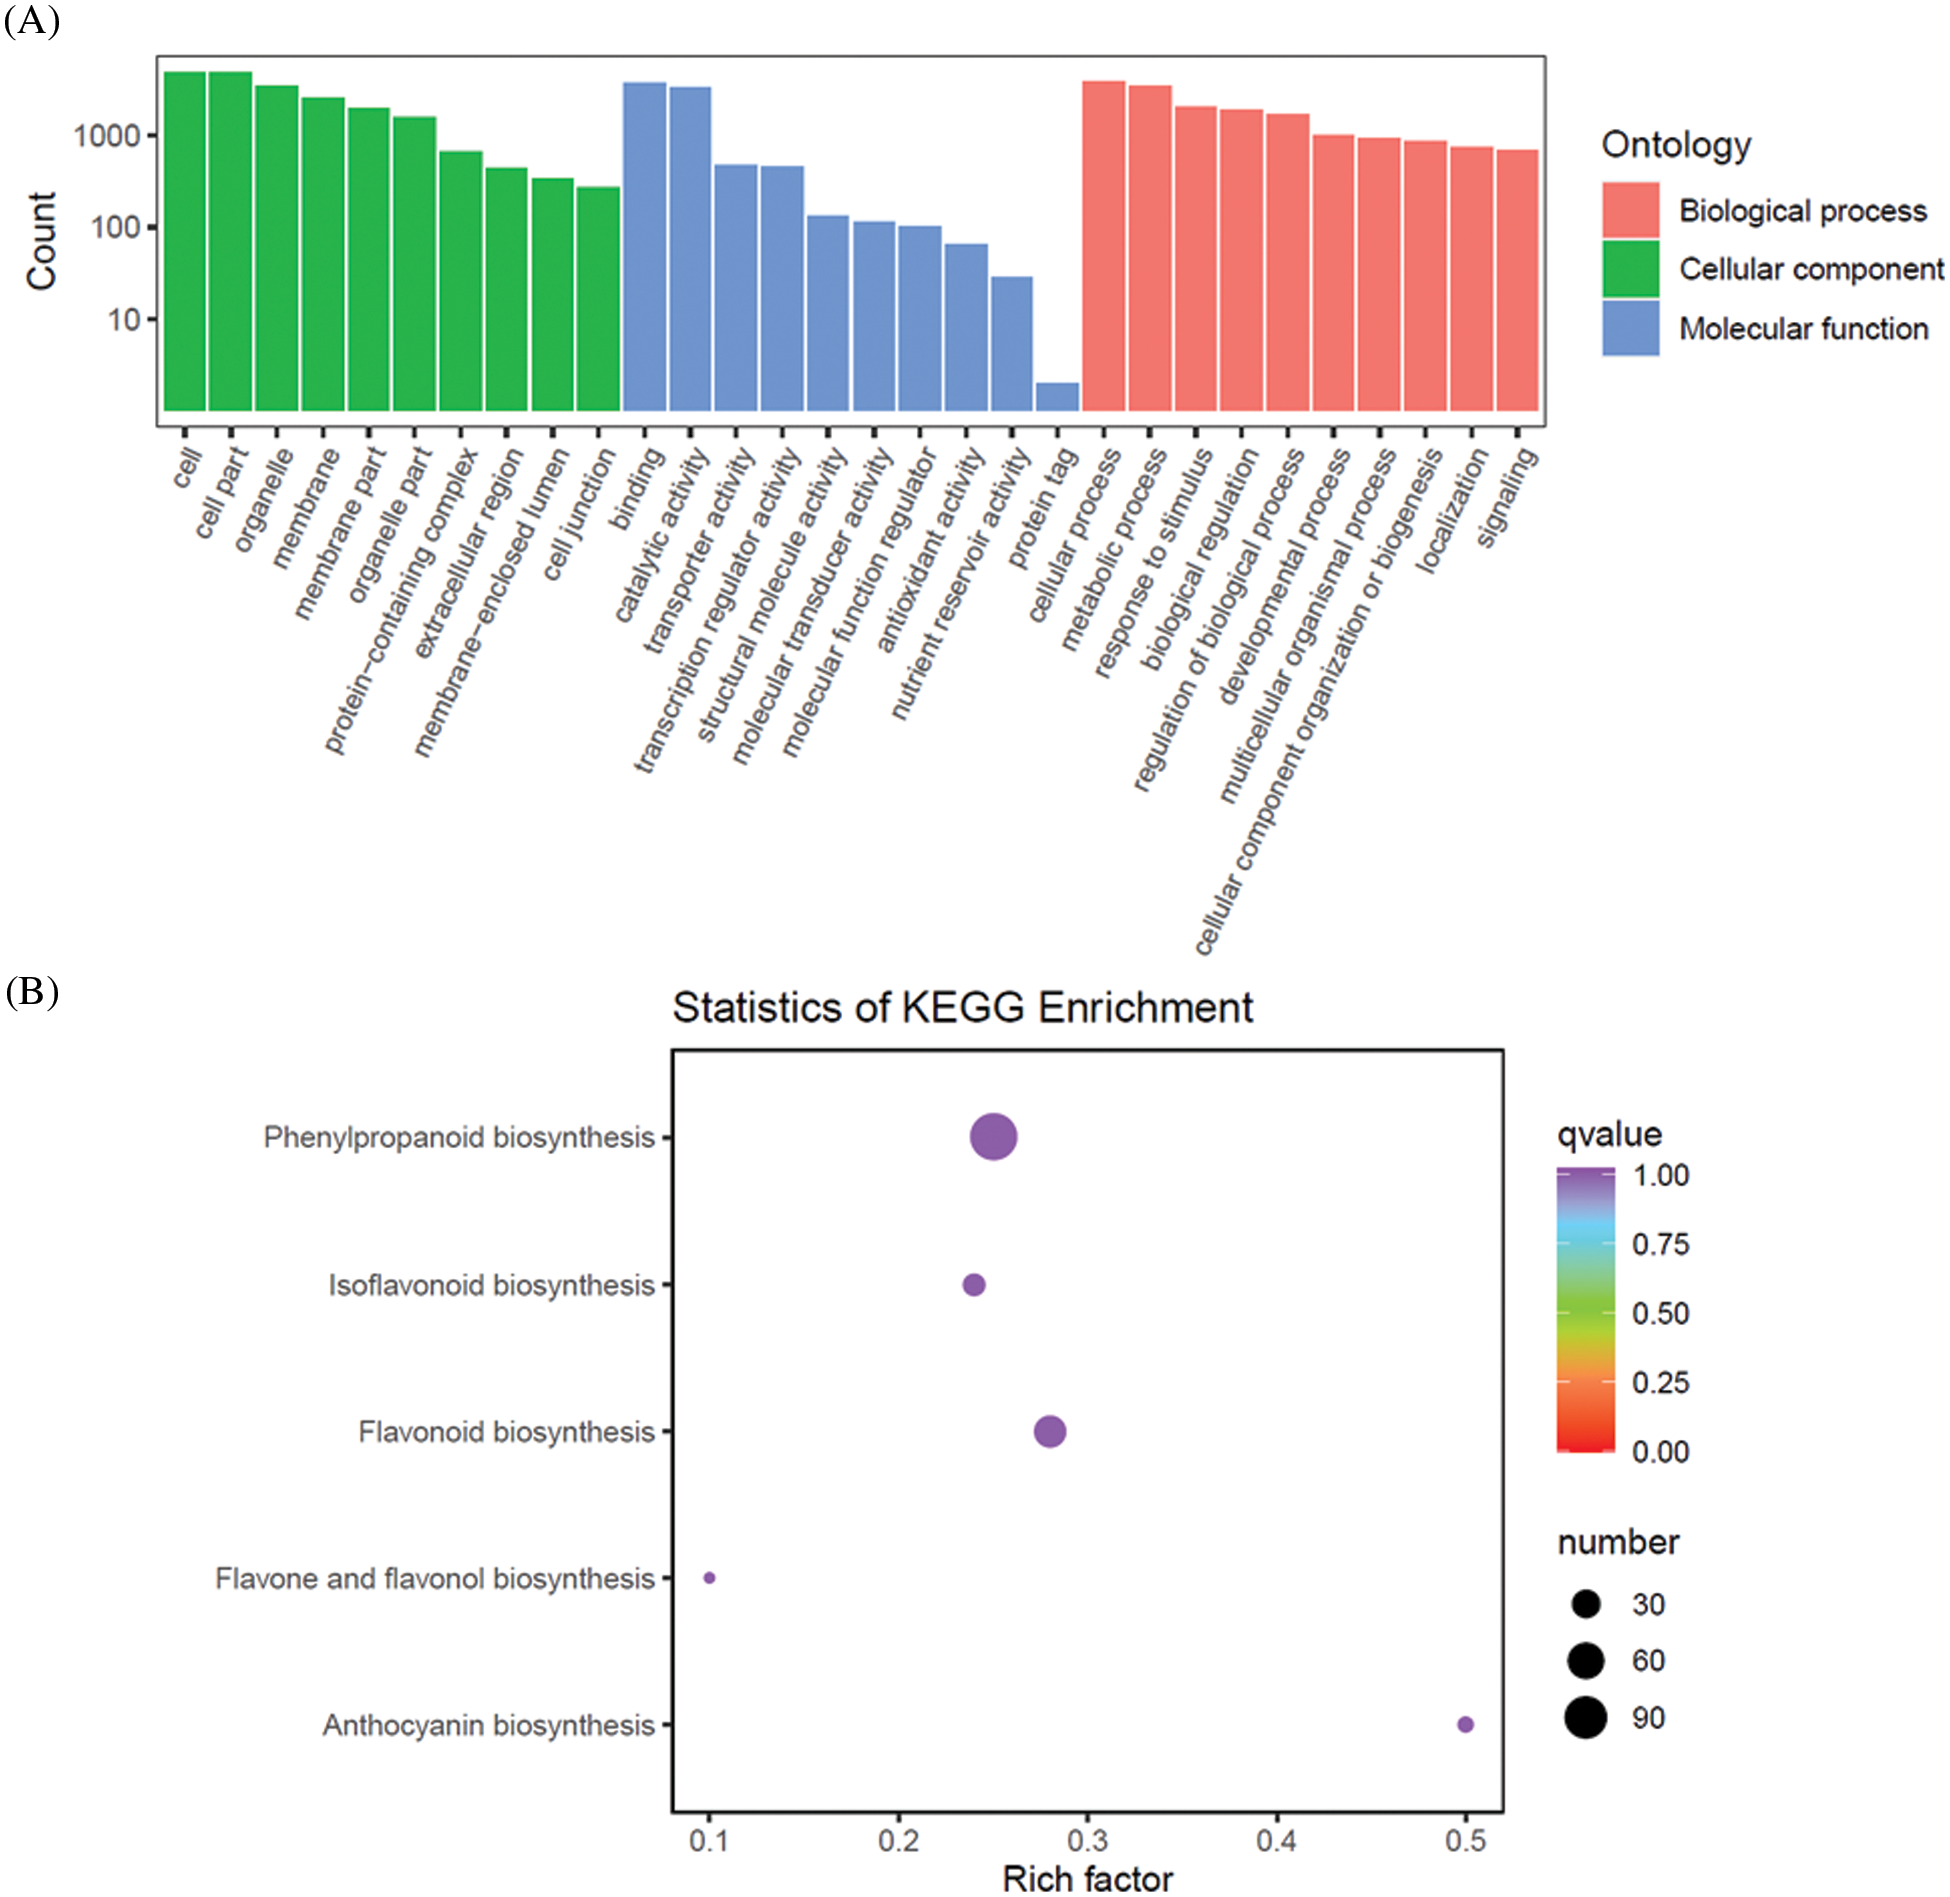
Figure 3: Transcriptome analysis of genes in Z. Spinosae. (A) GO functional classification of genes. (B) The number of genes involving in flavonoid biosynthesis pathway
3.3 Differential Expression of Genes at Three Development Stages of SZS
To identify the DEGs involved in the development stages of SZS, |log2(fold change)| ≥1 and a false discovery rate <0.05 were used as the filter criteria. In this study, 8725 DEGs were identified in the T1 vs. T2, including 3398 up-DEGs and 5327 down-DEGs. A total of 10925 DEGs were identified in the T1 vs. T3, including 4278 up-DEGs and 6647 down-DEGs. And there are 4086 DEGs identified in the T2 vs. T3, of which 1557 were up-DEGs and 2529 were down-DEGs (Fig. 4A). A total of 13232 unigenes were significantly differentially at three different growth stages of SZS based on the Venn diagram (Fig. 4B). Among these DEGs, 152 CYP450 genes and 115 UDP-glycosyltransferase genes, 238 methyltransferase genes, and 97 acyltransferase genes were detected (Fig. 4C). These DEGs may play an important role in flavonoid biosynthesis of SZS.
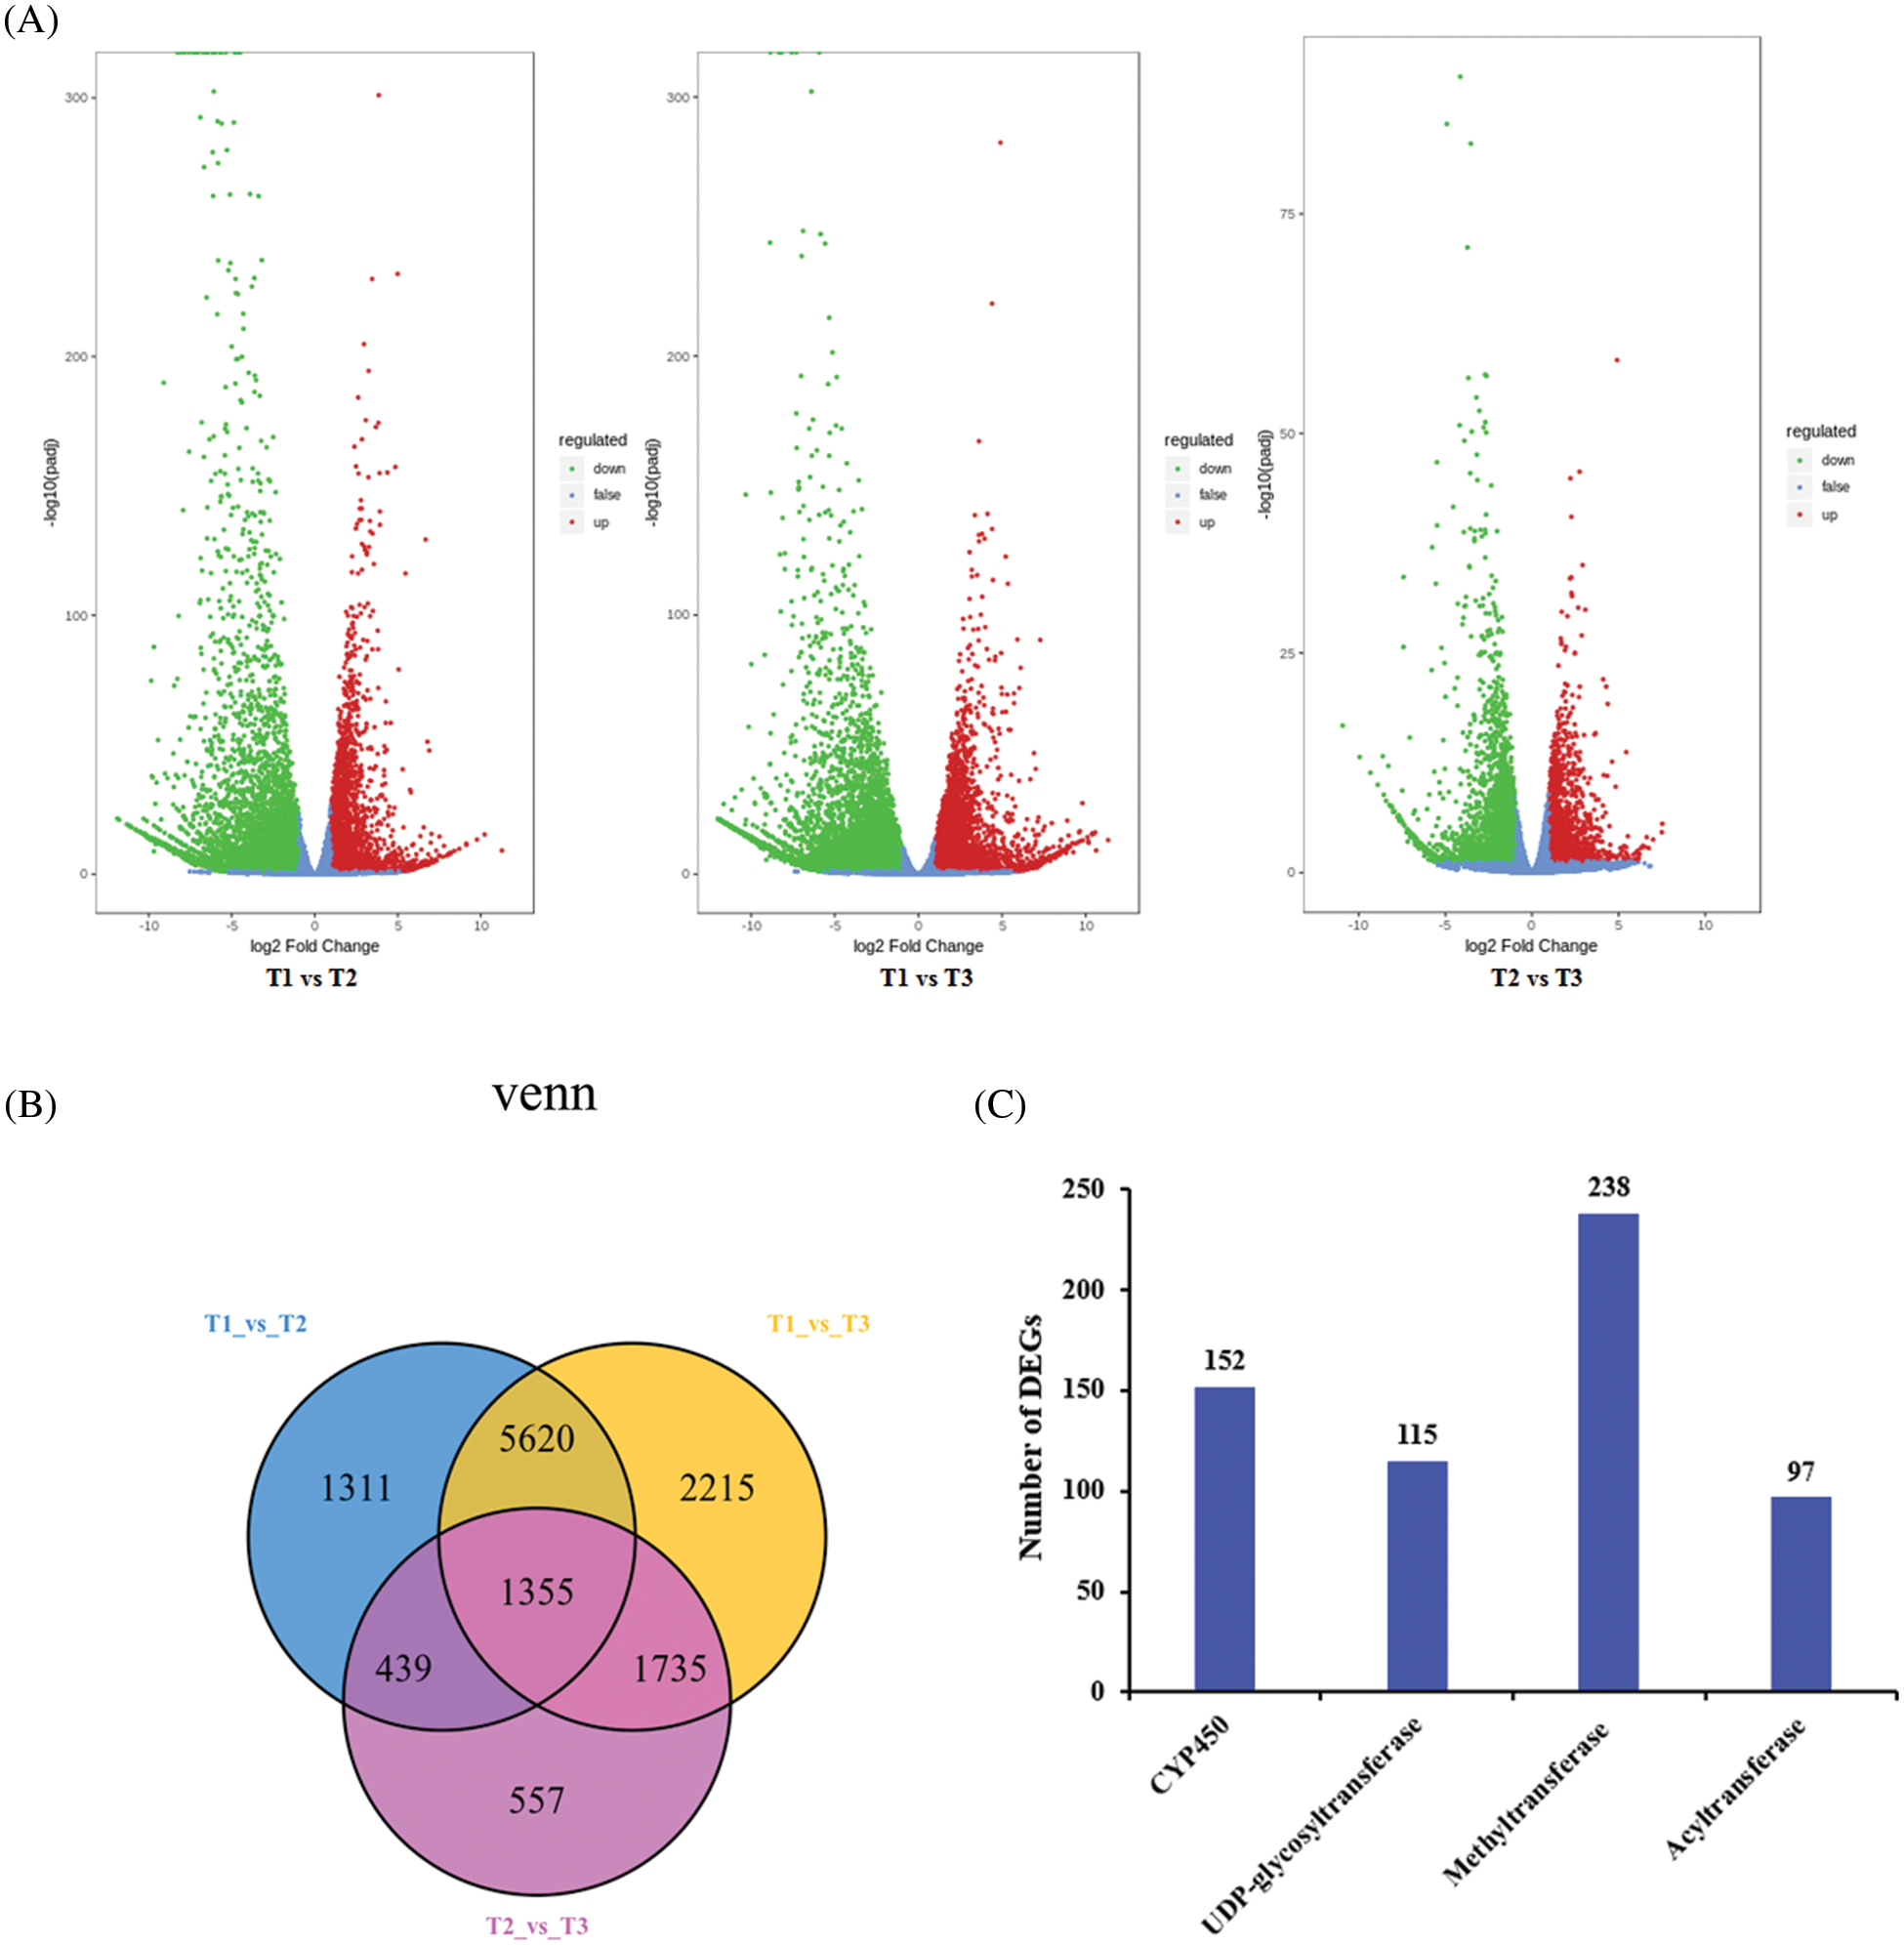
Figure 4: Analysis of differentially expressed genes in Z. Spinosae. (A)Volcano plot of DEGs between T1, T2 and T3. (B) Venn diagram of DEGs at the three different growth stages of SZS. (C) The number of DEGs
3.4 Biosynthesis of Flavonoid in SZS
We examined the flavonoid biosynthesis pathway in SZS via a combined analysis of the transcriptomic and metabolomic data, and selected T1 and T3 transcriptomic and metabolomic data to carry out correlation test. The results showed that 83 flavonoid metabolites were detected in SZS using UPLC/ESI-Q TRAP-MS/MS system. Most of these flavonoids were more abundant in T1 than in T3. Among, catechin, L-epicatechin, (−)-epigallocatechin, (+)-gallocatechin were more abundant, whereas pinocembrin, phloretin, dihydrokaempferol, and pelargonidin were less abundant. Further analysis of the DEGs involved in flavonoid biosynthesis pathway, 53 DEGs that encoded 15 enzymes were mined between T1 and T3, including 7 upregulated and 46 downregulated genes (Table 2). In the present study, we found that PAL, C4H, 4CL, CHS, CHI, FLS, FNS, ANS, ANR, LAR, and UFGT genes were all downregulated in T3 than in T1 (Fig. 5). These downregulated genes affected the biosynthesis of flavonoids in SZS.
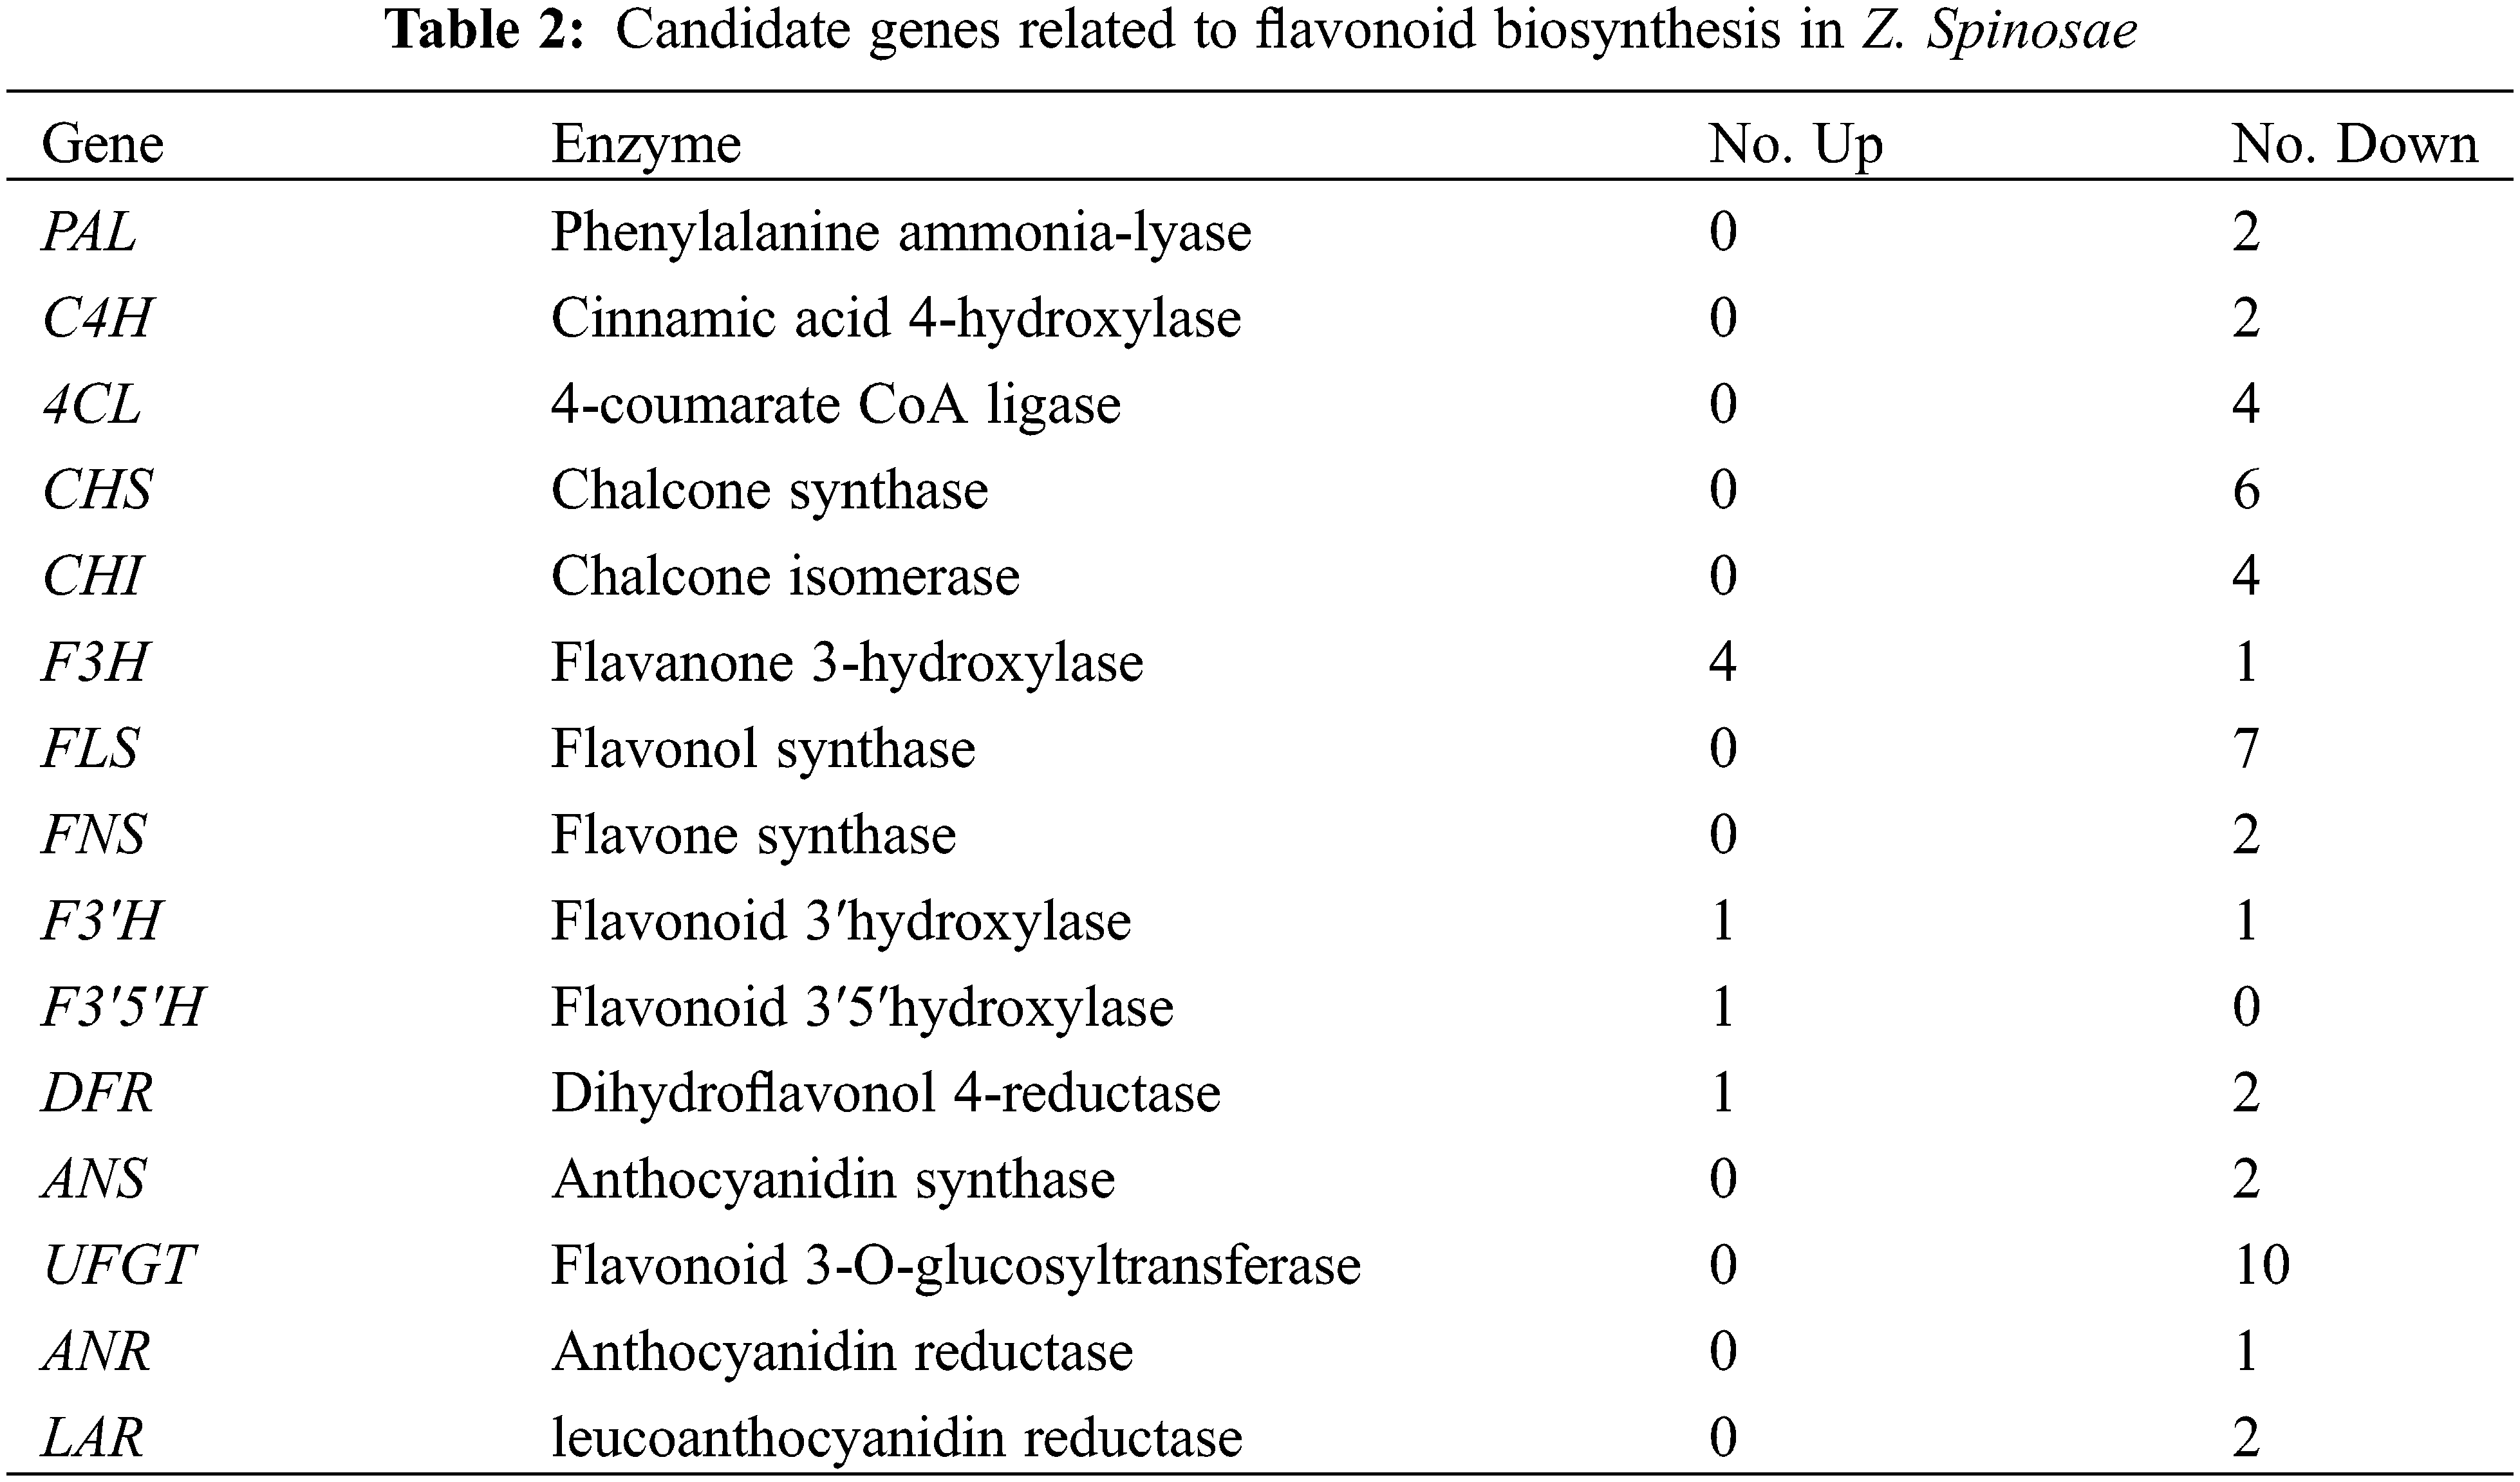
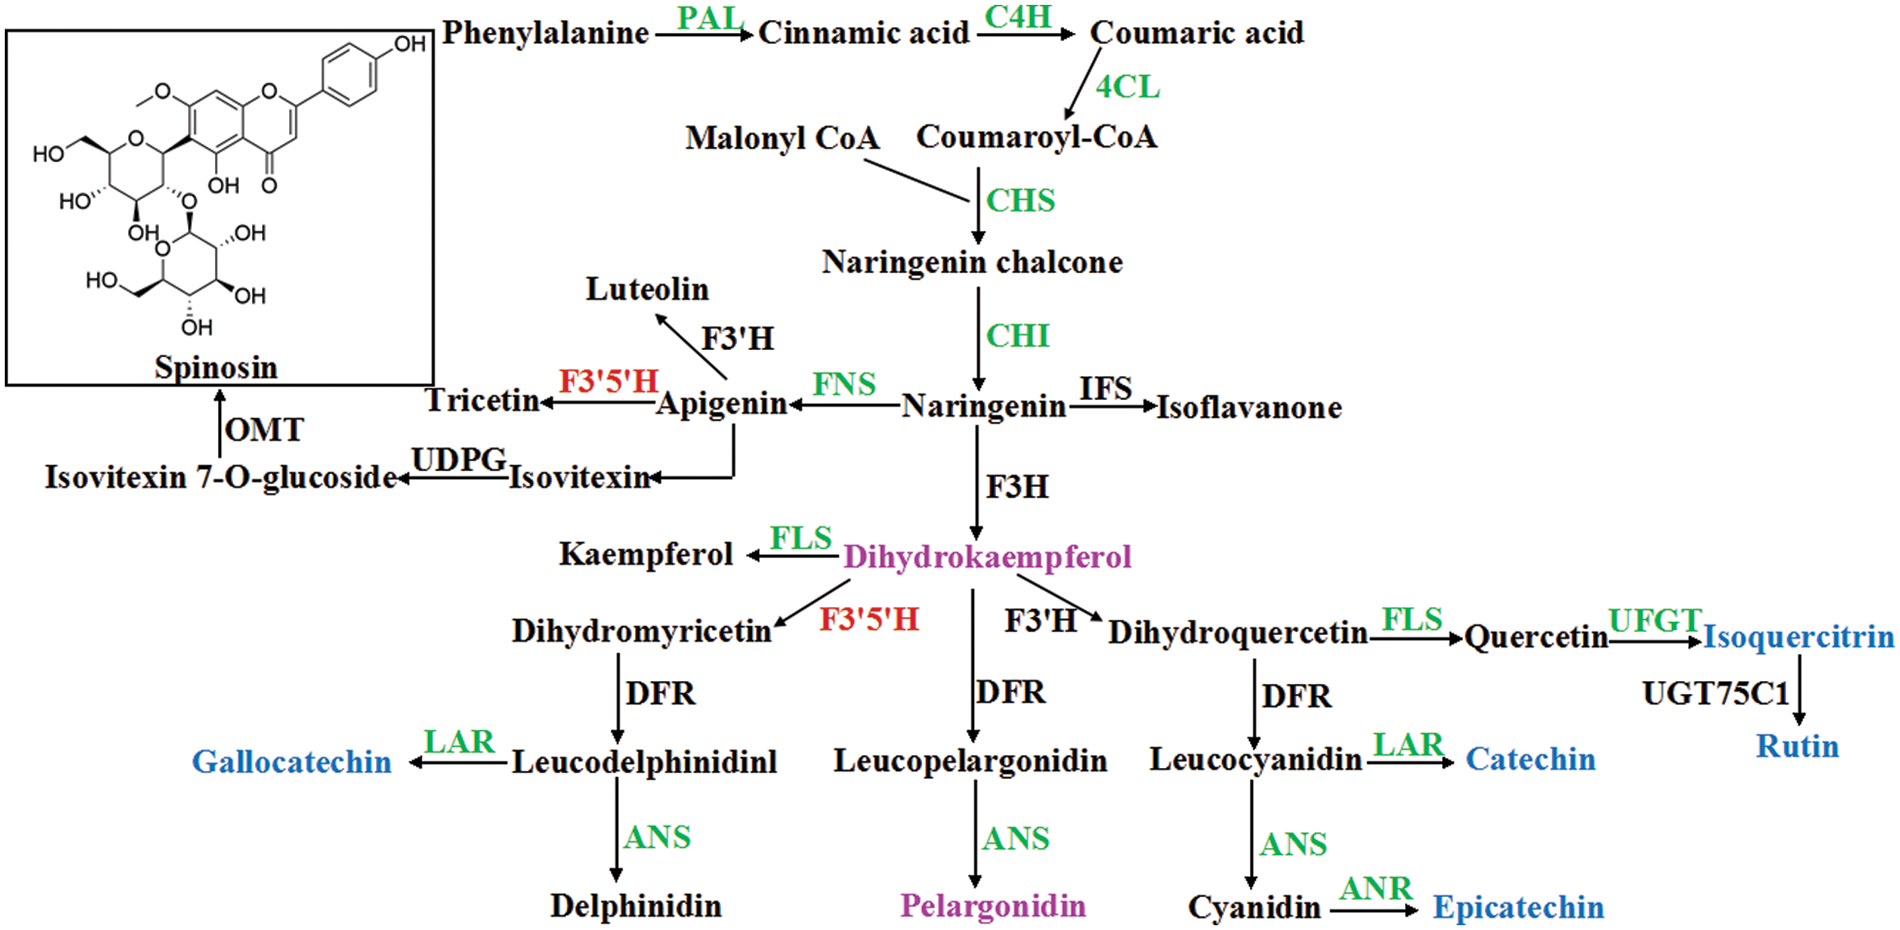
Figure 5: Biosynthetic pathway of flavonoids in Z. Spinosae. Upregulated genes were in red, and downregulated genes were in green. Blue indicates a lower content of metabolites and purple indicates a higher content of metabolites in T3 than in T1
SZS is a traditional medicinal herb that has been used in China for centuries. It can treat anxiety, insomnia, and night sweats according to the Chinese Pharmacopoeia [30]. SZS has abundant bioactive secondary metabolites that can help to enhance the body’s immunity and treat diseases. Increasing attention has been given to the sedative, hypnotic, and memory effects of SZS [31–33]. It was reported that SZS decoction is a classical herbal formula that improves sleep [34]. The mechanism of SZS treatment for insomnia is primarily mediated by the GABAergic and serotonergic systems [35]. Li et al. [36] reported that the methanol extract of SZS ameliorates ethanol withdrawal (EtOHW) anxiety by improving both CRF/CRFR1 and N/OFQ/NOP transmission in the CeA. An aqueous extract of SZS ameliorates nicotine withdrawal-induced anxiety by improving CRF/CRF1R and noradrenergic signaling in the CeA [37].
In recent years, metabolomics has been utilized to gain insight into the chemical compounds in plants [38,39]. UPLC/ESI-Q TRAP-MS/MS is a good technique to discover secondary metabolites of medicinal plants. In our study, we identified 83 differential flavonoid metabolites (Fig. 2). Further analysis of the flavonoid metabolites indicated that the main flavonoid components were catechin, L-epicatechin, (−)-epigallocatechin, (+)-gallocatechin in T1, which exceeded 50% of the total flavonoids content, whereas their content reduced rapidly from T1 to T2 or T3. We thought that these compounds could be oxidized or hydrolyzed in the SZS ripening process, which eventually declined the total flavonoid content in T2 and T3. Spinosin, a C-glycoside flavonoid derivative, is one of two main SZS compounds that have been used as a sedative to treat insomnia [40]. In particular, 6′′′-feruloylspinosin is involved in the sedative effect in rat hippocampal neurons by enhancing the expression of GABA [41]. In this work, we found that the content of spinosin and its derivatives was not significantly different among the T1, T2, and T3 stages. We thought that spinosin and its derivatives were mainly found in seed coat rather than seed. Next, we will further detect the contents of these compounds in seed and seed coat, respectively.
Transcriptomic and metabolomic are useful methods to understand the biosynthesis of metabolites in plants. Gao et al. combined metabolomic and transcriptomic to analyze the biosynthesis of tanshinone in S. miltiorrhiza [42]. Li et al. [43] reconstructed the flavonoid biosynthesis pathway of Mulberry leaves using metabolic profiling and transcriptome, and identified flavonol candidate UDP-rhamnosyltransferases. F3′H, and F3′5′H which belonged to the CYP450 family played an important role in regulating the biosynthesis of different types of flavonoids. Overexpression of these genes could increase the flavonoid accumulation in plants [44]. Anthocyanins were often highly modified into anthocyanin derivatives by acyltransferase, methyltransferase, and UDP-glycosyltransferase [45]. In our study, transcriptomic analysis of the SZS identified 53 DEGs involving in the flavonoid biosynthesis between T1 and T3 (Fig. 5). Among these DEGs, the expression levels of PAL, C4H, 4CL, CHS, CHI, FLS, FNS, ANS, ANR, LAR, and UFGT genes were all downregulated, which resulted in a low flavonoid content in T3 than T1. ANR is a reductase that converts anthocyanidin into epicatechin. LAR is a key enzyme of the flavonoid pathway that catalyzes leucoanthocyanidin to form catechin. Li et al. [46] reported ANR and LAR genes that were involved in proanthocyanidin biosynthesis in Malus crabapple, and the expression levels of them were correlated with the contents of catechin and epicatechin. In this study, we detected one ANR and two LAR genes in transcriptomic data of SZS that were all downregulated, which led to the low content of catechin and epicatechin in T3 than T1 (Table S2).
We integrated transcriptomic and metabolomic data to reveal the flavonoid biosynthesis metabolic pathway in SZS. A total of 13,232 differentially expressed genes and 83 flavonoid metabolites were identified at different growth stages analyzed. Our results greatly enrich the phytochemical composition database and provide valuable information for further study on this medicinal plant.
Acknowledgement: We thank the Germplasm Resources Center of Jujube, Xingtai City, China for providing the seed of Z. jujuba var. spinosa. We thank LetPub (www.letpub.com) for its linguistic assistance during the preparation of this manuscript.
Authorship Contribution Statement: T. J. conceived and designed the experiments. L. D. and C. X. performed the experiments. Z. X. and Z. S. analyzed the data. T. J. and W. T. wrote the paper. All authors reviewed the results and approved the final version of the paper.
Funding Statement: This work was supported by Hebei Province Key Research and Development Program Special Project (22326301D), Ministry of Science and Technology Project (2017YFC1700702), HAAFS Agriculture Science and Technology Innovation Project (2022KJCXZX-JZS-4), Technical System of Traditional Chinese Medicine Industry in Hebei Province (HBCT2018060203), and State Key Laboratory of Research & Development of Characteristic Qin Medicine Resources (Cultivation), No. QY202102.
Conflicts of Interest: The authors declare that they have no conflicts of interest to report regarding the present study.
References
1. Lee, S. S., Lin, B. F., Liu, K. C. (1996). Three triterpene esters from Zizyphus jujuba. Phytochemistry, 43(4), 847–851. DOI 10.1016/j.nuclphysb.2004.12.030. [Google Scholar] [CrossRef]
2. Cao, J. X., Zhang, Q. Y., Cui, S. Y., Cui, X. Y., Zhang, J. et al. (2010). Hypnotic effect of jujubosides from Semen Ziziphi Spinosae. Journal of Ethnopharmacology, 130(1), 163–166. DOI 10.1016/j.jep.2010.03.023. [Google Scholar] [CrossRef]
3. Lee, H. E., Lee, S. Y., Kim, J. S., Park, S. J., Kim, J. M. et al. (2013). Ethanolic extract of the seed of Zizyphus jujuba var. spinosa ameliorates cognitive impairment induced by cholinergic blockade in mice. Biomolecules & Therapeutics, 21(4), 299–306. DOI 10.4062/biomolther.2013.043. [Google Scholar] [CrossRef]
4. Han, H. S., Ma, Y., Eun, J. S., Li, R. H., Hong, J. T. et al. (2009). Anxiolytic-like effects of sanjoinine A isolated from Zizyphi Spinosi Semen: Possible involvement of GABAergic transmission. Pharmacology Biochemistry and Behavior, 92(2), 206–213. DOI 10.1016/j.pbb.2008.11.012. [Google Scholar] [CrossRef]
5. Liu, J. S., Qiao, W., Yang, Y., Ren, L., Sun, Y. et al. (2012). Antidepressant-like effect of the ethanolic extract from Suanzaorenhehuan formula in mice models of depression. Journal of Ethnopharmacology, 141(1), 257–264. DOI 10.1016/j.jep.2012.02.026. [Google Scholar] [CrossRef]
6. Rodríguez, V. J., Rodríguez, V. L. (2017). Experimental and clinical pharmacology of Ziziphus jujuba Mills. Phytotherapy Research, 31(3), 347–365. DOI 10.1002/ptr.5759. [Google Scholar] [CrossRef]
7. Singh, A., Zhao, K. (2017). Treatment of insomnia with traditional Chinese herbal medicine. International Review of Neurobiology, 135, 97–115. DOI 10.1016/bs.irn.2017.02.006. [Google Scholar] [CrossRef]
8. Yeh, C. H., Arnold, C. K., Chen, Y. H., Lai, J. N. (2011). Suan Zao Ren Tang as an original treatment for sleep difficulty in climacteric women: A prospective clinical observation. Evidence-Based Complementary and Alternative Medicine, 2011, 673813. DOI 10.1155/2011/673813. [Google Scholar] [CrossRef]
9. Fang, X. S., Hao, J. F., Zhou, H. Y., Zhou, L. X., Wang, J. H. et al. (2010). Pharmacological studies on the sedative-hypnotic effect of Semen Ziziphi spinosae (Suanzaoren) and Radix et Rhizoma Salviae miltiorrhizae (Danshen) extracts and the synergistic effect of their combinations. Phytomedicine, 17(1), 75–80. DOI 10.1016/j.phymed.2009.07.004. [Google Scholar] [CrossRef]
10. Wang, L. E., Cui, X. Y., Cui, S. Y., Cao, J. X., Zhang, J. (2010). Potentiating effect of spinosin, a C-glycoside flavonoid of Semen Ziziphi Spinosae, on pentobarbital-induced sleep may be related to postsynaptic 5-HT(1A) receptors. Phytomedicine, 17(6), 404–409. DOI 10.1016/j.phymed.2010.01.014. [Google Scholar] [CrossRef]
11. Jiang, T., Guo, K. Y., Liu, L. D., Tian, W., Xie, X. L. (2020). Integrated transcriptomic and metabolomic data reveal the flavonoid biosynthesis metabolic pathway in Perilla frutescens (L.) leaves. Scientific Reports, 10(1), 16207. DOI 10.1038/s41598-020-73274-y. [Google Scholar] [CrossRef]
12. Jiang, T., Zhang, M. D., Wen, C. X., Xie, X. L., Tian, W. (2020). Integrated metabolomic and transcriptomic analysis of the anthocyanin regulatory networks in Salvia miltiorrhiza Bge. flowers. BMC Plant Biology, 20(1), 349. DOI 10.1186/s12870-020-02553-7. [Google Scholar] [CrossRef]
13. Lei, Z. X., Zhou, C. H., Ji, X. Y., Gang, W., Huang, Y. C. et al. (2018). Transcriptome analysis reveals genes involved in flavonoid biosynthesis and accumulation in Dendrobium catenatum from different locations. Scientific Reports, 8(1), 6373. DOI 10.1038/s41598-018-24751-y. [Google Scholar] [CrossRef]
14. Brodowska, K. M. (2017). Natural flavonoids: Classification, potential role, and application of flavonoid analogues. European Journal of Biological Research, 7(2), 108–123. DOI 10.5281/zenodo.545778. [Google Scholar] [CrossRef]
15. Wu, Q., Song, Y., Sun, Y., Sun, F., Li, C. et al. (2010). Transcript profiles of Panax quinquefolius from flower, leaf and root bring new insights into genes related to ginsenosides biosynthesis and transcriptional regulation. Physiologia Plantarum, 138(2), 134–149. DOI b10.1111/j.1399-3054.2009.01309.x. [Google Scholar]
16. Zhou, C. B., Mei, X., Rothenbery, D. O., Yang, Z. B., Zhang, W. T. et al. (2020). Metabolome and transcriptome analysis reveals putative genes involved in anthocyanin accumulation and coloration in white and pink tea (Camellia sinensis) flower. Molecules, 25(1), 190. DOI 10.3390/molecules25010190. [Google Scholar] [CrossRef]
17. Zhu, G. T., Wang, S. C., Huang, Z. J., Zhang, S. B., Liao, Q. G. et al. (2018). Rewiring of the fruit metabolome in tomato breeding. Cell, 172(1–2), 249–261. DOI 10.1016/j.cell.2017.12.019. [Google Scholar] [CrossRef]
18. Li, J., Yang, P., Yang, Q. H., Gong, X. W., Ma, H. C. et al. (2019). Analysis of flavonoid metabolites in buckwheat leaves using UPLC-ESI-MS/MS. Molecules, 24(7), 1310. DOI 10.3390/molecules24071310. [Google Scholar] [CrossRef]
19. Wang, F., Chen, L., Chen, H. P., Chen, S. W., Liu, Y. P. (2019). Analysis of flavonoid metabolites in citrus peels (Citrus reticulata Dahongpao) using UPLC-ESI-MS/MS. Molecules, 24(15), 2680. DOI 10.3390/molecules24152680. [Google Scholar] [CrossRef]
20. Yan, Y., Shen, C. X., Pei, X. P., Li, A. P., Du, H. Z. et al. (2020). Compare the chemical profiling of Ziziphi Spinosae Semen and Ziziphi Mauritianae Semen using untargeted metabolomics. Journal of Food Composition and Analysis, 94, 103635. DOI 10.1016/j.jfca.2020.103635. [Google Scholar] [CrossRef]
21. Chen, W., Gong, L., Guo, Z. L., Wang, W. S., Zhang, H. Y. et al. (2013). A novel integrated method for large-scale detection, identification, and quantification of widely targeted metabolites, application in the study of rice metabolomics. Molecular Plant, 6(6), 1769–1780. DOI 10.1093/mp/sst080. [Google Scholar] [CrossRef]
22. Wang, Z. R., Cui, Y. Y., Vainstein, A., Chen, S. W., Ma, H. Q. (2017). Regulation of Fig (Ficus carica L.) fruit color, metabolomic and transcriptomic analyses of the flavonoid biosynthetic pathway. Front Plant Science, 8, 1990. DOI 10.1038/s41396-017-0004-x. [Google Scholar] [CrossRef]
23. Huang, R. M., Huang, Y. J., Sun, Z. C., Huang, J. Q., Wang, Z. J. (2017). Transcriptome analysis of genes involved in lipid biosynthesis in the developing embryo of pecan (Carya illinoinensis). Journal Agricultural and Food Chemistry, 65(20), 4223–4236. DOI 10.1021/acs.jafc.7b00922. [Google Scholar] [CrossRef]
24. Grabherr, M. G., Haas, B. J., Yassour, M., Levin, J. Z., Thompson, D. A. et al. (2011). Full-length transcriptome assembly from RNA-Seq data without a reference genome. Nature Biotechnology, 29(7), 644–652. DOI 10.1038/nbt.1883. [Google Scholar] [CrossRef]
25. Li, J. J., Jiang, C. R., Brown, J. B., Huang, H., Bickel, P. J. (2011). Sparse linear modeling of next-generation mRNA sequencing (RNA-Seq) data for isoform discovery and abundance estimation. PNAS, 108(50), 19867–19872. DOI 10.1073/pnas.1113972108. [Google Scholar] [CrossRef]
26. Kanehisa, M., Goto, S. (2000). KEGG: Kyoto encyclopedia of genes and genomes. Nucleic Acids Research, 28(1), 27–30. DOI 10.1093/nar/27.1.29. [Google Scholar] [CrossRef]
27. Kanehisa, M., Sato, Y., Furumichi, M., Morishima, K., Tanabe, M. (2019). New approach for understanding genome variations in KEGG. Nucleic Acids Research, 47(D1), D590–D595. DOI 10.1093/nar/gky962. [Google Scholar] [CrossRef]
28. Kanehisa, M. (2019). Toward understanding the origin and evolution of cellular organisms. Protein Sciences, 28(11), 1947–1951. DOI 10.1002/pro.3715. [Google Scholar] [CrossRef]
29. Mao, X. Z., Cai, T., Olyarchuk, J. G., Wei, L. P. (2005). Automated genome annotation and pathway identification using the KEGG Orthology (KO) as a controlled vocabulary. Bioinformatics, 21(19), 3787–3793. DOI 10.2307/1592215. [Google Scholar] [CrossRef]
30. Chinese Pharmacopoeia Commission (2015). The pharmacopoeia of the People’s Republic of China. Beijing, China: Chinese Medical Science Press. [Google Scholar]
31. Jiang, J. G., Huang, X. J., Chen, J., Lin, Q. S. (2007). Comparison of the sedative and hypnotic effects of flavonoids, saponins, and polysaccharides extracted from Semen Ziziphus jujube. Natural Products Research, 21(4), 310–320. DOI 10.1080/14786410701192827. [Google Scholar] [CrossRef]
32. Ko, S. Y., Lee, H. E., Park, S. J., Jeon, S. J., Kim, B. et al. (2015). Spinosin, a C-glucosylflavone, from Zizyphus jujuba var. spinosa ameliorates Aβ1-42 oligomer-induced memory impairment in mice. Biomolecules & Therapeutics, 23(2), 156–164. DOI 10.4062/biomolther.2014.110. [Google Scholar] [CrossRef]
33. Jung, I. H., Lee, H. E., Park, S. J., Ahn, Y. J., Kwon, G. Y. et al. (2014). Ameliorating effect of spinosyn, a C-glycoside flavonoid, on scopolamine-induced memory impairment in mice. Pharmacology Biochemistry and Behavior, 120, 88–94. DOI 10.1016/j.pbb.2014.02.015. [Google Scholar] [CrossRef]
34. Li, Y. J., Bi, K. S. (2006). Study on the therapeutic material basis of traditional Chinese medicinal preparation Suanzaoren decoction. Chemical & Pharmaceutical Bulletin, 54(6), 847–851. DOI 10.1248/cpb.54.847. [Google Scholar] [CrossRef]
35. Wang, L. E., Bai, Y. J., Shi, X. R., Cui, X. Y., Zhang, F. et al. (2008). Spinosin, a C-glycoside flavonoid from Semen Zizyphi spinosae, potentiated pentobarbital-induced sleep via the serotonergic system. Pharmacology Biochemistry and Behavior, 90(3), 399–403. DOI 10.1016/j.pbb.2008.03.022. [Google Scholar] [CrossRef]
36. Li, L. B., Kim, Y. W., Wang, Y. H., Bai, L., Zhu, X. D. et al. (2019). Methanol extract of Semen Ziziphi Spinosae attenuates ethanol withdrawal anxiety by improving neuropeptide signaling in the central amygdala. BMC Complementary and Alternative Medicine, 19(1), 147. DOI 10.1186/s12906-019-2546-0. [Google Scholar] [CrossRef]
37. Gu, C. H., Zhao, Z. L., Zhu, X. D., Wu, T., Lee, B. H. et al. (2018). Aqueous extract of Semen Ziziphi Spinosae exerts anxiolytic effects during nicotine withdrawal via improvement of amygdaloid CRF/CRF1R signaling. Evidence-Based Complementary and Alternative Medicine, 2018(1), 2419183. DOI 10.1155/2018/2419183. [Google Scholar] [CrossRef]
38. Yang, G., Liang, K. N., Zhou, Z. Z., Wang, X. Y., Huang, G. H. (2020). UPLC-ESI-MS/MS-Based widely targeted metabolomics analysis of wood metabolites in teak (Tectona grandis). Molecules, 25(9), 2189. DOI 10.3390/molecules25092189. [Google Scholar] [CrossRef]
39. Wang, F. Y., Huang, Y. J., Wu, W., Zhu, C. Y., Zhang, R. M. et al. (2020). Metabolomics analysis of the peels of different colored citrus fruits (Citrus reticulata cv. ‘Shatangju’) during the maturation period based on UHPLC-QQQ-MS. Molecules, 25(2), 396. DOI 10.3390/molecules25020396. [Google Scholar] [CrossRef]
40. Liu, J., Zhai, W. M., Yang, Y. X., Shi, J. L., Liu, Q. T. et al. (2015). GABA and 5-HT systems are implicated in the anxiolytic-like effect of spinosin in mice. Pharmacology Biochemistry and Behavior, 128(1), 41–49. DOI 10.1016/j.pbb.2014.11.003. [Google Scholar] [CrossRef]
41. Qiao, L. D., Liu, Y., Chen, X. Y., Xie, J. B., Zhang, Y. Q. et al. (2016). A HPLC-MS/MS method for determination of 6′′′-feruloylspinosin in rat plasma and tissues: Pharmacokinetics and tissue distribution study. Journal of Pharmaceutical and Biomedical Analysis, 121, 77–83. DOI 10.1016/j.jpba.2016.01.005. [Google Scholar] [CrossRef]
42. Gao, W., Sun, H. X., Xiao, H., Cui, G., Hillwig, M. L. et al. (2014). Combining metabolomics and transcriptomics to characterize tanshinone biosynthesis in Salvia miltiorrhiza. BMC Genomics, 15(1), 73. DOI 10.1186/1471-2164-15-73. [Google Scholar] [CrossRef]
43. Li, D., Chen, G., Ma, B., Zhong, C., He, N. J. (2020). Metabolic profiling and transcriptome qnalysis of mulberry leaves provide insights into flavonoid biosynthesis. Journal of Agricultural and Food Chemistry, 68(5), 1494–1504. DOI 10.1021/acs.jafc.9b06931. [Google Scholar] [CrossRef]
44. Nguyen, Y. T. H., Hoang, H. T., Mai A.T., H., Nguyen, L. T. N., Nguyen, Q. H. et al. (2021). The Aconitum carmichaelii F3′5′H gene overexpression increases flavonoid accumulation in transgenic tobacco plants. Horticulturae, 7(10), 384. DOI 10.3390/horticulturae7100384. [Google Scholar] [CrossRef]
45. Sasaki, N., Nishizaki, Y., Ozeki, Y., Miyahara, T. (2014). The role of acyl-glucose in anthocyanin modifications. Molecules, 19(11), 18747–18766. DOI 10.3390/molecules191118747. [Google Scholar] [CrossRef]
46. Li, H., Tian, J., Yao, Y. Y., Zhang, J., Song, T. T. et al. (2019). Identification of leucoanthocyanidin reductase and anthocyanidin reductase genes involved in proanthocyanidin biosynthesis in Malus crabapple plants. Plant Physiology Biochemistry, 139, 141–151. DOI 10.1016/j.plaphy.2019.03.003. [Google Scholar] [CrossRef]
Supplementary File
Table S1: Flavonoid metabolites in SZS
Table S2: Gene expression annotation in SZS
Cite This Article
 Copyright © 2023 The Author(s). Published by Tech Science Press.
This work is licensed under a Creative Commons Attribution 4.0 International License , which permits unrestricted use, distribution, and reproduction in any medium, provided the original work is properly cited.
 Downloads
 Citation Tools