
 Submit a Paper
 Propose a Special lssue
 Open Access
ARTICLE
Full-Length Transcriptome Analysis of Cultivated and Wild Tetraploid Peanut
Dry Farming Technology Key Laboratory of Shandong Province, College of Agronomy, Qingdao Agricultural University, Qingdao, 266109, China
* Corresponding Author: Xiaojun Zhang. Email:
Phyton-International Journal of Experimental Botany 2023, 92(2), 439-453. https://doi.org/10.32604/phyton.2022.023165
Received 13 April 2022; Accepted 08 June 2022; Issue published 12 October 2022
 View Full Text
 Download PDF
Abstract
The high-quality genomes and large-scale full-length cDNA sequences of allotetraploid peanuts have been sequenced and released, which has accelerated the functional genomics and molecular breeding research of peanut. In order to understand the difference in the transcriptional levels of wild and cultivated peanuts. In this study, we integrated of second- and third-generation sequencing technologies to sequence full-length transcriptomes in peanut cv. Pingdu9616 and its putative ancestor Arachis monticola. The RNA extracted from six different tissues (i.e., roots, stems, leaves, flowers, needles and pods) were sampled at 20 days after flowering. A total of 31,764 and 33,981 high-quality transcripts were obtained from Monticola and Pingdu9616, respectively. The number of alternative splicing, the unit point mutation of variable adenylation, the number of open reading frames and the two-site mutation were identified in Pingdu9616 more than in Monticola, but the three-site mutation in Pingdu9616 was lower than in Monticola. 1,691 LncRNAs, and 4,000 bp of maximum length of LncRNA was identified in Monticola and Pingdu9616. Furthermore, comparative analysis between transcript data shown that 56 transcription factor families were involved in Monticola, and Pingdu9616 and the number of transcription factors in Pingdu9616 was higher than that in Monticola, the number of expressed genes estimated in flower, root, young pod and leaf organs was higher in Monticola than Pingdu9616. Over all, our study provided a valuable resource of large-scale full-length transcripts for further research of the molecular breeding and functional analysis of genes.Keywords
Peanut (Arachis hypogea L.) is an allotetraploid (2n = 4x = 40) plant that is wildly grown in the world [1]. A. duranensis and A. ipaensis through natural hyterogeneous doubling and artificial domestication form cultivated peanuts [2–10]. The complex allotetraploid genome structures limit the genetic study of peanuts. To date, wild diploid donor species, wild tetraploids and cultivated peanut genome have been sequenced [11–13].
With the gradual improvement of genome sequencing technology, the genome sequences of more peanut varieties have been reported, which makes it more convenient for us to study the functional genes of peanuts [14]. Grabiele et al. [4] used second transcriptome sequencing (NGS) to A. duranensis and A. ipaensis sequence and assemble the genomes of peanuts, and used them to identify candidate disease-resistant genes, guided tetraploid transcript assembly, and detectd genetic exchange between subgenomes of cultivated peanuts. Chen et al. [15] used NGS to sequence and assemble the genome of A. duranensis, and the study showed that the A. duranensis genome provided the main source of candidate genes and millions of structural variants for fruit formation, oil biosynthesis and allergens. Lu et al. [16] used NGS to sequence and assemble the genome of A. ipaensis, and the study have found that the FAR1 family may be involved in regulating the development of peanuts in particular fruit and three new FAD2 homologous genes have been identified in A. ipaensis, one of which is completely homologous to A. hypogaea FAD2 at the amino acid level. Yin et al. [13] integrated the use of SMRT subreads + HiC + Optical data and other sequencing methods and developed a new set of de novo assembly strategies, and finally obtained a high-quality heterologous tetraploid Monticola genome at the chromosome level, compared with the previously published genome, contigs N50 has a nearly 5-fold improvement, and contains 97% of the genome sequence of wild peanuts. By combining NGS and TGS data, BioNano, and high-density genetic maps, Chen et al. mapped the genome sequence maps of cultivated species Fuhuasheng and successfully assembled 20 chromosomes of Fuhuasheng [15]. Zhuang et al. used the cultivated peanut Shitouqi as the material, mainly using three generations of PacBio SMRT sequencing, combined with Hi-C technology and high-density genetic mapping, etc., to complete the accurate assembly of 20 chromosomes of Shitouqi’s A and B subgenomes and resequenced 52 peanuts from 12 species, providing new insights into the genome structure, biological characteristics, polyploid evolution and crop domestication of peanuts [17]. Bertioli et al. used Tifrunner as a material to complete the complete chromosomal genome sequence using PacBio technology combined with Hi-C technology, and showed that after the cultivation peanut originated in its polyploidy, the genome evolved through the activity of moving elements, deletions, and homologous recombination between corresponding ancestral chromosomes [18]. And then, 17 wild diploids involved AA, BB, EE, KK, and CC groups and 2 cultivated tetraploids peanuts were used for sequencing to demonstrate the monogenic origin and asymmetric subgenomic evolution of the A and B subgenomes in heterologous tetraploid peanuts [2]. In addition, chloroplast phylogenomic analyses revealed that the diploid A. duranensis was a potential AA sub-genome ancestor due to the maternal hybridization event [19].
We used TGS PacBio technology [20] to obtain longer reads, combined with NGS Illumina technology, to obtain differences between wild allotetraploid Monticola and cultivated peanut Pingdu9616, and obtained higher levels of differential structure and expression analyses.
2.1 Plant Material and RNA Protection
The wild allotetraploid peanut Monticola and cultivated peanut Pingdu9616 which was one of the highest yield and area in northern China were selected for full-length RNA sequencing. Roots, stems, leaves, flowers, needles and young pods were collected at 20 days post flowering and each tissue was sampled from three individual in Monticola and Pingdu9616, respectively, and the collected samples were immediately stored with liquid nitrogen and stored at −80°C before use.
The total RNA of each sample is extracted, and the corresponding samples of each three single strains are mixed together to extract the total RNA. Purity was determined using NanoPhotometer® spectrophotometer (IMPLEN, CA, USA). Completeness and concentration of RNA samples using Agilent 2100 RNA Nano 6000 Assay Kit (Agilent Technologies, CA, USA) and Qubit3.0®Flurometer (Life Technologies, CA, USA). Qualified RNA samples were used for constructing cDNA libraries subsequently.
cDNA was synthesized using the SMARTer® PCR cDNA Synthesis Kit (Takara Clontech Biotech, Dalian, China). PCR amplification of synthesized cDNA using KAPA HiFi PCR Kits (Kapabio Systems, Inc. Station Cl., Potters Bar EN6 1TL, UK) Size fractionation and selection (1–2, 2–3, and >3 kb) were performed using the BluePippin™ Size Selection System (Sage Science, Beverly, MA). Construct the SMRTbell library with SMRTbell template prep kit 1.0, followed by damage repair and end repair. SMRT is then sequenced on the Pacific Bioslence RS II platform according to the protocol provided.
2.2 SGS Sequencing Data Analysis
The original off-machine sequence obtained by sequencing is filtered to remove sequences with joint contamination, low quality, and N ratio >5%. Hisat2 software is used to compare the filtered sequence to the genome to obtain information on differentially expressed genes and AS. Fragments per kilobase per million mapped fragments (FPKM) technique was used to count the expression levels of differentially expressed genes.
2.3 TGS Sequencing Data Analysis
The original off-machine sequence obtained by sequencing is filtered to remove low-quality, length <50 bp and contaminated sequences with joints, and the redundant sequences are clustered by isoform-level clustering algorithm (ICE) and corrected by the nine algorithm. Count and annotate transcripts using MatchAnnot software, annotate transcripts use SpliceGrapher to analyze AS, use fusion-finder.py to obtain fusion genes, use CNCI, CPC, and CPAT to predict LncRNAs, and use TransDecoder Release v3.0.1 to identify the encoding region, using Trinotate (20140717) to make functional annotations on the transcript.
3.1 Illumina-Based and SMRT-Based RNA Sequencing
A total of 708,602 polymerase-reads were produced in Monticola, with an average length of 35,118.17 bp and a value of 75,432 for N50. After removing redundant sequences, we obtained 31,764 high-quality transcripts in Monticola (named as: MON; average length: 2,182.88) and 33,981 high-quality transcripts in Pingdu9616 (named as: PD; average length: 2,231.28).
Adapter Pollution Reads Rate (%): due to sequencing primer sequence contamination, the number of sequences removed accounts for the proportion of the original decommissioning sequence. Low-quality reads rate (%): due to the excessive number of sequences removed accounts from the original number of decommissioning sequences. Clean Reads Rate (%): the ratio of the number of high-quality sequences after filtering to the number of off-machine sequences.
The clean reads of MON and PD were alignment on reference genome (Fig. 1). The filtered high-quality sequences of six tissues which sampled at 20 days post flowering were mapped on more than 90% reference genomic sequences in MON and PD. After error correction, 48,714,998, 53,528,482, 54,442,540, 58,392,964, 55,134,668 and 54,130,580 high-quality transcripts were obtained from flowers (named as: M1F), roots (named as: M2R), stem (named as: M3S), young pod (named as: M4P), leaves (named as: M5L) and fruit needle (named as: M6N) of Monticola. After error correction, 58,244,586, 61,275,660, 56,449,850, 52,824,406, 62,135,402 and 57,012,266 high-quality transcripts were obtained from flowers (named as: P1F), roots (named as: P2R), stem (named as: P3S), young pod (named as: P4P), leaves (named as: P5L) and fruit needle (named as: P6N) of Pingdu9616.
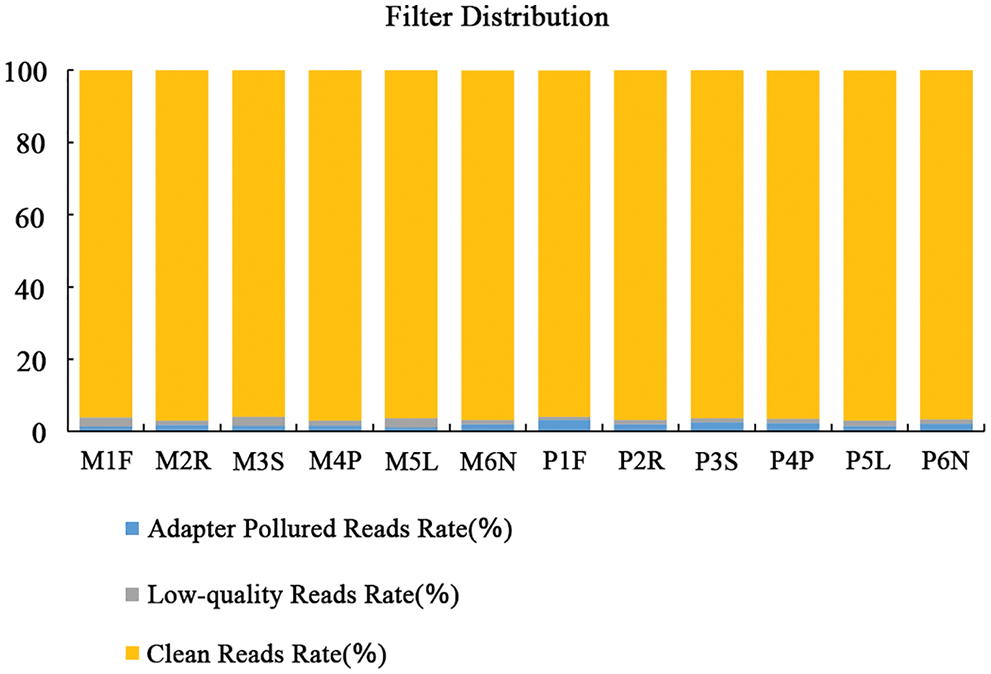
Figure 1: Proportional distribution of reads in all samples
3.2 Prediction of Transcript Structure, Alternative Splicing (AS), Fusion Gene and Alternative Polyadenylation (APA)
The transcript was compared to the exon of the annotated reference genome transcript, for a total of five types. Transcripts of Monticola and Pingdu9616 obtained using SMRT technology have only three types of structures (Fig. 2). This indicates that the transcripts we predicted had a high degree of accuracy.
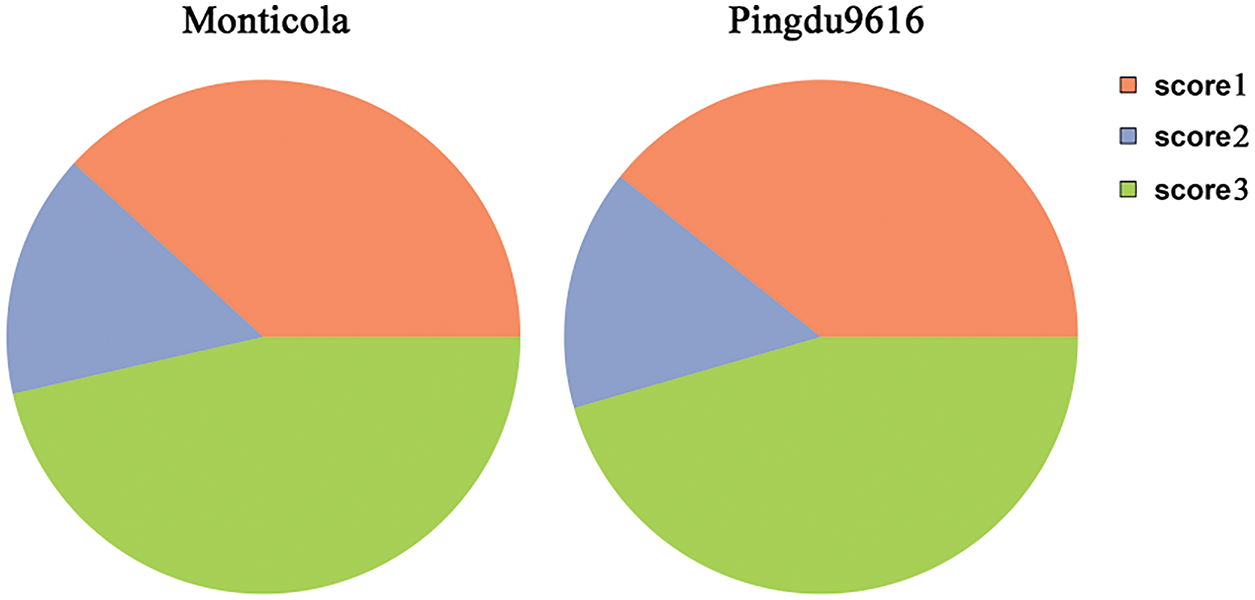
Figure 2: Statistical classification of transcripts. (Score1: The best match among all score = 1 transcripts. Score2: One-for-one exon match, but sizes of internal exons disagree. Score3: Sequence exons match annotation exons one-for-one, but leading and trailing edge sizes differ by a smaller amount than the Score4 transcript found for this gene)
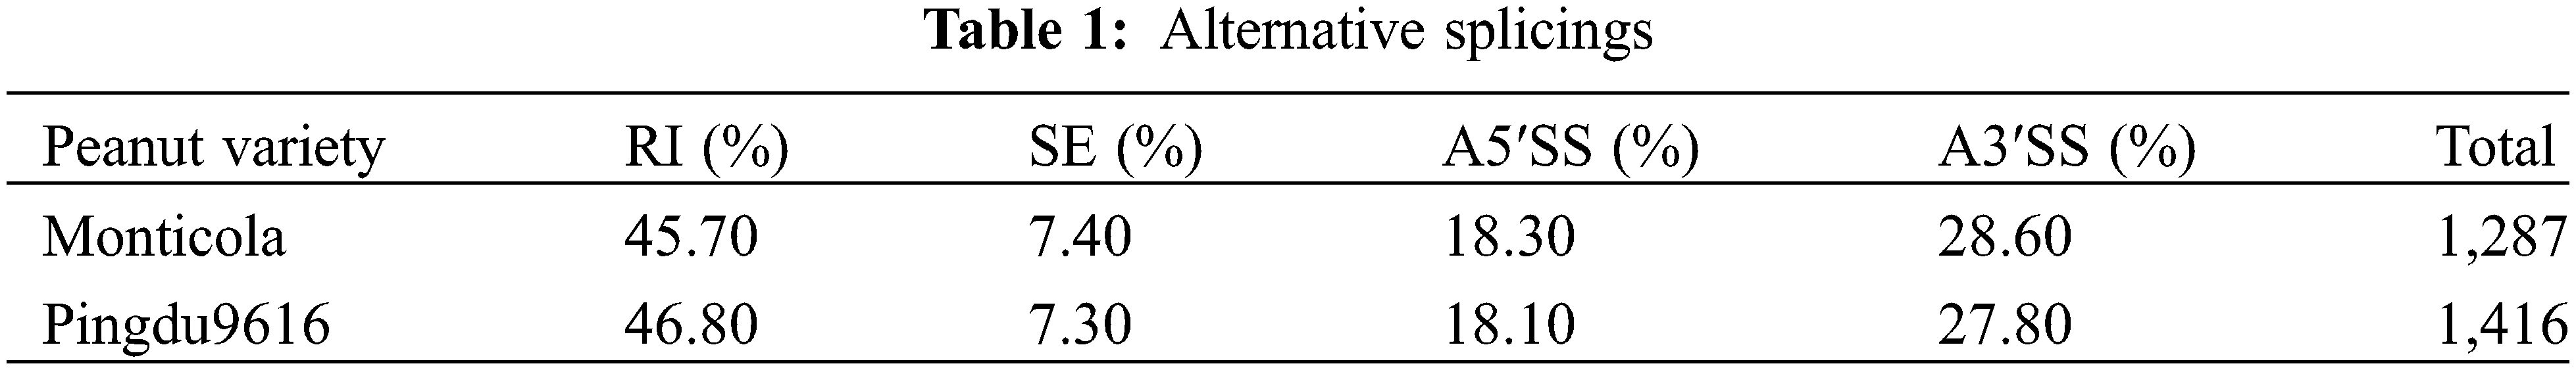
Alternative splicing (AS) is ubiquitous in most eukaryotic cells, and there are five types, including retained intron (RI), mutually exclusive exon (MEX), alternative 3′ splice site (A3′SS), alternative 5′ splice site (A5′SS) and skipped exon (SE). We obtained 1,287 and 1,416 AS in Monticola and Pingdu9616, all of which belong to RI, A3′SS, A5′SS and SE (Table 1). Pingdu9616 has more AS of various types than Monticola, suggesting that more genes undergo alternative splicing during domestication and/or artificial selection.
At least two isolation sites with a spacing of more than 10 kb, the site corresponding to the transcript coverage of more than 10% and the total length of more than 99% of the reads are defined as fusion genes. A total of 89 fusion genes were found in Monticola and Pingdu9616, including 32 transcript fusion genes and 57 exon fusion genes.
Alternative polyadenylation (APA) is dynamically regulated and automatically adjusted by environment stimuli. A total 11,443 and 11,716 APA were obtained in Monticola and Pingdu9616. The mutations at the unit point, bi-site, tri-site and tetra-locus, of which the unit point mutation and bi-site mutation of APA in Pingdu9616 are more than Monticola, and the tri-site mutation in Monticola is more than Pingdu9616 (Fig. 3).
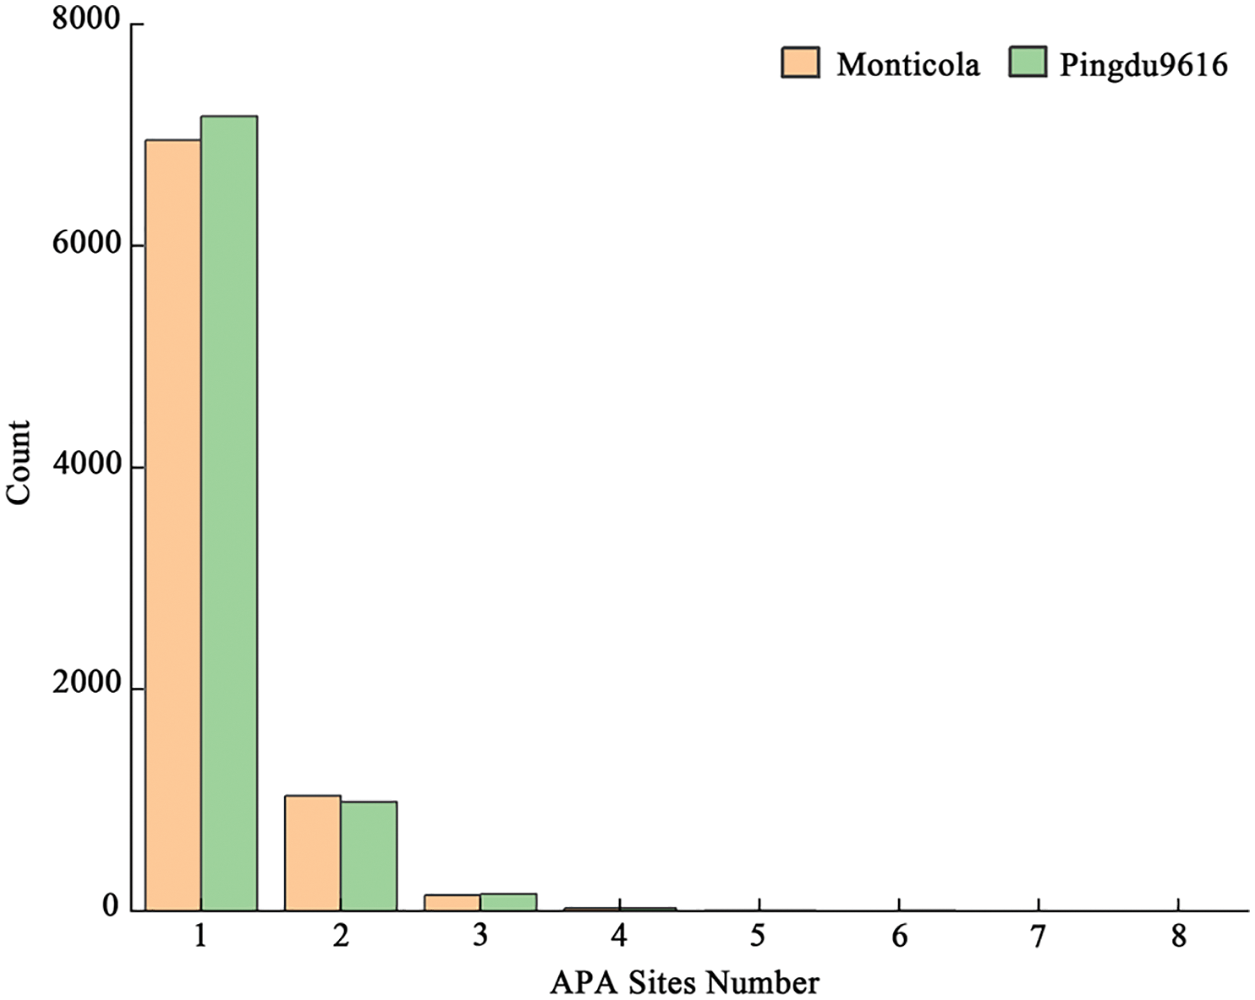
Figure 3: APA site number statistics
3.3 Prediction of Open Reading Frames (ORF), Single Sequence Repeats (SSR) and Long Non-Coding RNAs (LncRNA)
In total, 45,622 (N50: 1,515 bp) and 49,117 (N50: 1,509 bp) ORFs were predicted in Monticola and Pingdu9616. Monticola and Pingdu9616 have the highest number of sequences with ORF lengths in the range of 0~1,000 bp (Fig. 4). The maximum length of the ORF obtained by Monticola and Pingdu9616 exceeded 7,000 bp, demonstrating that SMRT could obtain a longer open reading frame. However, the less number and shorter length of transcripts were determined in Monticola and Pingdu9616 relative to Fuhuasheng and Tiffrunner [6,11]. The number of ORFs of Pingdu9616 is significantly higher than that of Monticola, indicating that the number of ORFs in cultivated species is significantly higher than that of wild species.
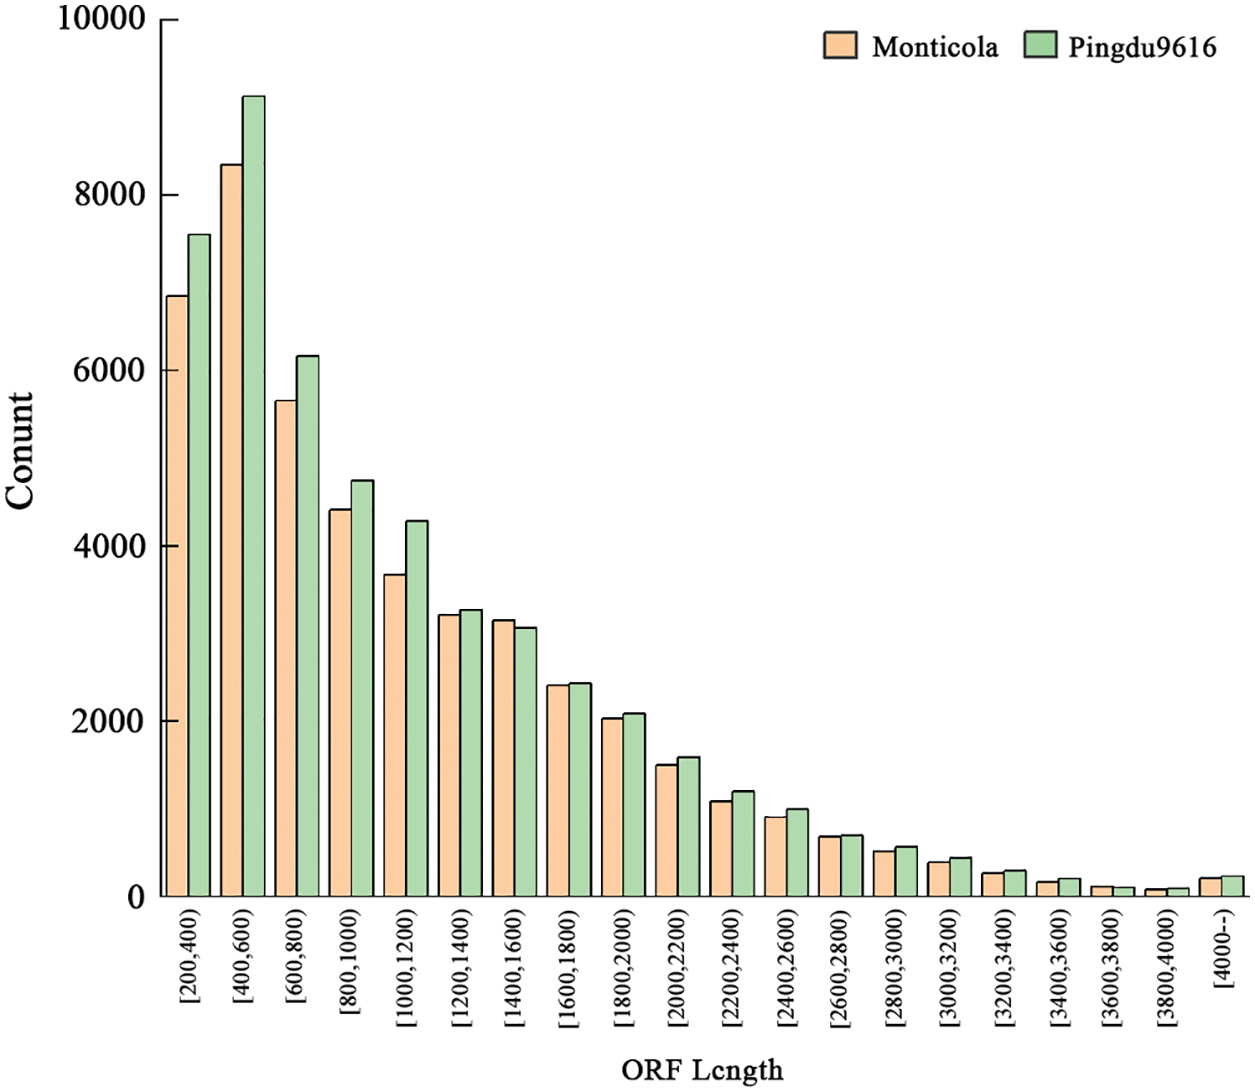
Figure 4: ORF length distribution
SSR markers are wildly used as molecular marker in numerous organisms. A total of 5,805 and 6,152 SSRs were detected in Monticola and Pindu9616, and the identified SSR sequences had more than 9 repetitions of the dinucleotide sequence, more than 6 repetitions of the triple nucleotide sequence, and more than 5 repetitions of the tetranucleotide sequence. These SSR makers can be used in molecular maker-assisted breeding.
LncRNAs are an emerging hot topic in biology and has been found to be functional as key regulators in a wide spectrum of biological processes. In this study, 286, 777 and 185 specific LncRNAs were obtained using CNCI, CPC and CPAT, respectively. Three softwares jointly identified 1,691 LncRNAs (Fig. 5). The LncRNA length obtained in Monticola and Pingdu9616 is the largest number in 1~1,000 bp, and the maximum length exceeds 4,000 bp, indicating that the LncRNA obtained by SMRT technology also solves the second-generation transcriptomes sequencing data to a certain extent LncRNA with longer lengths can be obtained.
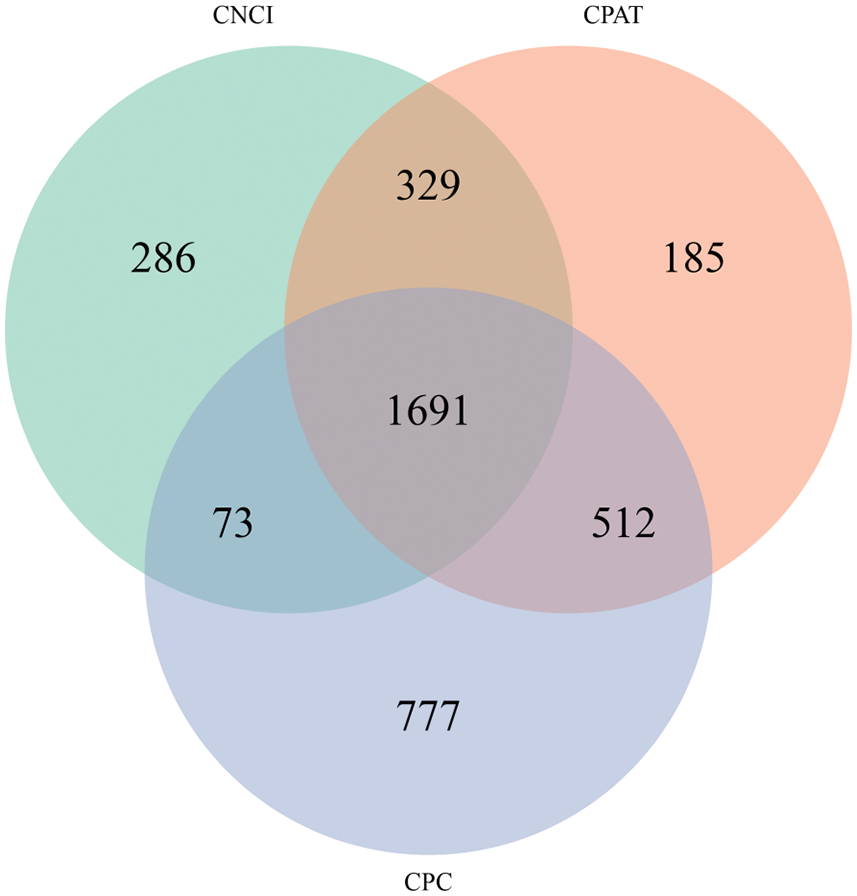
Figure 5: Predictions of LncRNA
3.4 Function Annotation of ORFs and Prediction of Transcription Factors (TF)
A total 12,843 and 13,557 predicted ORFs in Monticola and Pingdu9616 were annotated using Trinotate (20140717) software. 14,659, 15,047, 18,879, and 17,580 ORFs were annotated by BLASTP, BLASTX, the NR database, and the NT database, respectively. Of these, the number of ORFs that were simultaneously annotated was 13,796 in Monticola and Pingdu9616 (Fig. 6). These results indicated that most of the genes in our datasets are truly transcribed sequences and likely functional genes in Monticola and Pingdu9616.
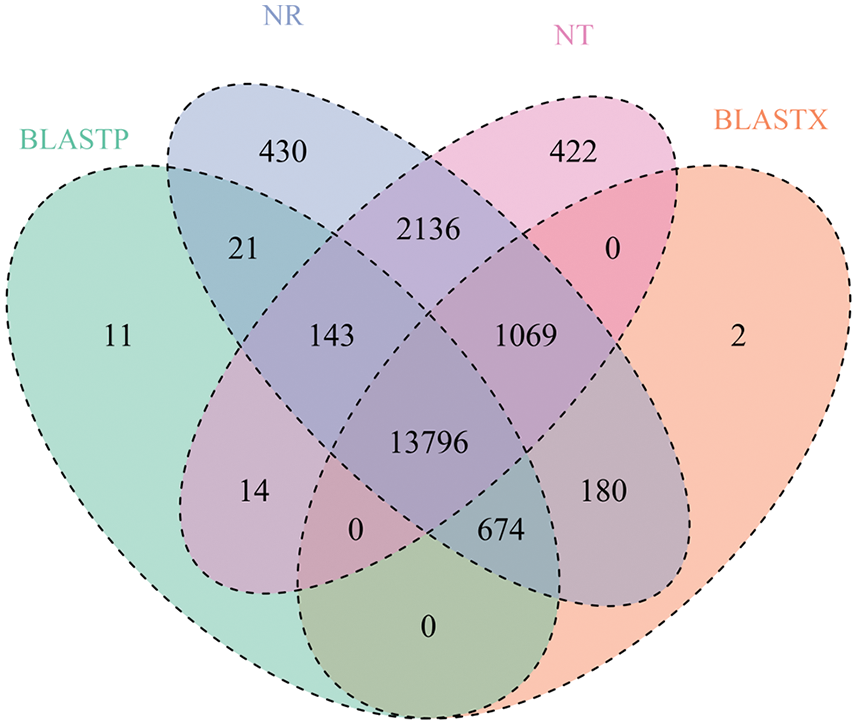
Figure 6: ORFs annotation number chart
Gene ontology (GO) was predicted using the Blast2GO [21] software. The sequenced transcripts were compared to the GO database, and a total of 50,993 genes were annotated in Monticola and Pingdu9616. The number of genes annotated to describe biological process is 16,857, and the number of genes annotated to describe molecular function is 17,094, and the number of genes annotated to describe cellular components is 17,042. The number of genes in the cellular process annotated in biological process is the largest, followed by metabolic process, single-organism process and biological regulation. The number of genes in the cell part annotated in cellular component is the largest, followed by organelle, organelle part and membrane. The number of genes annotated into molecular function that binding and catalytic two term are the largest, and the number of genes annotated to other term is smaller (Fig. 7).
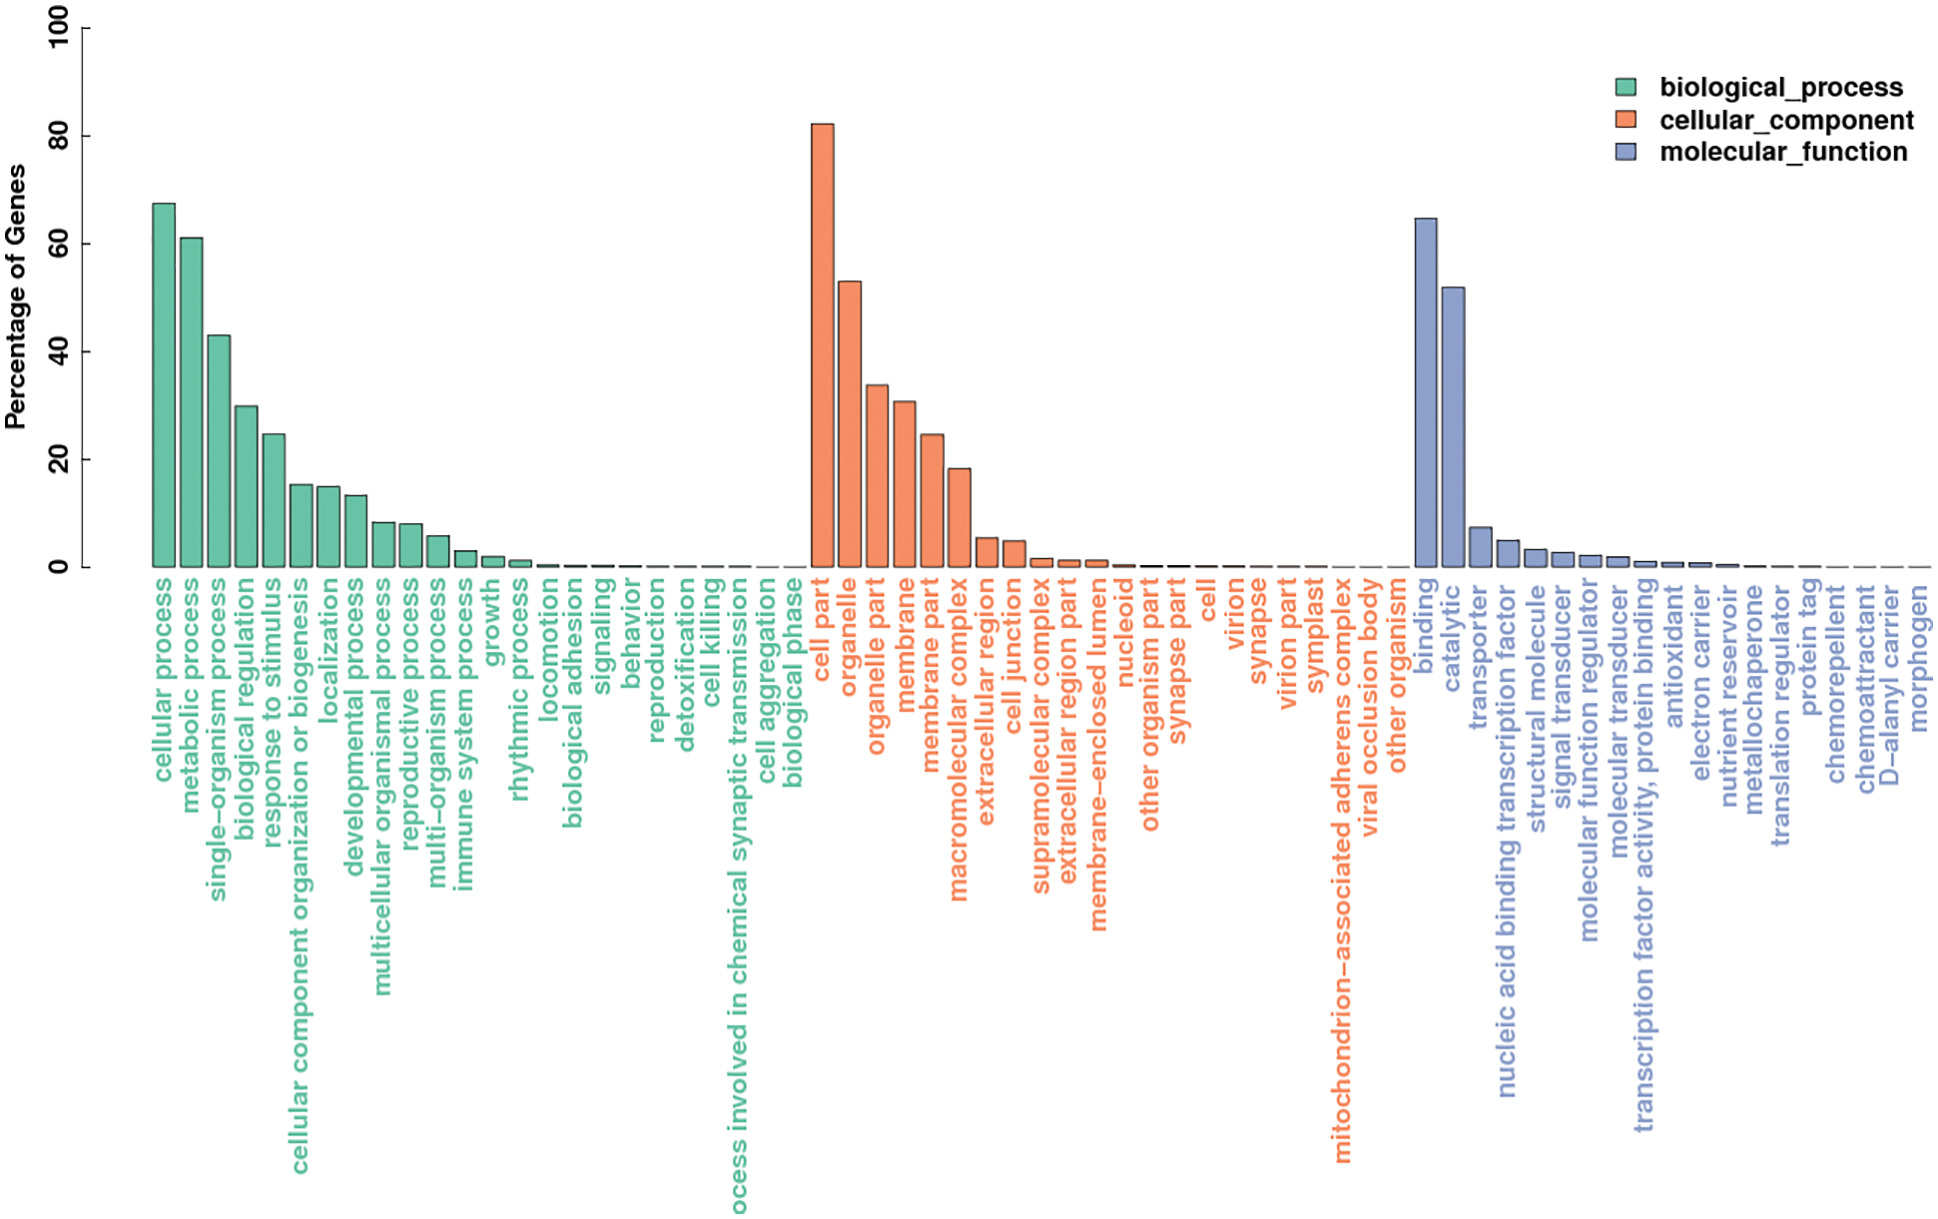
Figure 7: GO functional annotations
The genes that were not compared to the five databases were compared to the KOG database, the e-value greater than 10−5 were filtered out, and the highest score results were selected for annotation and analysis. A total 5,658 and 5,888 genes in Monticola and Pingdu9616 were not compared to five databases, respectively. As shown in Fig. 8, according to KOG’s annotation results, the genes found to be the most annotated are general function prediction only, followed by posttranslational modification, protein turnover, chaperones, and the least genes associated with nuclear structure.
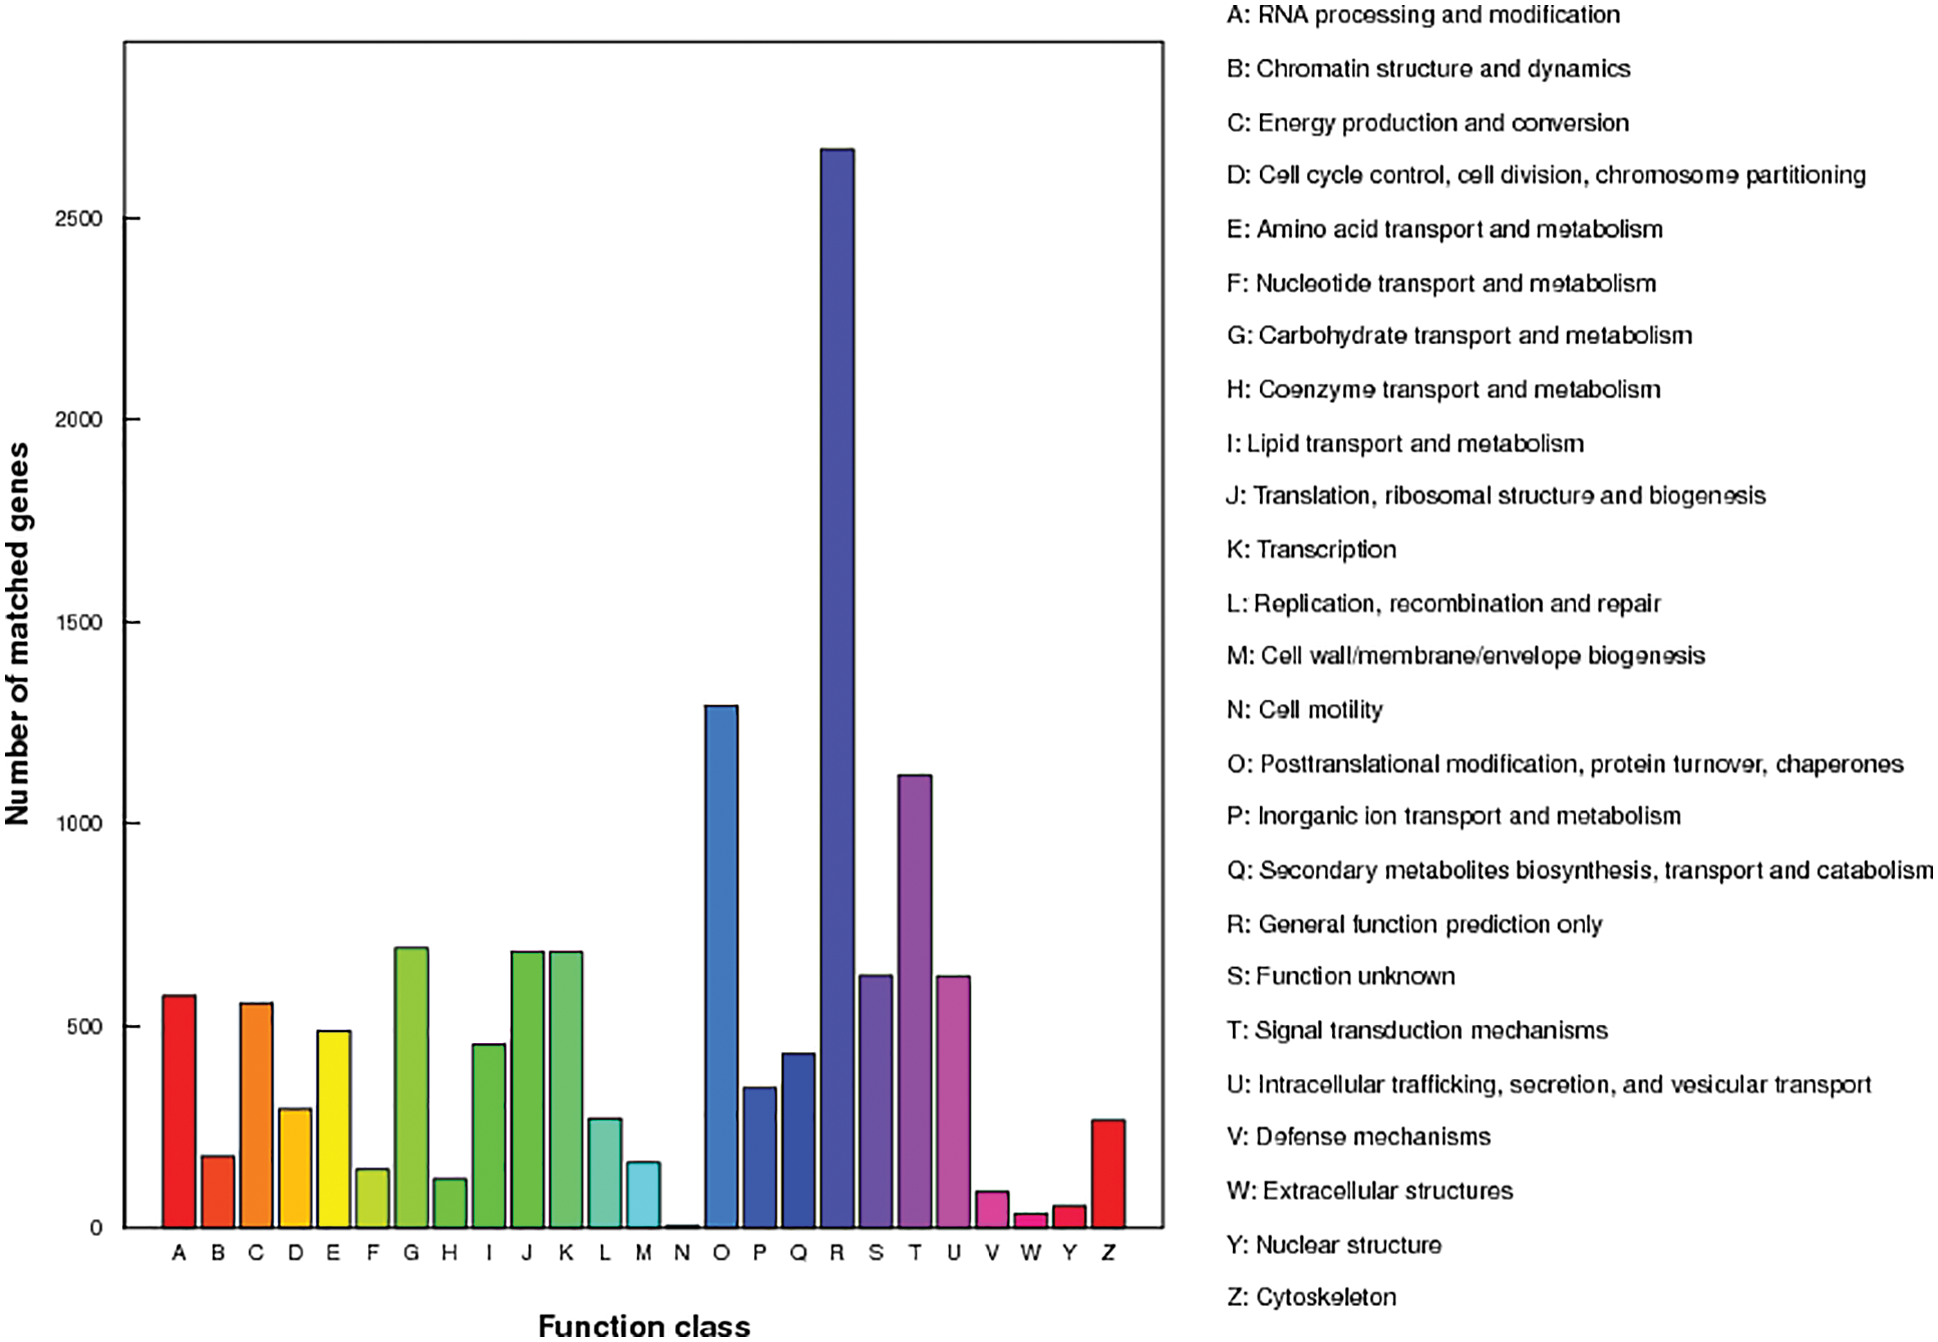
Figure 8: KOG functional annotations
Compare genes to the PlantTFDB database to predict whether they are TF genes and the family of TF to which they belong. 15,648 and 16,763 putative TF members were identified from Monticola and Pingdu9616, respectively, and these TF genes originated from 57 gene families. The top ten families predicted by Monticola and Pingdu9616 were only different from the tenth TF family, and the top four TF families predicted were all related to plant growth and development and abiotic stress responses (Fig. 9). Compared with Fuhuasheng [6], the number of TFs and the number of TF families in Monticola and Pingdu9616 were small, neither of the GeBP family was detected in Monticola and Pingdu9616, and the number of TFs in the FAR1 family was significantly less than that of Fuhuasheng.
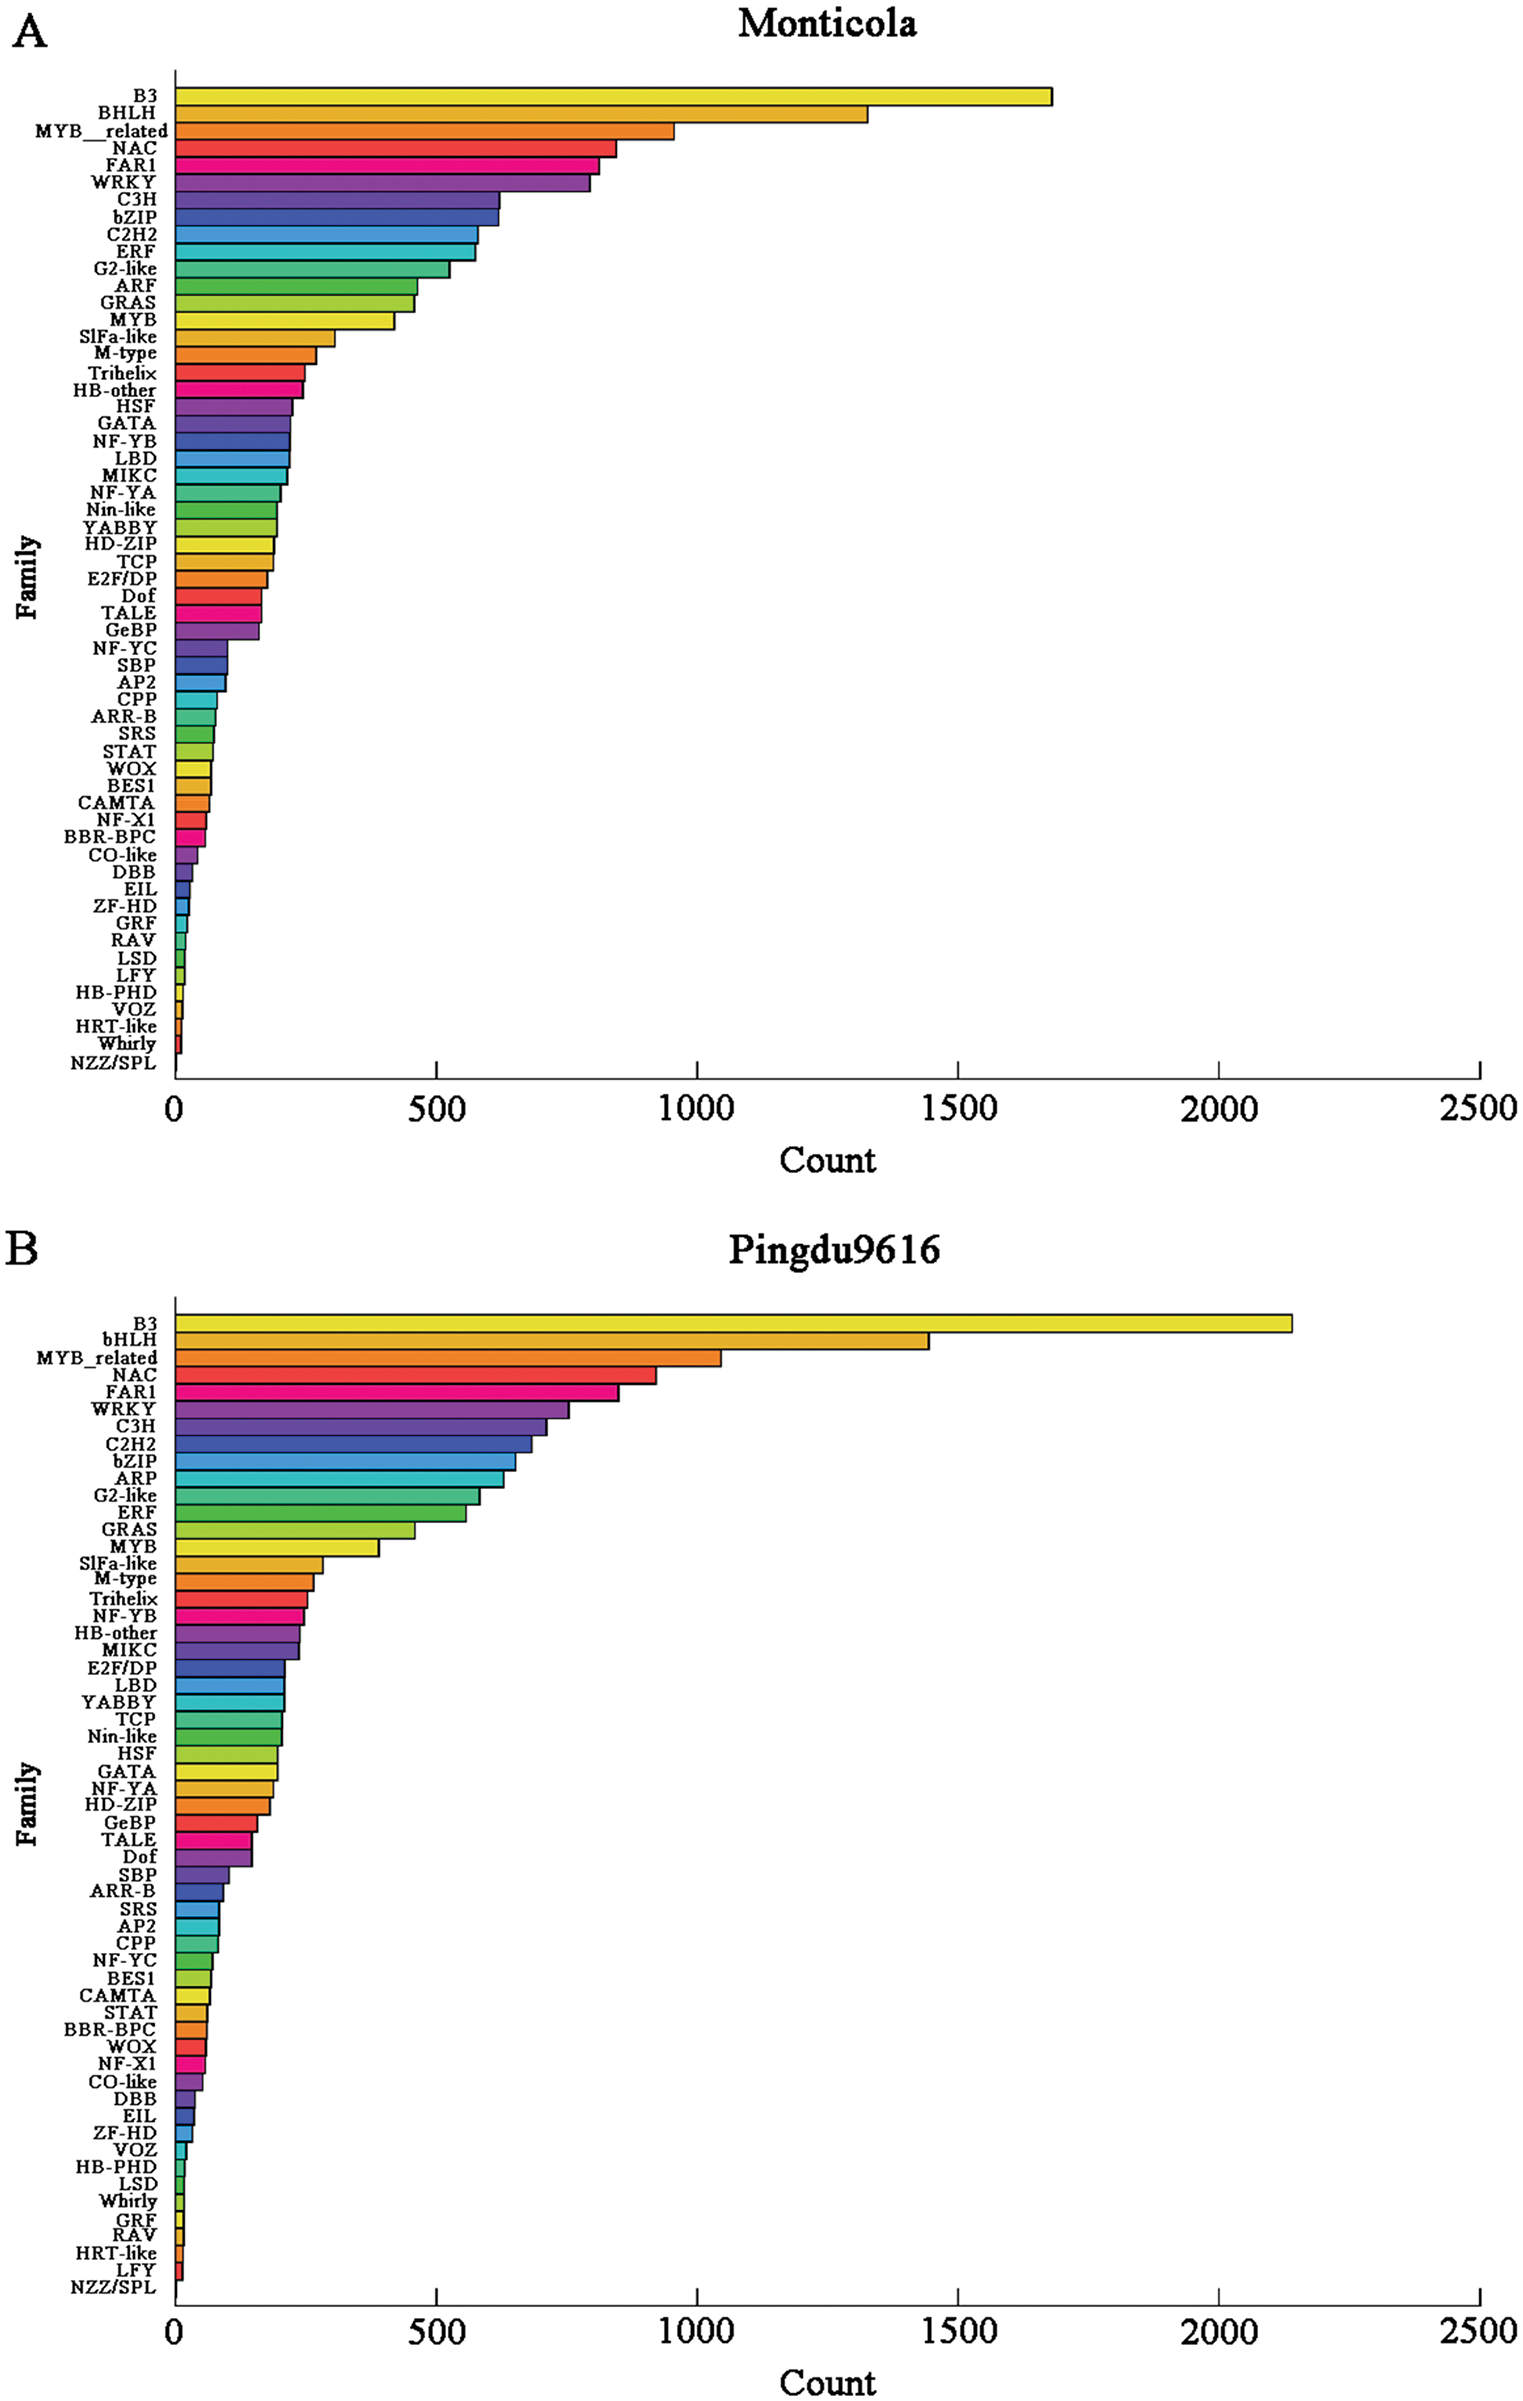
Figure 9: Distribution map of TF families
3.5 Analysis of Gene Expression
Most of the gene expressions in six tissues of Monticola and Pingdu9616 are in the range of 0~10 FPKM-value, the FPKM-value of the median expression are in the range of 3~5, and the regions where gene expression in concentrated are in the range of log2 FPFM value of 0~5. Monticola expressed more genes in flowers, root, leaves and young pods than Pingdu9616. The number of genes expressed in the stems of Monticola and Pingdu9616 is similar. The fruit needles of Monticola expressed fewer genes than Pingdu9616. The number of genes expressed in flowers and young pods in the six tissues were small, and there were large differences in Monticola and Pingdu9616 (Fig. 10).
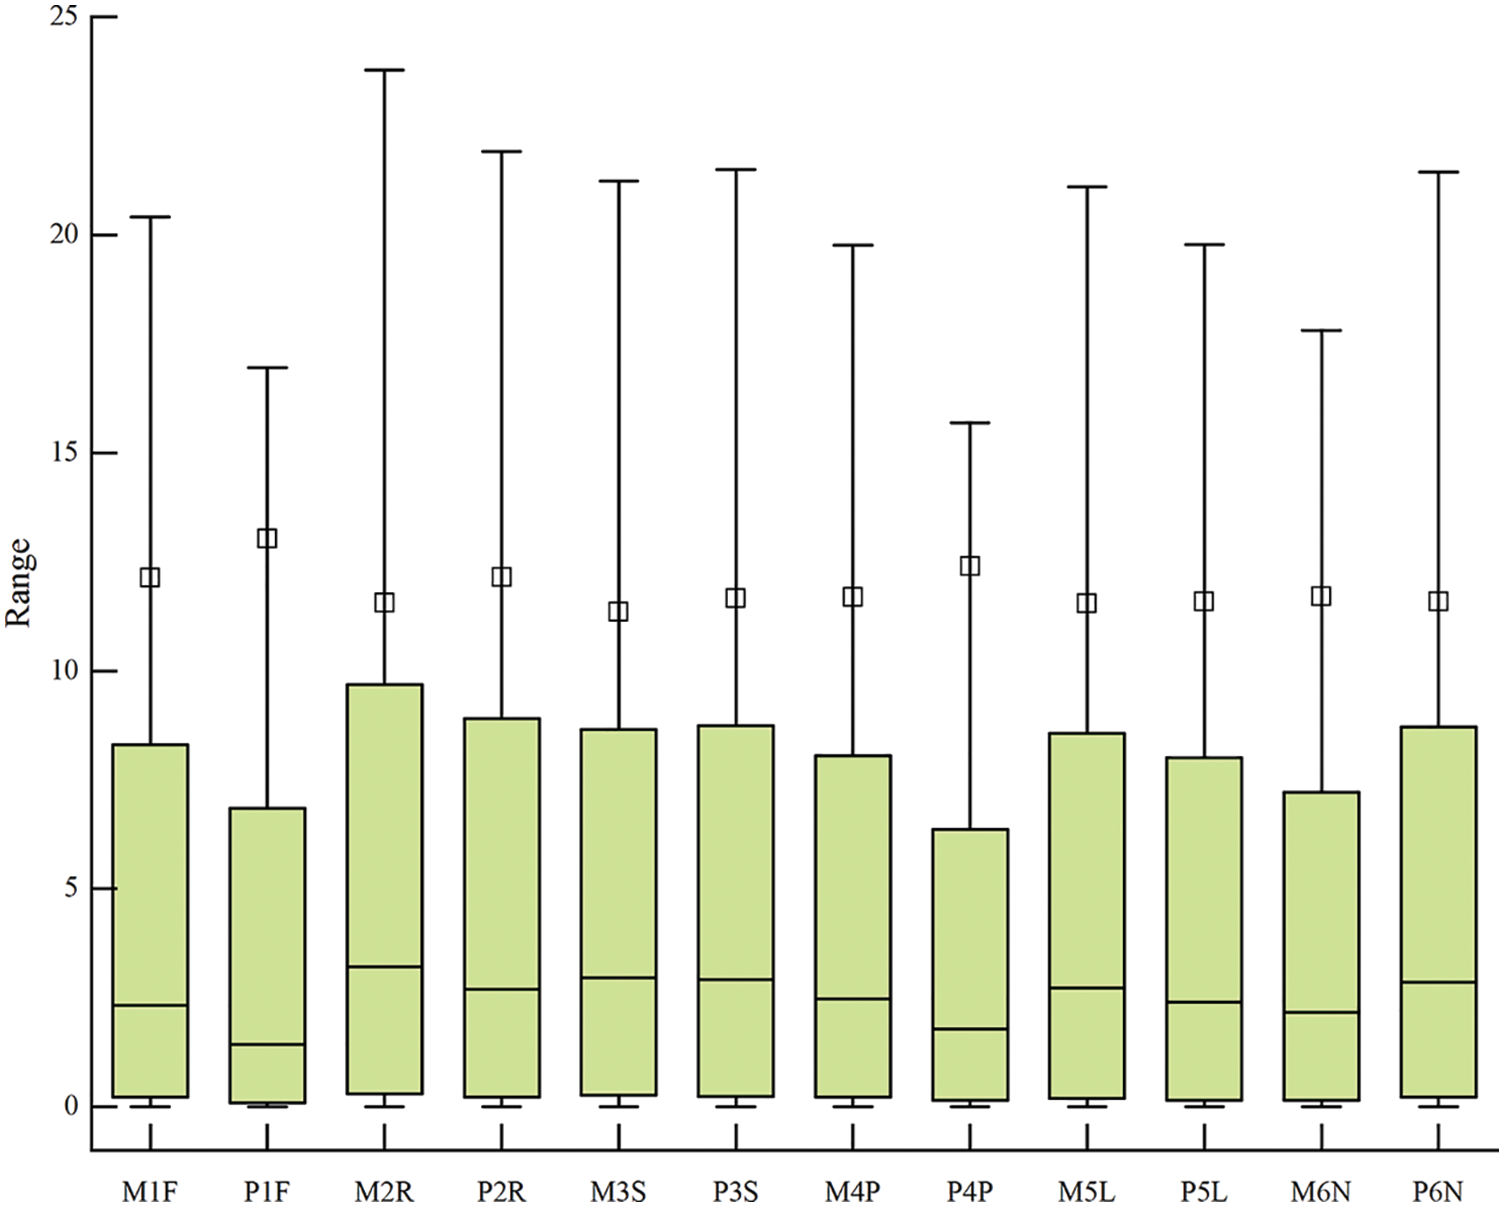
Figure 10: Map of sample gene expression distribution
In the second-generation data, Monticola and Pingdu9616 obtained 1,336 (607 up-regulated; 729 down-regulated) differentially expressed genes. In SMRT data, 289 (142 up-regulated; 147 down-regulated) differentially expressed genes were obtained in Monticola and Pingdu9616.
After the GO enrichment analysis of the differentially expressed genes of SMRT transcriptomes, it was found that the cell component was annotated to 11 components, and the components with more differentially genes were cell part, organelle, membrane, organelle part and membrane part. Biological process was annotated to 15 components, and the components with more differential expressed genes were cellular process, metabolic process, biological regulation and response to stimulus. Molecular function was annotated to 7 components, and the components with more differential genes were binding and catalytic activity.
In the second-generation transcription group, the differentially expressed genes were analyzed by GO enrichment, and the cellular component was annotated to a total of 13 components, a total of 846 (Up: 374, Down: 372) differential expressed genes, and the components with more differential expressed genes were cell part, organelle, membrane, organelle part and membrane part. Biological process was annotated to 18 components, a total of 790 (Up: 366, Down: 424) differential expressed genes, and the components with more differential expressed genes were cellular process, metabolic process, biological regulation and response to stimulus. Molecular function was annotated to 10 components, a total of 808 (Up: 366, Down: 442) differential expressed genes, and the components with more differential genes were binding and catalytic activity (Fig. 11).
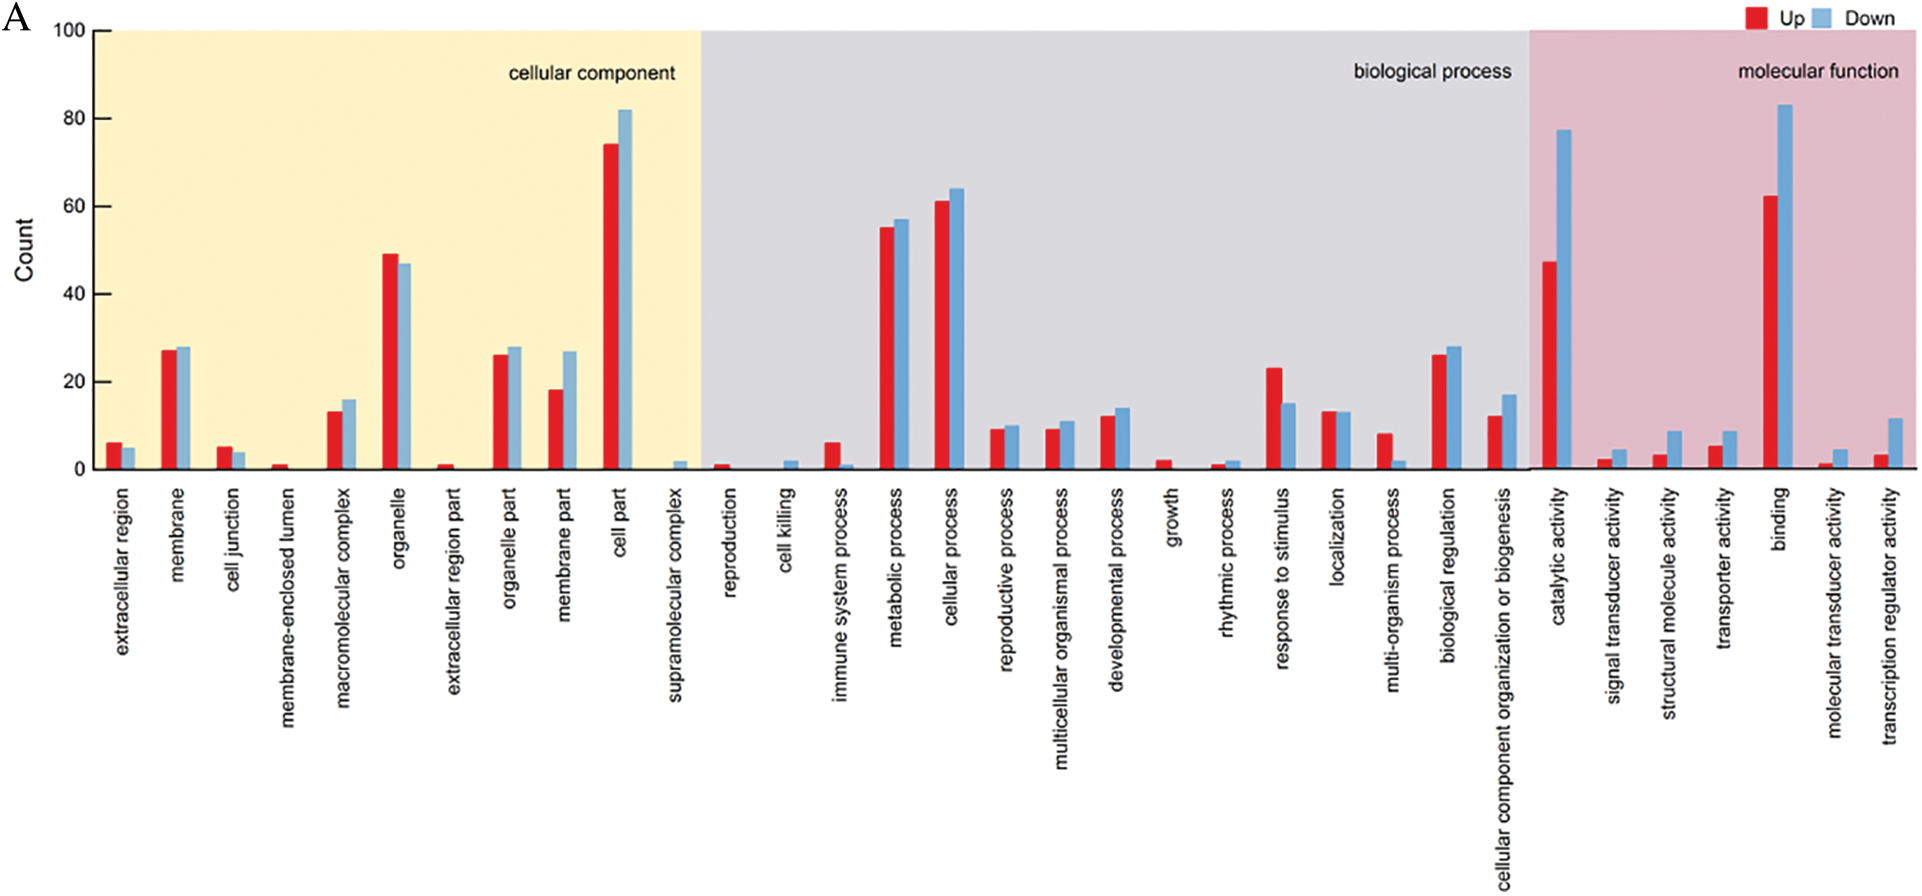
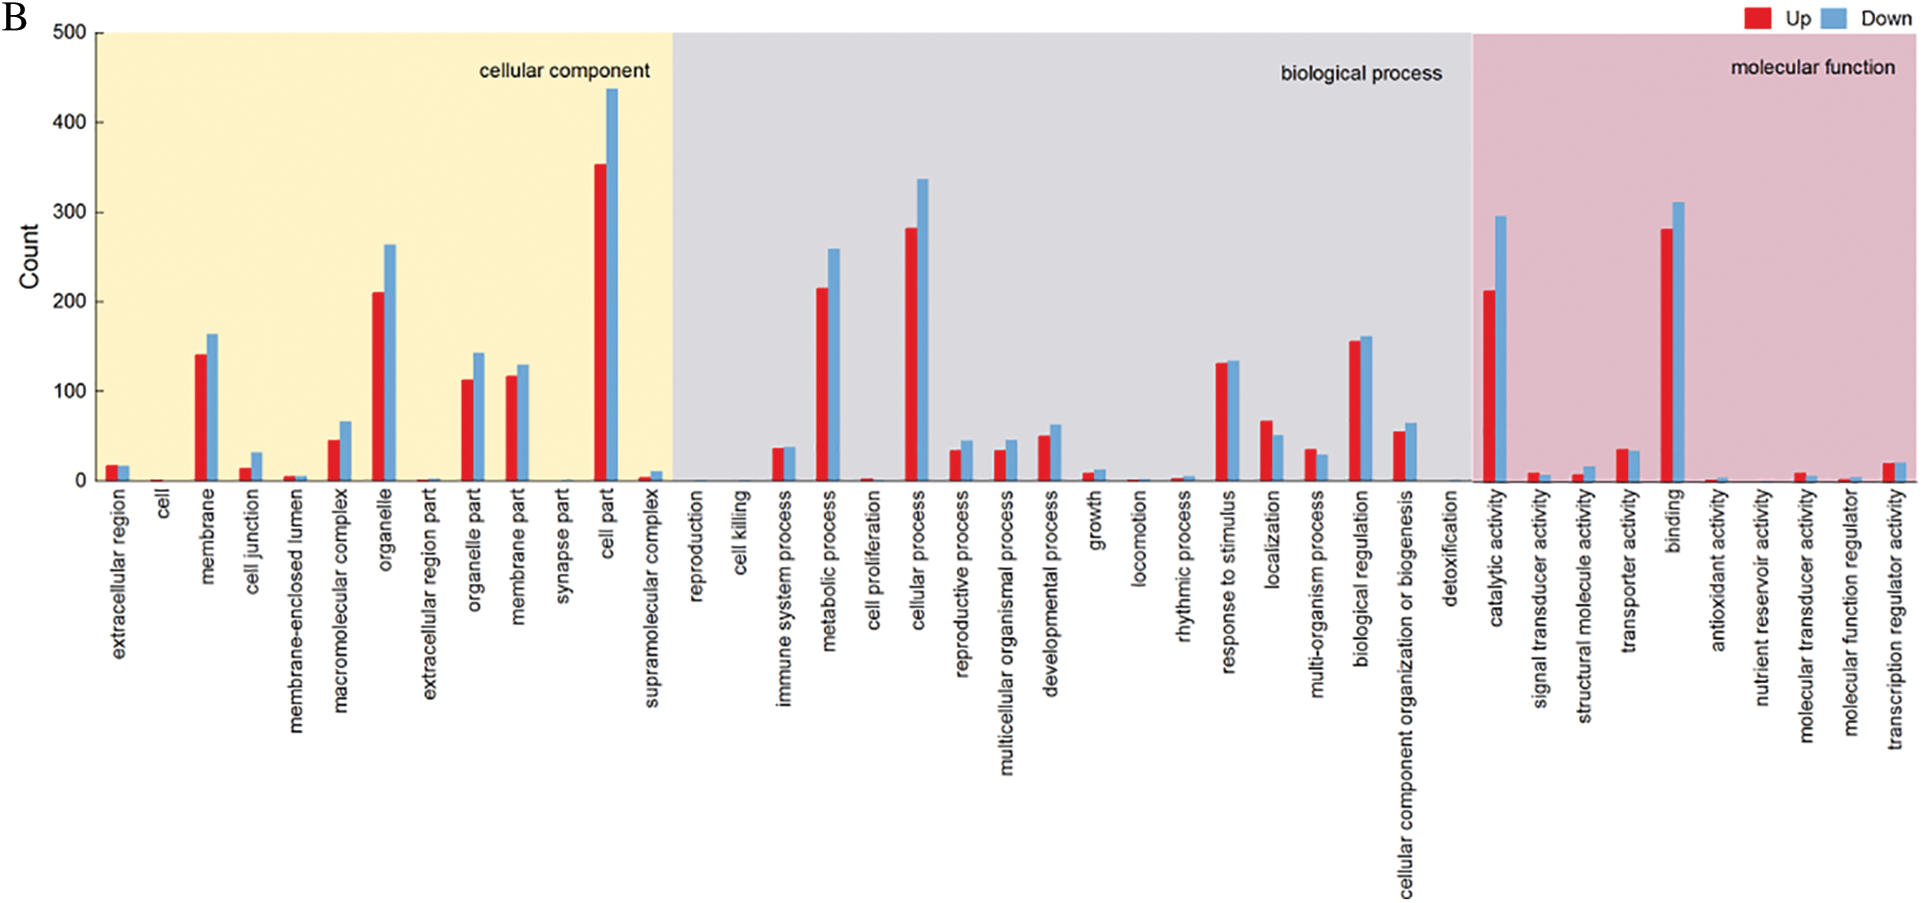
Figure 11: KGO functional classification. (A) GO statistical map of SMRT differentially expressed genes. (B) GO statistical map of Illumina differentially expressed genes
In biological process, entries with a higher degree of environment include programmed cell death, cell death, innate immune response and immune response, and entries with more enriched genes include response to stress, signal transduction and defense response (Fig. 12a). In molecular function process, entries with a higher degree of environment include nucleotide binding, carbohydrate derivation binding, purine nucleotide binding, purine ribonucleotide binding and purine ribonucleoside triphosphate binding (Fig. 12b).
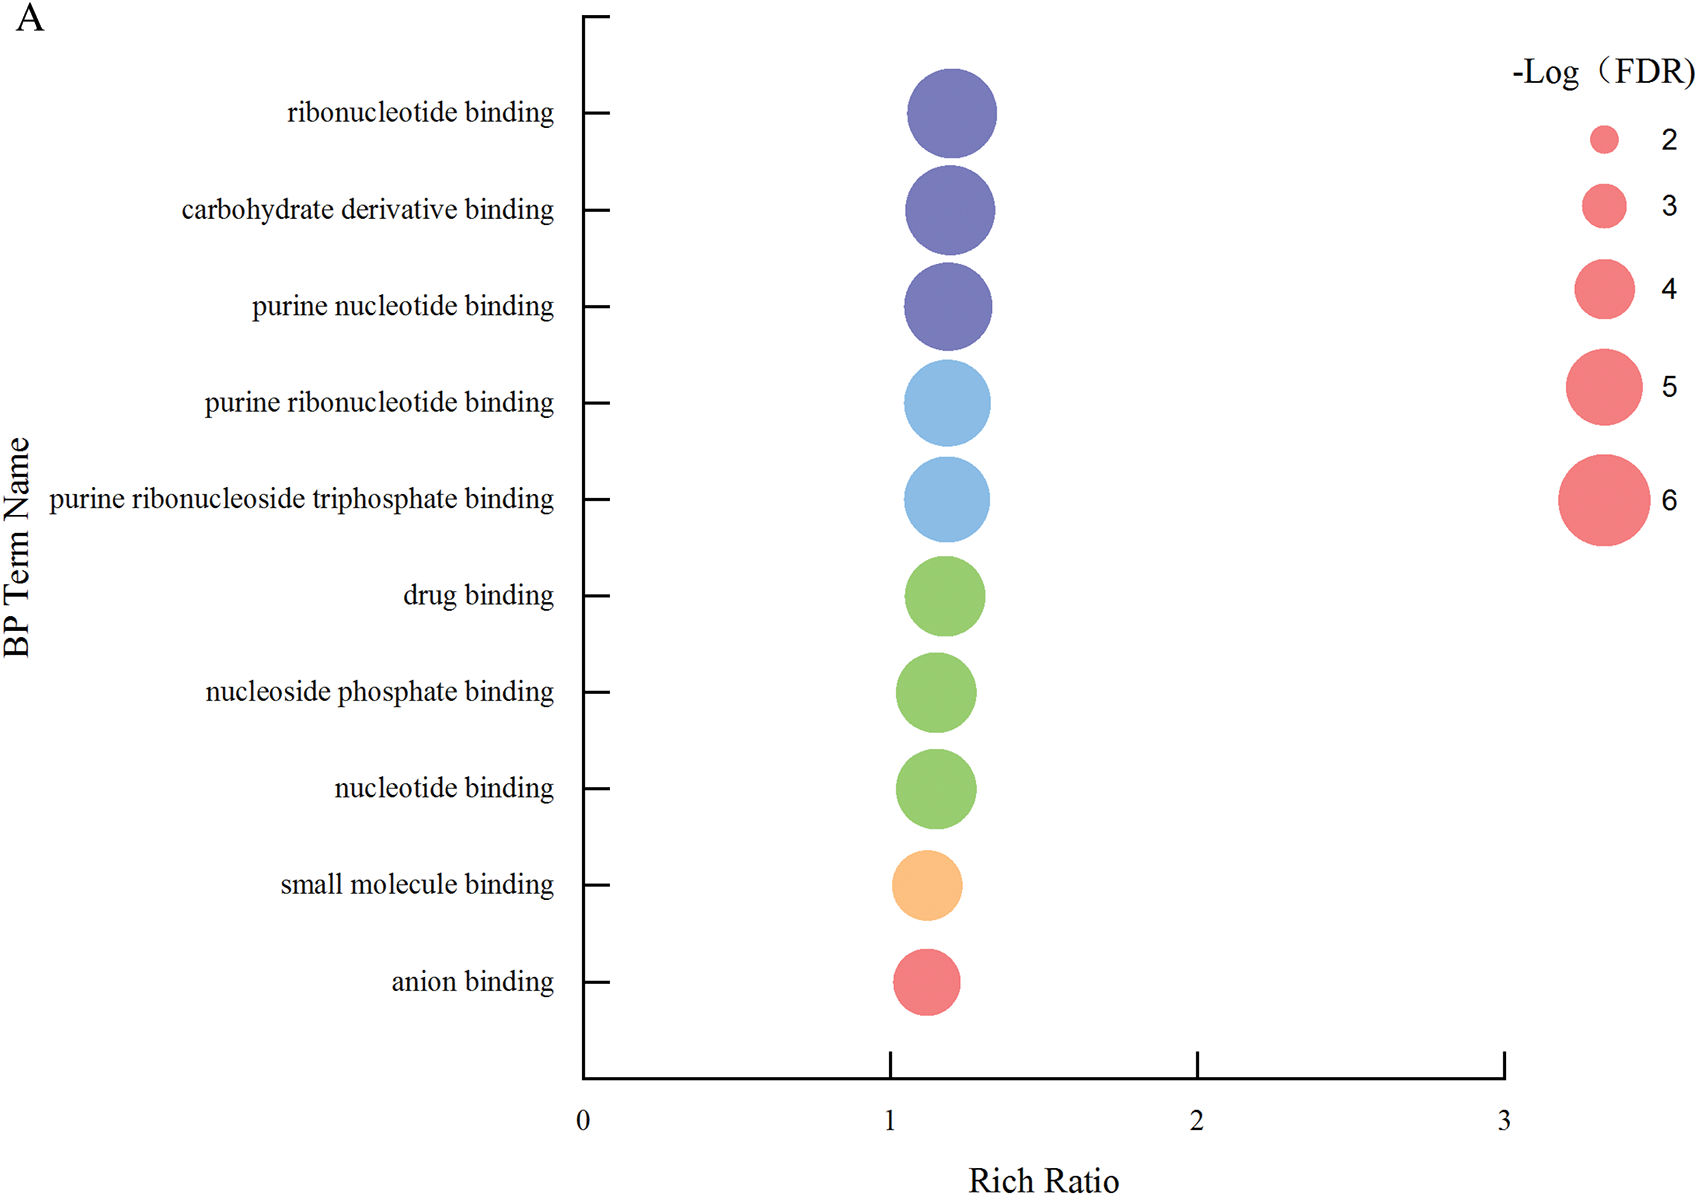
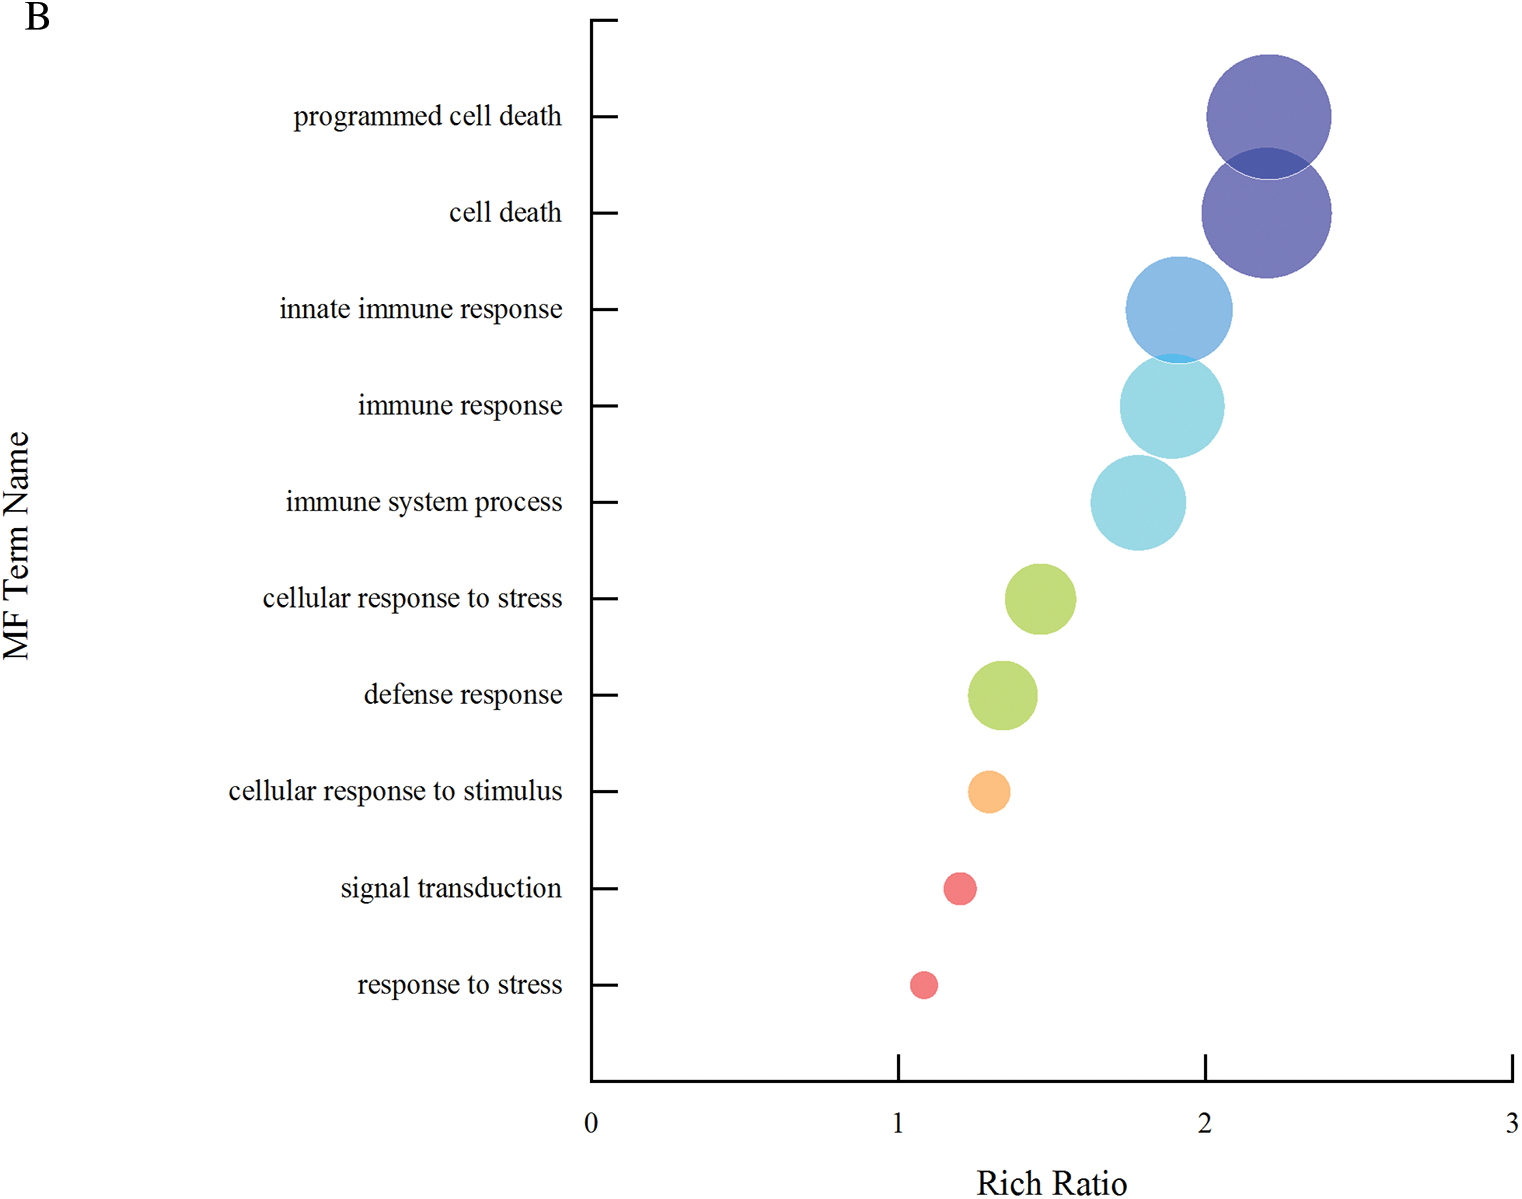
Figure 12: A single set of GO entries q-value enrichment graph
Illumina obtained more differentially expressed genes than SMRT, and performed GO enrichment analysis on differentially expressed genes, and the results showed that the components of the enrichment were the same, which also proved that the second-generation transcriptome data could supplement the third-generation transcriptome data. We conducted a Kyoto encyclopedia of genes and genomes (KEGG) pathway analysis of differentially expressed genes, and no pathway with significant enrichment of differentially expressed genes were found.
The transcriptome of eukaryotes is complex and diverse, with complex biological regulation, and peanut is heterologous tetraploid plant with large genomes. The development and popularization of sequencing technology has given us a deeper understanding of peanut [20]. Previous studies have shown that hybrid sequencing methods combined with SGS and TGS technologies can provide high-quality and more complete assembly in genome and transcriptome studies [22–25]. The single-molecule sequencing platform can read full length transcripts and avoid the assembly process which provided valuable sources of high quality full length transcripts to further understand the alternative splicing of gene regulation mechanisms [26]. In this study, full-length transcriptome sequencing was performed on wild heteroploid tetraploid Monticola and cultivar Pingdu9616, and the comparison rate exceeded 97% by correcting the original data and comparing them with the reference genome. Comparing the Illumina data to the reference genome, the alignment rate of Monticola’s flower organ was less than 70%, possibly due to the large differences between the selected reference genome Tiffrunner and Monticola flower organ genes [17]. The results showed that the transcripts of Monticola and Pingdu9616 obtained by the SMRT technology had a high degree of completeness and accuracy, which also ensured the accuracy of subsequent analysis of the transcriptome.
Long reads obtained using SMRT technology from TGS combined with short reads obtained by Illumina sequencing of NGS performed transcriptome analyses on cultivated species Pingdu9616 and wild species Monticola. Full-length transcripts of the cultivar Pingdu9616 and the wild species Monticola were obtained, and differential expression between the two cultivars was analyzed. In peanut, full-length transcriptome have been performed on dissecting AS patterns during peanut peg and early pod development [27]. De novo full length transcriptome analysis of wild diploid peanuts A. glabrata provides a transcriptome reference sequence and mainly discovery of different expression gens in biotic and abiotic [28].
Compared to all published full-length transcriptome data of peanut species, this data was the most extensive available, with six tissues from the allotetraploid wild and cultivated peanuts, Hence, we used this well established and characterized sequencing resource for the function genes evolved and where it originally emerged. we obtained 47,574 and 43,701 variation sites including single nucleotide polymorphisms (SNPs) and insertion-deletions (InDels) in Monticola and Pingdu9616, the numbers is similar to previous studies [29]. These variants can be all used in molecular marker-assisted breeding. But the number of SNPs in Monticola and Pingdu9616 was significantly less than the studies conducted by Bhat et al. [30] which indicated that wild and the cultivated species are obviously different in genotype. Compared with other studies in gene family, most gene family such as TFs from 57 families and GeBP family were identified less in Monticola and Pingdu9616 than Fuhuasheng [15].
The full-length transcriptome measured by peanuts can dig deeper into the changes that occur during the domestication process of peanuts, providing a basis for the study of peanut functional genes.
Availability of Data and Materials:The datasets used and analyzed in this study were available from the corresponding author on reasonable request. Sequences have been submitted in the CNCB database (https://www.cncb.ac.cn/), the Project No. PRJCA009744.
Authorship:The authors confirm contribution to the paper as follows: study conception and design: Xiaojun Zhang; analysis and interpretation of results: Danlei Song, Xiaona Yu, Yaoyao Li, Xianheng Wang, Xinyuan Cui, Tong Si, Xiaoxia Zou, Yuefu Wang; draft manuscript preparation: Danlei Song, Xiaona Yu, Xiaojun Zhang. All authors reviewed the results and approved the final version of the manuscript.
Funding Statement:This work was financially supported by the National Natural Science Foundation of China (31771828, 32001576), and the Opening Foundation of Shandong Provincial Crop Varieties Improvement (2020LZGC001).
Conflicts of Interest:The authors declare that they have no conflicts of interest to report regarding the present study.
References
1. Krapovickas, A., Gregory, W. C. (1994). Taxonomía del género Arachis (Leguminosae). Bonplandia, 8(1–4), 1–186. [Google Scholar]
2. Yin, D., Ji, C., Song, Q., Zhang, W., Zhang, X. et al. (2020). Comparison of Arachis monticola with diploid and cultivated tetraploid genomes reveals asymmetric subgenome evolution and improvement of peanut. Advanced Science, 7(4), 1901672. [Google Scholar]
3. Sejio, G., Lacia, G. I., Fernández, A., Krapovickas, A., Ducasse, D. A. et al. (2007). Genomic relationships between the cultivated peanut (Arachis hypogaea, Leguminosae) and its close relatives revealed by double GISH. American Journal of Botany, 94(12), 1963–1971. [Google Scholar]
4. Grabiele, M., Chalup, L., Robledo, G., Seijo, G. (2012). Genetic and geographic origin of domesticated peanut as evidenced by 5S rDNA and chloroplast DNA sequences. Plant Systematics and Evolution, 298(6), 1151–1165. [Google Scholar]
5. Kochert, G., Halward, T., Branch, W. D. (1991). RFLP variability in peanut (Arachis hypogaea L.) cultivars and wild species. Theoretical and Applied Genetics, 81(5), 565–570. [Google Scholar]
6. Halard, T., Stalker, T., Larue, E., Kochert, G. (1992). Use of single-primer DNA amplifications in genetic studies of peanut (Arachis hypogaea L.). Plant Molecular Biology, 18(2), 315–325. [Google Scholar]
7. Kochert, G., Stalker, H. T., Gimenes, M., Galgaro, L., Lopes, C. R. et al. (1996). RFLP and cytogenetic evidence on the origin and evolution of allotetraploid domesticated peanut, Arachis hypogaea (Leguminosae). American Journal of Botany, 83(10), 1282–1291. [Google Scholar]
8. Cuc, L. M., Mace, E. S., Crouch, J. H., Quang, V. D., Long, T. D. et al. (2008). Isolation and characterization of novel microsatellite markers and their application for diversity assessment in cultivated groundnut (Arachis hypogaea). BMC Plant Biology, 8(1), 55. [Google Scholar]
9. Bertioli, D. J., Seijo, G., Freitas, F. O., Valls, J. F. M., Leal-Bertioli, S. C. M. et al. (2011). An overview of peanut and its wild relatives. Plant Genetic Resources, 9(1), 134–149. [Google Scholar]
10. Moretzsohn, M. C., Gouvea, E. G., Inglis, P. W., Leal-Bertioli Soraya, C. M., Valls, J. F. M. et al. (2012). A study of the relationships of cultivated peanut (Arachis hypogaea) and its most closely related wild species using intron sequences and microsatellite markers. Annals of Botany, 111(1), 113–126. [Google Scholar]
11. Bertioli, D. J., Cannon, S. B., Froenicke, L. (2016). The genome sequences of Arachis duranensis and Arachis ipaensis, the diploid ancestors of cultivated peanut. Nature Genetics, 48, 438–446. [Google Scholar]
12. Chen, X., Li, H., Pandey, M. K., Yang, Q., Wang, X. et al. (2016). Draft genome of the peanut A-genome progenitor (Arachis duranensis) provides insights into geocarpy, oil biosynthesis, and allergens. PNAS, 113(24), 6785. [Google Scholar]
13. Yin, D., Ji, C., Ma, X., Li, H., Zhang, W. et al. (2018). Genome of an allotetraploid wild peanut Arachis monticola: A de novo assembly. Giga Science, 7(6), 1–9. [Google Scholar]
14. Bhat, R. S., Shirasawa, K., Sharma, V., Isobe, S., Hirakawa, H. et al. (2021). Population genomics of peanut. In: Rajora, O. P. (Ed.Population genomics. Cham, Switzerland: Springer. [Google Scholar]
15. Chen, X., Lu, Q., Liu, H., Zhang, J. N., Hong, Y. et al. (2019). Sequencing of cultivated peanut, Arachis hypogaea, yields insights into genome evolution and oil improvement. Molecular Plant, 12(7), 920–934. [Google Scholar]
16. Lu, Q., Li, H., Hong, Y., Zhang, G., Wen, S. et al. (2018). Genome sequencing and analysis of the peanut B-genome progenitor (Arachis ipaensis). Frontiers in Plant Science, 9, 604. [Google Scholar]
17. Zhuang, W., Chen, H., Yang, M., Wang, J., Pandey, M. K. et al. (2019). The genome of cultivated peanut provides insight into legume karyotypes, polyploid evolution and crop domestication. Nature Genetics, 51(5), 865–876. [Google Scholar]
18. Beritoli, D. J., Jenkins, J., Clevenger, J., Dudchenko, O., Gao, D. et al. (2019). The genome sequence of segmental allotetraploid peanut Arachis hypogaea. Nature Genetics, 51(5), 877–884. [Google Scholar]
19. Tian, X., Shi, L., Guo, J., Fu, L., Du, P. et al. (2021). Chloroplast phylogenomic analyses reveal a maternal hybridization event leading to the formation of cultivated peanuts. Frontiers in Plant Science, 12, 804568. [Google Scholar]
20. Korlach, J., Bjornson, K. P., Chaudhuri, B. P., Cicero, R. L., Flusberg, B. A. et al. (2010). Real-time DNA sequencing from single polymerase molecules. Methods in Enzymology, 472, 431–455. [Google Scholar]
21. Conesa, A., Götz, S., García-Gómez, J. M., Terol, J., Talón, M. et al. (2005). Blast2GO: A universal tool for annotation, visualization and analysis in functional genomics research. Bioinformatics, 21(18), 3674–3676. [Google Scholar]
22. Au, K. F., Sebastiano, V., Afshar, P. T., Durruthy, J. D., Lee, L. et al. (2013). Characterization of the human ESC transcriptome by hybrid sequencing. PNAS, 110(50), E4821–E4830. [Google Scholar]
23. Kuang, X., Sun, S., Wei, J., Li, Y., Sun, C. (2019). Iso-Seq analysis of the Taxus cuspidata transcriptome reveals the complexity of Taxol biosynthesis. BMC Plant Biology, 19(1), 210. [Google Scholar]
24. Huddleston, J., Ranade, S., Malig, M., Antonacci, F., Chaisson, M. et al. (2014). Reconstructing complex regions of genomes using long-read sequencing technology. Genome Research, 24(4), 688–696. [Google Scholar]
25. Xu, Z., Peters, R. J., Weirather, J., Luo, H., Liao, B. et al. (2015). Full-length transcriptome sequences and splice variants obtained by a combination of sequencing platforms applied to different root tissues of Salvia miltiorrhiza and tanshinone biosynthesis. The Plant Journal, 82(6), 951–961. [Google Scholar]
26. Sharon, D., Tilgner, H., Grubert, F., Snyder, M. (2013). A single-molecule long-read survey of the human transcriptome. Nature Biotechnology, 31, 1009–1014. [Google Scholar]
27. Zhao, X., Li, C., Zhang, H., Yan, C., Sun, Q. et al. (2020). Alternative splicing profiling provides insights into the molecular mechanisms of peanut peg development. BMC Plant Biology, 20(1), 488. [Google Scholar]
28. Zhao, C., He, L., Xia, H., Zhou, X., Geng, Y. et al. (2021). De novo full length transcriptome analysis of Arachis glabrata provides insights into gene expression dynamics in response to biotic and abiotic stresses. Genomics, 113, 1579–1588. [Google Scholar]
29. Chopra, R., Burow, G., Simpson, C. E., Chagoya, J., Mudge, J. et al. (2016). Transcriptome sequencing of diverse peanut (Arachis) wild species and the cultivated species reveals a wealth of untapped genetic variability. G3: Genes Genomes Genetics, 6(12), 3825–3836. [Google Scholar]
30. Bhat, R. S., Shirasawa, K., Chavadi, S. D. (2022). Genome-wide structural and functional features of single nucleotide polymorphisms revealed from the whole genome resequencing of 179 accessions of Arachis. Physiologia Plantarum, 174(1), e13623. [Google Scholar]
Cite This Article
 Copyright © 2023 The Author(s). Published by Tech Science Press.
This work is licensed under a Creative Commons Attribution 4.0 International License , which permits unrestricted use, distribution, and reproduction in any medium, provided the original work is properly cited.
 Downloads
 Citation Tools