
 Submit a Paper
 Propose a Special lssue
 Open Access
ARTICLE

Transcriptome Analysis of Molecular Mechanisms Underlying Phenotypic Variation in Phaseolus vulgaris Mutant ‘nts’
Horticulture Department, College of Advanced Agriculture and Ecological Environment, Heilongjiang University, Harbin, China
* Corresponding Authors: Zhishan Yan. Email: ; Xiaoxu Yang. Email:
Phyton-International Journal of Experimental Botany 2023, 92(11), 2981-2998. https://doi.org/10.32604/phyton.2023.043151
Received 23 June 2023; Accepted 07 August 2023; Issue published 24 October 2023
 View Full Text
 Download PDF
Abstract
The phenotype of a common bean plant is often closely related to its yield, and the yield of plants with reduced height or poor stem development during growth is low. Mutants serve as an essential gene resource for common bean breeding genetic research. Although model plants and crops are studied to comprehend the molecular mechanisms and genetic basis of plant phenotypes, the molecular mechanism of phenotypic variation in common beans remains underexplored. We here used the mutant ‘nts’ as material for transcriptome sequencing analysis. This mutant was obtained through 60Co-γ irradiation from the common bean variety ‘A18’. Differentially expressed genes were mainly enriched in GO functional entries such as cell wall organization, auxin response and transcription factor activity. Metabolic pathways significantly enriched in KEGG analysis included plant hormone signal transduction pathways, phenylpropanoid biosynthesis pathways, and fructose and mannose metabolic pathways. AUX1 (Phvul.001G241500), the gene responsible for auxin transport, may be the key gene for auxin content inhibition. In the plant hormone signal transduction pathway, AUX1 expression was downregulated and auxin transport across the membrane was blocked, resulting in stunted growth of the mutant ‘nts’. The results provide important clues for revealing the molecular mechanism of ‘nts’ phenotype regulation in bean mutants and offer basic materials for breeding beneficial phenotypes of bean varieties.Keywords
Mutants are ideal for studying plant genetics, breeding, gene localization and gene identification. Many studies have made significant contributions to the development and construction of stable mutant populations of economically significant legumes, such as common beans [1–4], soybeans [5], mung beans [6,7], chickpeas [1], black gram [8,9] and faba bean [10]. Most basic theoretical studies on photosynthesis [11] and some metabolic pathways [12] in plants have been conducted using mutant materials as test materials.
Many studies have reported that various factors influence plant stem development, and the most studied factors are hormones [13–16], mainly including auxin, oleuropein lactone and gibberellin. These hormones collectively regulate stem growth and development, and each plant exists in response to multiple signals, and so, a complex network of regulatory mechanisms exists among multiple hormones [17]. Mutation of yuc1D, an important enzyme, inhibited indole-3-acetic acid (IAA) synthesis, resulting in apical dominance loss and a reduction in plant height in Arabidopsis thaliana [18,19]. In the maize brachytic2 (br2) mutant, plant height is reduced, nodal spacing is shortened, and it was found that the reduced IAA content was due to the absence of P-glycoprotein, a polar auxin transport required to regulate stem growth and development [20].
Studies have shown that several plant-dwarfing mutants are associated with the biosynthesis and signal transduction pathways of plant hormones such as gibberellins, brassinosteroid and auxin [21–23]. Plant hormone signal transduction is a crucial response mechanism linking plant internal and external environments and widely regulates the complete process of plant growth and development [24]. The key to plant hormone signaling lies in the activity of its associated transcription factor family, while the hormone-sensing pathway acts on the function of transcription factors. Their interactions act together to regulate plant growth [25]. Auxin is among the most common endogenous plant hormones, the essence of which is IAA. Being an indispensable plant hormone [26], auxin is essential in various biological processes during plant growth and development [27], such as apical dominance, cell division, vascular tissue formation and root hair development [28–30] through auxin-regulated gene expression [31,32]. The auxin response factors auxin/indoleacetic acids (Aux/IAAs), small auxin-up RNAs (SAURs), and GH3s, as well as the key protein component, Aux/IAA protein, play crucial regulatory roles in signal transduction [33].
Gene Ontology (GO) is widely used in the research of bioinformatics data, which can study gene expression, protein interaction and signal transduction of related genes [34]. Generally, GO carries out significant enrichment analysis of gene function from three aspects: molecular function, cell composition and biological process. Kyoto Encyclopedia of Genes and Genomes (KEGG) database is a database that systematically analyzes gene function, linked genome information and functional information, including metabolic pathway database, hierarchical classification database, gene database, genome database, etc [35]. KEGG analysis can better analyze the role of differential genes in metabolic pathways and cell development [36].
The common bean (Phaseolus vulgaris L.) is an annual suberect herb belonging to the genus Phaseolus, native to the Americas, and a major source of plant proteins, minerals and vitamins in many countries. However, reports on mutants of common beans are rare. In this study, we sequenced and analyzed the material of ‘nts’, a mutant of navy bean, through transcriptome sequencing. The differentially expressed genes (DEGs) of plant hormone signal transduction pathways in ‘nts’ and ‘A18’ were significantly different. In particular, many DEGs were observed for the auxin signal transduction pathway. To explore excellent germplasm resources to facilitate agricultural production, the DEGs were analyzed to understand the mechanism of strain variation in the common bean mutant. Our results offer valuable information for identifying candidate genes and understanding the molecular mechanism of strains of the common bean mutant ‘nts’.
The test materials were the wild-type common bean variety ‘A18’ and common bean mutant ‘nts’. The wild-type test material was provided by the Crop Research Institute of Heilongjiang University, China. The growth habit of this variety is limited growth type, early maturing, and light green stem skin and leaf veins of the plant. The flowers are pinkish-white. The pods are round and slightly curved, with an average pod length of 15 cm. The green young pod epidermis gradually turns yellow during ripening, and the ripening period is 50–55 days [37]. In total, 2500 seeds of the wild-type variety were selected and subjected to 60Co-γ irradiation at the Institute of Technical Physics, Heilongjiang Academy of Sciences. The radiation intensity was 0.1 Gy·min−1, and the radiation dose was 126 Gy [37]. The irradiated M1 seeds were sown in Hainan in November 2017, and the M2 generation was harvested, which was named ‘nts’ (normal to slim). The main and apex stems of ‘A18’ and ‘nts’ were selected for sampling at the initial flowering stage (when the growth reaches about 30 days), the main and apical stems of the same parts of ‘A18’ and ‘nts’ were selected for sampling, and the stem histology was observed through paraffin-embedded cross-sections [38–40]. After the materials were fixed, dehydrated, transparent, dipped in wax and embedded, the slices were sectioned. After the treated slices were invaded by xylene, stained in 1% safranin aqueous solution, and finally observed by microscope (Olympus BX60 Multifunctional Microscope, Olympus Corporation, Japan).
Wild type ‘A18’ and mutant ‘nts’ were crossed to artificial forward and reverse hybridization, and F1 seeds were harvested in September 2019. The F1 generation was self-fertilized to harvest the F2 generation. F2, back-cross one (BC1), and back-cross two (BC2) generation seeds were harvested in June 2020. In July 2020, the seedlings were planted in the greenhouse of Hulan Campus of Heilongjiang University. The ‘nts’ mutant and ‘A18’ (accession no. P19040) are available from the Crop Research Institute of Heilongjiang University.
The experimental materials were row planted in an incubator (25°C) in the laboratory of Heilongjiang University in October 2020 vermiculite and soil were mixed in pots at a ratio of 1:3, with one seedling per pot and 10 plants of each variety. The photoperiod was 14 h/10 h (day and night). The apical stem parts of the two varieties in the first flowering were taken separately and quickly stored in liquid nitrogen. Three samples from three plants from each variety were taken at the same time. Tissue samples were sent to Lianchuan Biologicals in Hangzhou, China (http://www.lc-bio.com/) for library construction, quality control and transcriptome sequencing.
The unwanted original reads, including joint readings, readings with unknown bases greater than 10%, and low-quality reads, were eliminated from the raw data obtained through sequencing. Then, the reads were compared with the reference genome (https://phytozome-next.jgi.doe.gov/info/Pvulgaris_v2_1), and the sample RNA was isolated and purified. The quality of RNA was determined through 1% agarose gel electrophoresis.
Gene expression level analysis focuses on protein-coding genes (mRNA) for genome annotation. Differences in gene expression were analyzed using Fragments Per Kilobase Million (FPKM) values. Genes with an expression level of log2 ≥ 2 or ≤−2 and p value ≤ 0.05 were labeled as significantly differentially expressed. Comparisons were made to the common bean database to obtain information about the position on the reference genome or gene. The reference genome (common bean data base) was compared using Hisat on the valid data after pre-processing.
2.4 Annotation and Classification of Gene Function
The apical stem samples of ‘A18’ and ‘nts’ were labeled as A18 and ‘nts’, respectively. The GO enrichment analysis first compared all DEGs with the GO database, and then, the number of differentially expressed genes in each GO item was calculated. The GO enrichment analysis of DEGs was performed to clarify the main biological functions of the DEGs. KEGG is the main public database on Pathways, and Pathway significant enrichment analysis was performed using KEGG Pathway as the unit and applying hypergeometric tests to identify Pathways significantly enriched in significantly differentially expressed genes compared to the entire genome (p value ≤ 0.05).
2.5 qRT-PCR Validation of DEGs
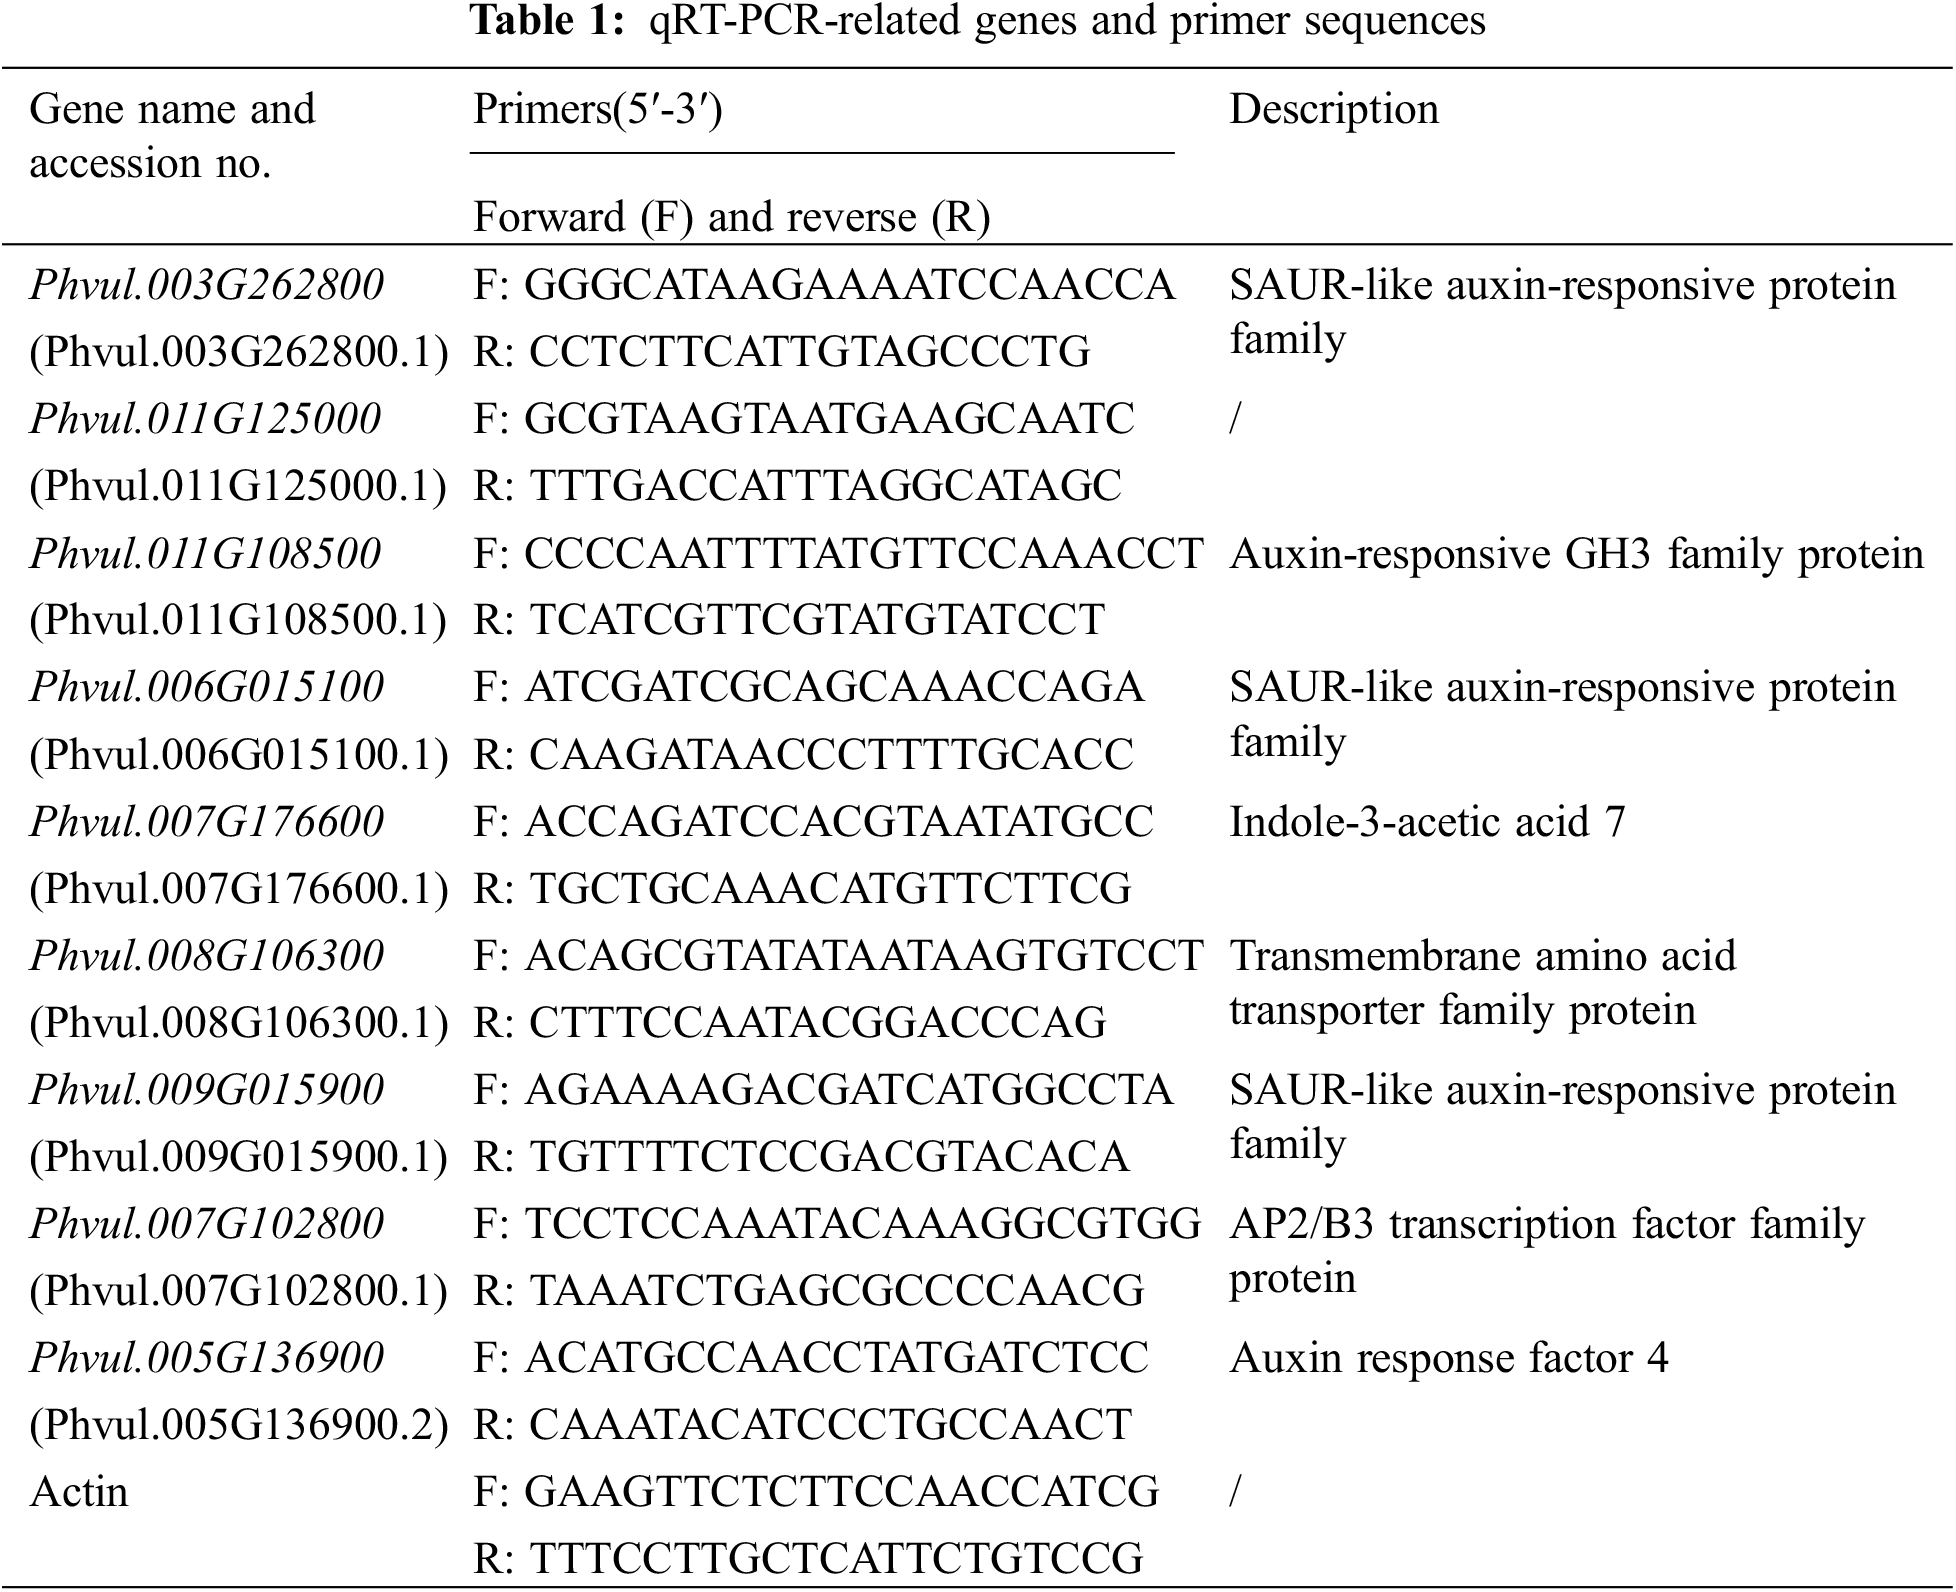
RNA from the ‘nts’ and ‘A18’ apical stems at the first flowering stage was the Lianchuan Biologicals’ return sample, and the bands were relatively clear after detection through electrophoresis, which indicated that the RNA was well preserved. The RNA obtained was reverse-transcribed using a commercial kit (Vazyme Biotech, Nanjing, China) to obtain first-strand cDNA. Nine DEGs were selected randomly from the transcriptome data and compared with the database of common bean to find the corresponding homologous genes. Then, the CDS sequences of the aforementioned genes were downloaded. These CDS sequences were used as a template for designing fluorescent primers by using Oligo7 software (https://www.oligo.net/downloads.html). The cDNA obtained through reverse transcription was used as a template to verify the expression of the aforementioned genes by using a real-time fluorescence quantitative PCR kit (Vazyme Biotech, Nanjing, China). The internal reference gene was actin, and the names of the genes and the primer sequences are listed in Table 1 (https://phytozome-next.jgi.doe.gov/info/Pvulgaris_v2_1). The real-time fluorescence quantitative PCR (Serial No. MY17295272, Agilent Technologies, USA) procedure was as follows: 95°C, 3 min (hot start reaction system); 95°C, 3 s; 60°C, 15 s; 95°C, 30 s (dissolution curve reaction system); 65°C, 30 s; 95°C, 30 s.
The reference genome is P. vulgaris v2.1 (https://phytozome-next.jgi.doe.gov/info/Pvulgaris_v2_1). The figures were visualized using Omic Studio (https://www.omicstudio.cn/index) and Photoshop 2017.
3.1 Phenotypic Identification of Common Bean Mutants
At the first flowering stage of common beans (i.e., when they have grown to approximately 30 days), compared with the wild-type ‘A18’, the ‘nts’ exhibited overall semi-dwarfism, fewer branches, significantly thinner terminal stems, smaller overall plant width, reduced number and area of leaves, and weaker growth phenotypic characteristics (Figs. 1 and 2).
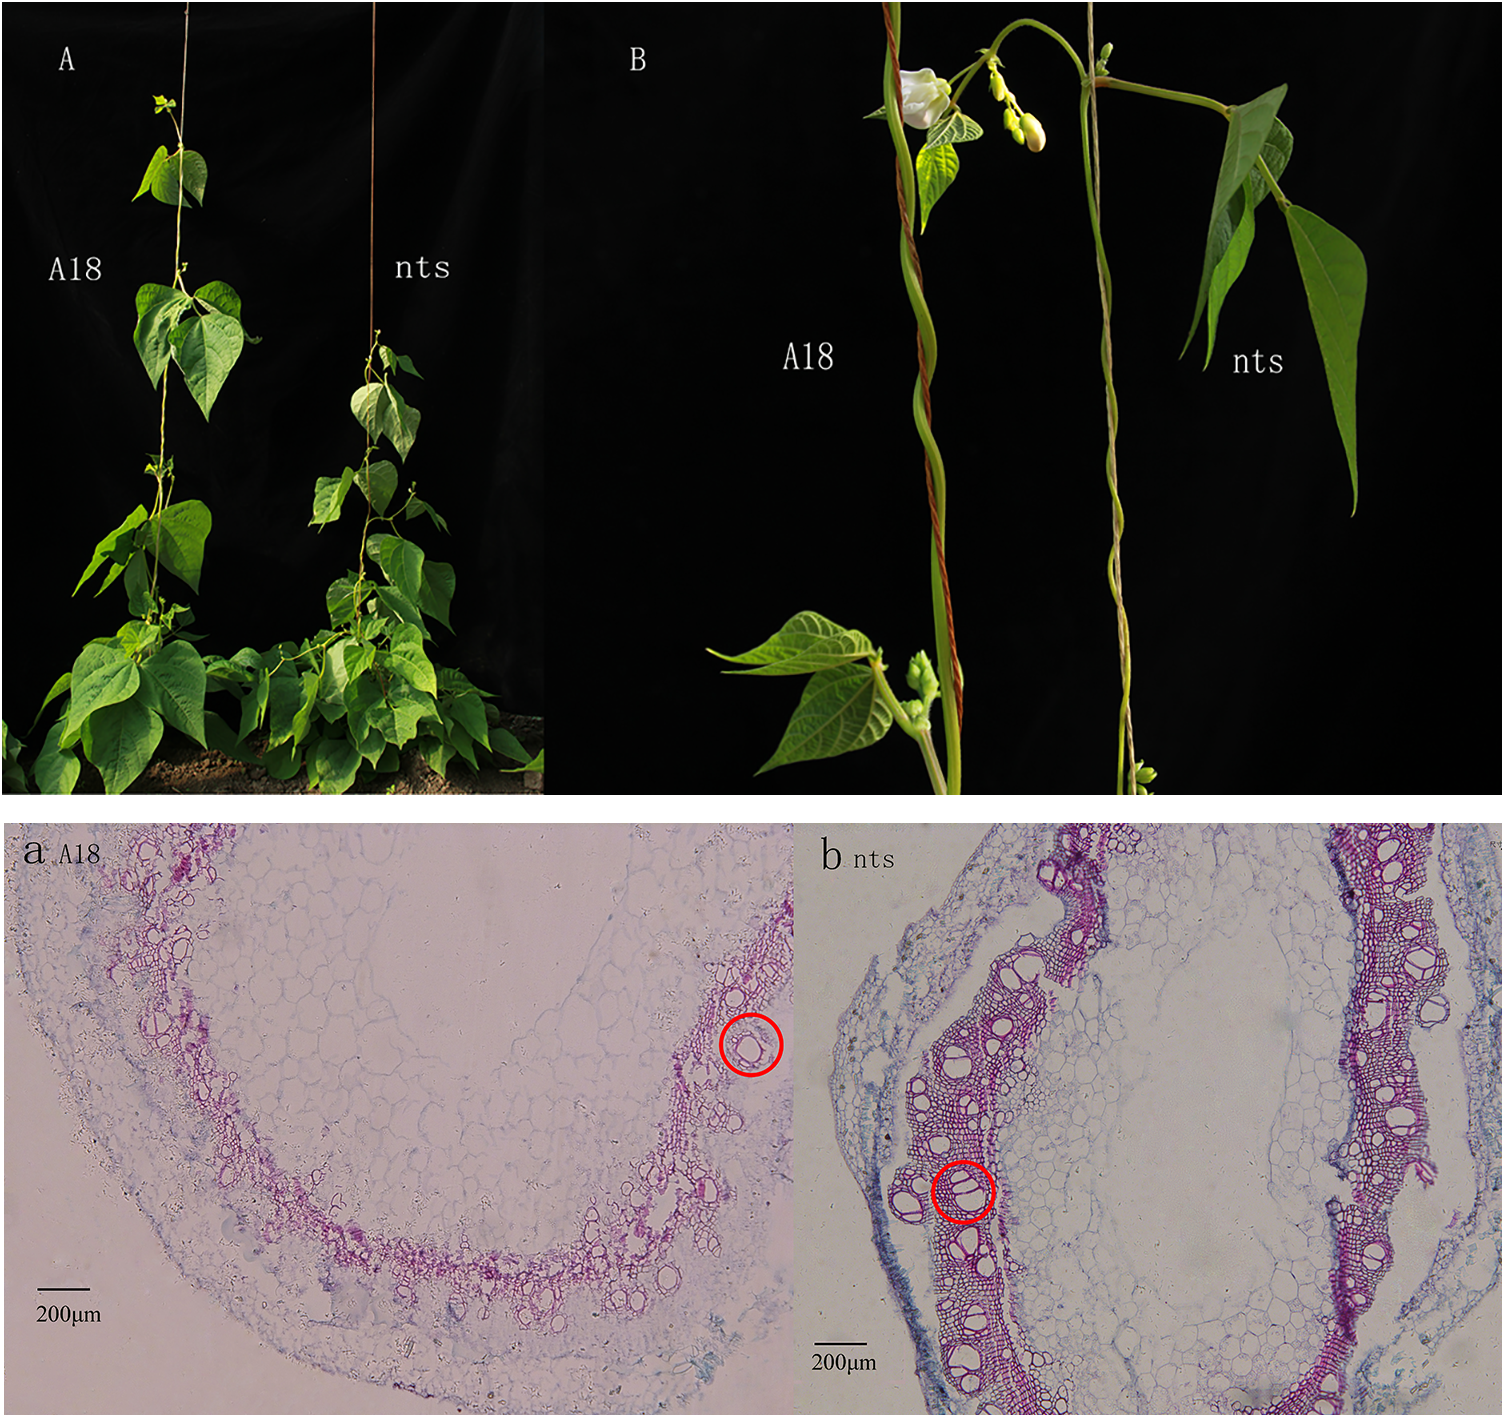
Figure 1: Comparison of growth differences between the wild-type ‘A18’ and the mutant ‘nts’ (A, B); Comparison of microstructural differences between the wild-type and mutant main stems (a, b)
Note: Samples were taken at the initial flowering stage (about 30-day-old plants). Compared with the wild-type ‘A18’, the plant height of the mutant ‘nts’ was lower by 22.2 cm. With plant growth and development, the difference in plant height became more obvious, and the overall number of plant nodes was by 1 node less on average. The diameter of the main stem in the mutant was approximately 0.61 mm less than that of ‘A18’, and ‘nts’ plants had two branches less on average (A, B); Compared with ‘A18’, the diameter of the pith cells in main stem of ‘nts’ was reduced by approximately 11.23 μm, and the number of pith cells was significantly reduced. The pith cells of the wild type were arranged more neatly and tightly than those of the ‘nts’ (a, b). Pith cells are shown in red circles.
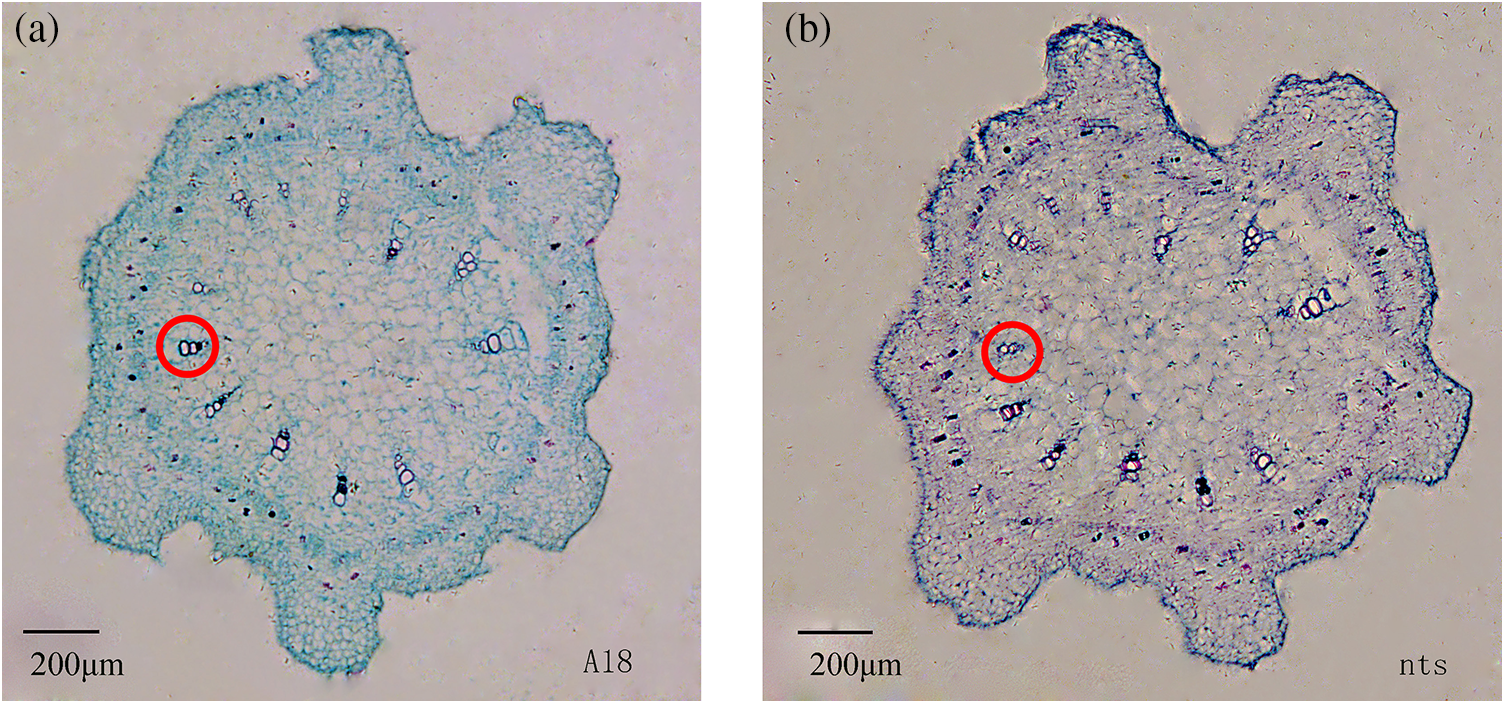
Figure 2: Cross-section of ‘A18’ top stem apex (a) and ‘nts’ top stem apex (b) at the first flowering stage (i.e., when they have grown to approximately 30 days)
Note: The diameter of pith cells in top stem of ‘nts’ was 2.68 μm less than that in the wild type ‘A18’.
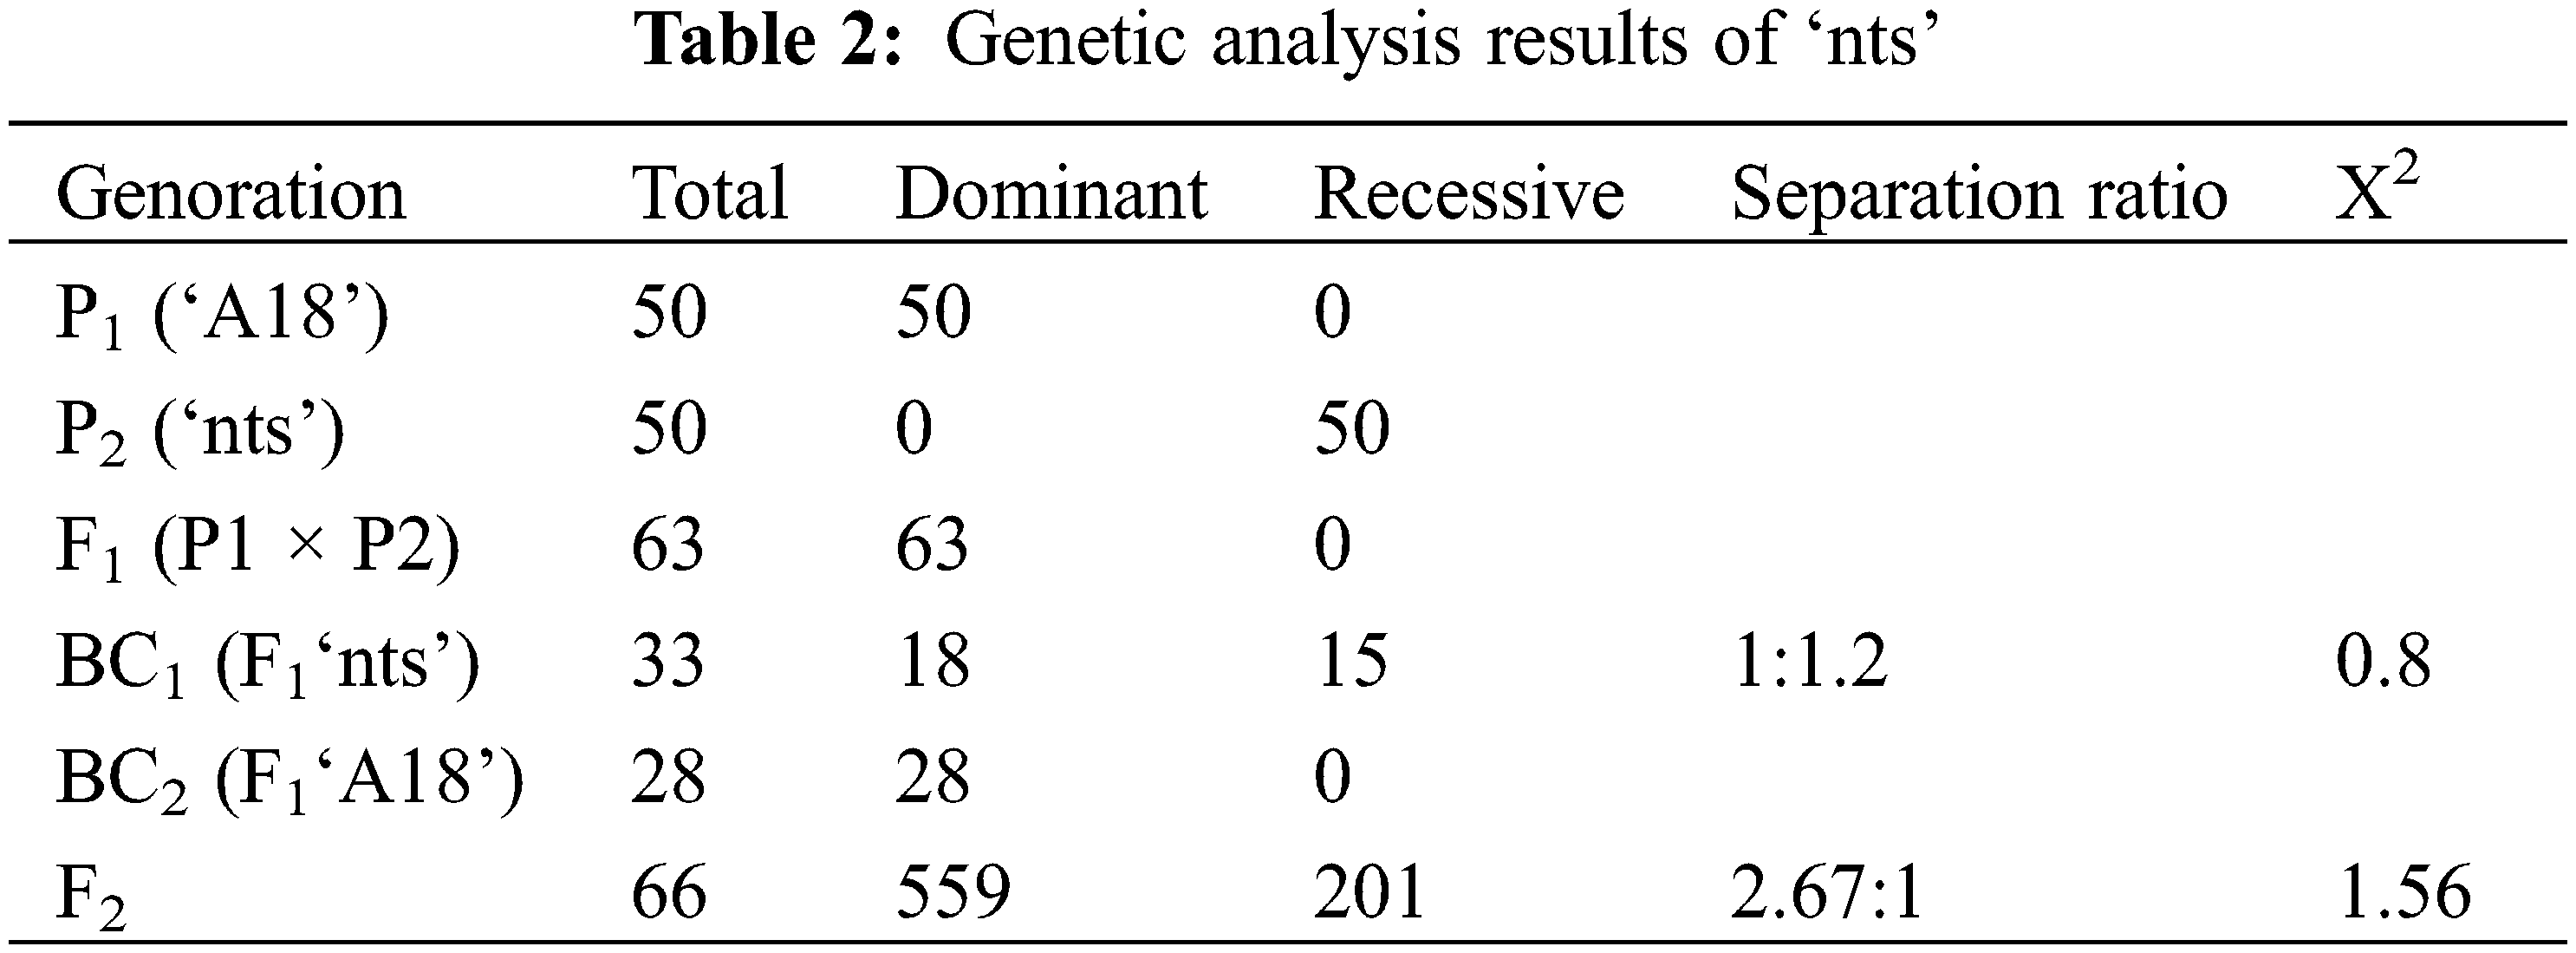
The wild-type ‘A18’ was crossed with the mutant ‘nts’, orthogonally reversed, and 63 seeds of the F1 generation were harvested. All F1 generation plants exhibited a normal phenotype of thick stems. The F1 generation was self-inbred to obtain the F2 generation. Of the F2 generation plants, 557 plants had thick stem phenotypes and 209 plants had thin stem phenotypes, (χ2 = 1.56, χ20.05(1) = 3.84, χ2 < 3.84), which conformed to Mendel’s laws of mono hybrid inheritance. The F1 generation was backcrossed with ‘nts’ and ‘A18’, and the segregation ratio of BC1 normal and thin stem phenotypes was 1:1 and BC2 had a normal phenotype (Table 2). Therefore, inheritance was judged to be a single-gene stealth inheritance mode.
3.2 Quality Analysis and Quality Control of Transcriptome Sequencing
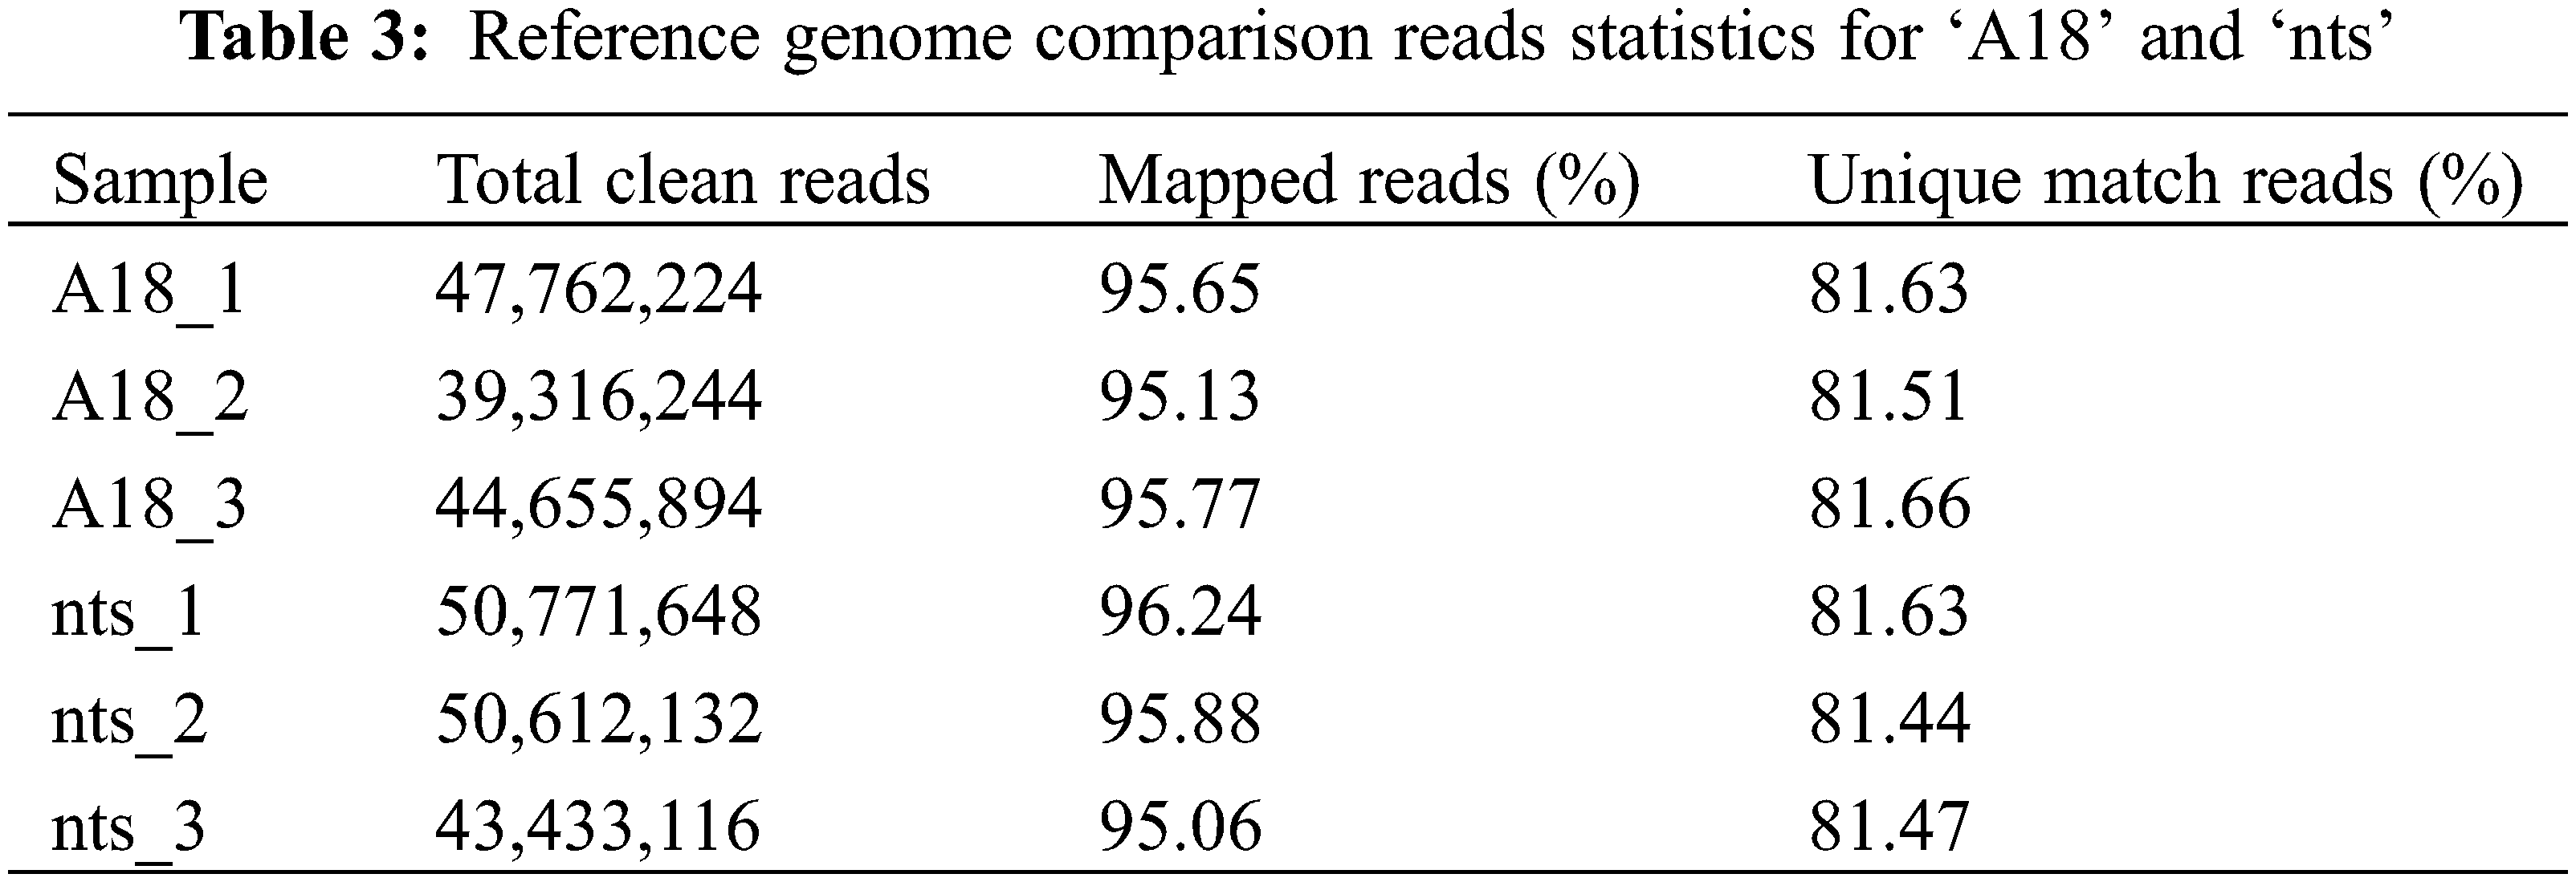
After the junction, contamination and low-quality sequences were removed, 131,734,362 and 144,816,896 clean reads were obtained from three biological replicates of ‘A18’ and ‘nts’, respectively. The comparison results (Table 3) revealed that the proportion of ‘nts’ and ‘A18’ reads comparable to the reference genomic reads was 95.13%–96.24%, and the percent of unique comparisons to the reference sequence was 81.44%–81.66%. The quantity and quality of sequencing data were good and can be used for subsequent sequence assembly and analysis.
3.3 Gene Correlation Analysis between Common Bean Mutant and Wild-Type
In genomic studies, correlation heatmaps can accurately present the relationship between samples. The larger the correlation coefficient between samples, the better the clustering of samples. As shown in Fig. 3, the correlation coefficient of gene expression levels between three biological replicates of the wild-type was maximum 0.963 and minimum 0.742, and that of the mutant was maximum 0.961 and minimum 0.813. This indicated that the samples were well replicated. The correlation coefficient between the wild type and mutant was maximum 0.839 and minimum 0.745, which indicated the samples were clustered well. The expression density map of ‘A18’ and ‘nts’ was prepared using log10 (FPKM), as shown in Fig. 4. The gene expression levels of the six samples were normally distributed, with most of the genes expressed in the range of –2.5 to 2.5.
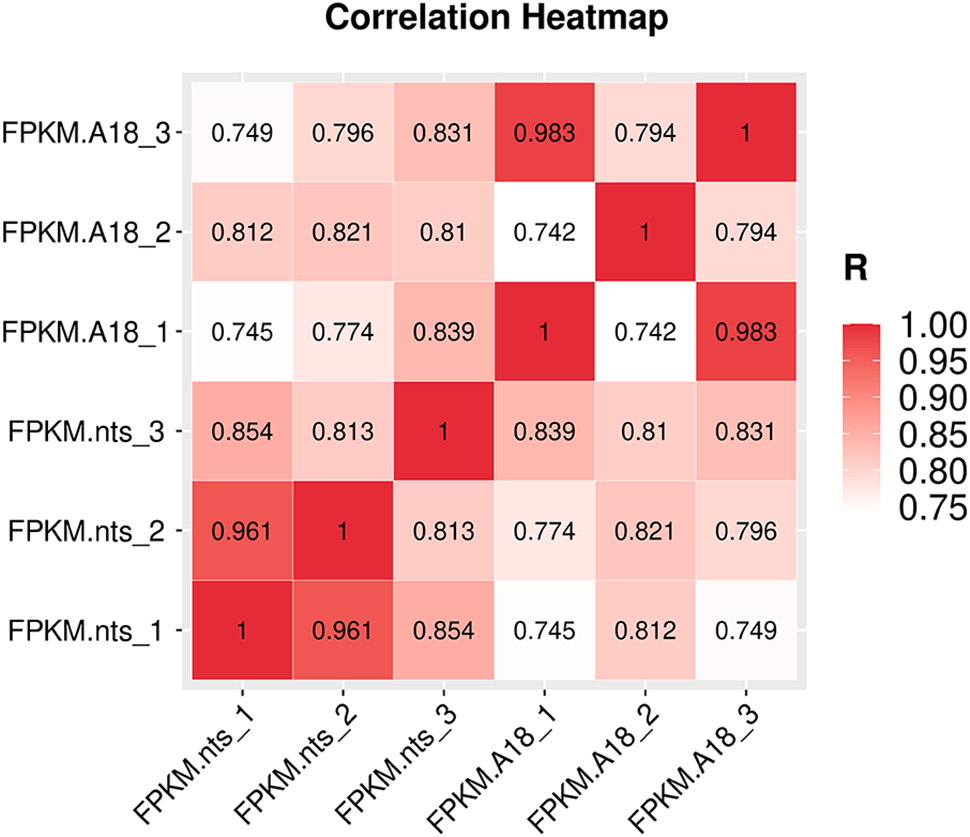
Figure 3: Correlation heatmaps of gene expression levels in ‘A18’ and ‘nts’ samples
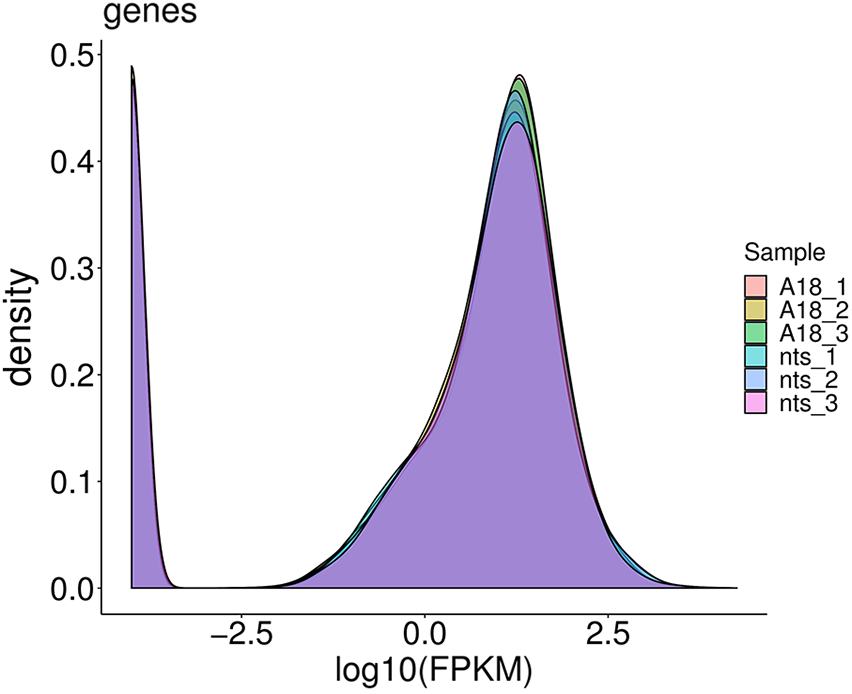
Figure 4: Expression abundance plot between ‘A18’ and ‘nts’ samples. The non-overlapping part indicates differentially expressed genes
3.4 Screening and Statistics of DEGs
Compared with the wild-type ‘A18’, the number of downregulated DEGs was significantly higher than that of upregulated DEGs in the mutant ‘nts’. Among 2906 DEGs, 1168 were upregulated and 1738 genes were downregulated. These results indicated that the expression of some genes was suppressed in the mutant plants. The DEGs provide clues about the dwarfism-related genes in common bean and can help us to better explore the mechanism of dwarfism in common bean.
3.5 GO Enrichment Pathway Analysis of DEGs
As shown in Fig. 5, the DEGs in ‘A18’ vs. ‘nts’ were annotated into three categories: biological processes, cellular components and molecular functions. The DEGs were mainly enriched in the category of biological processes, with less enrichment in molecular functions. The analysis revealed that the biological processes associated with the DEGs were mainly focused on response to auxin (GO:0009733) and cell wall organization (GO:0071555). The cellular components mainly associated with the DEGs were the plasma membrane (GO:0005886) and the integral component of the membrane (GO:0016021), and the molecular functions mainly associated with the DEGs were transcription factor activity, sequence-specific DNA binding (GO:0003700) and carboxylic ester hydrolase activity (GO:0052689).
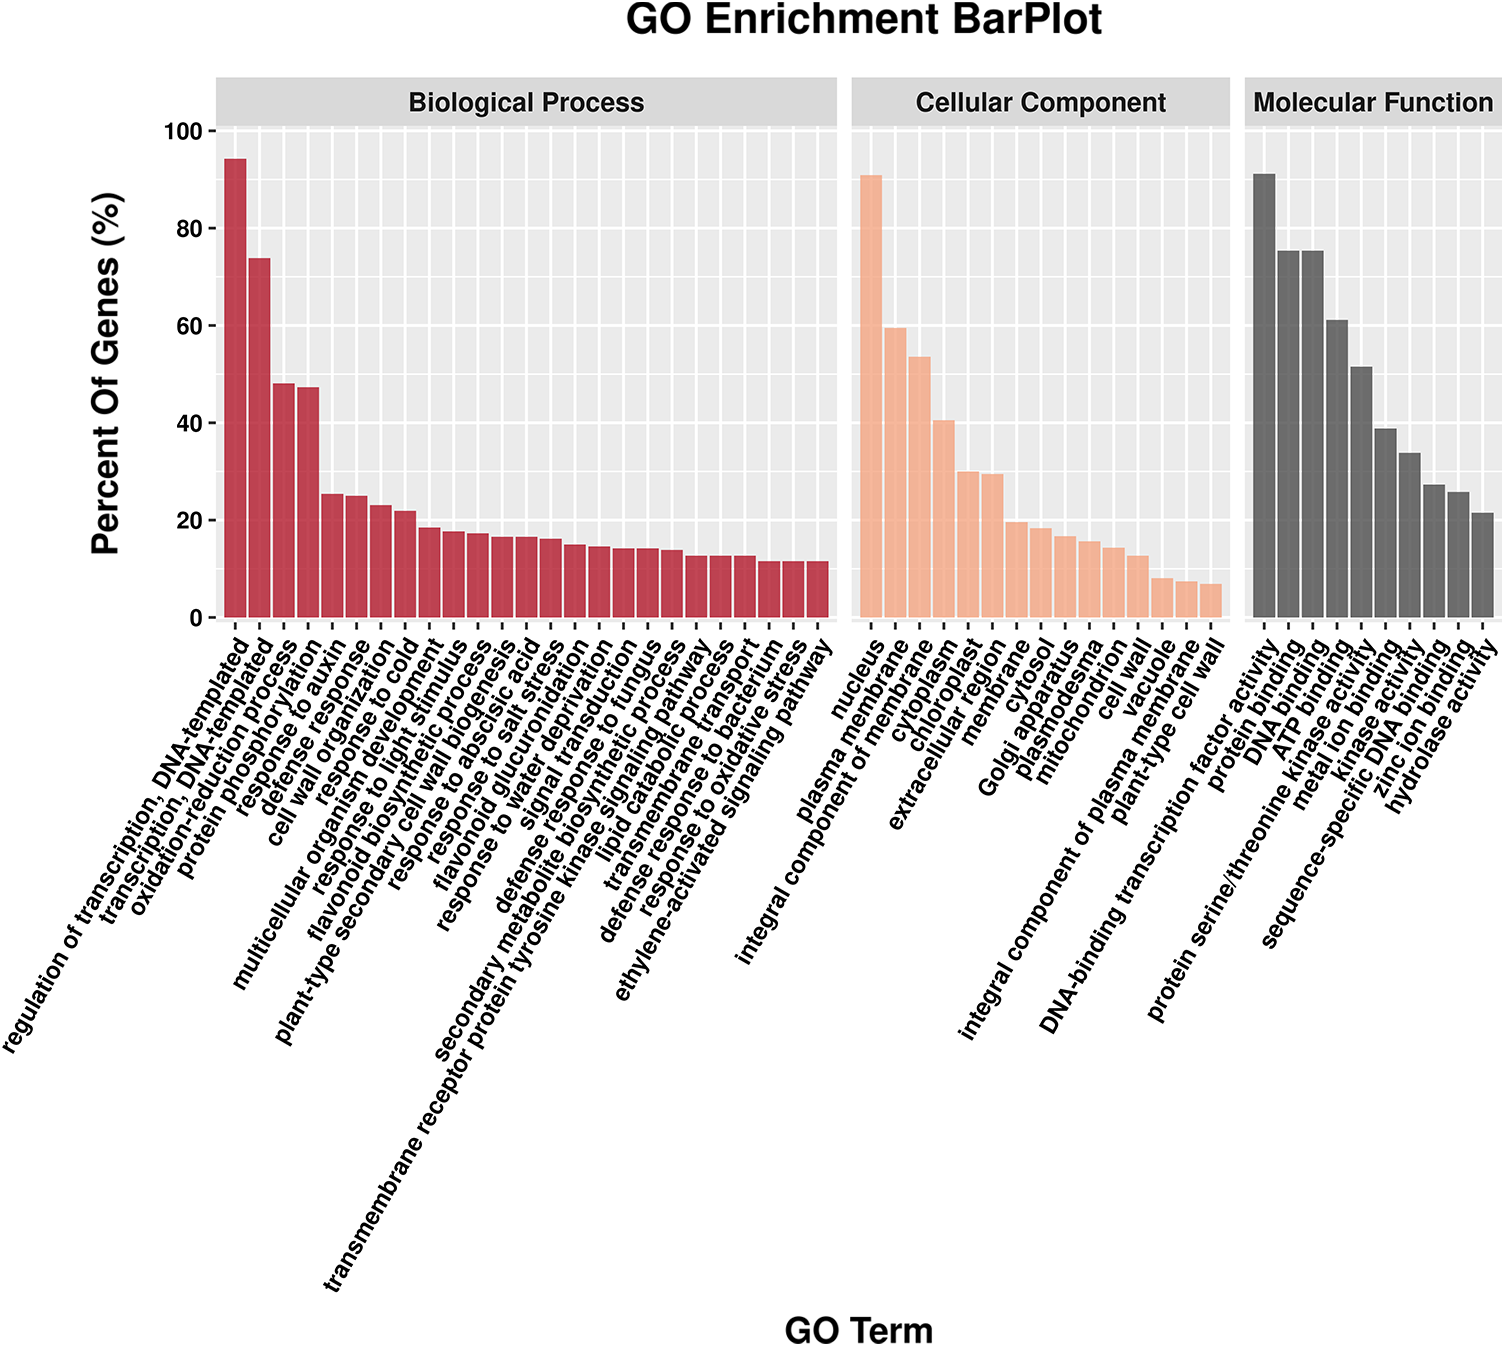
Figure 5: GO functional enrichment analysis for DEGs. The results are summarized for the three main GO categories: biological process, cellular component, and molecular function. A threshold of the p value ≤ 0.05 was used to judge the significantly enriched GO terms in the DEGs
Note: According to the number of DEGs annotated in the three functional categories, the GO_terms of Top25, Top15 and Top10 were selected in descending order from more to less, and the legend was drawn by Lianchuan Omic studio.
3.6 KEGG Enrichment Pathway Analysis
To investigate internal differences in the expression patterns of related genes, RNA-Seq data from the wild-type ‘A18’ and the mutant ‘nts’ were mapped to KEGG pathways. Fig. 6 shows the first 20 pathways with the lowest Q value in the enrichment analysis of DEGs in the KEGG pathway. The KEGG pathway analysis revealed 791 DEGs annotated to corresponding metabolic pathways. Among them, 99 DEGs were enriched in the plant hormone signal transduction pathway (ko04075), accounting for 12.51% of the total DEGs, followed by 48 DEGs enriched in the phenylpropanoid biosynthesis pathway (ko00940). Twenty genes were enriched in the fructose and mannose metabolism pathway (ko00051), and 17 genes were enriched in stilbenoid, diarylheptanoid and gingerol biosynthesis (ko00945). The most enriched pathway for DEGs in the ‘A18’ vs. ‘nts’ group was plant hormone signal transduction.
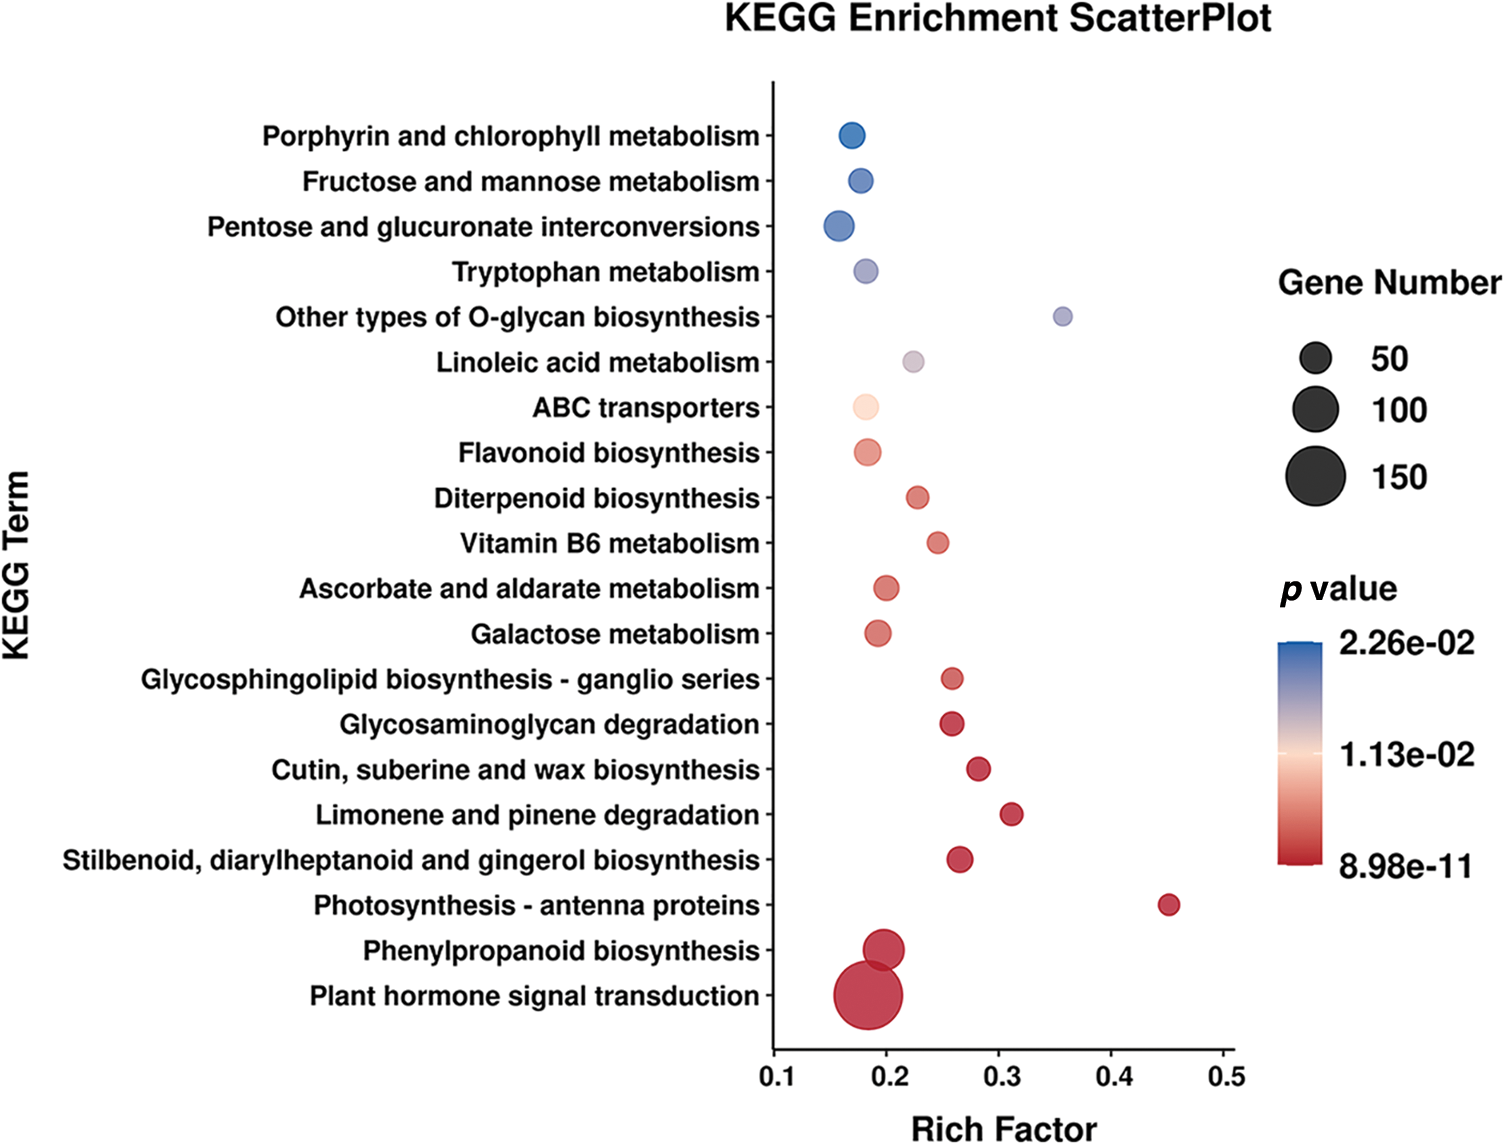
Figure 6: The top 20 enriched KEGG pathways of DEGs between ‘A18’ and ‘nts’
Note: The KEGG enrichment analysis scatter plot was based on the significance of enrichment (p value) of the Top20 pathway, and visualization was done via Lianchuan Omic studio (https://www.omicstudio.cn/index).
3.7 Differential Expression of Genes Related to the Hormone Transduction Pathway
In the enrichment of the KEGG pathway, the DEGs were significantly enriched in the plant hormone signal transduction pathway, indicating that the phenotypic variation of mutants was closely related to plant hormone levels and that the hormone signal transduction pathway played a critical role in this variation. The results showed that gene expression in the plant hormone signal transduction pathway, especially the auxin signal transduction pathway, changed significantly in the mutant ‘nts’ during the early flowering stage. The expression of AUX1 (Phvul.001G241500), a key gene in the plant hormone signal transduction pathway, was downregulated. The expression of the genes encoding ARFs (Auxin response factor), a key family of transcription factors, was significantly downregulated. At the mRNA level, the expression trends of SAUR, GH3, and Aux/IAA transcriptional repressors, which are regulated by ARF downstream, changed. Most genes in the SAUR family were upregulated, whereas a few were down-regulated. The genes of the GH3 family, such as Phvul.005G106500, Phvul.011G108500, and Phvul.011G113000, were upregulated. In the Aux/IAA family, the expression of some genes was upregulated, such as IAA14 (Phvul.001G156600), IAA13 (Phvul.003G167700), IAA19 (Phvul.005G172900), IAA7 (Phvul.007G176600) and IAA8 (Phvul.010G147200), whereas that of phytochrome-associated protein 2 (Phvul.002G311500), IAA31 (Phvul.003G124600), IAA27 (Phvul.004G166400), IAA8 (Phvul.009G146000) was downregulated. In the cytokinin signal transduction pathway, the gene expression of CRE1 (Phvul.003G015500) was significantly downregulated at the early flowering stage, and the expression of AHP, B-ARR and A-ARR decreased significantly. The expression of transcription factors in the downstream part of the gibberellin pathway also changed; two of the genes were upregulated and one was downregulated. The expression of TCH4 (Phvul.003G147300), which is involved in the cell growth process during oleuropein lactone transduction, was significantly downregulated. The DEGs enriched in the biosynthetic and metabolic pathways of auxin, cytokinin, gibberellin, and brassinosteroid were analyzed those clustering, and the gene expression levels were calculated using the FPKM method to determine the significant changes in gene expression in the mutants. As shown in Fig. 7, the result indicated that the genes AUX1, IAA14, IAA7, and IAA19 involved in the auxin signal transduction pathway exhibited significant changes.
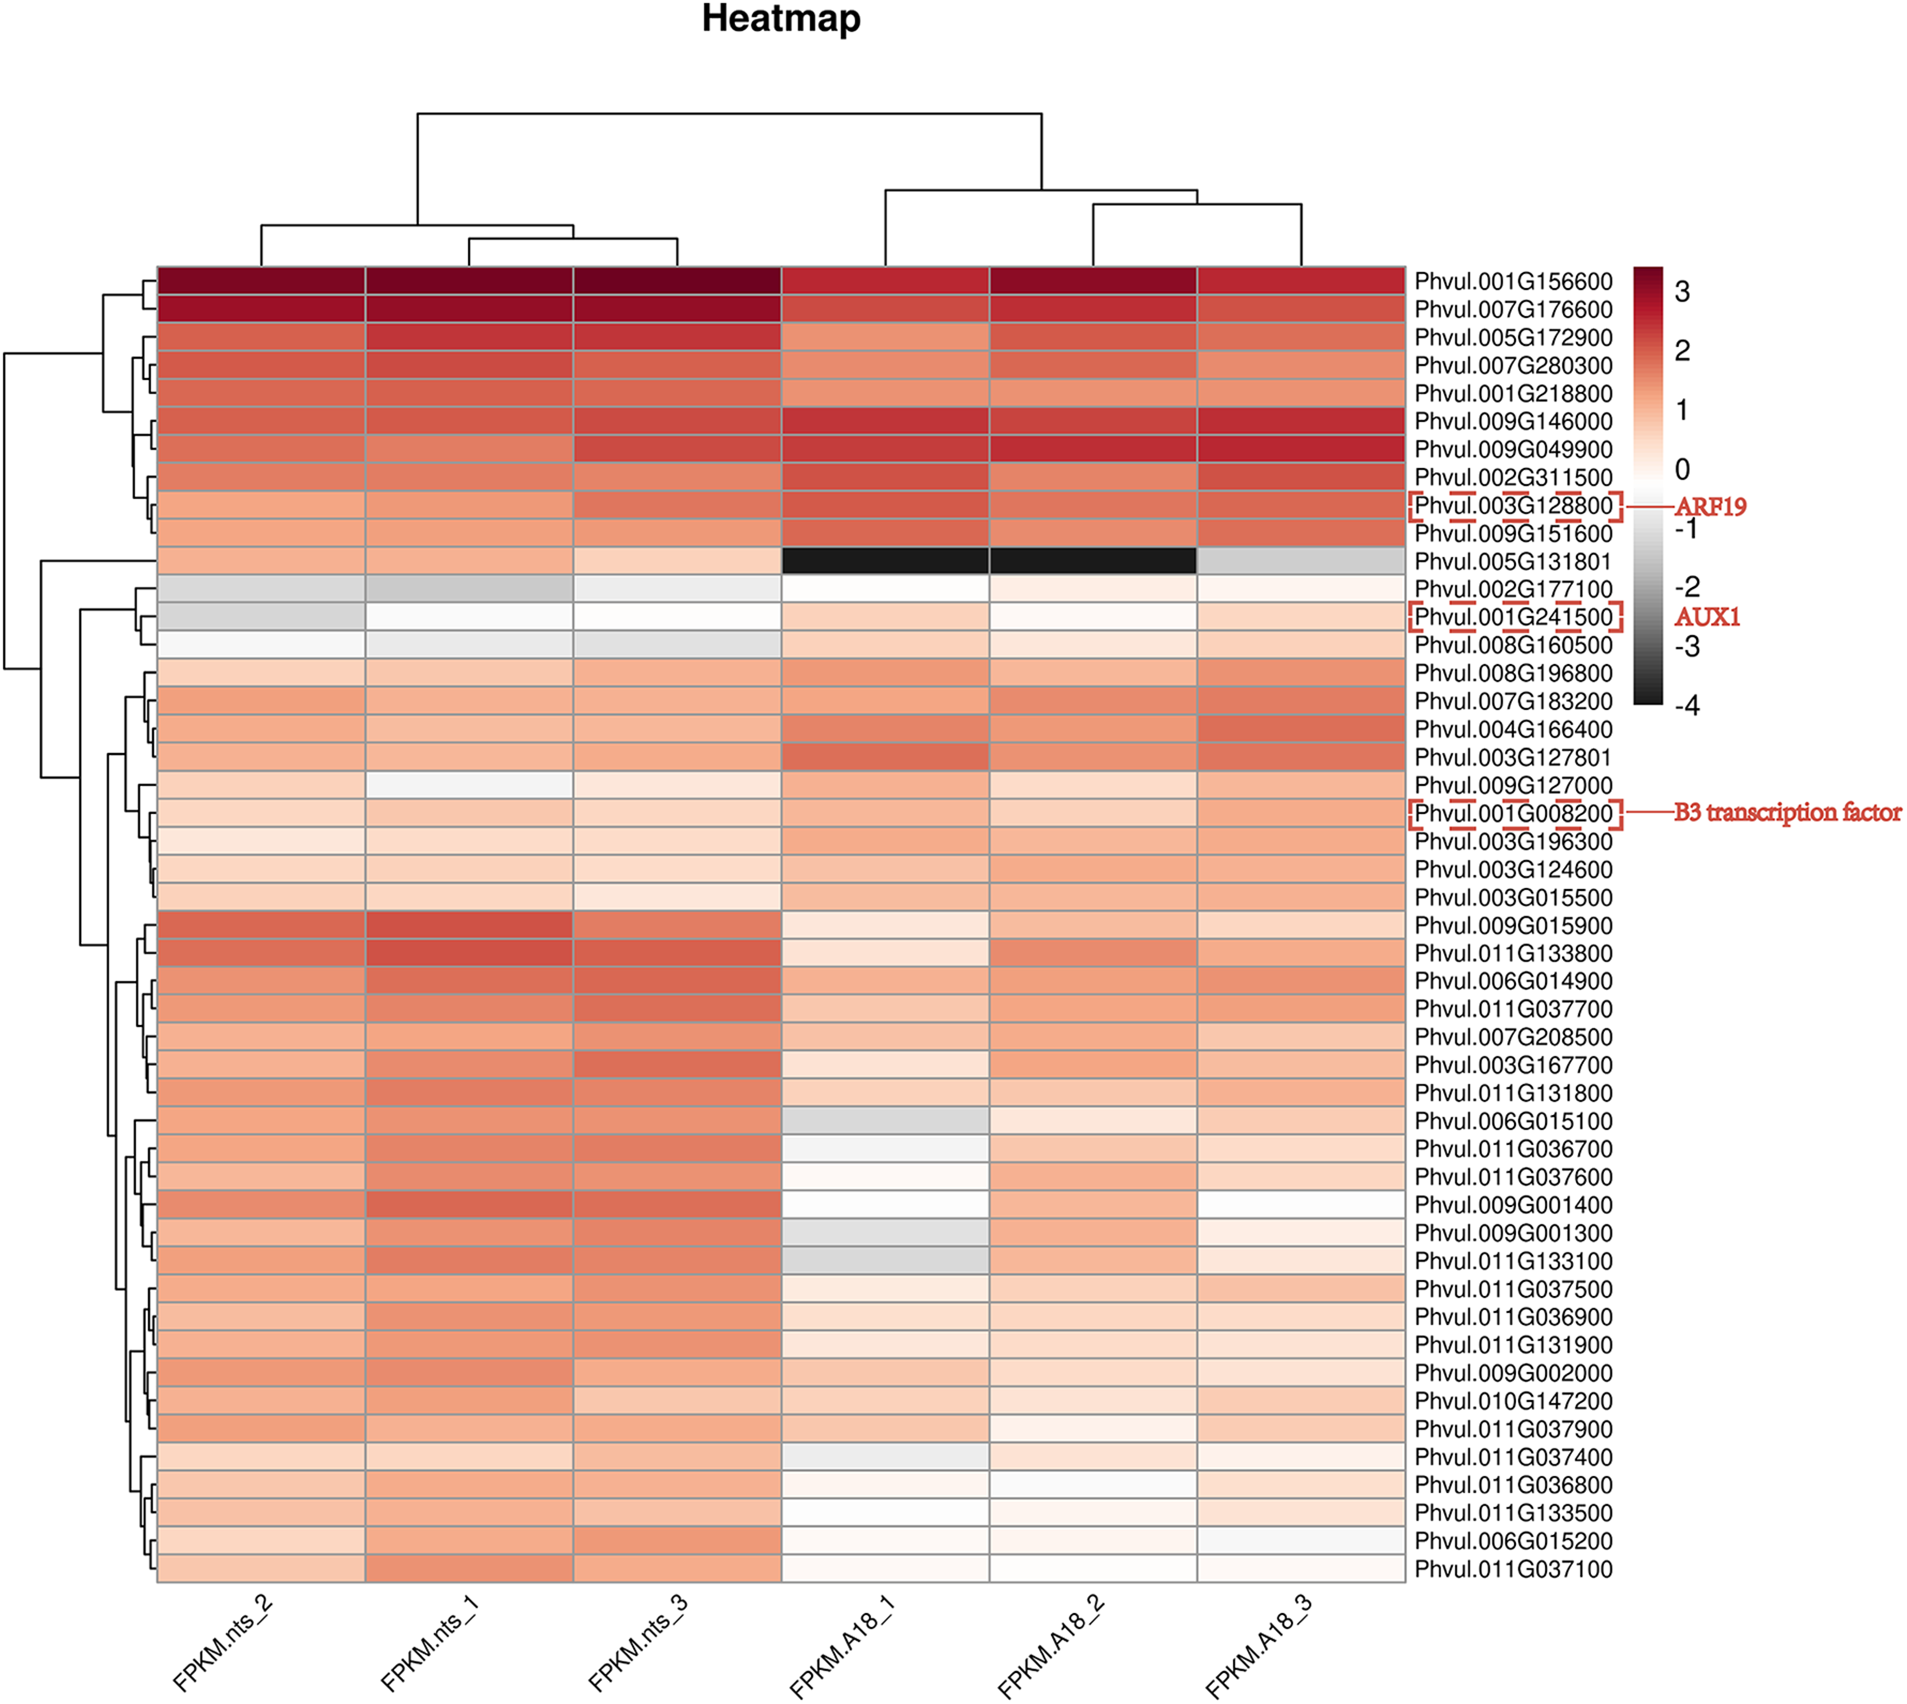
Figure 7: Heatmap of differential gene expression between the mutant ‘nts’ and wild-type ‘A18’. The numbers represent the log10 (fold change) value. The red and gray colors represent low-to-high expression levels
Notably, transcriptome sequencing revealed that the expression of AUX1 (Phvul.001G241500), a key gene responsible for auxin transport, was downregulated in the auxin signaling pathway (Fig. 8). We hypothesized that downregulation of AUX1 expression, auxin transport was hindered, resulting in a reduced auxin concentration in the mutant plant cells. In the auxin signaling mode, when cell auxin concentrations are at low, Aux/IAA binds to ARF to become dimeric Aux/IAA-ARF, and the active role of ARFs is inhibited. Only when the auxin concentration is increased to a certain level, the inhibitory effect of the Aux/IAA protein on ARFs is released and a series of auxin responses are reactivated by ubiquitin-activating enzyme E1, ubiquitin-binding enzyme E2, and ubiquitin ligase E3 enzymes. The key ARF-related genes, Phvul.001G008200 (B3 transcriptional factor) and ARF19, are significantly downregulated in ‘nts’, indicating that ARF regulation is inhibited, which also coincides with the hindrance of auxin transport.
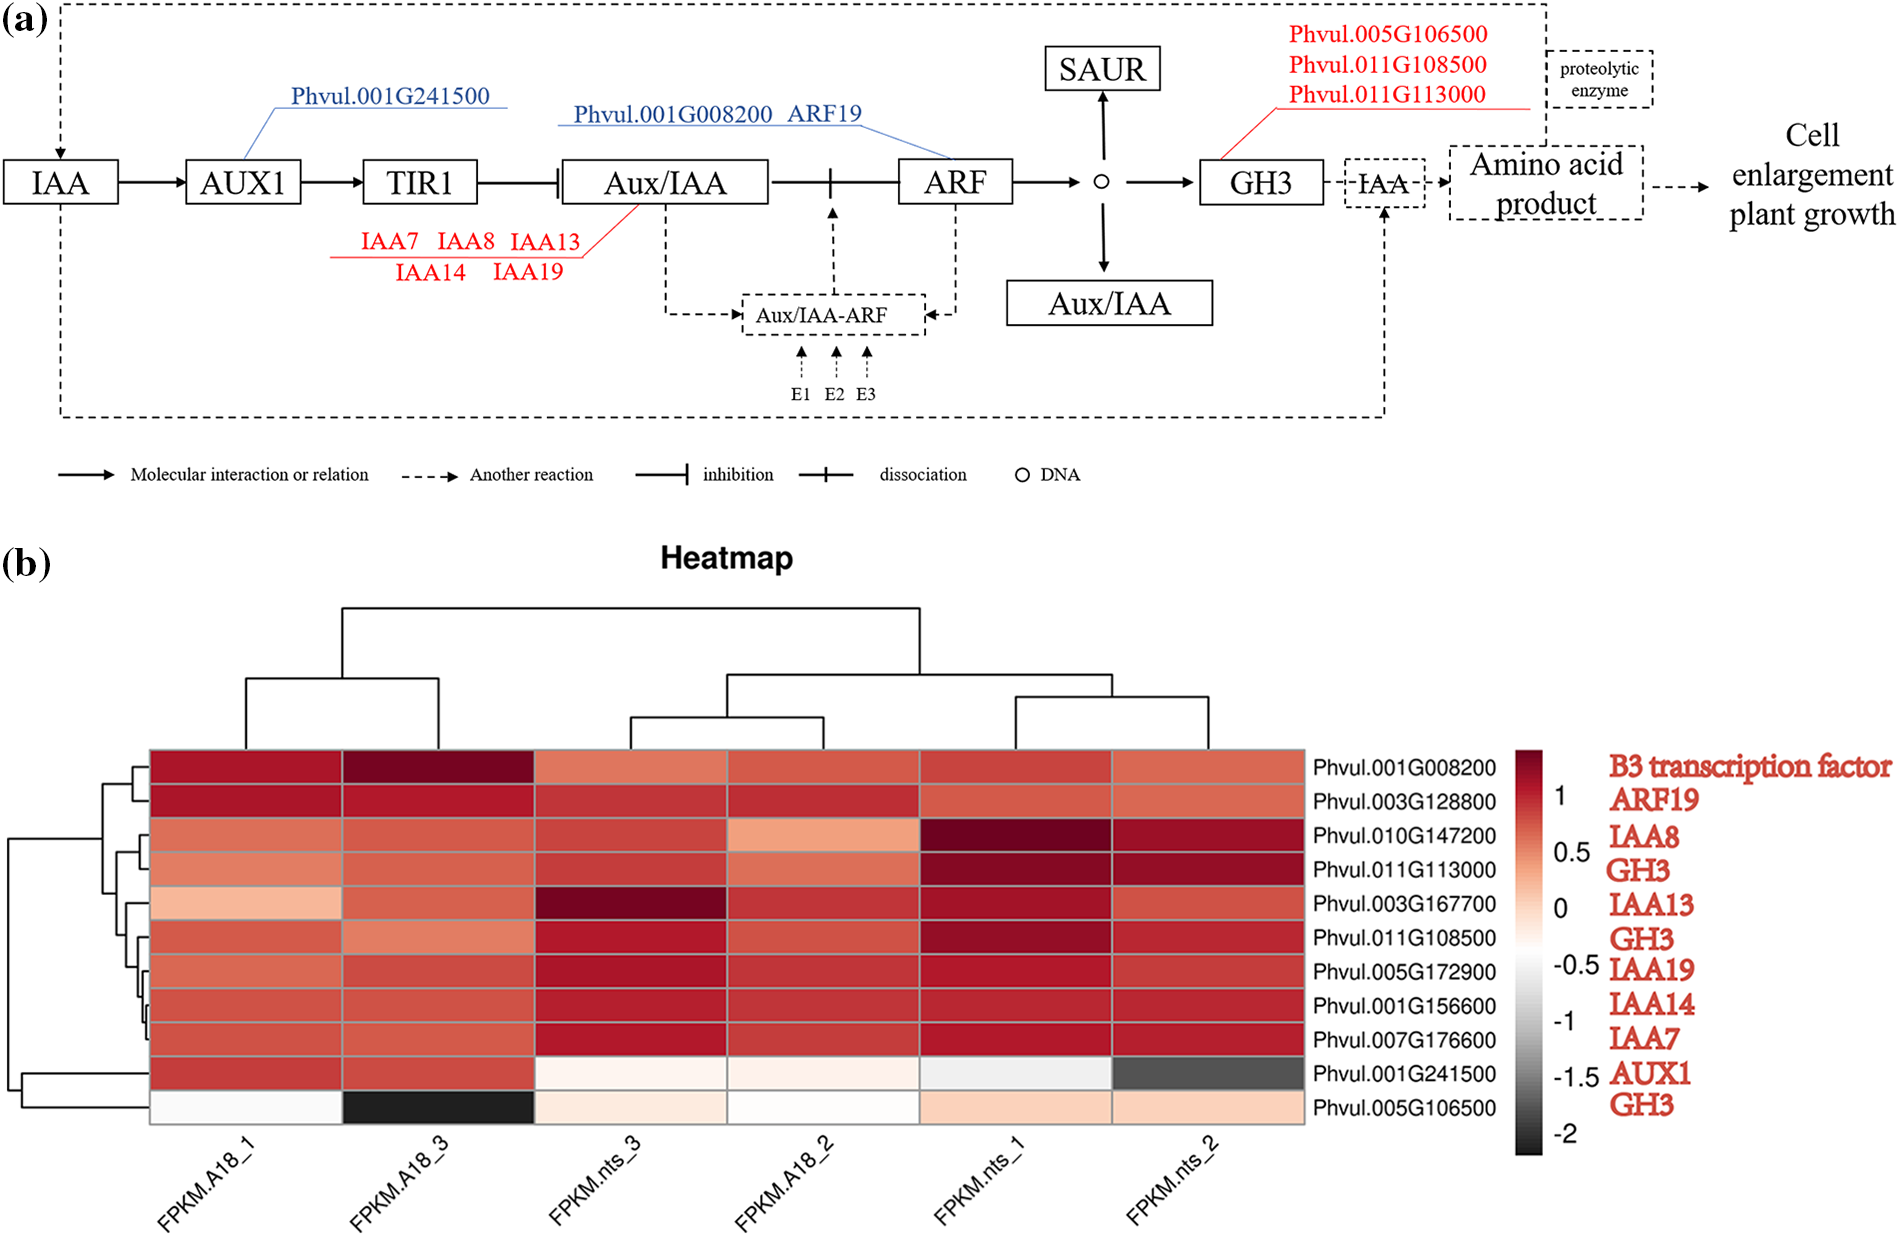
Figure 8: Schematic representation of significant changes in the transcript levels of genes involved in the auxin signal transduction pathway. (a) Auxin signal transduction pathway; blue represents downregulation and red represents upregulation. (b) Heatmap of DEGs in ‘A18’ and ‘nts’. The numbers represent the log10(fold change) value. The red and gray colors represent low-to-high expression levels
At the same time, because of the weakening control of ARF on the downstream growth response process, the plant auxin concentration changed, and the expression level of the amino acid synthase GH3 protein that maintains the dynamic balance of auxin concentration in plants also changed. In the wild type, when the plant auxin concentration is too high, GH3 converts auxin into IAA amino acid products stored or degraded in other ways. When the auxin concentration decreases, proteolytic enzymes hydrolyze the stored IAA amino acid products into normal auxin to maintain the dynamic balance of auxin in plants. Compared with the wild-type A18, genes of the GH3 family, namely Phvul.005G106500, Phvul.011G108500 and Phvul.011G113000, were still significantly upregulated under the condition of blocked auxin transport and decreased auxin content in plants. The results of the endogenous hormone assay showed that the auxin content in ‘nts’ decreased significantly. The GH3 activity was enhanced, and a large number of auxins in ‘nts’ were transformed into IAA amino acid products [40]. The rapid decrease in growth hormone concentration disrupts the growth hormone balance in the plants, and the change in aforementioned concentration results in a thin-stemmed, short-stalked plant phenotype. Throughout the process, the expression of the auxin receptor TIR1 did not change, indicating that the binding of auxin and its receptor is normal. Therefore, in the present study, we consider that AUX1 downregulation was the key cause of impaired auxin transport, imbalance of plant auxin content, growth inhibition of the mutant ‘nts’, and phenotypic changes in thin straw and dwarf stalks.
3.8 qRT-PCR Verification of Differential Genes
To verify the reliability of RNA-Seq data, 9 randomly selected differential genes (Phvul.011G108500, Phvul.003G262800, Phvul.007G176600, Phvul.009G015900, Phvul.005G136900, Phvul.006G015100, Phvul.008G106300, Phvul.007G102800 and Phvul.011G025000) were subjected to qRT-PCR. The expression patterns of the 9 genes were basically consistent with the RNA-Seq sequencing results. This proved that the transcriptome sequencing results were accurate and reliable and could be used in the follow-up research (Fig. 9).
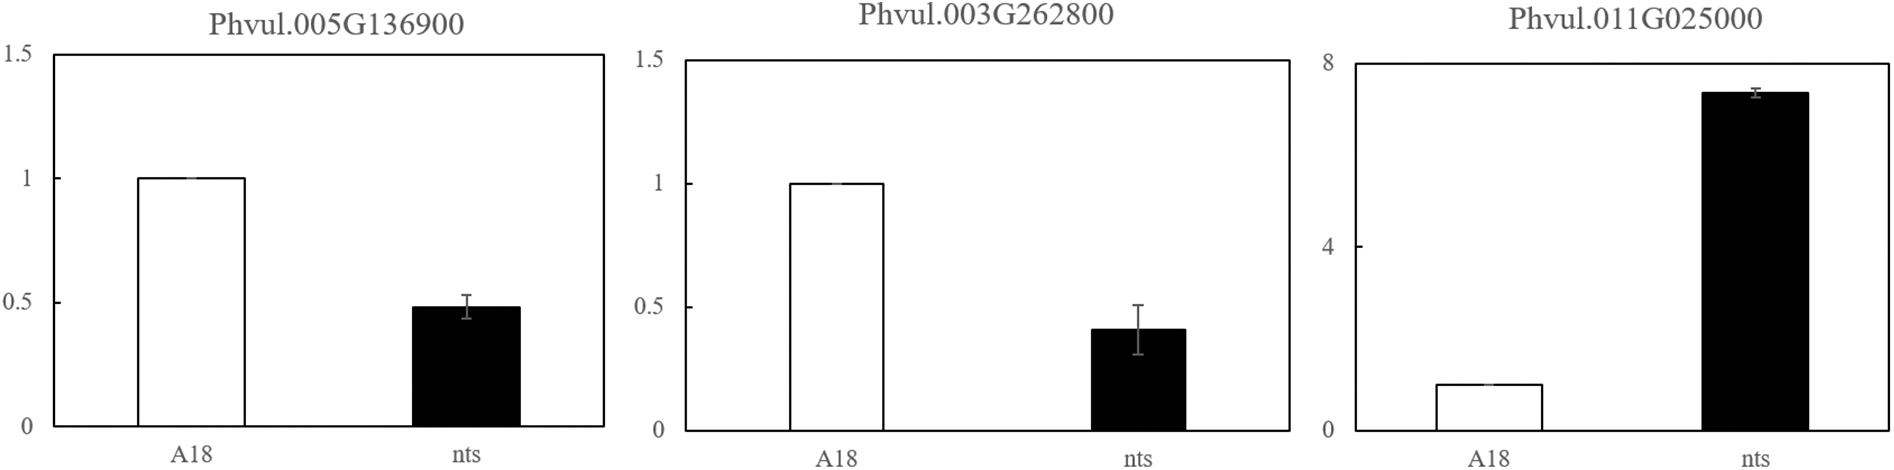
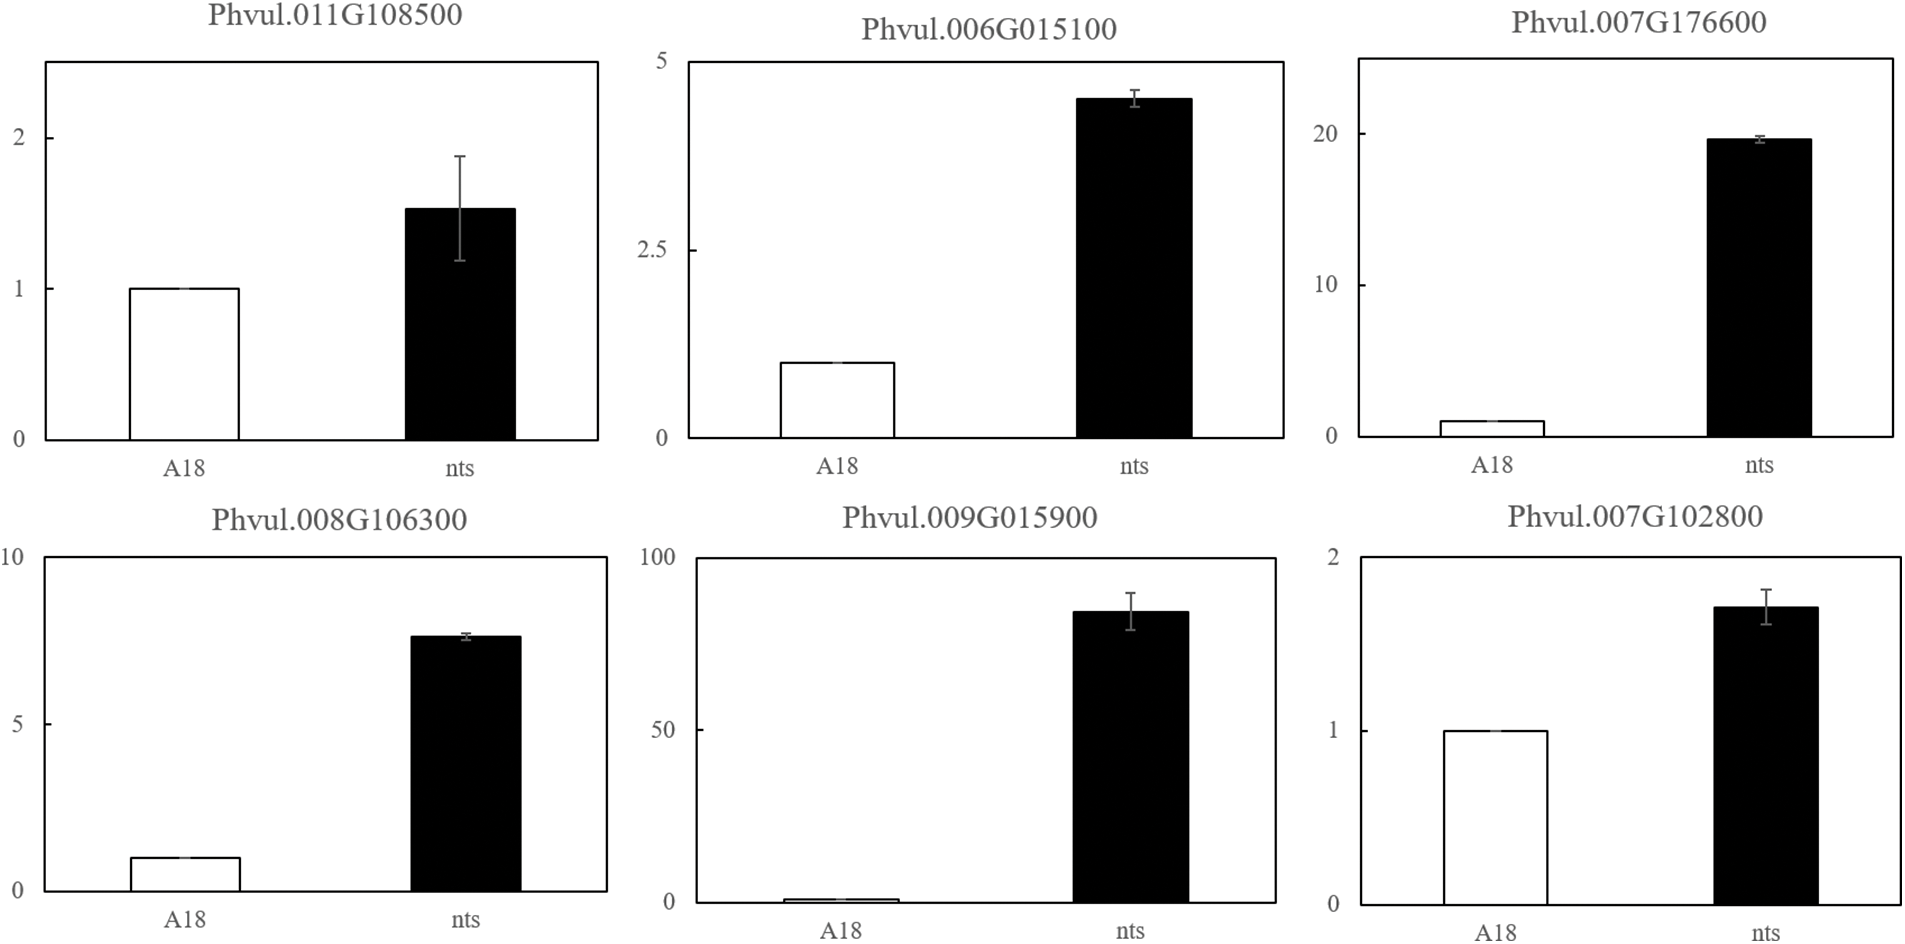
Figure 9: qRT-PCR results of DEGs in ‘A18’ and ‘nts’
Note: The expression levels of the nine genes selected from nts and A18 showed almost the same trend as those in the transcriptome data.
The mutant ‘nts’ was obtained through irradiation mutagenesis of the common bean variety ‘A18’, and the mutant phenotype was obtained through irradiation-induced gene mutation in the plant. In this research, transcripts of the ‘nts’ and ‘A18’ plants were analyzed using Illumina RNA-Seq. Based on the results of comparative transcriptome and gene expression analysis according to GO and KEGG categories, we observed a significant enrichment of DEGs in the plant hormone signal transduction pathway. We screened the DEGs related to signal transduction and performed functional annotation as well as analysis. The IAA content in the apical stem of the dwarfing thin stem mutant ‘nts’ at the initial flowering stage was significantly higher than that of the wild type, and the phenotype of the dwarfing thin stem of ‘nts’ was more significant following exogenous spraying of IAA, which suggested that the dwarfing thin stem phenotype is related to IAA [40]. Therefore, we speculated that mutations in the growth hormone signaling pathway may be the key factor causing the inhibition of ‘nts’ growth, in which AUX1 (Phvul.001G241500) is the key gene that is probably mutated. This work provides valuable information for further understanding of the molecular regulatory mechanisms of bean strains and lays a solid foundation for future genetic and functional genomic studies in beans.
Auxin (IAA) has a key role in plant growth regulation. In general, IAA stimulates longitudinal elongation of cells and inhibits lateral growth of root cells to some extent [41,42]. Auxin is involved in almost all processes of plant growth and development, and gene expression controls its signal-transduction process [43]. The early response factors of plant auxin mainly belong to three categories: Aux/IAAs, SAURs, and GH3s [44–46]. According to some studies, ARF is a key response factor in auxin signal transduction and acts in concert with Aux/IAA in an auxin-regulated manner [19,47]. In cells with a low auxin concentration, the Aux/IAA protein inhibits ARF-mediated regulation of downstream auxin response genes by binding to ARF to form an Aux/IAA-ARF dimer [48]. At a high auxin concentration, auxin promotes Domain II of the Aux/IAA protein to be directly bound to the top of auxin, which leads to Aux/IAA protein degradation by proteolytic enzymes in the presence of the ubiquitin-activating enzyme E1, ubiquitin-binding enzyme E2, and ubiquitin ligase E3 enzymes [49,50]. The inhibitory effect of the Aux/IAA protein on ARF is then released, thereby allowing it to restart regulating downstream genes, including early auxin response genes [51–53].
Shani et al. speculated that transcriptional regulation of the Aux/IAA gene is a key player in establishing auxin signal transduction pathways that regulate organ and growth development as well as environmental responses [54]. Rapid degradation of the Aux/IAA protein is necessary for auxin signal transduction [55–57]. Notably, auxin regulates the Aux/IAA gene in addition to light signal transduction, which also affects the expression of this Aux/IAA gene. AtIAA3 mutant seedlings had shorter hypocotyls under light conditions, whereas the mutant seedlings had more pronounced characteristics under dark conditions, including shorter hypocotyls and swollen cotyledons, which indicated that the gene is a light-inducible gene [58–62]. Thirty-one Aux/IAA genes of maize were induced by light signal transduction and abiotic stresses [44,63,64]. Analysis of the promoter region of sorghum Aux/IAA revealed many light signaling- and abiotic stress-related cis-regulatory elements in addition to the auxin response element AuxRE [65]. In the mutant ‘nts’, the expression of photosensitive pigment proteins Phvul.002G311500, Phvul.004G166400, and Phvul.009G146000 was significantly downregulated, which we speculate may affect the light signaling process in plants and may be a crucial reason for the inhibition of phenotypic growth of common beans.
In addition to Aux/IAA and GH3, the auxin early response gene SAUR is the most rapidly and strongly sensed auxin gene [66–68]. It plays a key role in plants [69,70]. SAUR63 in Arabidopsis allows auxin-associated genes to stimulate the elongation of different organs, while SAUR41 enables cellular translocation by regulating auxin [71,72]. The SAUR39 gene plays a role in auxin synthesis and transportation in rice [73]. In this study, numerous genes of the SAUR family exhibited altered expression in the mutant ‘nts’. The majority of the SAUR genes were upregulated, with only a few being downregulated. The overexpression of SAUR, which acts as a negative regulator of auxin levels and transport, may reduce auxin content and polar transport of auxin and suppress plant stem and root growth.
In the present study, we performed a comparative analysis of the transcriptome of ‘nts’ and ‘A18’ stems. Transcriptome sequencing results revealed 1168 upregulated genes and 1738 downregulated genes in the ‘nts’ and wild-type ‘A18’ apical stems. GO enrichment results showed that DEGs were mainly enriched in plant secondary cell wall genesis and other pathways. Among KEGG pathways, DEGs were mainly enriched in auxin-related signal transduction pathways. We observed a significant downregulation of gene expression levels in the IAA signaling pathway, we hypothesized that AUX1 (Phvul.001G241500) mutation might be responsible for the phenotypic variation in ‘nts’ mutants. These results laid a molecular foundation for the formation of dwarf slender stem phenotype of Phaseolus vulgaris, and provided a basis and reference for further exploration of fine positioning and cloning of dwarf slender stem genes.
Acknowledgement: The authors acknowledge the contribution of MJEditor (www.mjeditor.com) for providing English editing services for this manuscript.
Funding Statement: This work was supported by grants from the National Natural Science Foundation of China, Youth Science Foundation Project (Grant Number 32002031), the Basic Scientific Research Operating Expenses of Provincial College in Heilongjiang Province, China (Grant Numbers 2020-KYYWF-1026, 2020-KYYWF-1027), and the Heilongjiang Provincial Natural Science Foundation of China (Grant Number LH2020C090).
Author Contributions: Conceptualization, G.F., and X.Y.; Formal analysis, L.Y., C.L., and Z.L.; Investigation, C.L., D.L., and Z.Y.; Resources, G.F., and X.Y.; Writing and original draft, L.Y; Revising manuscript, L.Y. All authors reviewed the results and approved the final version of the manuscript.
Availability of Data and Materials: The transcriptome raw reads generated from this study were deposited in the GEO (Gene Expression Omnibus) of NCBI with the accession number GSE227577.
Conflicts of Interest: The authors declare that they have no conflicts of interest to report regarding the present study.
References
1. Porch, T. G., Blair, M. W., Lariguet, P., Galeano, C., Pankhurst, C. E. et al. (2009). Generation of a mutant population for TILLING common bean genotype BAT 93. Journal of the American Society for Horticultural Science, 134(3), 348–355. [Google Scholar]
2. Talukdar, D. (2014). Mutagenesis as functional biology tool in the improvement of legumes. Mutagenesis: exploring novel genes and pathways. Wageningen: Wageningen Academic Publishers. [Google Scholar]
3. Ning, G., Zheng, J., Hu, B., Gu, Y., Guo, R. et al. (2018). Construction and phenotypic observation of a gamma radiation mutant library of common bean cultivar Golden Hook. Soils and Crops, 7(2), 168–176. [Google Scholar]
4. Wani, M. R., Dar, A. R., Tak, A., Amin, I., Shah, N. H. et al. (2018). Chemo-induced pod and seed mutants in mungbean (Vigna radiata L. Wilczek). SAARC Journal of Agriculture, 15(2), 57–67. [Google Scholar]
5. Hwang, W. J., Kim, M. Y., Kang, Y. J., Shim, S., Stacey, M. G. et al. (2015). Genome-wide analysis of mutations in a dwarf soybean mutant induced by fast neutron bombardment. Euphytica, 203(2), 399–408. [Google Scholar]
6. Singh, G., Sareen, P. K., Saharan, R. P. (2000). Induced chlorophyll and morphological mutations in mungbean. Indian Journal of Genetics & Plant Breeding, 32(1), 391–393. [Google Scholar]
7. Singh, A. K. (2009). Induced genetic variability in M3 generation of mungbean. Journal of Food Legumes, 22(3), 162–165. [Google Scholar]
8. Goyal, S., Wani, M. R., Laskar, R. A., Raina, A., Amin, R. et al. (2019). Induction of morphological mutations and mutant phenotyping in black gram [Vigna mungo (L.) Hepper] using gamma rays and EMS. Vegetos, 32(4), 464–472. [Google Scholar]
9. Goyal, S., Wani, M. R., Laskar, R. A., Raina, A., Khan, S. (2020). Mutagenic effectiveness and efficiency of individual and combination treatments of gamma rays and ethyl methanesulfonate in black gram [Vigna mungo (L.) Hepper]. Advances in Zoology Botany, 8(3), 163–168. [Google Scholar]
10. Khursheed, S., Raina, A., Amin, R., Wani, M. R., Khan, S. (2016). Quantitative analysis of genetic parameters in the mutagenized population of faba bean (Vicia faba L.). Research on Crops, 19(2), 276–284. [Google Scholar]
11. Chua, N. H., Bennoun, P. (1975). Thylakoid membrane polypeptides of Chlamydomonas reinhardtii: Wild-type and mutant strains deficient in photosystem II reaction center. Proceedings of the National Academy of Sciences of the United States of America, 72(6), 2175–2179. [Google Scholar] [PubMed]
12. Beckers, V., Dersch, L. M., Lotz, K., Melzer, G., Bläsing, O. E. et al. (2016). In silico metabolic network analysis of Arabidopsis leaves. BMC Systems Biology, 10(1), 102. [Google Scholar] [PubMed]
13. Bajguz, A., Hayat, S. (2009). Effects of brassinosteroids on the plant responses to environmental stresses. Plant Physiology and Biochemistry, 47(1), 1–8. [Google Scholar] [PubMed]
14. McSteen, P. (2009). Hormonal regulation of branching in grasses. Plant Physiology, 149(1), 46–55. [Google Scholar] [PubMed]
15. Wei, C., Zhu, L., Wen, J., Yi, B., Ma, C. et al. (2018). Morphological, transcriptomics and biochemical characterization of new dwarf mutant of Brassica napus. Plant Science, 270, 97–113. [Google Scholar] [PubMed]
16. Lin, T., Zhou, R., Bi, B., Song, L., Chai, M. et al. (2020). Analysis of a radiation-induced dwarf mutant of a warm-season turf grass reveals potential mechanisms involved in the dwarfing mutant. Scientific Reports, 10(1), 18913. [Google Scholar] [PubMed]
17. Gray, W. M. (2004). Hormonal regulation of plant growth and development. PLoS Biology, 2(9), E311. [Google Scholar] [PubMed]
18. Mashiguchi, K., Tanaka, K., Sakai, T., Kasahara, H. (2011). The main auxin biosynthesis pathway in Arabidopsis. Proceedings of the National Academy of Sciences, 108(45), 18512–18517. [Google Scholar]
19. Feng, L., Li, G., He, Z., Han, W., Sun, J. et al. (2019). The ARF, GH3, and Aux/IAA gene families in castor bean (Ricinus communis L.Genome-wide identification and expression profiles in high-stalk and dwarf strains. Industrial Crops and Products, 141, 111804. [Google Scholar]
20. Multani, D. S., Briggs, S. P., Chamberlin, M. A., Blakeslee, J. J., Murphy, A. S. et al. (2003). Loss of an MDR transporter in compact stalks of maize br2 and sorghum dw3 mutants. Science, 302(5642), 81– 84. [Google Scholar] [PubMed]
21. Sakamoto, T., Miura, K., Itoh, H., Tatsumi, T., Ueguchi-Tanaka, M. et al. (2004). An overview of gibberellin metabolism enzyme genes and their related mutants in rice. Plant Physiology, 134(4), 1642–1653. [Google Scholar] [PubMed]
22. Fleet, C. M., Sun, T. P. (2005). A DELLAcate balance: The role of gibberellin in plant morphogenesis. Current Opinion in Plant Biology, 8(1), 77–85. [Google Scholar] [PubMed]
23. Wang, B., Smith, S. M., Li, J. (2018). Genetic regulation of shoot architecture. Annual Review of Plant Biology, 69, 437–468. [Google Scholar] [PubMed]
24. Xiong, G., Li, J., Wang, Y. (2009). Advances in plant hormone regulation research. Chinese Science Bulletin, 18, 16. [Google Scholar]
25. Yuan, J., Wang, Q., Zhang, H. (2005). Interactions between plant hormone signals. Chinese Journal of Cell Biology, 3, 325–328. [Google Scholar]
26. Jiang, L., Li, Z., Yu, X., Liu, C. (2021). Bioinformatics analysis of Aux/IAA gene family in maize. Agronomy Journal, 113(2), 932–942. [Google Scholar]
27. Yang, F., Shi, Y., Zhao, M., Cheng, B., Li, X. (2022). ZmIAA5 regulates maize root growth and development by interacting with ZmARF5 under the specific binding of ZmTCP15/16/17. PeerJ, 10, e13710. [Google Scholar] [PubMed]
28. Cheng, Y., Zhao, Y. (2007). A role for auxin in flower development. Journal of Integrative Plant Biology, 49(1), 99–104. [Google Scholar]
29. Zhao, Z., Zhang, Y., Liu, X., Zhang, X., Liu, S. et al. (2013). A role for a dioxygenase in auxin metabolism and reproductive development in rice. Developmental Cell, 27(1), 113–122. [Google Scholar] [PubMed]
30. Kasahara, H. (2016). Current aspects of auxin biosynthesis in plants. Bioscience Biotechnology & Biochemistry, 80(1), 34–42. [Google Scholar]
31. Mei, M., Wang, X., Zhang, X. (2017). Advances in plant auxin response factors. Seed, 36(1), 47–54. [Google Scholar]
32. Die, J. V., Gil, J., Millán, T. (2018). Genome-wide identification of the auxin response factor gene family in Cicer arietinum. BMC Genomics, 19(1), 301. [Google Scholar] [PubMed]
33. Jiang, S., Tao, J., Li, L. (2005). The roles of early auxin response proteins in auxin signal transduction. Plant Physiology and Molecular Biology, 1, 125–130. [Google Scholar]
34. Res, N. A. (2015). Gene ontology consortium: Going forward. Nucleic Acids Research, 43, D1049–D1056. [Google Scholar]
35. Kanehisa, M., Goto, S. (2000). KEGG: Kyoto encyclopedia of genes and genomes. Nucleic Acids Research, 43, 27–30. [Google Scholar]
36. Chen, L., Zhang, Y. H., Wang, S., Zhang, Y., Huang, T. et al. (2017). Prediction and analysis of essential genes using the enrichments of gene ontology and KEGG pathways. PLoS One, 12(9), 184129. [Google Scholar]
37. Chen, Q., Liu, C., Siqin, T. (2019). Mutagenesis of snap bean cultivar A18-1 by 60Co-γ-rays and mutant library construction. China Vegetables, 5, 38–44. [Google Scholar]
38. Coates, P. J. (1991). Paraffin section molecular biology: Review of current techniques. Journal of Histotechnology, 14(4), 263–269. [Google Scholar]
39. Day, R. C. (2010). Laser microdissection of paraffin-embedded plant tissues for transcript profiling. Methods in Molecular Biology, 655, 321–346. [Google Scholar] [PubMed]
40. Liang, Z. (2021). Phenotypic analysis and mining of mutant genes in the ‘nts’ of Phaseolus vulgaris dwarf slender stem mutant (Master Thesis). Heilongjiang University, China. [Google Scholar]
41. Ma, Y., Xue, H., Zhang, L., Ou, C., Wang, F. et al. (2016). Involvement of auxin and brassinosteroid in dwarfism of autotetraploid apple (Malus × domestica). Scientific Reports, 6, 26719. [Google Scholar] [PubMed]
42. Casanova-Sáez, R., Mateo-Bonmatí, E., Ljung, K. (2021). Auxin metabolism in plants. Cold Spring Harbor Perspectives in Biology, 13(3), a039867. [Google Scholar]
43. Roosjen, M., Paque, S., Weijers, D. (2018). Auxin response factors: Output control in auxin biology. Journal of Experimental Botany, 69(2), 179–188. [Google Scholar] [PubMed]
44. Liscum, E., Briggs, W. R. (1996). Mutations of Arabidopsis in potential transduction and response components of the phototropic signaling pathway. Plant Physiology, 112(1), 291–296. [Google Scholar] [PubMed]
45. Guilfoyle, T. J., Ulmasov, T., Hagen, G. (1998). The ARF family of transcription factors and their role in plant hormone-responsive transcription. Cellular and Molecular Life Sciences, 54(7), 619–627. [Google Scholar] [PubMed]
46. Huang, S., Yang, C., Li, L. (2022). Unraveling the dynamic integration of auxin, brassinosteroid and gibberellin in early shade-induced hypocotyl elongation. Phenomics, 2(2), 119–129. [Google Scholar] [PubMed]
47. Sima, X., Zheng, B. (2015). Advances in primary auxin-responsive Aux/IAA gene family: A review. Journal of Zhejiang A & F University, 32(2), 313–318. [Google Scholar]
48. Luo, J., Zhou, J. J., Zhang, J. Z. (2018). Aux/IAA gene family in plants: Molecular structure, regulation, and function. International Journal of Molecular Sciences, 19(1), 259. [Google Scholar] [PubMed]
49. Dharmasiri, N., Dharmasiri, S., Weijers, D., Lechner, E., Yamada, M. et al. (2005). Plant development is regulated by a family of auxin receptor F box proteins. Developmental Cell, 9(1), 109–119. [Google Scholar] [PubMed]
50. Leyser, O. (2018). Auxin signaling. Plant Physiology, 176(1), 465–479. [Google Scholar] [PubMed]
51. Tan, X., Calderon-Villalobos, L. I., Sharon, M., Zheng, C., Robinson, C. V. et al. (2007). Mechanism of auxin perception by the TIR1 ubiquitin ligase. Nature, 446(7136), 640–645. [Google Scholar] [PubMed]
52. Salehin, M. F., Bagchi, R., Estelle, M. (2015). SCFTIR1/AFB-based auxin perception: Mechanism and role in plant growth and development. Plant Cell, 27(1), 9–19. [Google Scholar] [PubMed]
53. Xiao, X. Y., Wang, Q., Lang, D. Y., Chu, Y., Zhang, Y. et al. (2021). RNA-seq reveals that multiple plant hormones are regulated by Bacillus cereus G2 in Glycyrrhiza uralensis subjected to salt stress. Journal of Plant Interactions, 16(1), 591–603. [Google Scholar]
54. Shani, E., Salehin, M., Zhang, Y., Sanchez, S. E., Doherty, C. et al. (2017). Plant stress tolerance requires auxin-sensitive Aux/IAA transcriptional repressors. Current Biology, 27(3), 437–444. [Google Scholar] [PubMed]
55. Abel, S., Nguyen, M. D., Theologis, A. (1995). ThePS-IAA4/5-like family of early auxin-inducible mRNAs in Arabidopsis thaliana. Journal of Molecular Biology, 251(4), 533–549. [Google Scholar] [PubMed]
56. Guilfoyle, T. J., Hagen, G. (2007). Auxin response factors. Current Opinion in Plant Biology, 10(5), 453–460. [Google Scholar] [PubMed]
57. Goldental-Cohen, S., Israeli, A., Ori, N., Yasuor, H. (2017). Auxin response dynamics during wild-type and entire flower development in tomato. Plant and Cell Physiology, 58(10), 1661–1672. [Google Scholar] [PubMed]
58. Kim, B. C., Soh, M. C., Kang, B. J., Furuya, M., Nam, H. G., Two dominant photomorphogenic mutations of Arabidopsis thaliana identified as suppressor mutations of hy2. Plant Journal, 9(4), 441–456. [Google Scholar]
59. Kim, J., Harter, K., Theologis, A. (1997). Protein-protein interactions among the Aux/IAA proteins. Proceedings of the National Academy of Sciences of the United States of America, 94(22), 11786–11791. [Google Scholar] [PubMed]
60. Kim, B. C., Soh, M. S., Hong, S. H., Furuya, M., Nam, H. G. (1998). Photomorphogenic development of the Arabidopsisshy2-1D mutation and its interaction with phytochromes in darkness. Plant Journal, 15(1), 61–68. [Google Scholar]
61. Kim, H., Park, P. J., Hwang, H. J., Lee, S. Y., Oh, M. H. et al. (2006). Brassinosteroid signals control expression of the AXR3/IAA17 gene in the cross-talk point with auxin in root development. Bioscience, Biotechnology, and Biochemistry, 70(4), 768–773. [Google Scholar] [PubMed]
62. Hammes, U. Z., Murphy, A. S., Schwechheimer, C. (2022). Auxin transporters—A biochemical view. Cold Spring Harbor Perspectives in Biology, 14(2), a039875. [Google Scholar] [PubMed]
63. Rouse, D., Mackay, P., Stirnberg, P., Estelle, M., Leyser, O. (1998). Changes in auxin response from mutations in an AUX/IAA gene. Science, 279(5355), 1371–1373. [Google Scholar] [PubMed]
64. Kloosterman, B., Visser, R. G., Bachem, C. W. (2006). Isolation and characterization of a novel potato Auxin/Indole-3-acetic acid family member (StIAA2) that is involved in petiole hyponasty and shoot morphogenesis. Plant Physiology and Biochemistry, 44(11–12), 766–775. [Google Scholar] [PubMed]
65. Wang, Y., Li, J. (2005). The plant architecture of rice (Oryza sativa). Plant Molecular Biology, 59(1), 75–84. [Google Scholar] [PubMed]
66. Hagen, G., Guilfoyle, T. (2002). Auxin-responsive gene expression: Genes, promoters and regulatory factors. Plant Molecular Biology, 49(3–4), 373–385. [Google Scholar] [PubMed]
67. Spartz, A. K., Lee, S. H., Wenger, J. P., Gonzalez, N., Itoh, H. et al. (2012). The SAUR19 subfamily of SMALL AUXIN UP RNA genes promote cell expansion. Plant Journal, 70(6), 978–990. [Google Scholar]
68. Hagen, G. (2015). Auxin signal transduction. Essays in Biochemistry, 58, 1–12. [Google Scholar] [PubMed]
69. Ren, H., Gray, W. M. (2015). SAUR proteins as effectors of hormonal and environmental signals in plant growth. Molecular Plant, 8(8), 1153–1164. [Google Scholar] [PubMed]
70. Stortenbeker, N., Bemer, M. (2019). The SAUR gene family: The plant’s toolbox for adaptation of growth and development. Journal of Experimental Botany, 70(1), 17–27. [Google Scholar] [PubMed]
71. Chae, K., Isaacs, C. G., Reeves, P. H., Maloney, G. S., Muday, G. K. et al. (2012). Arabidopsis SMALL AUXIN UP RNA63 promotes hypocotyl and stamen filament elongation. Plant Journal, 71(4), 684–697. [Google Scholar]
72. Kong, Y., Zhu, Y., Gao, C., She, W., Lin, W. et al. (2013). Tissue-specific expression of SMALL AUXIN UP RNA41 differentially regulates cell expansion and root meristem patterning in Arabidopsis. Plant and Cell Physiology, 4(4), 609–621. [Google Scholar]
73. Kant, S., Bi, Y. M., Zhu, T., Rothstein, S. J. (2009). SAUR39, a small auxin-up RNA gene, acts as a negative regulator of auxin synthesis and transport in rice. Plant Physiology, 151(2), 691–701. [Google Scholar] [PubMed]
Cite This Article
 Copyright © 2023 The Author(s). Published by Tech Science Press.
This work is licensed under a Creative Commons Attribution 4.0 International License , which permits unrestricted use, distribution, and reproduction in any medium, provided the original work is properly cited.
 Downloads
 Citation Tools