
 Submit a Paper
 Propose a Special lssue
 Open Access
ARTICLE
Effects of Two Potential Allelochemicals on the Photosystem II of Nitzschia closterium and Monostroma nitidum
Fishery College, Guangdong Ocean University, Zhanjiang, 524088, China
* Corresponding Authors: Jianjun Cui. Email: ; Enyi Xie. Email:
(This article belongs to the Special Issue: Role of Biostimulants in the Alleviation of Biotic and Abiotic Stress)
Phyton-International Journal of Experimental Botany 2023, 92(1), 251-269. https://doi.org/10.32604/phyton.2022.022672
Received 20 March 2022; Accepted 20 May 2022; Issue published 06 September 2022
 View Full Text
 Download PDF
Abstract
In aquaculture, high-density seaweed farming brings higher economic benefits but also increases outbreaks of diatom felt. The effective control of diatom felt in high-density seaweed farming has always been a research hotspot. This study selected two potential allelochemicals 2-hydroxycinnamic acid and quinic acid to explore their effects on a diatom Nitzschia closterium and an economic seaweed Monostroma nitidum. The results showed that 2-hydroxycinnamic acid had better inhibitory effects than quinic acid on the growth, pigment content and photosynthetic efficiency of N. closterium. Their half-maximal inhibitory concentrations at 120 h (IC50–120 h) were 0.9000 and 1.278 mM, respectively. Additionally, these allelochemicals had limited inhibitory effects on the growth, pigment content and photosynthetic efficiency of M. nitidum before 24 h. To further explore the allelopathic effect of these chemicals, this study focused on the photosystem II energy fluxes of N. closterium. It was found that 3 mM 2-hydroxycinnamic acid could destroy the whole photosynthetic system by devastating the PSII reaction centre (RC) before 24 h; however, the same concentration of quinic acid could only down-regulate the electron transport efficiency by changing the effective antenna size of an active RC and downregulating the PSII reaction centre density. These experimental results are expected to provide a new strategy to control diatom felt blooms on the high-density seaweed farming areas.Keywords
Marine biofouling is the result of marine organisms setting, adhering and growing on any structural surfaces that are immersed in seawater. It has always caused severe ecological environmental issues [1]. Marine fouling organisms include microfouling organisms and macrofouling organisms, and complete microfouling always increases macrofouling [2]. Diatoms are necessary components of microfouling organisms. They secrete mucilage or produce mucilage medium to attach to a substrate, with their attachment modes classified as valve attachment, mucilage pad attachment, mucilage stalk attachment, mucilage tube attachment and mucilage film attachment [3]. According to previous studies, diatoms have no strict specificity for different attachment substrates but are classified as epilithic, epipelic, epipsammic, epiphytic and epizoic diatoms according to their attachment substrate [4–8]. Macroalgae are common hosts of epiphytic diatoms. The attachment of large quantities of epiphytic diatoms will limit their hosts’ access to light and nutrients, thereby adversely affecting the hosts’ growth [9].
In pursuit of higher economic profits, aquaculturists increase the density of seaweed cultivation as much as possible, which further aggravates outbreaks of diatom felt [10,11]. According to the 2010 and 2020 Algal Diseases Review, regular outbreaks of diatom felt in aquiculture areas caused pollution, bleaching and decreased yields of economic macroalgae, which led to significant economic losses for the global algal industry [11–13]. Since the mid-1980s, diatom felt outbreaks in the aquacultures of Japan’s coastal waters have commonly resulted in damages in the order of a billion yen (>10 million dollars) [14,15]. In Korea and Japan, outbreaks of diatom felt have been devastating, causing serious economic loss to Monostroma and Porphyra sea farmers by lowering auction prices [13,16]. In China, the same problem has plagued aquaculturists for years [3,17]. Regular acid-washing is still considered the most effective method to combat diatom felt [12].
With the rise of allelopathy, more and more allelochemicals have been developed as biological methods for controlling the growth of harmful algae [18–22]. Allelochemicals are economical and eco-friendly compounds for controlling harmful algae because they are easy to access, biodegrade quickly and cause minimal pollution [19]. Many reports have revealed that botanical allelochemicals can significantly suppress the growth and photosynthesis of harmful algae [23–28]. The change of chlorophyll a, chlorophyll c and carotenoids might attribute to the photosynthetic system to acclimate the stress, as they are involved in light absorption, light harvesting and photochemistry [29–31]. The suppression of algal growth, pigment content and photosynthetic efficiency are macroscopic expressions of electron transport and ATP synthesis heterogeneity [32,33]. Many allelochemicals have been confirmed as hindering electron transport in algal photosynthetic systems, thus affecting ATP synthesis [28,34,35]. The OJIP fluorescence transient and JIP test, a sensitive probe for PSII heterogeneity, can elaborate changes in photons, excitons, electrons and other metabolites [36]. However, previous studies on the application of allelochemicals have concentrated on red tide algae rather than diatoms and economic macroalgae [37,38].
Our preliminary study revealed that Gracilaria bailiniae extract could inhibit the growth of N. closterium (data not shown). Two potential allelochemicals—2-hydroxycinnamic acid, a phenolic acid, and quinic acid, an organic acid—were identified in the G. bailiniae extract. Therefore, the allelopathic potential of 2-hydroxycinnamic acid and quinic acid was tested on epiphytic diatom N. closterium and economic macroalgae M. nitidum, respectively. The aims of this study were (1) to determine the effect of 2-hydroxycinnamic acid and quinic acid on the growth and photosynthetic efficiency of N. closterium, (2) to determine the effect of 2-hydroxycinnamic acid and quinic acid on the growth and photosynthetic efficiency of M. nitidum and (3) to further investigate the allelopathic effect of 2-hydroxycinnamic acid and quinic acid on the photosynthetic system of N. closterium.
2.1 Preparation of Standard Solutions
Standard substances 2-hydroxycinnamic acid (98%, CAS number: 583-17-5) and quinic acid (98%, CAS number: 77-95-2) were purchased from Bide Pharmatech Co., Ltd. (Shanghai, China) and Aladdin Biochemical Technology Co., Ltd. (Shanghai, China). The appropriate weight of each standard substance was transferred into a 10 mL centrifuge tube and immediately dissolved in 0.1% DMSO. The resulting standard solutions (5, 10 and 30 mM) were stored at 4°C.
2.2 Pre-Treatment of N. closterium and M. nitidum Samples
N. closterium was obtained from the Guangyu Biological Technology Co., Ltd. (Shanghai, China). Attached M. nitidum samples were collected from the Naozhou Island, on the South China Sea Coast of Zhanjiang City (20°55’ 0"N, 110°35’ 0"E). M. nitidum samples were taken to the laboratory in a cooler on ice. Before experiments, sediments and contaminants were removed using filtered seawater and a soft brush. And then, N. closterium and M. nitidum were cultured in the laboratory using filter-sterilised (0.22 μm) natural seawater enriched with a modified f/2 medium in 1 L conical flasks. All conical flasks were sterilised at 121°C for 20 min in an autoclave steriliser to reduce bacterial numbers. To promote the growth of N. closterium, the initial concentration of Na2SiO3·9H2O in the modified f/2 medium was adjusted to 3.18 × 10⁻⁴ M. Under relatively sterile conditions, it was then cultured in a thermostatic incubator at 22 ± 1°C, with an illumination intensity of 2,500 lx, a 12:12 h light/dark regime and a salinity of 30 PSU. To reduce the effect of bacteria, a mixed antibiotic solution was added to all cultures before inoculation of diatom samples. The mixed antibiotic solution contained 200 mg kanamycin sulphate, 200 mg ampicillin, 200 mg gentamicin and 100 mg streptomycin (Beijing Solarbio Science and Technology Co., Ltd., China). According to the findings of our previous study, this antibiotic mixture had no obvious adverse effects on the survival of N. closterium and M. nitidum. All conical flasks containing N. closterium were lightly shaken three times daily to assist growth and prevent N. closterium cells from adhering to the walls of the flasks.
2.3 Growth Assessment of N. closterium and M. nitidum Exposed to Various Concentrations of Potential Allelochemicals
N. closterium in the exponential growth stage was inoculated in the groups (containing equivalent volumes of modified f/2 medium) to obtain an initial algal cell density of approximately 2 × 10⁶ cells·mL−1. The thalli of M. nitidum were added to the groups (containing equivalent volumes of modified f/2 medium) to obtain an initial algal cell density of approximately 0.57 g·L−1. Next, the standard solutions of the potential allelochemicals (2-hydroxycinnamic acid and quinic acid) were diluted to 0.5, 1 and 3 mM to test their effect on the growth of N. closterium and M. nitidum, respectively. The control group was treated with a 0 mM standard solution. There were three replicates for all groups in the experiment and the culture conditions were the same as those for the temporary culture of N. closterium and M. nitidum for 120 h. To decrease the effects of minor differences in photon irradiance, the conical flasks contained N. closterium were shaken slightly three times daily and manually rearranged, randomly. The growth rate of M. nitidum was determined every 24 h by monitoring changes in fresh wet. The growth of N. closterium was determined every 24 h using a haemocytometer (Qiujing Company, Shanghai, China). The inhibition rate (IR) of N. closterium was determined by the following equation:
Here, Nc is the average number of algal cells in the control group and Nt is the average number of algal cells in the treatment group.
2.4 Pigment Content Analysis of N. closterium and M. nitidum Exposed to Various Concentrations of Potential Allelochemicals
For content analysis of pigments chlorophyll a (chl a), chlorophyll c (chl c) and carotenoid, 10 mL of N. closterium culture exposed to various concentrations (0, 0.5, 1 and 3 mM) of 2-hydroxycinnamic acid or quinic acid was filtered through a 0.22 μm synthetic fabric filter membrane (Xinya Company, Shanghai, China) every 24 h. Each filter membrane was immediately collected and stored in the dark for 16 h at −20°C. The pigment of N. closterium was extracted from the filter membranes using 5 mL 95% ethyl alcohol and analysed by ultraviolet spectrophotometry (Shimadzu UV2450, Shimane, Japan) at 480, 510, 630, 664 and 750 nm according to the method described by Chen et al. [39]. The pigment content was calculated using the following equations:
Here, A480, A510, A630, A664 and A750 are the average optical density at 480, 510, 630, 664 and 750 nm, respectively, and the unit of pigment content is μg·mL–1.
Additionally, 0.1 g thalli of M. nitidum exposed to various concentrations (0, 0.5, 1 or and 3 mM) of 2-hydroxycinnamic acid or quinic acid were collect and crushed every 24 h. The pigment of chlorophyll a (chl a), chlorophyll b (chl b) and carotenoid of M. nitidum was extracted from the crushed thalli of M. nitidum using 5 mL 95% ethyl alcohol and analysed by the same ultraviolet spectrophotometry at 470, 649 and 665 nm according to the method described by Wang et al. [40]. The pigment content was calculated using the following equations:
Here, A470, A649 and A665 are the average optical density at 470, 649 and 665 nm, respectively, V is the volume of 95% ethyl alcohol (mL), M is the quality of M. nitidum (g), and the unit of pigment content is mg·g−1.
2.5 Photosynthetic Fluorescence of N. closterium and M. nitidum Exposed to Various Concentrations of Potential Allelochemicals
Photosynthetic efficiency represented by the maximum photochemical efficiency of photosystem II (PS II, Fv/Fm) and fluorescence transients of N. closterium were measured by a fluorimetry (AquaPen AP110, Czech Republic). After dark-acclimated for 15 min, 0.1 g M. nitidum were applied to determine values of Fv/Fm. 3 mL of N. closterium culture (during the growth experiment) were transferred to a reaction vessel and then dark-adapted for 15 min after shaking in triplicate. The fluorescence transients were recorded for up to 2 s on a logarithmic time scale. The fast phase gave rise to the OJIP fluorescence transients within the 2 s recording period. The O, J, I and P phases represented the fluorescence intensity at 20 μs, 2 ms, 30 ms and the maximum fluorescence, respectively. The fluorescence transients were applied to measure the photochemistry and the electron transport efficiency of PSII. The following JIP parameters were determined, based on the original results of the fluorescence transients: trapped energy/PSII unit reaction centre (TRo/RC), electron transport energy/RC (ETo/RC), dissipated energy/RC (DIo/RC), absorbed energy/RC (ABS/RC), trapped energy/excited cross-section (TRo/CSo), electron transport energy/CSo (ETo/CSo), dissipated energy/CSo (DIo/CSo), PSII active reaction centres/CSo (RC/CSo), absorbed energy/CSo (ABS/CSo), the probability (at t = 0) that a trapped exciton moves an electron into the electron transport chain beyond QA– (ψo), and the quantum yield of electron transport at t = 0 (φEo) [28,41–45]. The JIP test was applied to analyse the change to the photosynthetic apparatus when exposed to stress; that is, fluorescence analysis based on the OJIP curve [46,47]. In addition, the values of all JIP indicators were normalized (each parameter was expressed as a fraction relative to the value of the control) [28]. Axess labels (0, 0.5, 1, 1.5 and 2) were 0, 0.5, 1, 1.5 and 2 value of control, respectively.
The normality and homogeneity of variance of all data were determined using the Kolmogorov-Smirnov and Levene test, respectively. To determine the effect of concentration and exposure time on the algae cell density and inhibition rate of N. closterium, a two-way analysis of variance (ANOVA) was applied. Tukey’s post hoc pairwise comparisons were used when all variances were equal; otherwise, logarithmic transformation was applied in advance. Statistical significance was determined using Student’s t-test. Data comparisons were deemed to have a significant difference at an alpha value of P < 0.05. Data were visualised using GraphPad Prism 9 and Microsoft Excel 10.0. IC50–120 h was estimated each day by probit analysis through the IR values and concentration logarithm [28].
3.1 Effect of Potential Allelochemicals on the Growth of N. closterium and M. nitidum
Three concentrations of potential allelochemicals 2-hydroxycinnamic acid and quinic acid were applied to explore the effect on N. closterium and M. nitidum growth over 120 h (Figs. 1 and 2). Overall, both 2-hydroxycinnamic acid and quinic acid had inhibitory effects on N. closterium growth, with the degree of inhibition depending on the concentration (P < 0.05). Except for the 0.5 mM treatment, the growth of N. closterium was significantly suppressed at various concentrations of 2-hydroxycinnamic acid and quinic acid (Figs. 1A and 2A, 1Band 2B; P < 0.05). However, the half-maximal inhibitory concentration of 2-hydroxycinnamic acid was lower than quinic acid at 120 h (IC50–120 h was 0.9000 and 1.278 mM, respectively) (Table 1). It is worth noting that the inhibition rates of all quinic acid treatment groups were slightly decreased from 96 to 120 h compared to when 2-hydroxycinnamic acid was used. 2-hydroxycinnamic acid and quinic acid had limited inhibitory effects on the growth of M. nitidum before 24 h (Figs. 1C and 1D; P > 0.05). Additionally, these potential allelochemicals had lower toxicity on the growth of M. nitidum compared to N. closterium (Fig. 1). Therefore, 2-hydroxycinnamic acid not only displayed a stronger allelopathic effect on the growth of N. closterium than quinic acid, but had limited inhibitory effects on the growth of M. nitidum before 24 h.
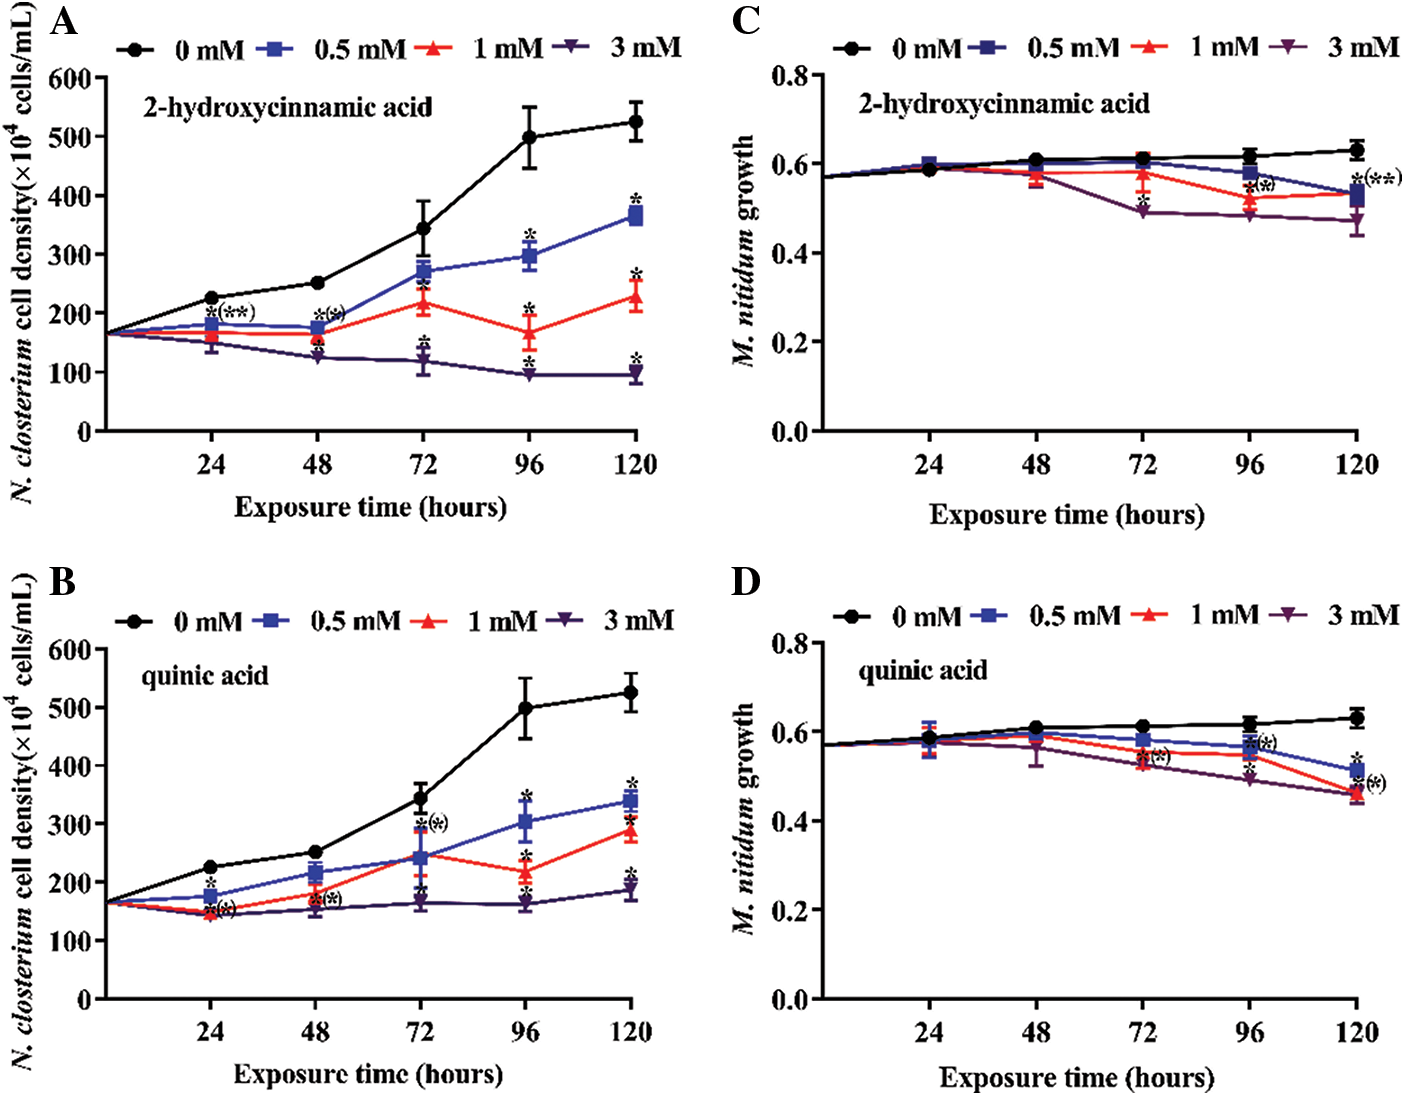
Figure 1: Inhibition effect of three concentrations of potential allelochemicals on the growth of N. closterium and M. nitidum: (A) N. closterium exposed to 2-hydroxycinnamic acid, (B) N. closterium exposed to quinic acid, (C) M. nitidum exposed to 2-hydroxycinnamic acid, (D) M. nitidum exposed to quinic acid. Unit: mM. The growth of M. nitidum is fresh wet (g). The change in N. closterium cell density indicates the inhibitory effect. The data are presented as mean ± standard deviation (n = 3). * indicates a significant difference compared with the controls, and * in brackets indicate a significant difference in overlapped plots (Student’s test, P < 0.05)

Figure 2: Inhibition rates of three concentrations of allelochemicals on N. closterium: (A) 2-hydroxycinnamic acid, (B) quinic acid. Unit: mM. The data are presented as the mean ± standard deviation (n = 3). Lowercase letters indicate significant differences (ANOVA/Tukey’s ANOVA, P < 0.05)

3.2 Effect of Potential Allelochemicals on the Pigment Content of N. closterium and M. nitidum
Three concentrations of potential allelochemicals 2-hydroxycinnamic acid and quinic acid were applied to explore their effect on the pigment content of N. closterium and M. nitidum over 120 h (Figs. 3 and 4). Overall, both 2-hydroxycinnamic acid and quinic acid decreased the pigment content of N. closterium, with the extent of the decrease depending on the concentration of 2-hydroxycinnamic acid or quinic acid (P < 0.05). The chl a and carotenoid pigment content of N. closterium was significantly decreased in a dose-dependent manner following 2-hydroxycinnamic acid exposure at concentrations above 0.5 mM (Figs. 3A and 3C; P < 0.05). However, only at concentrations of 3 mM did quinic acid significantly decrease the content of chl a and carotenoid from 48–72 h (Figs. 3D and 3F; P < 0.05). 0.5–1 mM quinic acid had a limited impact on chl c content on 120 h (Fig. 3E; P > 0.05), but 1 mM 2-hydroxycinnamic acid significantly decreased the chl c content (Fig. 3B; P < 0.05) on 120 h. Additionally, the pigment content of all quinic acid treatment groups gradually recovered from 72–120 h (Figs. 3D to 3F). 2-hydroxycinnamic acid and quinic acid had limited inhibitory effects on the pigment content of M. nitidum before 24 h (Figs. 4A to 4F; P > 0.05). Therefore, 2-hydroxycinnamic acid not only displayed a stronger allelopathic effect on the pigment content of N. closterium than quinic acid, but had limited inhibitory effects on the pigment content of M. nitidum before 24 h.
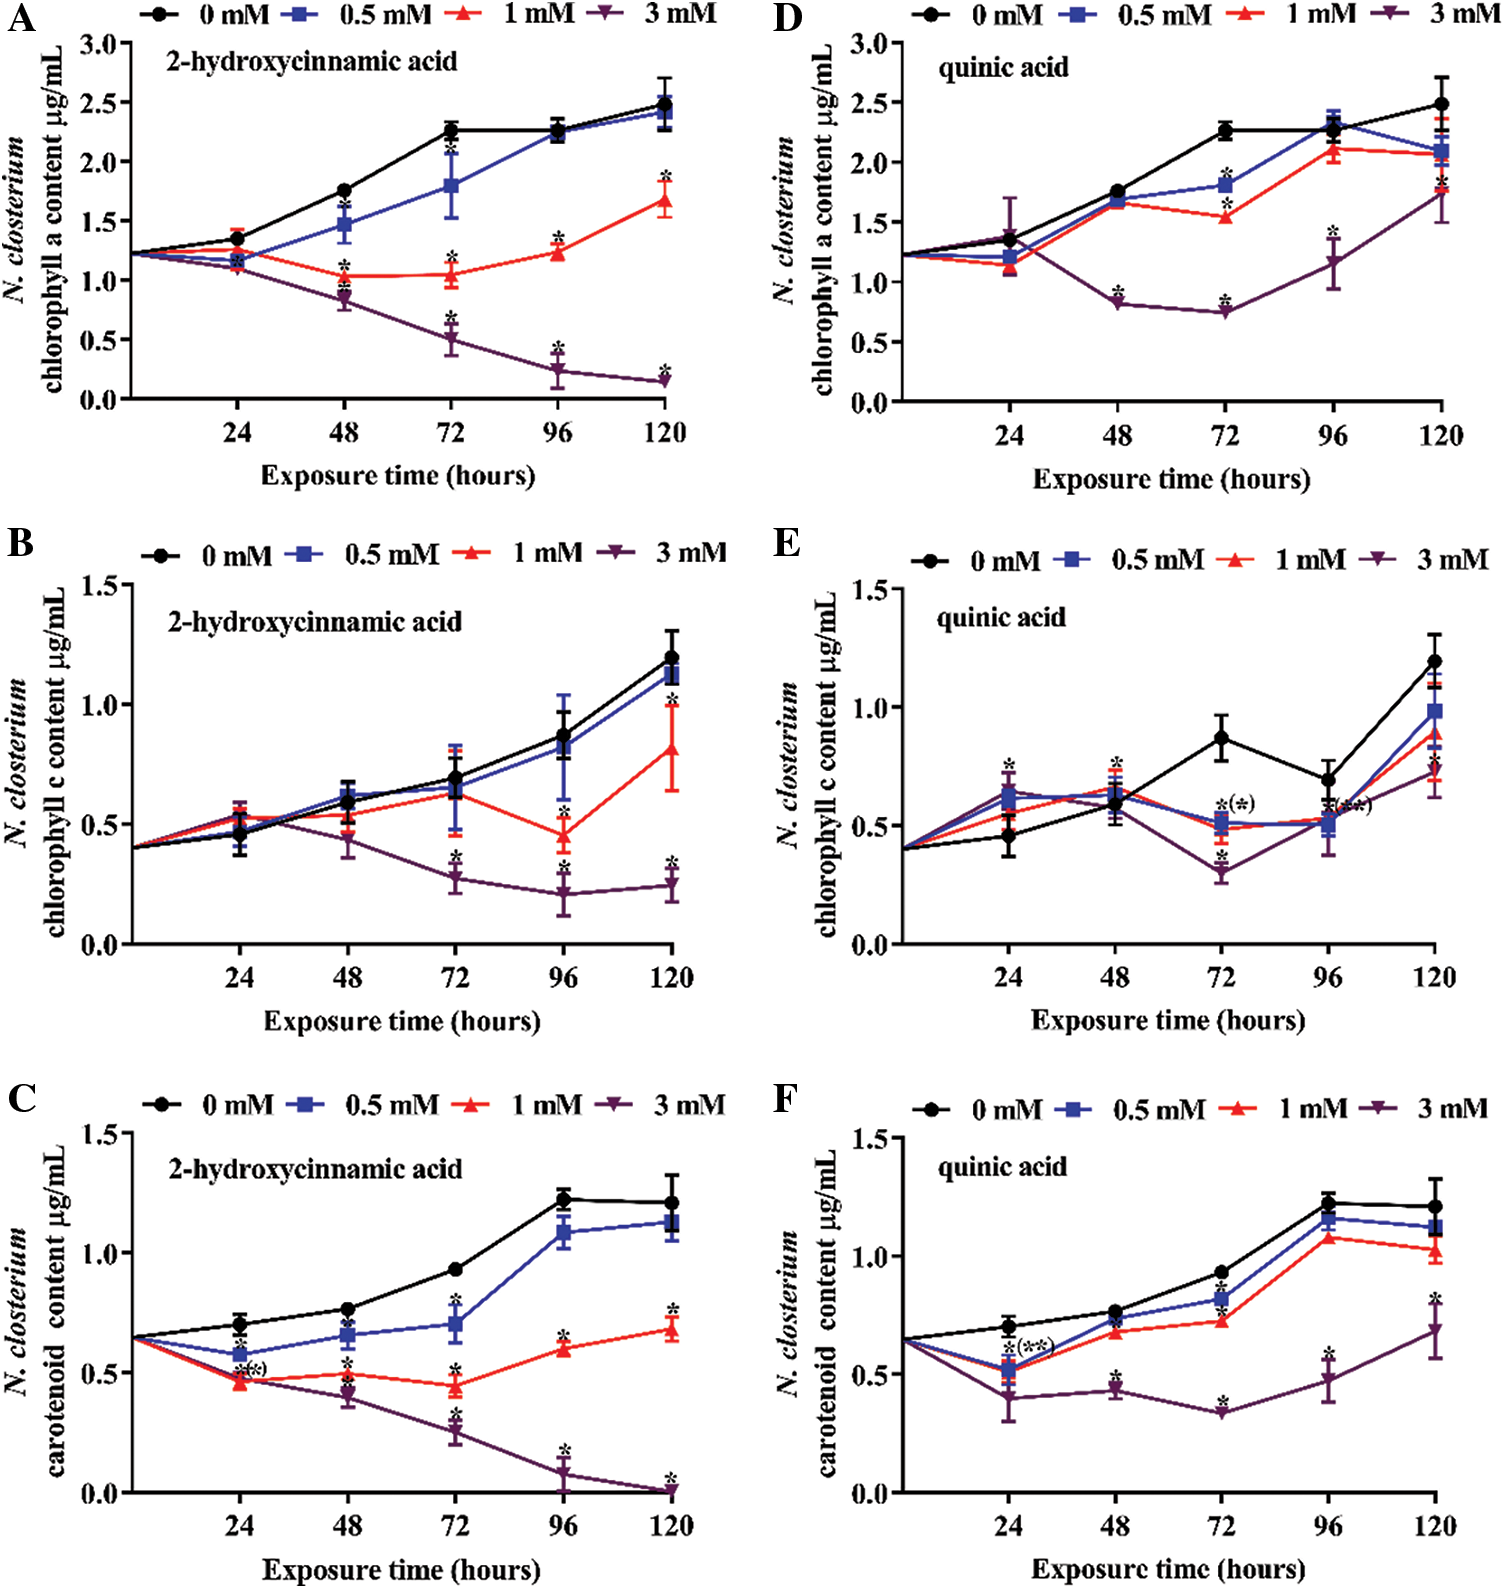
Figure 3: Pigment content of N. closterium exposed to three concentrations of the potential allelochemicals: (A) chl a exposed to 2-hydroxycinnamic acid, (B) chl c exposed to 2-hydroxycinnamic acid, (C) carotenoid exposed to 2-hydroxycinnamic acid, (D) chl a exposed to quinic acid, (E) chl c exposed to quinic acid, (F) carotenoid exposed to quinic acid. Unit: μg·mL−1. Changes in pigment content indicate changes in the physiology of N. closterium. The data are presented as the mean ± standard deviation (n = 3). * indicates a significant difference compared with the controls, and * in brackets indicate a significant difference in overlapped plots (Student’s test, P < 0.05)

Figure 4: Pigment content of M. nitidum exposed to three concentrations of the potential allelochemicals: (A) chl a exposed to 2-hydroxycinnamic acid, (B) chl b exposed to 2-hydroxycinnamic acid, (C) carotenoid exposed to 2-hydroxycinnamic acid, (D) chl a exposed to quinic acid, (E) chl b exposed to quinic acid, (F) carotenoid exposed to quinic acid. Unit: mg·g−1. Changes in pigment content indicate changes in the physiology of M. nitidum. The data are presented as the mean ± standard deviation (n = 3). * indicates a significant difference compared with the controls, and * in brackets indicate a significant difference in overlapped plots (Student’s test, P < 0.05)
3.3 Effect of Potential Allelochemicals on Photosynthetic Fluorescence of N. closterium and M. nitidum
Three concentrations of potential allelochemicals 2-hydroxycinnamic acid and quinic acid were applied to explore their effect on the photosynthetic efficiency of N. closterium and M. nitidum for 120 h (Fig. 5). Overall, these potential allelochemicals had relatively limited effect on the photosynthetic efficiency of N. closterium and M. nitidum excepted for 3 mM 2-hydroxycinnamic acid treatment groups of N. closterium after 24 h. The photosynthetic efficiency of 3 mM 2-hydroxycinnamic acid treatment groups of N. closterium almost disappeared before 24 h and was irreversible during this experiment (Fig. 5A). The photosynthetic efficiency of 3 mM 2-hydroxycinnamic acid treatment groups of M. nitidum was stable compared to the control before 24 h (Fig. 5C). To further investigate the allelopathic effect of 2-hydroxycinnamic acid and quinic acid, OJIP fluorescence transient of N. closterium were measured for 120 h (Figs. 6 and 7). Overall, both 2-hydroxycinnamic acid and quinic acid could reduce the OJIP fluorescence induction curves of N. closterium, with the extent of the reduction depending on the concentration of 2-hydroxycinnamic acid and quinic acid (Figs. 6 and 7; P < 0.05). Figs. 6 and 7 show that 0.5−1 mM of potential allelochemicals 2-hydroxycinnamic acid and quinic acid resulted in typical fluctuating OJIP fluorescence induction curves. However, when the concentration reached 3 mM, the fluorescence transient of N. closterium decreased significantly. Moreover, the fluorescence transient of N. closterium almost disappeared before 24 h in the 3 mM 2-hydroxycinnamic acid treatment group; additionally, the heterogeneous behaviour of the OJIP fluorescence induction curves for the 3 mM 2-hydroxycinnamic acid treatment groups was irreversible during this experiment. In contrast, although the OJIP fluorescence induction curves for the 3 mM quinic acid treatment group were significantly lower in intensity than that of the control, the intensity gradually recovered before 24 h.

Figure 5: Photosynthetic efficiency (Fv/Fm, the maximum quantum yield of photosystem II) of N. closterium and M. nitidum exposed to three concentrations of the potential allelochemicals: (A) N. closterium exposed to 2-hydroxycinnamic acid, (B) N. closterium exposed to quinic acid, (C) M. nitidum exposed to 2-hydroxycinnamic acid, (D) M. nitidum exposed to quinic acid. The data are presented as the mean ± standard deviation (n = 3)

Figure 6: Increase in fluorescence transients for N. closterium exposed to 2-hydroxycinnamic acid. A, B, C, D, and E represent N. closterium exposed to 2-hydroxycinnamic acid for 24, 48, 72, 96 and 120 h, respectively. O: initial fluorescence, J: fluorescence at 2 ms, I: fluorescence at 30 ms, P: maximum fluorescence. Unit: ms

Figure 7: Increase in fluorescence transients for N. closterium exposed to quinic acid. A, B, C, D, and E represent N. closterium exposed to quinic acid for 24, 48, 72, 96 and 120 h, respectively. O: initial fluorescence, J: fluorescence at 2 ms, I: fluorescence at 30 ms, P: maximum fluorescence. Unit: ms
To further explore the effect of potential allelochemicals 2-hydroxycinnamic acid and quinic acid on N. closterium, the relevant parameters obtained from the OJIP transients were applied to analyse the JIP test. The following results were obtained (Figs. 8 and 9). The phenomenological energy flux indices (TRo/CSo, ETo/CSo, DIo/CSo and ABS/CSo) and the density of the RC index (RC/CSo) fluctuated for all treatment groups but were always lower than for the control group. Regarding 0.5–1 mM 2-hydroxycinnamic acid treatment groups, except for the above-mentioned changes in phenomenological energy flux indices and the density of the RC index, there were limited changes in the specific energy flux indices (TRo/RC, ETo/RC, DIo/RC and ABS/RC) and yield or flux ratio indices (ψo and φEo) of N. closterium. Additionally, when the concentration of 2-hydroxycinnamic acid reached 3 mM, most relevant JIP test indicators were close to zero before 24 h. The quinic acid treatment groups displayed similar results for the change in TRo/CSo, ETo/CSo, DIo/CSo, ABS/CSo, RC/CSo, ψo and φEo, but quinic acid gradually increased the ABS/RC and DIo/RC in a dose-dependent manner. Additionally, although 3 mM quinic acid significantly decreased the TRo/CSo, ETo/CSo, DIo/CSo, ABS/CSo and RC/CSo, the ψo, φEo, TRo/RC, ETo/RC, DIo/RC and ABS/RC were similar to the control.

Figure 8: Effect of 2-hydroxycinnamic acid on chlorophyll fluorescence transient JIP parameters in N. closterium. A, B, C, D and E represent N. closterium exposed to 2-hydroxycinnamic acid for 24, 48, 72, 96 and 120 h, respectively. Each parameter is expressed as a fraction relative to the value of the control (regular circle with 100% = 1). Detailed physiological interpretations of each parameter are shown in Table 2

Figure 9: Effect of quinic acid on chlorophyll fluorescence transient JIP parameters in N. closterium. A, B, C, D and E represent N. closterium exposed to quinic acid for 24, 48, 72, 96 and 120 h, respectively. Each parameter is expressed as a fraction relative to the value of the control (regular circle with 100% = 1). Detailed physiological interpretations of each parameter are shown in Table 2

Several previous studies have reported similar allelopathic effects of botanical allelochemicals, the major components of which are phenolic acids, organic acids, alkaloids, terpenoids and flavonoids [38]. For example, phenolic acids 2-phenylphenol, p-hydroxybenzoic acid, protocatechuic acid, ellagic acid, gallic acid, p-coumaric acid and vanillic acid have effective allelopathic effects on the growth of harmful algae [48–53]. Additionally, some organic acids such as quinic acid, hexanedioic acid, linoleic acid, α-linoleic acid, palmitic acid and azelaic acid also exhibit strong allelopathic potential on controlling harmful algae [54–58]. However, Nakai et al. found that quinic acid had no algal suppression effect [19]. This phenomenon might be due to allelochemicals showing high species specificity in suppressing algae [59–61]. Furthermore, allelochemicals that contain hydroxyl groups and benzene rings may exert more effective allelopathic effects on algal growth [28]. Changes to the pigment of algae indicate that the photosynthetic activity of algal cells is affected. For example, a decrease in pigment content means that cellular resistance has decreased; an increase in pigment content is indicative of the amelioration of photochemical loss [62]. In the present study, 2-hydroxycinnamic acid—which contains hydroxyl groups and benzene rings—showed a better allelopathic effect on N. closterium than quinic acid—which contains no benzene rings (Figs. 1A and 1B and 2 and 3A to 3F)—with IC50–120 h values of 0.9000 and 1.278 mM, respectively (Table 1). Additionally, these potential allelochemicals had limited inhibitory effects on M. nitidum (Figs. 1C and 1D and 4A to 4F). Hence, 2-hydroxycinnamic acid not only displayed a stronger allelopathic potential on the growth of N. closterium than quinic acid, but had relatively little effect on M. nitidum.
A decrease in photosynthetic efficiency and kinetics and magnitude of fluorescence intensity can be indicative of a decrease in algal state or biomass [41,45,63]. Additionally, a decrease in the kinetics and magnitude of fluorescence intensity (reduction in the O-point, J-point, I-point and P-point) can indicate an increase in the number of non-QB acceptors in PS II, which blocks electron transport from plastoquinone combined with D1 protein (QA) to plastoquinone combined with D2 protein (QB) [42,43,64–69]. In the present study, 3 mM 2-hydroxycinnamic acid showed a better allelopathic effect on the photosynthetic efficiency of N. closterium than quinic acid before 24 h (Figs. 5A and 5B). Additionally, both 3 mM 2-hydroxycinnamic and quinic acid had relatively little effect on the photosynthetic efficiency of M. nitidum before 24 h (Figs. 5C and 5D). Hence, 3 mM 2-hydroxycinnamic acid could not only more effectively reduce the photosynthetic efficiency of N. closterium than quinic acid, but also had minimal effect on M. nitidum before 24 h. Further studies revealed that both 3 mM 2-hydroxycinnamic and quinic acid significantly decreased the OJIP kinetics and magnitude (Figs. 6 and 7). In especially, 3 mM 2-hydroxycinnamic showed a better allelopathic effect on the OJIP kinetics and magnitude of N. closterium than quinic acid. Hence, both 3 mM 2-hydroxycinnamic acid and quinic acid could block electron transport from QA to QB in N. closterium. In which, 3 mM 2-hydroxycinnamic showed more effective block on electron transport of N. closterium than quinic acid.
The decrease in phenomenological energy flux indexes (TRo/CSo, ETo/CSo, DIo/CSo and ABS/CSo) and the density of the RC index (RC/CSo) could be indicative that excessive excitation energy accumulated in the RCs. This would convert active centres into inactive centres (RC/CSo), impeding energy absorption efficiency (ABS/CSo) and decreasing the photon trapping rate (TRo/CSo), electron transport (ETo/CSo) and energy dissipation (DIo/CSo) in PSII [28,36,70,71]. The increase in ABS/RC represented an enhancement in the effective antenna size of active unit RC, which meant that some active RCs in PSII converted to inactive RCs (dissipation sinks) and that part of the unit RC enhanced energy absorption to offset the reduction in electron transport [72–75]. Additionally, changes in TRo/RC, ETo/RC and DIo/RC are usually attributed to changes in ABS/RC. Reports have shown that PSII downregulates the RCs and upregulates dissipation (DIo/RC) to maintain absorption (ABS/RC), capture (TRo/RC) and the electron transport balance in response to stress [63,76–78]. In the present study, 0.5–1 mM 2-hydroxycinnamic decreased the phenomenological energy flux indexes and density of the RC index, but had limited effect on the specific energy flux and yield or flux ratio indices. 3 mM 2-hydroxycinnamic acid let most of relevant JIP test indicators close to zero before 24 h. In contrast, all concentrations of quinic acid not only decreased the phenomenological energy flux indexes and density of the RC index, but increased the specific energy flux indices. Therefore, according to the OJIP and JIP results in the present study (Figs. 6 to 9), it was believed that 2-hydroxycinnamic acid impacted the photosynthetic efficiency of N. closterium mainly by downregulating the PSII RC density to reduce the QA photochemical redox reaction and decrease electron transport capacity. When the 2-hydroxycinnamic acid concentration reached 3 mM, the whole photosynthetic system was destroyed before 24 h. Compared to 2-hydroxycinnamic acid, quinic acid impacted the photosynthetic efficiency of N. closterium by changing the effective antenna size of unit RCs and downregulating the PSII RC density. Even at a quinic acid concentration of 3 mM, N. closterium still could enhance the dissipation and efficiency of unit RCs to offset overall photosynthetic efficiency declines.
The present study showed 2-hydroxycinnamic acid to decrease the photosynthetic efficiency of N. closterium by destroying the PSII reaction centre, thus inhibiting its growth. Quinic acid changed the effective antenna size of unit reaction centres and downregulated the PSII reaction centre density, thereby impacting the photosynthetic efficiency and growth of N. closterium. 3 mM 2-hydroxycinnamic acid displayed stronger allelopathic potential on the PSII reaction centres compared to quinic acid. Additionally, 3 mM 2-hydroxycinnamic acid had minimal effects on M. nitidum before 24 h. Thus, short-term treatment of 2-hydroxycinnamic acid maybe consider as a new strategy to control diatom felt bloom the high-density seaweed farming areas.
Authorship: Data curation, B.H.; formal analysis, E.X. and J.C.; funding acquisition, E.X. and J.C.; investigation, B.H., Y.R., X.C., Y.H., J.C. and E.X.; methodology, B.H. and J.C.; project administration, E.X. and J.C.; resources, E.X. and J.C.; writing—original draft, B.H.; writing—review & editing, B.H. and J.C. All authors have read and agreed to the published version of the manuscript.
Funding Statement: This study was sponsored by the Ph.D. Start-Up Foundation of Guangdong Ocean University (R19049), Science and Technology Planning Project of Guangdong (2017A030303078), and Undergraduate Start-Up Foundation of Guangdong Ocean University (580520135 and 570119011).
Conflicts of Interest: The authors declare that they have no conflicts of interest to report regarding the present study.
References
1. Yang, M. S., Sun, Y. H., Chen, G. M., Wang, G. Y., Lin, S. Z. et al. (2020). Preparation of a self-healing silicone coating for inhibiting adhesion of benthic diatoms. Materials Letters, 268, 127496. [Google Scholar]
2. Cao, S. (2013). Research on adhesion mechanism and antifouling technologies of a marine benthic diatom (Ph.D. Thesis). Tsinghua University, China. [Google Scholar]
3. Guo, X. J. (2017). Experimental study on adhesion mechanism of two marine benthic diatoms (Master Thesis). Xiamen University, China. [Google Scholar]
4. Jacobs, R. M., Noten, T. A. (1980). The annual pattern of the diatoms in the epiphyton of Eelgrass (Zostera marina L.) at Roscoff. France Aquatic Botany, 8, 355–370. [Google Scholar]
5. Giebrecht, W., Neapel, Z. Z. (1982). Systematik und faunistic der pelagischen copepoden des golfes von neapel und der angrenzenden Meeres-Abschnitte. Berlin: Friedländer. [Google Scholar]
6. Oppenheim, D. R. (1987). Frequency distribution studies of epipelic diatoms along an intertidal shore. Helgoländer Meeresuntersuchungen, 41(2), 139–148. [Google Scholar]
7. Round, F. E., Bukhtiyarova, L. (1996). Epipsammic diatoms-communities of british rivers. Diatom Research, 11(2), 47–53. [Google Scholar]
8. Seve, M. D., Goldstein, M. E. (1981). The structure and composition of epilithic diatom communities of the St. Lawrence and Ottawa rivers in the Montreal area. Canadian Journal of Botany, 59(3), 377–387. [Google Scholar]
9. Tiffany, M. A. (2011). Epizoic and epiphytic diatoms. In: The diatom world, pp. 195–209. Dordrecht: Springer. [Google Scholar]
10. Lee, S. J., Park, S. W., Lee, J. H., Kim, Y. S. (2012). Diseases of the cultivated Porphyra at seocheon area. Journal of Fish Pathology, 25(3), 249–256. [Google Scholar]
11. Ward, G. M., Faisan, J. P., Cottier-Cook, E. J., Gachon, C., Hurtado, A. Q. et al. (2020). A review of reported seaweed diseases and pests in aquaculture in Asia. Journal of the World Aquaculture Society, 51(4), 815–828. [Google Scholar]
12. Gachon, C., Sime-Ngando, T., Strittmatter, M., Chambouvet, A., Kim, G. H. (2010). Algal diseases: Spotlight on a black box. Trends in Plant Science, 15(11), 633–640. [Google Scholar]
13. Kim, G. H., Moon, K. H., Kim, J. Y., Shim, J., Klochkova, T. A. (2014). A revaluation of algal diseases in Korean Pyropia (Porphyra) sea farms and their economic impact. Algae, 29(4), 249–265. [Google Scholar]
14. Imai, I., Yamaguchi, M., Hori, Y. (2006). Eutrophication and occurrences of harmful algal blooms in the Seto Inland Sea, Japan. Plankton and Benthos Research, 1(2), 71–84. [Google Scholar]
15. Nishikawa, T., Hori, Y., Tanida, K., Imai, I. (2007). Population dynamics of the harmful diatom Eucampia zodiacus Ehrenberg causing bleachings of Porphyra thalli in aquaculture in Harima-Nada, the Seto Inland Sea. Japan Harmful Algae, 6(6), 763–773. [Google Scholar]
16. Behera, D. P., Ingle, K. N., Mathew, D. E., Dhimmar, A., Sahastrabudhe, H. et al. (2022). Epiphytism, diseases and grazing in seaweed aquaculture: A comprehensive review. Reviews in Aquaculture, 1–26. [Google Scholar]
17. Ma, J. H. (1996). Studies on the prevention and cure for diatom felt disease of Porphyra yezoensis. Journal of Shanghai Fisheries University, 5, 164–169. [Google Scholar]
18. Jeong, J. H., Jin, H. J., Sohn, C. H., Suh, K. H., Hong, Y. K. (2000). Algicidal activity of the seaweed Corallina pilulifera against red tide microalgae. Journal of Applied Phycology, 12(1), 37– 43. [Google Scholar]
19. Nakai, S., Inoue, Y., Hosomi, M. (2001). Algal growth inhibition effects and inducement modes by plant-producing phenols. Water Research, 35(7), 1855–1859. [Google Scholar]
20. Wang, R. J., Xiao, H., Wang, Y., Zhou, W., Tang, X. (2007). Effects of three macroalgae, Ulva linza (ChlorophytaCorallina pilulifera (Rhodophyta) and Sargassum thunbergii (Phaeophyta) on the growth of the red tide microalga Prorocentrum donghaiense under laboratory conditions. Journal of Sea Research, 58(3), 189–197. [Google Scholar]
21. Tang, Y. Z., Gobler, C. J. (2011). The green macroalga, Ulva lactuca, inhibits the growth of seven common harmful algal bloom species via allelopathy. Harmful Algae, 10(5), 480–488. [Google Scholar]
22. Cai, Z. P., Zhu, H. H., Duan, S. S. (2014). Allelopathic interactions between the red-tide causative dinoflagellate Prorocentrum donghaiense and the diatom Phaeodactylum tricornutum. Oceanologia, 56(3), 639–650. [Google Scholar]
23. Nakai, S., Hosomi, M. (2002). Allelopathic inhibitory effects of polyphenols released by Myriophyllum spicatum on algal growth. Allelopathy Journal, 10(2), 123–131. [Google Scholar]
24. Murray, D., Jefferson, B., Jarvis, P., Parsons, S. A. (2010). Inhibition of three algae species using chemicals released from barley straw. Environmental Technology, 31(4), 455–466. [Google Scholar]
25. Huang, H., Xiao, X., Ghadouani, A., Wu, J., Nie, Z. et al. (2015). Effects of natural flavonoids on photosynthetic activity and cell integrity in Microcystis aeruginosa. Toxins, 7(1), 66–80. [Google Scholar]
26. Zuo, S., Zhou, S., Ye, L., Ma, S. (2016). Synergistic and antagonistic interactions among five allelochemicals with antialgal effects on bloom-forming Microcystis aeruginosa. Ecological Engineering, 97, 486–492. [Google Scholar]
27. Zhou, L., Chen, G., Cui, N., Pan, Q., Song, X. et al. (2019). Allelopathic effects on Microcystis aeruginosa and allelochemical identification in the cuture solutions of typical artificial floating-bed plants. Bulletin of Environmental Contamination and Toxicology, 102(1), 115–121. [Google Scholar]
28. Chen, Q., Sun, D., Fang, T., Zhu, B., Liu, W. et al. (2021a). In vitro allelopathic effects of compounds from Cerbera manghas L. on three Dinophyta species responsible for harmful common red tides. Science of the Total Environment, 754, 142253. [Google Scholar]
29. Bryant, D. A. (1996). The molecular biology of cyanobacteria. In: Molecular characterization and evolution of sequences encoding light harvesting components in the chromatically adapting cyanobacterium fremyella diplosiphon, pp. 559–579. Amsterdam: Kluwer Academic Publishers. [Google Scholar]
30. Eullaffroy, P., Vernet, G. (2003). The F684/F735 chlorophyll fluorescence ratio: A potential tool for rapid detection and determination of herbicide phytotoxicity in algae. Water Research, 37(9), 1983–1990. [Google Scholar]
31. Yang, C. Y., Zhou, J., Liu, S. J., Fan, P., Wang, W. et al. (2013). Allelochemical induces growth and photosynthesis inhibition, oxidative damage in marine diatom Phaeodactylum tricornutum. Journal of Experimental Marine Biology and Ecology, 444, 16–23. [Google Scholar]
32. Li, Q., Lu, Y., Shi, Y., Wang, T., Ni, K. et al. (2013). Combined effects of cadmium and fluoranthene on germination, growth and photosynthesis of soybean seedlings. Journal of Environmental Sciences, 25(9), 1936–1946. [Google Scholar]
33. Qian, H. F., Xu, J. H., Lu, T., Zhang, Q., Qu, Q. et al. (2018). Responses of unicellular alga Chlorella pyrenoidosa to allelochemical linoleic acid. Science of the Total Environment, 625, 1415–1422. [Google Scholar]
34. Zhu, J. Y., Liu, B. Y., Wang, J., Gao, Y., Wu, Z. (2010). Study on the mechanism of allelopathic influence on cyanobacteria and chlorophytes by submerged macrophyte (Myriophyllum spicatum) and its secretion. Aquatic Toxicology, 98(2), 196–203. [Google Scholar]
35. Tan, K., Huang, Z., Ji, R., Qiu, Y., Wang, Z. et al. (2019). A review of allelopathy on microalgae. Microbiology, 165(6), 587–592. [Google Scholar]
36. Zhang, D. Y., Pan, X. L., Mu, G. J., Wang, J. (2010). Toxic effects of antimony on photosystem II of Synechocystis sp. as probed by in vivo chlorophyll fluorescence. Journal of Applied Phycology, 22(4), 479–488. [Google Scholar]
37. Zheng, J. W., Mao, X. T., Ye, M. H., Li, H. Y., Liu, J. S. et al. (2021). Allelopathy and underlying mechanism of Karenia mikimotoi on the diatom Thalassiosira pseudonana under laboratory condition. Algal Research, 54, 102229. [Google Scholar]
38. Zhu, X. Q., Dao, G. H., Tao, Y., Zhan, X., Hu, H. (2021). A review on control of harmful algal blooms by plant-derived allelochemicals. Journal of Hazardous Materials, 401, 123403. [Google Scholar]
39. Chen, S. X., Luo, S. S., Zhang, J. A., Li, C. L., Huang, X. H. (2021b). Effects of salinity on growth and biochemical components of microalga Thalassiosira weissflogii. Journal of Guangdong Ocean University, 41, 53–59. [Google Scholar]
40. Wang, X. L., Liu, D. C., Xu, R. S., Chen, H. S. (2020). Effects of two types of inorganic iron on the growth, iron content and physiological characteristics of Caulerpa lentillifera. Journal of Guangdong Ocean University, 40, 20–27. [Google Scholar]
41. Strasser, R. J., Srivastava, A., Tsimilli-Michael, M. (2000). The fluorescence transient as a tool to characterize and screen photosynthetic samples. In: Probing photosynthesis: Mechanisms, regulation and adaptation, pp. 445–483. London, New York: Taylor & Francis Inc. [Google Scholar]
42. Strasser, R. J., Srivastava, A., Tsimilli-Michael, M. (2004). Analysis of the chlorophyll a fluorescence transient. In: Chlorophyll a fluorescence, pp. 1–42. Dordrecht: Springer. [Google Scholar]
43. Strasser, R. J., Tsimilli-Michael, M., Dangre, D., Rai, M. (2007). Biophysical phenomics reveals functional building blocks of plants systems biology: A case study for the evaluation of the impact of mycorrhization with piriformospora indica. In: Varma, A., Oelmüler, R. (Eds.Advanced techniques in soil microbiology, soil biology, pp. 319–341. Berlin Heidelberg: Springer. [Google Scholar]
44. Jiang, H. X., Chen, L. S., Zheng, J. G., Han, S., Tang, N. et al. (2008). Aluminum-induced effects on Photosystem II photochemistry in Citrus leaves assessed by the chlorophyll a fluorescence transient. Tree Physiology, 28(12), 1863–1871. [Google Scholar]
45. Sun, D., He, N., Chen, Q., Duan, S. S. (2019). Effects of lanthanum on the photosystem II energy fluxes and antioxidant system of Chlorella Vulgaris and Phaeodactylum Tricornutum. International Journal of Environmental Research and Public Health, 16(12), 2242. [Google Scholar]
46. Kula, M., Kalaji, H. M., Skoczowski, A. (2017). Culture density influence on the photosynthetic efficiency of microalgae growing under different spectral compositions of light. Journal of Photochemistry and Photobiology B: Biology, 167, 290–298. [Google Scholar]
47. Wang, Y. M., Yang, R. X., Zheng, J. Y., Shen, Z., Xu, X. (2019). Exogenous foliar application of fulvic acid alleviate cadmium toxicity in lettuce (Lactuca sativa L.). Ecotoxicology and Environmental Safety, 167, 10–19. [Google Scholar]
48. Xian, Q. M., Chen, H. D., Liu, H. L., Zou, H., Yin, D. (2006). Isolation and identification of antialgal compounds from the leaves of Vallisneria spiralis L. by activity-guided fractionation. Environmental Science and Pollution Research, 13(4), 233–237. [Google Scholar]
49. Hong, Y., Hu, H. Y., Xie, X., Li, F. M. (2008). Responses of enzymatic antioxidants and non-enzymatic antioxidants in the cyanobacterium Microcystis aeruginosa to the allelochemical ethyl 2-methyl acetoacetate (EMA) isolated from reed (Phragmites communis). Journal of Plant Physiology, 165(12), 1264–1273. [Google Scholar]
50. Zhang, W. H., Hu, G. J., He, W., Zhou, L. F., Wu, X. G. et al. (2009). Allelopathic effects of emergent macrophyte, Acorus calamus L. on Microcystis aeruginosa Kuetzing and Chlorella pyrenoidosa Chick. Allelopathy Journal, 24, 157–168. [Google Scholar]
51. Nakai, S., Asaoka, S., Okuda, T., Nishijima, W. (2014). Growth inhibition of Microcystis aeruginosa by allelopathic compounds originally isolated from Myriophyllum spicatum: Temperature and light effects and evidence of possible major mechanisms. Journal of Chemical Engineering of Japan, 47(6), 488–493. [Google Scholar]
52. Schandry, N., Becker, C. (2020). Allelopathic plants: Models for studying plant interkingdom interactions. Trends in Plant Science, 25(2), 176–185. [Google Scholar]
53. Li, B. H., Yin, Y. J., Kang, L. F., Feng, L., Liu, Y. et al. (2021). A review: Application of allelochemicals in water ecological restoration--algal inhibition. Chemosphere, 267, 128869. [Google Scholar]
54. Della, G. M., Ferrara, M., Fiorentino, A., Monaco, P., Previtera, L. (1998). Antialgal compounds from Zantedeschia aethiopica. Phytochemistry, 49(5), 1299–1304. [Google Scholar]
55. Choe, S., Jung, I. H. (2002). Growth inhibition of freshwater algae by ester compounds released from rotted plants. Journal of Industrial and Engineering Chemistry, 8(4), 297–304. [Google Scholar]
56. Liu, H., He, L., Gao, J., Ma, Y. B., Zhang, X. M. et al. (2008). Chemical constituents from the aquatic weed Pistia stratiotes. Chemistry of Natural Compounds, 44(2), 236–238. [Google Scholar]
57. Dong, J., Chang, M., Li, C., Dai, D., Gao, Y. (2019). Allelopathic effects and potential active substances of Ceratophyllum demersum L. on Chlorella vulgaris Beij. Aquatic Ecology, 53(4), 651–663. [Google Scholar]
58. Lan, Y., Chen, Q., Gou, T., Sun, K., Zhang, J. et al. (2020). Algicidal activity of Cyperus rotundus aqueous extracts reflected by photosynthetic efficiency and cell integrity of harmful algae Phaeocystis globosa. Water, 12(11), 3256. [Google Scholar]
59. Mohamed, Z. A., Al Shehri, A. M. (2010). Differential responses of epiphytic and planktonic toxic cyanobacteria to allelopathic substances of the submerged macrophyte Stratiotes aloides. International Review of Hydrobiology, 95(3), 224–234. [Google Scholar]
60. Wang, J., Zhu, J. Y., Gao, Y. N., Liu, B. Y., Liu, S. P. et al. (2013). Toxicity of allelochemicals released by submerged macrophytes on phytoplankton. Allelopathy Journal, 31(1), 199–209. [Google Scholar]
61. Xu, C. C., Ge, Z. W., Li, C., Wan, F., Xiao, X. (2019). Inhibition of harmful algae Phaeocystis globosa and Prorocentrum donghaiense by extracts of coastal invasive plant Spartina alterniflora. Science of the Total Environment, 696, 133930. [Google Scholar]
62. Hong, Y., Huang, J. J., Hu, H. Y. (2009). Effects of a novel allelochemical Ethyl 2-Methyl Acetoacetate (EMA) on the ultrastructure and pigment composition of cyanobacterium Microcystis aeruginosa. The Bulletin of Environmental Contamination and Toxicology, 83(4), 502–508. [Google Scholar]
63. Xia, J. R., Tian, Q. R. (2009). Early stage toxicity of excess copper to photosystem II of Chlorella pyrenoidosa-OJIP chlorophyll a fluorescence analysis. Journal of Environmental Sciences, 21(11), 1569–1574. [Google Scholar]
64. Anderson, J. M., Park, Y. I., Soon, W. S. (1998). Unifying model for the photoinactivation of Photosystem II in vivo under steady-state photosynthesis. Photosynthesis Research, 56(1), 1–13. [Google Scholar]
65. Lazar, D., Pospisil, P., Naus, J. (1999). Decrease of fluorescence intensity after the K step in chlorophyll a fluorescence induction is suppressed by electron acceptors and donors to photosystem 2. Photosynthetica, 37(2), 255–265. [Google Scholar]
66. Essemine, J., Govindachary, S., Ammar, S., Bouzid, S., Carpentier, R. (2012). Enhanced sensitivity of the photosynthetic apparatus to heat stress in digalactosyl-diacylglycerol deficient Arabidopsis. Environmental and Experimental Botany, 80, 16–26. [Google Scholar]
67. Oukarroum, A., Polchtchikov, S., Perreault, F., Popovic, R. (2012). Temperature influence on silver nanoparticles inhibitory effect on photosystem II photochemistry in two green algae, Chlorella vulgaris and Dunaliella tertiolecta. Environmental Science and Pollution Research, 19(5), 1755–1762. [Google Scholar]
68. Neelam, S., Subramanyam, R. (2013). Alteration of photochemistry and protein degradation of photosystem II from Chlamydomonas reinhardtii under high salt grown cells. Journal of Photochemistry and Photobiology: Biology, 124, 63–70. [Google Scholar]
69. Zhang, Y. L., Luo, H. H., Hu, Y. Y., Strasser, R. J., Zhang, W. F. (2013). Characteristics of Photosystem II behavior in cotton (Gossypium hirsutum L.) bract and Capsule Wall. Journal of Integrative Agriculture, 12(11), 2056–2064. [Google Scholar]
70. Chen, S. G., Yin, C. Y., Dai, X. B., Qiang, S., Xu, X. (2008). Action of tenuazonic acid, a natural phytotoxin, on photosystem II of spinach. Environmental and Experimental Botany, 62(3), 279–289. [Google Scholar]
71. Sen, A., Puthur, J. T. (2021). Halo- and UV-B priming-mediated drought tolerance and recovery in rice seedlings. Plant Stress, 2, 100011. [Google Scholar]
72. Force, L., Critchley, C., Rensen, J. (2003). New fluorescence parameters for monitoring photosynthesis in plants. Photosynthesis Research, 78(1), 17–33. [Google Scholar]
73. Perreault, F., Ali, N. A., Saison, C., Popovic, R., Juneau, P. (2009). Dichromate effect on energy dissipation of photosystem II and photosystem I in Chlamydomonas reinhardtii. Journal of Photochemistry and Photobiology B: Biology, 96(1), 24–29. [Google Scholar]
74. Sha, S., Cheng, M. H., Hu, K. J., Zhang, W., Yang, Y. et al. (2019). Toxic effects of Pb on Spirodela polyrhiza (L.Subcellular distribution, chemical forms, morphological and physiological disorders. Ecotoxicology and Environmental Safety, 181, 146–154. [Google Scholar]
75. Kreslavski, V. D., Strokina, V. V., Khudyakova, A. Y., Shirshikova, G. N., Kosobryukhov, A. A. et al. (2021). Effect of high-intensity light and UV-B on photosynthetic activity and the expression of certain light-responsive genes in A. thaliana phyA and phyB mutants. Biochimica et Biophysica Acta (BBA)-Bioenergetics, 1862(8), 148445. [Google Scholar]
76. Singh, S., Prasad, S. (2015). IAA alleviates Cd toxicity on growth, photosynthesis and oxidative damages in eggplant seedlings. Plant Growth Regulation, 77(1), 87–98. [Google Scholar]
77. Patel, A., Tiwari, S., Prasad, S. M. (2018). Toxicity assessment of arsenate and arsenite on growth, chlorophyll a fluorescence and antioxidant machinery in Nostoc muscorum. Ecotoxicology and Environmental Safety, 157, 369–379. [Google Scholar]
78. Tiwari, S., Patel, A., Prasad, S. M. (2018). Kinetin alleviates chromium toxicity on growth and PS II photochemistry in Nostoc muscorum by regulating antioxidant system. Ecotoxicology and Environmental Safety, 161, 296–304. [Google Scholar]
Cite This Article
 Copyright © 2023 The Author(s). Published by Tech Science Press.
This work is licensed under a Creative Commons Attribution 4.0 International License , which permits unrestricted use, distribution, and reproduction in any medium, provided the original work is properly cited.
 Downloads
 Citation Tools