| Phyton-International Journal of Experimental Botany |
DOI: 10.32604/phyton.2022.019468
ARTICLE
Response of Tomato Sugar and Acid Metabolism and Fruit Quality under Different High Temperature and Relative Humidity Conditions
1Jiangsu Provincial Key Laboratory of Agrometeorology, Nanjing University of Information Science and Technology, Nanjing, 210044, China
2Binjiang College, Nanjing University of Information Science and Technology, Wuxi, 214063, China
*Corresponding Author: Zaiqiang Yang. Email: yzq@nuist.edu.cn
Received: 26 September 2021; Accepted: 20 January 2022
Abstract: The combined stress of high temperature and high relative air humidity is one of the most serious agrometeorological disasters that restricts the production capacity of protected agriculture. However, there is little information about the precise interaction between them on tomato fruit quality. The objectives of this study were to explore the effects of the combined stress of high temperature and relative humidity on the sugar and acid metabolism and fruit quality of tomato fruits, and to determine the best relative air humidity for fruit quality under high temperature environments. Four temperature treatments (32°C, 35°C, 38°C, 41°C), three relative air humidity (50%, 70%, 90%) and four duration (3, 6, 9, 12 d) orthogonal experiments were conducted, with 28°C, 50% as control. The results showed that under high temperature and relative air humidity, the activity of sucrose metabolizing enzymes in young tomato fruits changed, which reduced fruits soluble sugar content; in addition, enzyme activities involved phosphopyruvate carboxylase (PEPC), mitochondria aconitase (MDH) and citrate synthetase (CS) increased which increased the content of organic acids (especially malic acid). Eventually, vitamin C, total sugar and sugar-acid ratio decreased significantly, while the titratable acid increased, resulting in a decrease in fruit flavor quality and nutritional quality in ripe fruit. Specifically, a temperature of 32°C and a relative air humidity of 70% were the best cultivation conditions for tomato reproductive growth period under high temperature. Our results indicating that fruit quality reduced under high temperature at the flowering stage, while increasing the relative air humidity to 70% could alleviate this negative effect. Our results are benefit to better understand the interaction between microclimate parameters under specific climatic conditions in the greenhouse environment and their impact on tomato flavor quality.
Keywords: Heat stress; relative air humidity; organic acid metabolism; fruit flavor quality; tomato
Nomenclature
| NI | Neutral invertase |
| AI | Acid invertase |
| SS-c | Sucrose synthase activity in the sucrose cleavage direction |
| SS-s | Sucrose synthase activity in the sucrose synthetic direction |
| SPS | Sucrose phosphate synthase |
| CA | Citric acid |
| Mal | Malic acid |
| TA | Tartaric acid |
| SA | Succinic acid |
| α-KG | α-Ketoglutaric acid |
| AA | Acetic acid |
| PEPC | Phosphopyruvate carboxylase |
| MDH | Malate dehydrogenase |
| ME | Malic enzyme |
| CS | Citrate synthetase |
| IDH | Isocitrate dehydrogenase |
| cyt-ACO | Cytoplasm aconitase |
| mit-ACO | Mitochondria aconitase |
| TSS | Total soluble solids |
| TAA | Titratable acid |
| VC | Vitamin C |
| TS | Total soluble sugar |
| S/A | Sugar and acid ratio |
| EP | Expansion period |
| PP | Pink period |
| MP | Maturing period |
The IPCC report predicts that by the end of this century, the global temperature will rise by more than 4°C [1]. Global warming is not only leading to an increase in the daily maximum temperature, but also to an increased occurrence of unusual extreme temperatures [2]. Heat stress has significant implications on seed germination, plant development, photosynthesis, and reproduction, which leads to reductions in plant growth and crop yield [3]. Tomato (Solanum lycopersicum) fruit is an important dual-use (vegetable and fruit) product. Because of their high nutritional value and delicious tastes, tomato fruit is widely consumed worldwide [4].
Tomato is one of the most widely consumed horticultural crops [2], because it is believed to minimize the risk of crop failure caused by pests, diseases, and abiotic stresses [5]. However, the heat generated by solar radiation in early summer greatly increased the temperature in the greenhouse, coupled with the strong air tightness and poor ventilation, resulting in the indoor temperature being 20°C–30°C higher than that of outdoor [6,7]. High temperatures have become a common weather condition in summer greenhouse. The extreme variations during hot summers can damage the intermolecular interactions needed for proper growth, thus impairing plant development and fruit set [8]. In tomato management strategies, breeders usually use cheap spray systems to cool down [9,10], which increases the relative air humidity in the greenhouse. However, continuous hot and humid weather is prone to outbreaks of many plant diseases [11]. Therefore, high temperature and high humidity environments may increase the risk of abiotic and biotic stress [12]. Thus, increasing resource use efficiency, while avoiding risks related to high relative humidity, is a key for sustainable greenhouse technology [13].
Prolonged exposure to high temperatures can cause changes that affect plant development, including vegetative growth and reproduction [2]. Tomato is particularly sensitive to heat stress during the reproductive phase, causing flower abortion and limited fruit set, and thereby leading to substantial yield loss [14]. In recent years, the heat-tolerance of tomato varieties has been improved, which has alleviated the problems of poor pollen fertility and low fruit setting under high temperature to a certain extent [15]. However, in order to obtain higher yield, breeders ignore the improvement of flavor quality, which depends on sugar, acid, suitable sugar-acid ratio and volatile aromatic substances [16]. Soluble sugars and organic acids are important components of other fruit quality (aroma volatiles, carotenoids) [17,18]. Zhang et al. [19] found that sub-high temperature (35°C) treatment during flowering reduced the sugar-acid ratio of tomato fruits. Gautier et al. [20] found that temperature increase in the early stage of fruit development mainly affected the primary metabolites (soluble sugars and organic acids); while the temperature change during the ripening period had a greater impact on the secondary metabolites [20–23]. These studies focus on a single high temperature factor. Researches on the combined stress of high temperature and high humidity are also mainly focus on plant growth and pollen activity [24–26]. However, to our knowledge, little is known about the effects of relative air humidity on the sugar and acid metabolism and fruit quality of tomato fruits under high temperature.
Therefore, artificial environment control experiment was conducted to investigate the effects of different air humidity on the sugar and acid metabolism and fruit quality of tomato fruit under continuous high temperature during flowering, and screen the best humidity for tomato fruit quality under high temperature. The results contribute to a better understanding of the interactions between microclimate parameters inside a venlo-type glass greenhouse environment in a specific climate condition, and their effects on tomato flavor quality.
The experiment was conducted in a venlo glass greenhouse at the agricultural meteorological test station of Nanjing University of Information Science and Technology (32°12´36"N, 118°43´1"E and 29 m above mean sea level) in Nanjing, Jiangsu Province, China. The greenhouse structure has an area of 30 m in length × 9.6 m in width, 4.5 m in height with north-south orientation (Fig. 1), covered with a 4 mm float glass with transmittance greater than 89% [27]. The study area experiences a subtropical monsoon climate. The annual average temperature is 15.4°C, and the annual extreme maximum and minimum temperatures are 39.7°C and −13.1°C, respectively [28]. The average annual rainfall is 117 days, and it occurred mainly from late June to early July, along with the precipitation of 1106 mm, relative humidity of 76%, sunshine hours of 1403 h [29]. An automatic weather station Watchdog 2000 (Spectrum Technologies Inc., USA) placed 1.5 m from the ground in the greenhouse was used to measure air temperature, relative air humidity and solar radiation. The data acquisition frequency was 1 time every 10 s, and the average value every 30 min was stored.
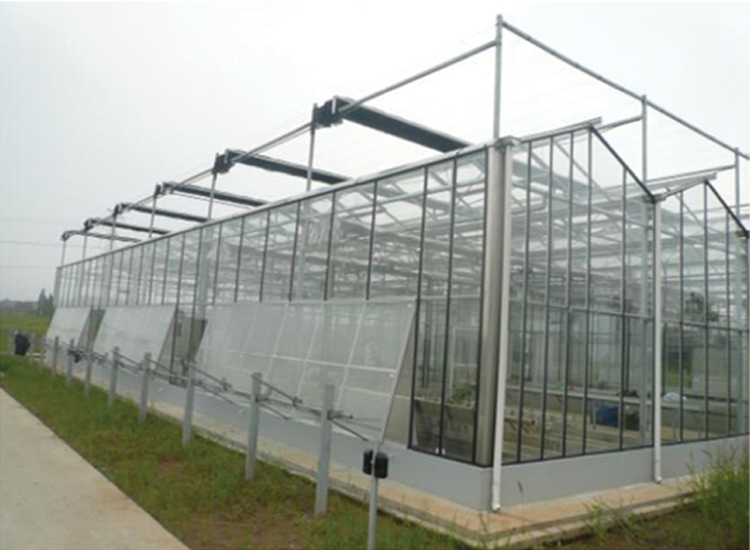
Figure 1: Exterior view of venlo glass greenhouse in Nanjing, China. The greenhouse structure has an area of 30 m in length × 9.6 m in width, 4.5 m in height with north-south orientation
The tomato seedlings (“Pink Roland”) were transplanted during 3–4 true-leaf stage in 28 cm (height) × 34 cm (bottom diameter) pots on 25 August 2018 and harvested on 16 January 2019. The contents of organic carbon, nitrogen, available phosphorus (P) and available potassium (K) of the soil in the pot were 116000, 1900, 29.3 and 94.2 mg kg−1, respectively. Design orthogonal test according to three factors: air temperature (T), relative air humidity (RH), and treatment days (D). The experiment had four T treatments (32°C, 35°C, 38°C, 41°C), three RH treatments (50%, 70%, 90%), and four D treatments (3 d, 6 d, 9 d, 12 d). The control (CK) was set to 26°C, 50%. The seventeen treatments were presented in Table 1. Treatments were replicated three times.
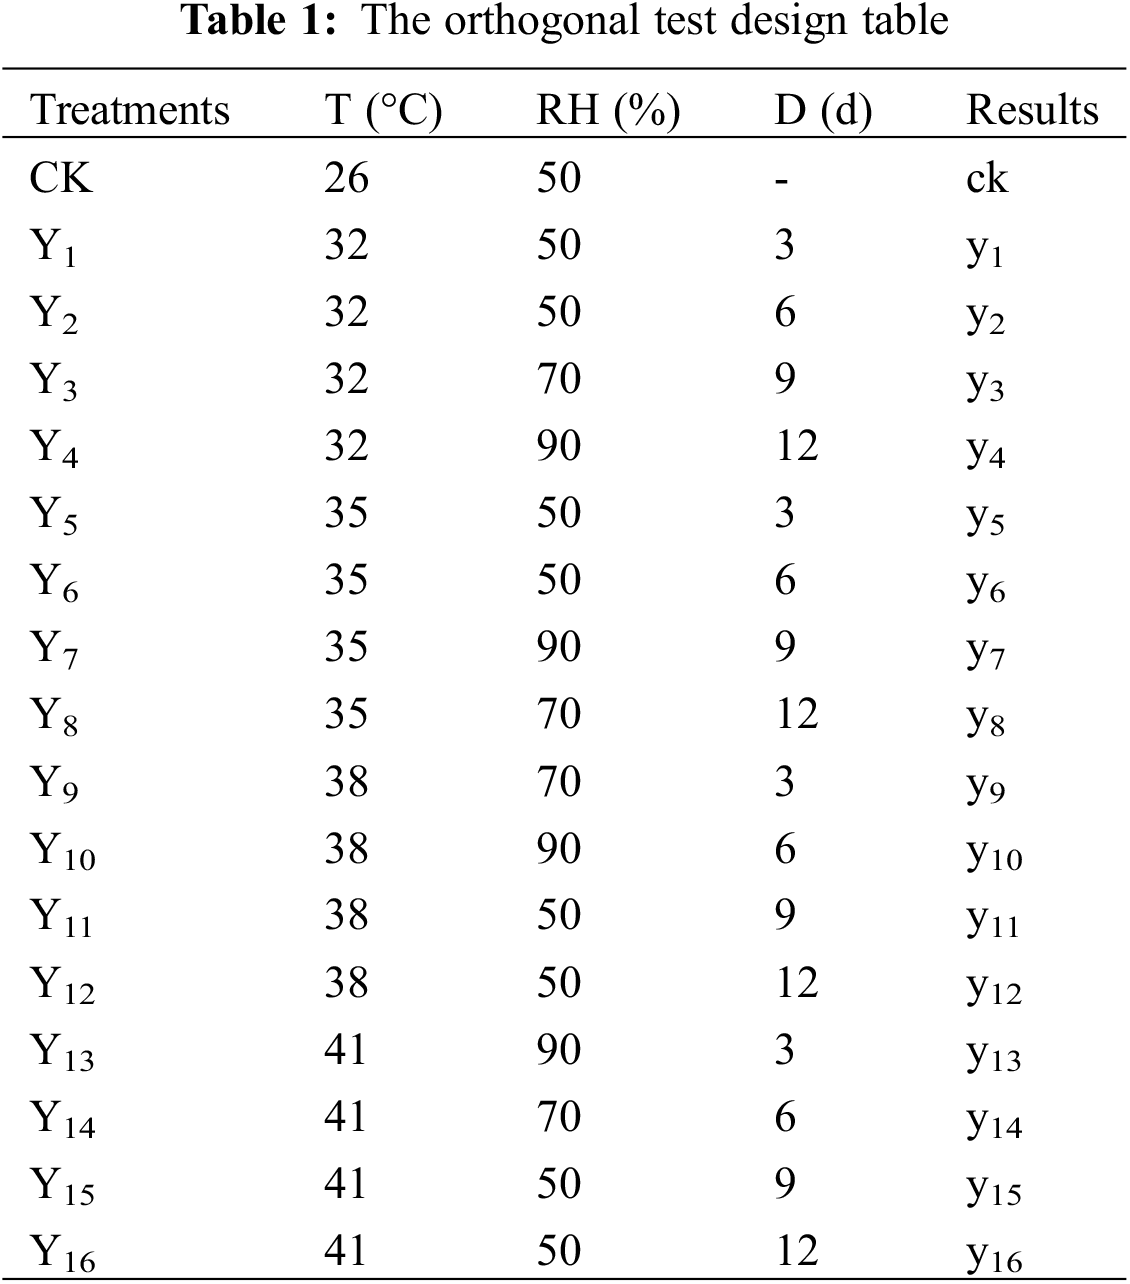
We selected plants with similar growth trend after planting, and placed them in the artificial climate chamber (TPG1260, Thermoline, Australia) for high temperature treatment at the flowering stage (14–28 d after planting). 20 pots of plants were selected per treatment, and the existing inflorescences of the tomato were marked before treatment. The temperature in the artificial climate chamber was set according to the neural network method of simulating the daily change of summer temperature in the glasshouse in Nanjing [30], and the temperature setting was shown in Fig. 2. The relative air humidity and processing days were set according to Table 1. During the treatment, the photoperiod in artificial climate chamber was set to 12 h (6:00–18:00), and the photosynthetically active radiation (PAR) was 1000 μmol m−2 s−1, and the CO2 concentration was 400 ppm. The treated tomato plants were returned to the greenhouse for daily cultivation and management.
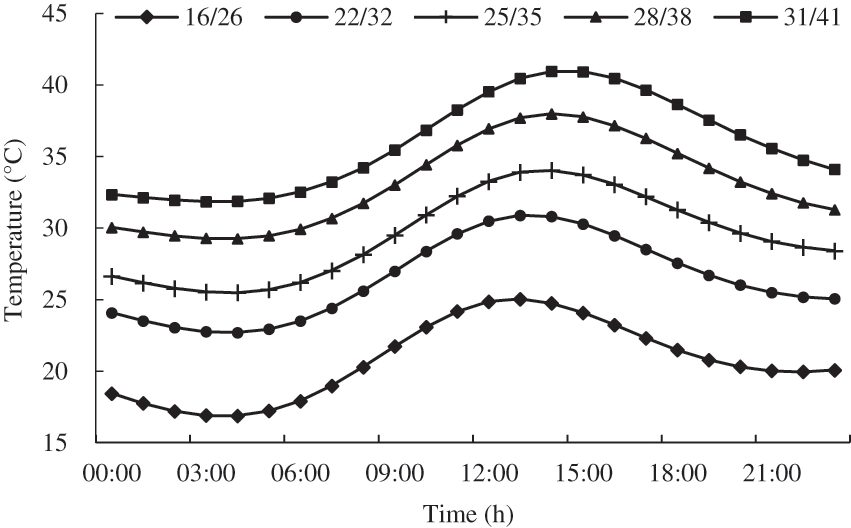
Figure 2: Design of temperature daily variation in the artificial climate chamber (night/day)
The experimental cultivation was from August 25, 2018 to January 16, 2019. The daily average air temperatures in greenhouse during the cultivation period decreased with time over the growing season, ranging from 30.95°C to 7.31°C, and the average temperature was 17.84°C. The daily average relative air humidity in greenhouse during this period ranged from 47.73% to 93.30%, and the average relative humidity was 70.84% (Fig. 3A). The daily solar radiation at the study site ranged from 4.904 to 153.762 MJ m−2 d−1 during the cultivation period (Fig. 3B).
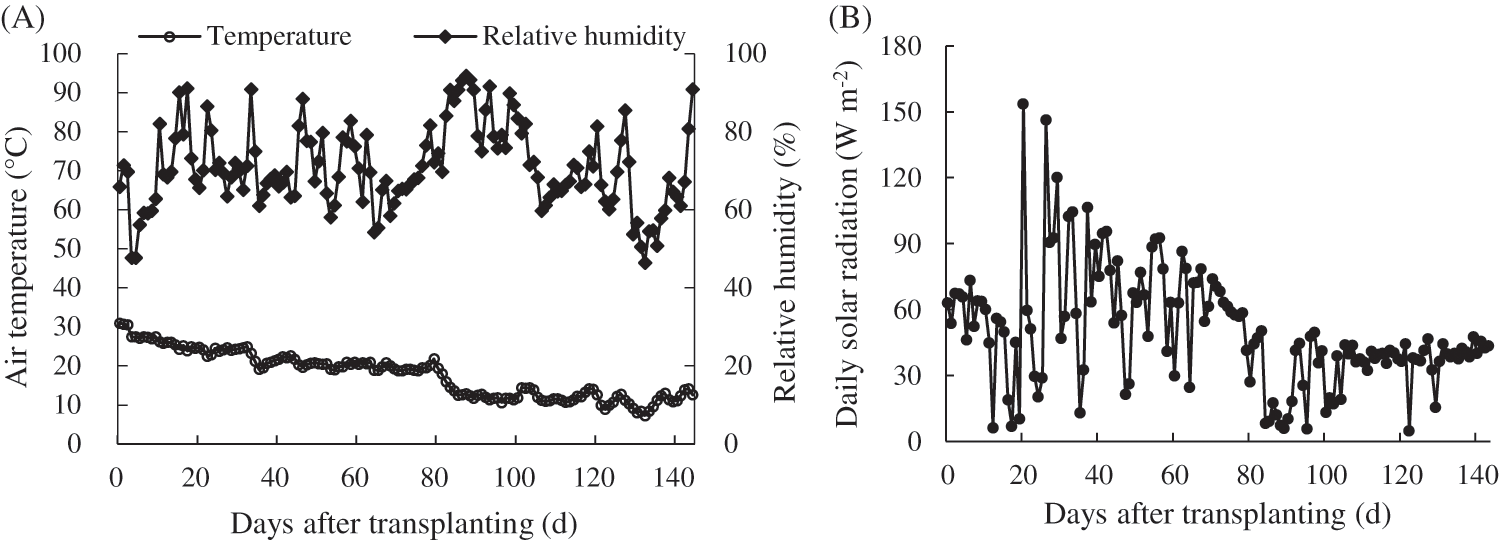
Figure 3: Meteorological conditions in the greenhouse during tomato cultivation. (A) Daily average temperature and relative air humidity; (B) Daily solar radiation
According to the morphology and color changes of tomato fruit, the dynamic process of fruit development was divided into three periods: expansion period (63–70 d after colonization, EP), pink period (77–84 d after colonization, PP) and mature period (91 d after colonization, MP). The fruits of these three periods were picked under each treatment, and fruit sampling was completed within one week. Five marked fruits at the same developmental stage were select, cut the seeds from the central equatorial area of the fruit to remove the seeds after removing the peel, shred the pulp and put it in a ziplock bag, then put it in liquid nitrogen for quick freezing, and stored at −80°C for sugar, organic acid, and key enzymes determination.
2.4 Determination of the Soluble Sugar and Organic Acid Contents
The contents of sugars and organic acids were measured by high performance liquid chromatography (HPLC) using the method reported by Liao et al. [31] and Zheng et al. [32] with some modifications. 3 g samples of frozen pulp were ground to a powder, homogenized in 6 mL of ethanol (80%) solution, incubated for 20 min in a 35°C water bath and then centrifuged at 10000×g for 10 min. This extraction procedure was repeated three times and the supernatants were combined, and made up to the final volume (25 mL) with distilled water. And then evaporate it with a rotary evaporator (JC-ZF-RE5000, JU CHUANG ENVIRONMENT, China) at 45°C for 4 h, the total volume was adjusted to 1 mL with distilled water, and filtered through a 0.22 μm, 13 mm diameter PES film. The filtered solution was used for sugar and organic acid analysis.
HPLC analysis of sugars. Acetonitrile: water (80:20) was used as the mobile phase with a flow rate of 1.0 mL min−1. The column was Innoval NH2 (4.6 × 250.0 mm, 5.0 μm) (Bonna-Agela Inc., China) at 30°C; eluted peaks were detected using a refractive index detector RID-10A (Jasco Corp., Japan). Injection amount was 20 μL. Each run was completed within 20 min. Quantification of individual sugars was made by comparison with peak areas of standard sugars.
HPLC of organic acids. 0.01 mol L−1 KH2PO4 (pH = 2.55): methanol (97/3) (v/v) was used as the mobile phase with a flow rate of 0.5 mL min−1. The column was 0.5 μm C18 column (250 mm × 4.6 mm, Agilent, USA) at 30°C. Organic acids were detected at a wavelength of 210 nm. The eluted peaks were detected with a 2996 diode array detector (Waters Beckman Coulter Inc., Brea, CA, USA), and quantification of individual organic acids was made using peak areas of standard acids.
2.5 Extraction and Estimation of Key Enzymes in Sugar Metabolism
Enzyme extraction was performed as described previously [33] with some modifications. Briefly, each sample (1 g) of tomato pulp were homogenized with 10 mL of extraction medium containing 100 mM phosphate buffer (pH 7.5), 5 mM MgCl2, 1 mM ethylenediaminetetraacetic acid (EDTA)-Na2, 0.1% β-mercaptoethanol, 1%TritonX-100%, 2% PVP. The homogenate was centrifuged at 1000 r min−1 for 15 min at 4°C and then taken the supernatant and dilute it 5 times with distilled water as the crude enzyme extract, which was used to determine the activity of enzymes involved in sucrose metabolism.
Neutral invertase (NI) activity was determined in a reaction mixture that consisted of 0.1 mL of the crude enzyme extract and 1 mL of mixture buffer (1% sucrose, 100 mM phosphate buffer (pH 7.5), 5 mM MgCl2, 1 mM ethylenediaminetetraacetic acid (EDTA)-Na2). The reaction was carried out at 37°C for 40 min followed by boiling in water for 5 min. Then 2 mL DNS were added and they were all placed in a boiling water bath for 5 min, and then allowed to cool before reading absorbance at 540 nm. The blank contains the same mixture, but the extract was boiled for 5 min to inactivate the enzyme, and then mixed again and determined. The difference between the two absorbances was used to calculate the reducing sugar production rate, which represented the activity of the NI in mol g−1 h−1 FW. Acid invertase (AI) activity assay procedure was similar to that of NI, except that 1% sucrose and 100 mM phosphate buffer (pH 7.5) were used as the mixture buffer.
Sucrose synthase activity in the sucrose cleavage direction (SS-c) activity was determined in a reaction mixture consisting of 0.1 mL of the crude enzyme extract and 0.1 mL of mixture buffer (5 mM UDP, 0.1 M sucrose, 5 mM NaF, 0.08 M pH 5.5 MES buffer). Subsequent steps were as described for NI. Sucrose synthase activity in the sucrose synthetic direction (SS-s) activity was assayed at 37°C for 40 min in a 0.1 mL assay mixture that contained 0.05 mL of crude enzyme extract and 0.05 mL reaction mixture (100 mM pH 8.0 phosphate buffer, 4 mM UDPG, 6 mM fructose, 15 mM MgCl2). The reaction mixture was added 0.2 mL 30% KOH and then immediately placed in a boiling water bath for 10 min to terminate the reaction. After cooling the samples down to room temperature, added 1 mL anthrone reagent. Sucrose phosphate synthase (SPS) activity assay procedure was similar to that of SS-s, except that 10 mM UDPG, 5 M fructose-6-phosphate, 15 mM glucose-6-phosphate, 15 mM MgCl2, 1 mM EDTA, and 0.1 M boric acid buffer were used as the reaction mixture.
2.6 Extraction and Estimation of Key Enzymes in Organic Acid Metabolism
Enzyme extraction and purification were performed as described by Liu et al. [34] and Han et al. [35] with some modifications. 10 g frozen tomato pulp was homogenized with a mortar and pestle in 4 mL of ice-cold extract buffer containing 0.2 M Tris-HCl (pH 8.2), 0.6 M sucrose, and 10 mM erythorbic acid. The homogenate was centrifuged at 4000 r min−1 for 20 min at 4°C, and then taken the supernatant and made up to the final volume (10 mL) with ice-cold extract buffer as crude enzyme solution. 4 mL crude enzyme solution were taken to centrifuge at 12000 r min−1 4°C for 15 min, 1 mL of supernatant was taken and added extraction buffer to bring the volume to 2 mL to measure cytoplasm aconitase (cyt-ACO) enzyme activity. The remaining 3 mL of liquid was made up to 6 mL with extraction buffer (0.2 M pH 8.2 Tris-HCl, 10 mM erythorbic acid, 0.1% Triton X-100) to measure mitochondria aconitase (mit-ACO) and Isocitrate dehydrogenase (IDH) enzyme activity. Then 4 mL of crude enzyme solution was taken and added 4 mL extraction buffer to measure the activity of malic enzyme (ME) and malate dehydrogenase (MDH). The remaining 2 mL of crude enzyme solution was added to 2 mL extraction buffer, placed in a large amount of extraction buffer and dialyzed at 4°C overnight, and exchanged for 2–3 times to obtain phosphopyruvate carboxylase (PEPC) and citrate synthetase (CS) enzyme solution. PEPC, CS, IDH, ME, ACO and MDH were measured according to the method reported by scholars [34–36]. All enzyme activities were determined by using a UV-2600 spectrophotometer (Shimadzu, Kyoto, Japan).
2.7 Determination of Fruit Quality
Fruit quality was performed as described previously [37] with some modifications. Total soluble solids (TSS) was measured using a handheld refractometer (PR-32 α, ATAGO, Tokyo, Japan); vitamin C (VC) was determined using 2, 6-dichloro-phenol indophenols sodium salt solution; total sugar (TS) was measured using the anthrone colorimetric method; titratable acid (TAA) was measured with autosampler (SI Analytics) [38]; lycopene was determined by HPLC method [39].
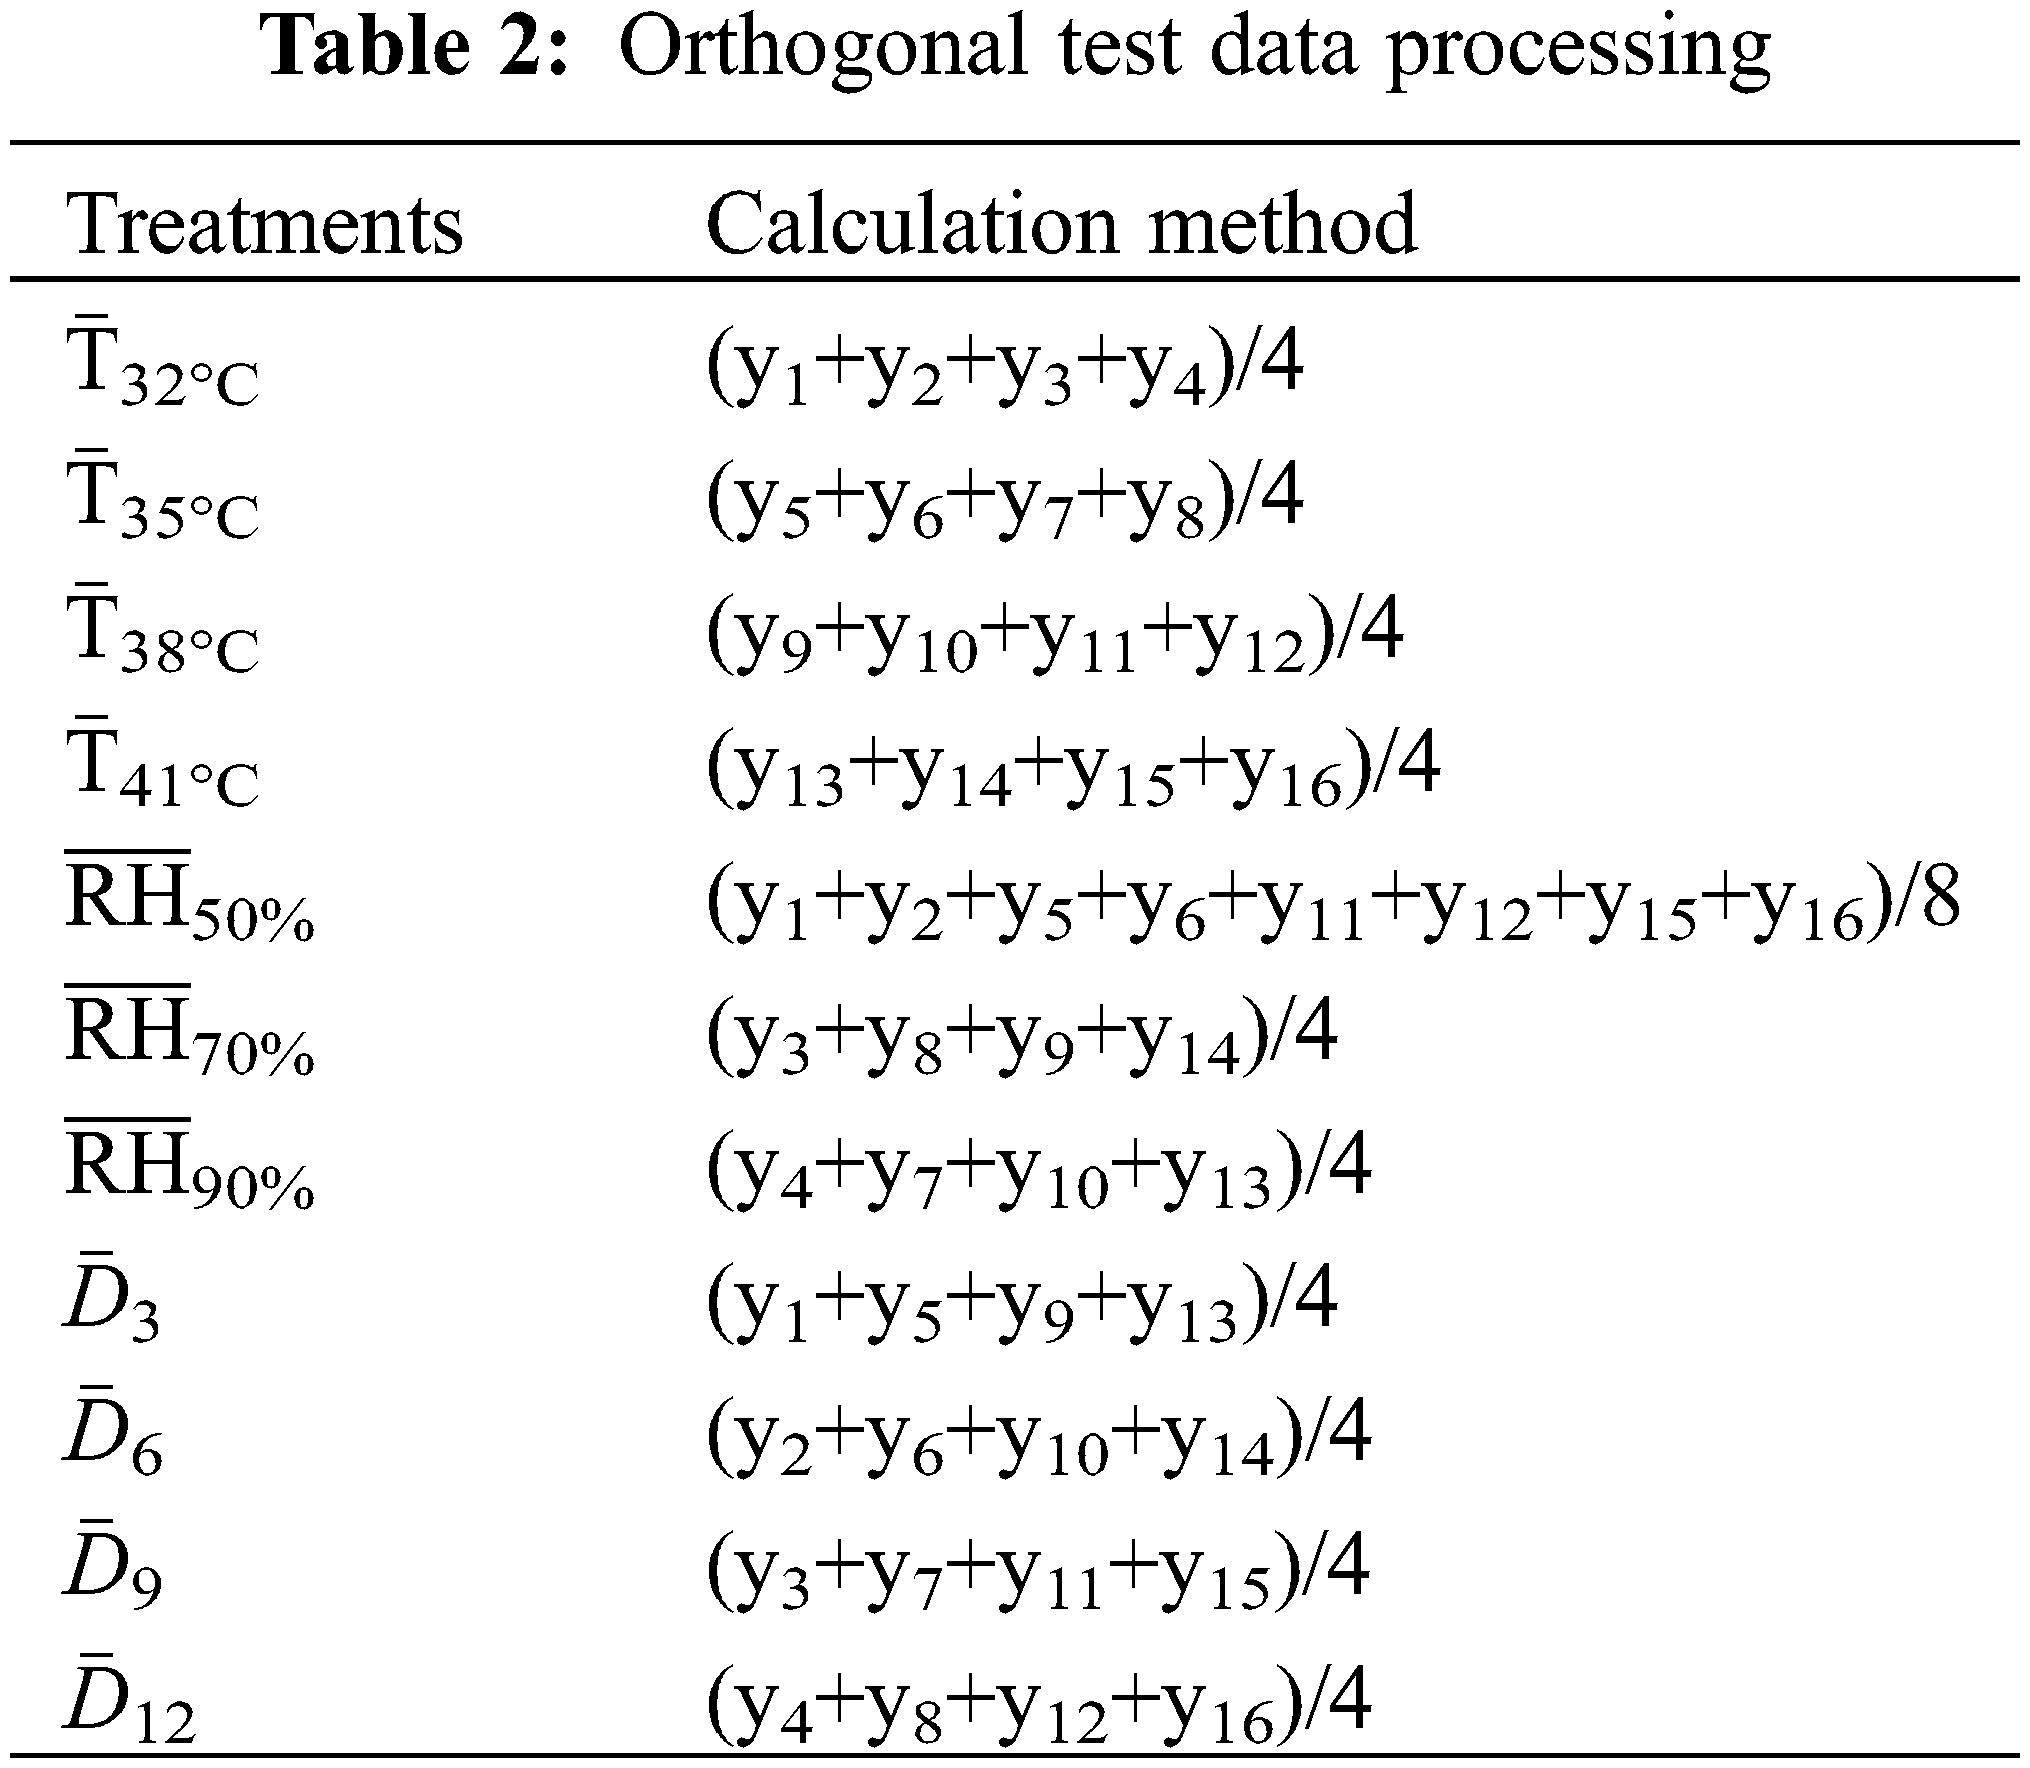
y1–y16 were the index values of the corresponding Y1–Y16 test treatments and were the arithmetic averages of three replicates. According to the method of Liu et al. [40], the orthogonal test data was processed, and the average value of each level index was calculated and then compared and analyzed. The specific process was shown in Table 2. Data analysis was conducted using SPSS 18.0 software (SPSS Inc., Chicago, IL, USA). Treatment effects were assessed using the one-way analysis of variance, and the differences between treatments were determined using the least significant difference test (LSD) at the 0.05 significance level. Correlation analyses were performed to investigate the relationship between organic acid and related metabolic enzyme activity.
Soluble sugar content in fruit throughout tomato fruit development showed a significant increase (12.686–21.305 mg g−1 FW) at CK treatments, and reached the maximum in MP period, while the sucrose content was less affected by fruit development (Fig. 4). Metabolic enzyme activity also showed different changes. Notably, AI showed less marked changes, while SPS dramatically decreased at PP period but then sharply increased. Intriguingly, NI showed an increasing trend throughout fruit development; conversely, SS-c showed a sharp decrease at MP period.
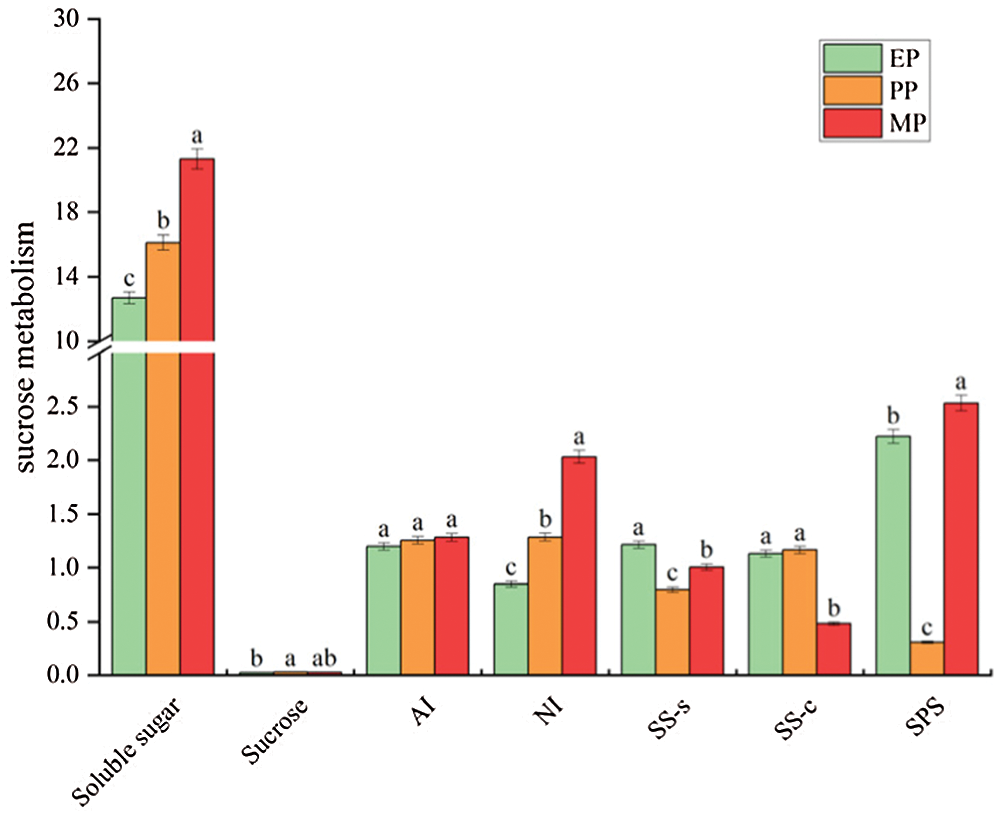
Figure 4: Sugar content and activity of sucrose-related metabolic enzymes of tomato fruit along development under CK conditions. Relative metabolite contents of fruits harvested from expansion period until maturing period. The unit of sugar content and enzyme activity are mg g−1 FW and μmol g−1 h−1 FW, respectively. EP (Expansion period, 63–70 d after transplanting); PP (pink period, 77–84 d after transplanting); MP (maturing period, 91 d after transplanting). Data are mean ± SD (n = 3); alphabetical letters (a, b and c) indicate significant differences, as determined by ANOVA followed by Tukey’s tests (P ≤ 0.05)
The sugar content and enzyme activities were measured to compare the effects of different treatments conditions (T, RH and D) at three stages of fruit development on sucrose metabolism in tomato fruit (Fig. 5). The results revealed large changes in metabolite levels throughout fruit development. Notably, high temperature treatment, especially high temperature intensity, elicited significant sucrose metabolism changes (Fig. 5A). Specifically, under T32°C conditions, the soluble sugar content of EP and PP periods increased by 51.613% and 3.542% compared with CK, respectively, while in MP period, the content was reduced by 24.403%. The soluble sugar content showed decreased as the increase of high temperature stress intensity (from 32°C to 41°C). Simultaneously, the sucrose content showed a similar pattern (higher than CK at T32°C condition). In addition, enzyme activities related to sucrose metabolism supplied with T32°C and T35°C treatment were significantly lower than that of the CK, especially in EP period. In contrast, a higher enzyme activity was observed with the T38°C and T41°C treatment compared to CK.
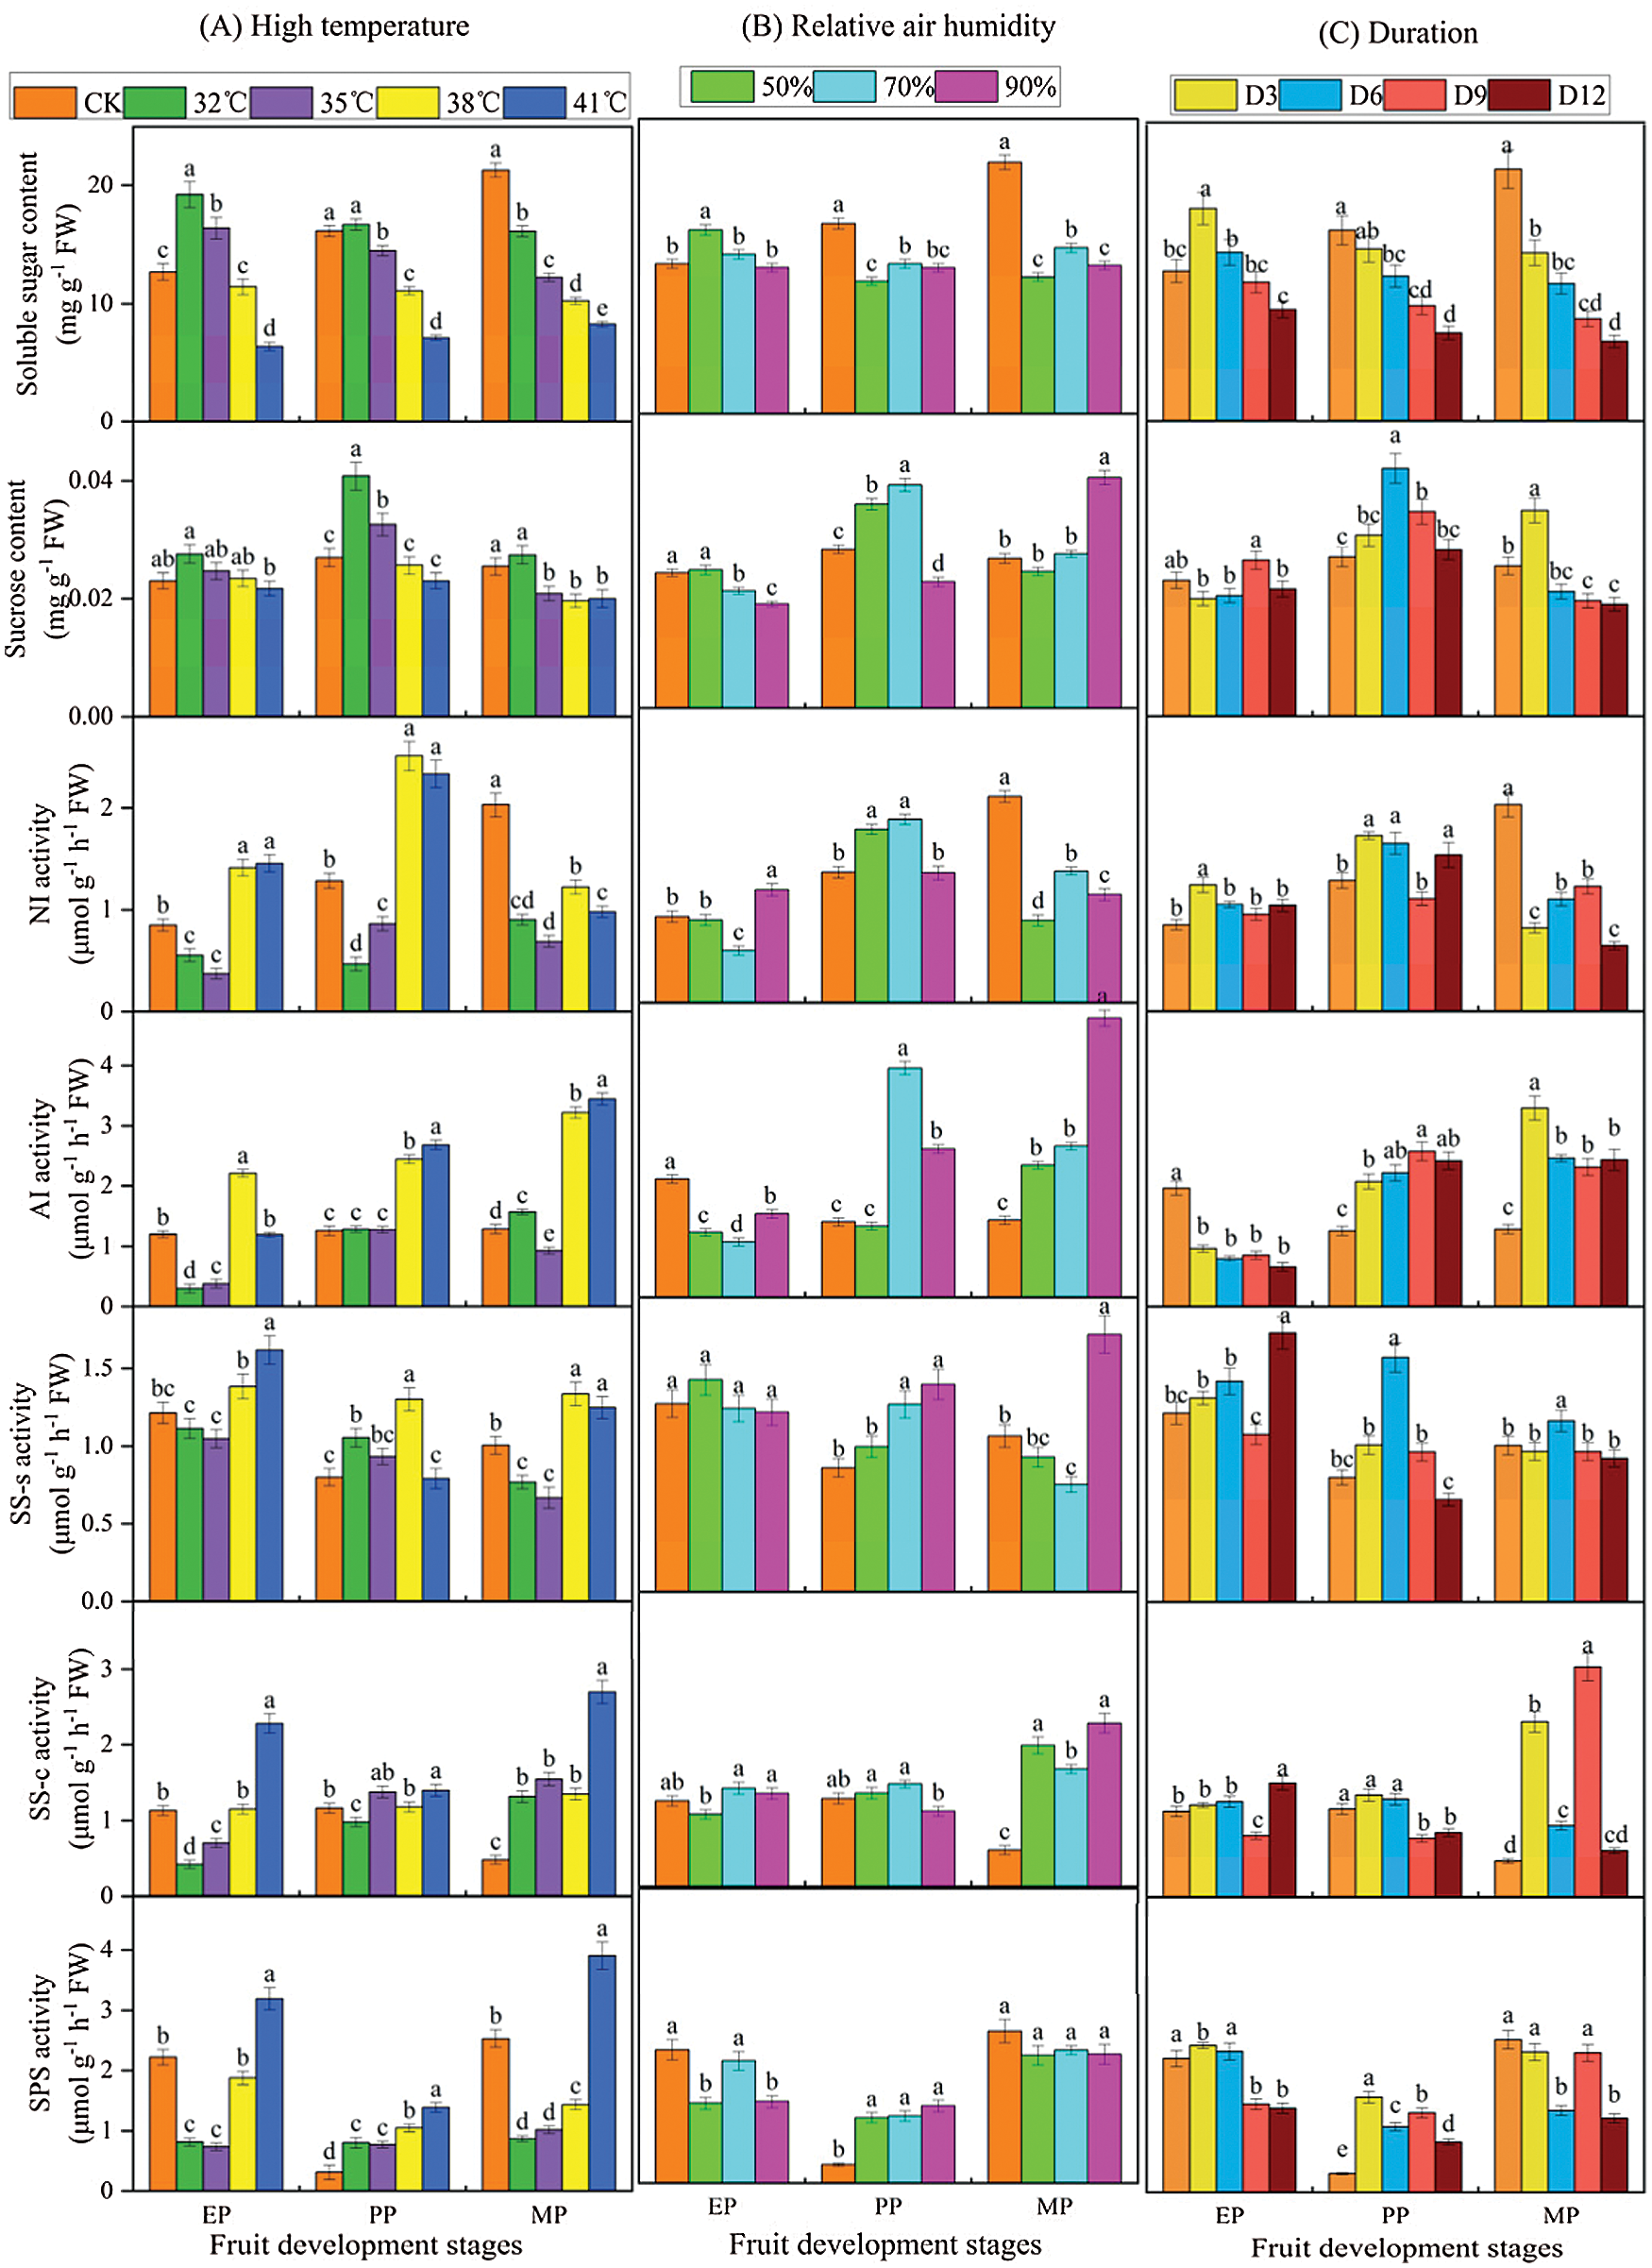
Figure 5: Sucrose metabolic profiles of tomato fruit along development under different treatment conditions. Relative metabolite contents of fruits harvested from expansion period until maturing period. EP (Expansion period, 63–70 d after transplanting); PP (pink period, 77–84 d after transplanting); MP (maturing period, 91 d after transplanting). Data are mean ± SD (n = 3); alphabetical letters (a, b and c) indicate significant differences, as determined by ANOVA followed by Tukey’s tests (P ≤ 0.05)
There were significant differences in fruit sucrose metabolism between various relative air humidity treatments at high temperature (Fig. 5B). Notably, soluble sugar content of the three relative humidity treatments in the PP and MP phases was significantly lower than that of CK. The sucrose content was strongly affected by RH50% and RH70% relative humidity treatment but mainly, during PP period. Overall, few differences were observed in enzyme activities involved in NI, SS-c, SS-s and SPS between CK and relative humidity treatment at EP period, where they were slightly higher. However, the relative humidity treatment increased the enzyme activity during PP and EP periods, except for NI.
Within various duration treatments, there was a significant difference in sucrose metabolism (Fig. 5C). The soluble sugar content gradually decreased as the extension of the treatment, and was significantly lower than CK, especially in PP and EP periods. The activity of sucrose metabolizing enzymes increased under the various treatment times, except for AI in EP period and NI in MP period.
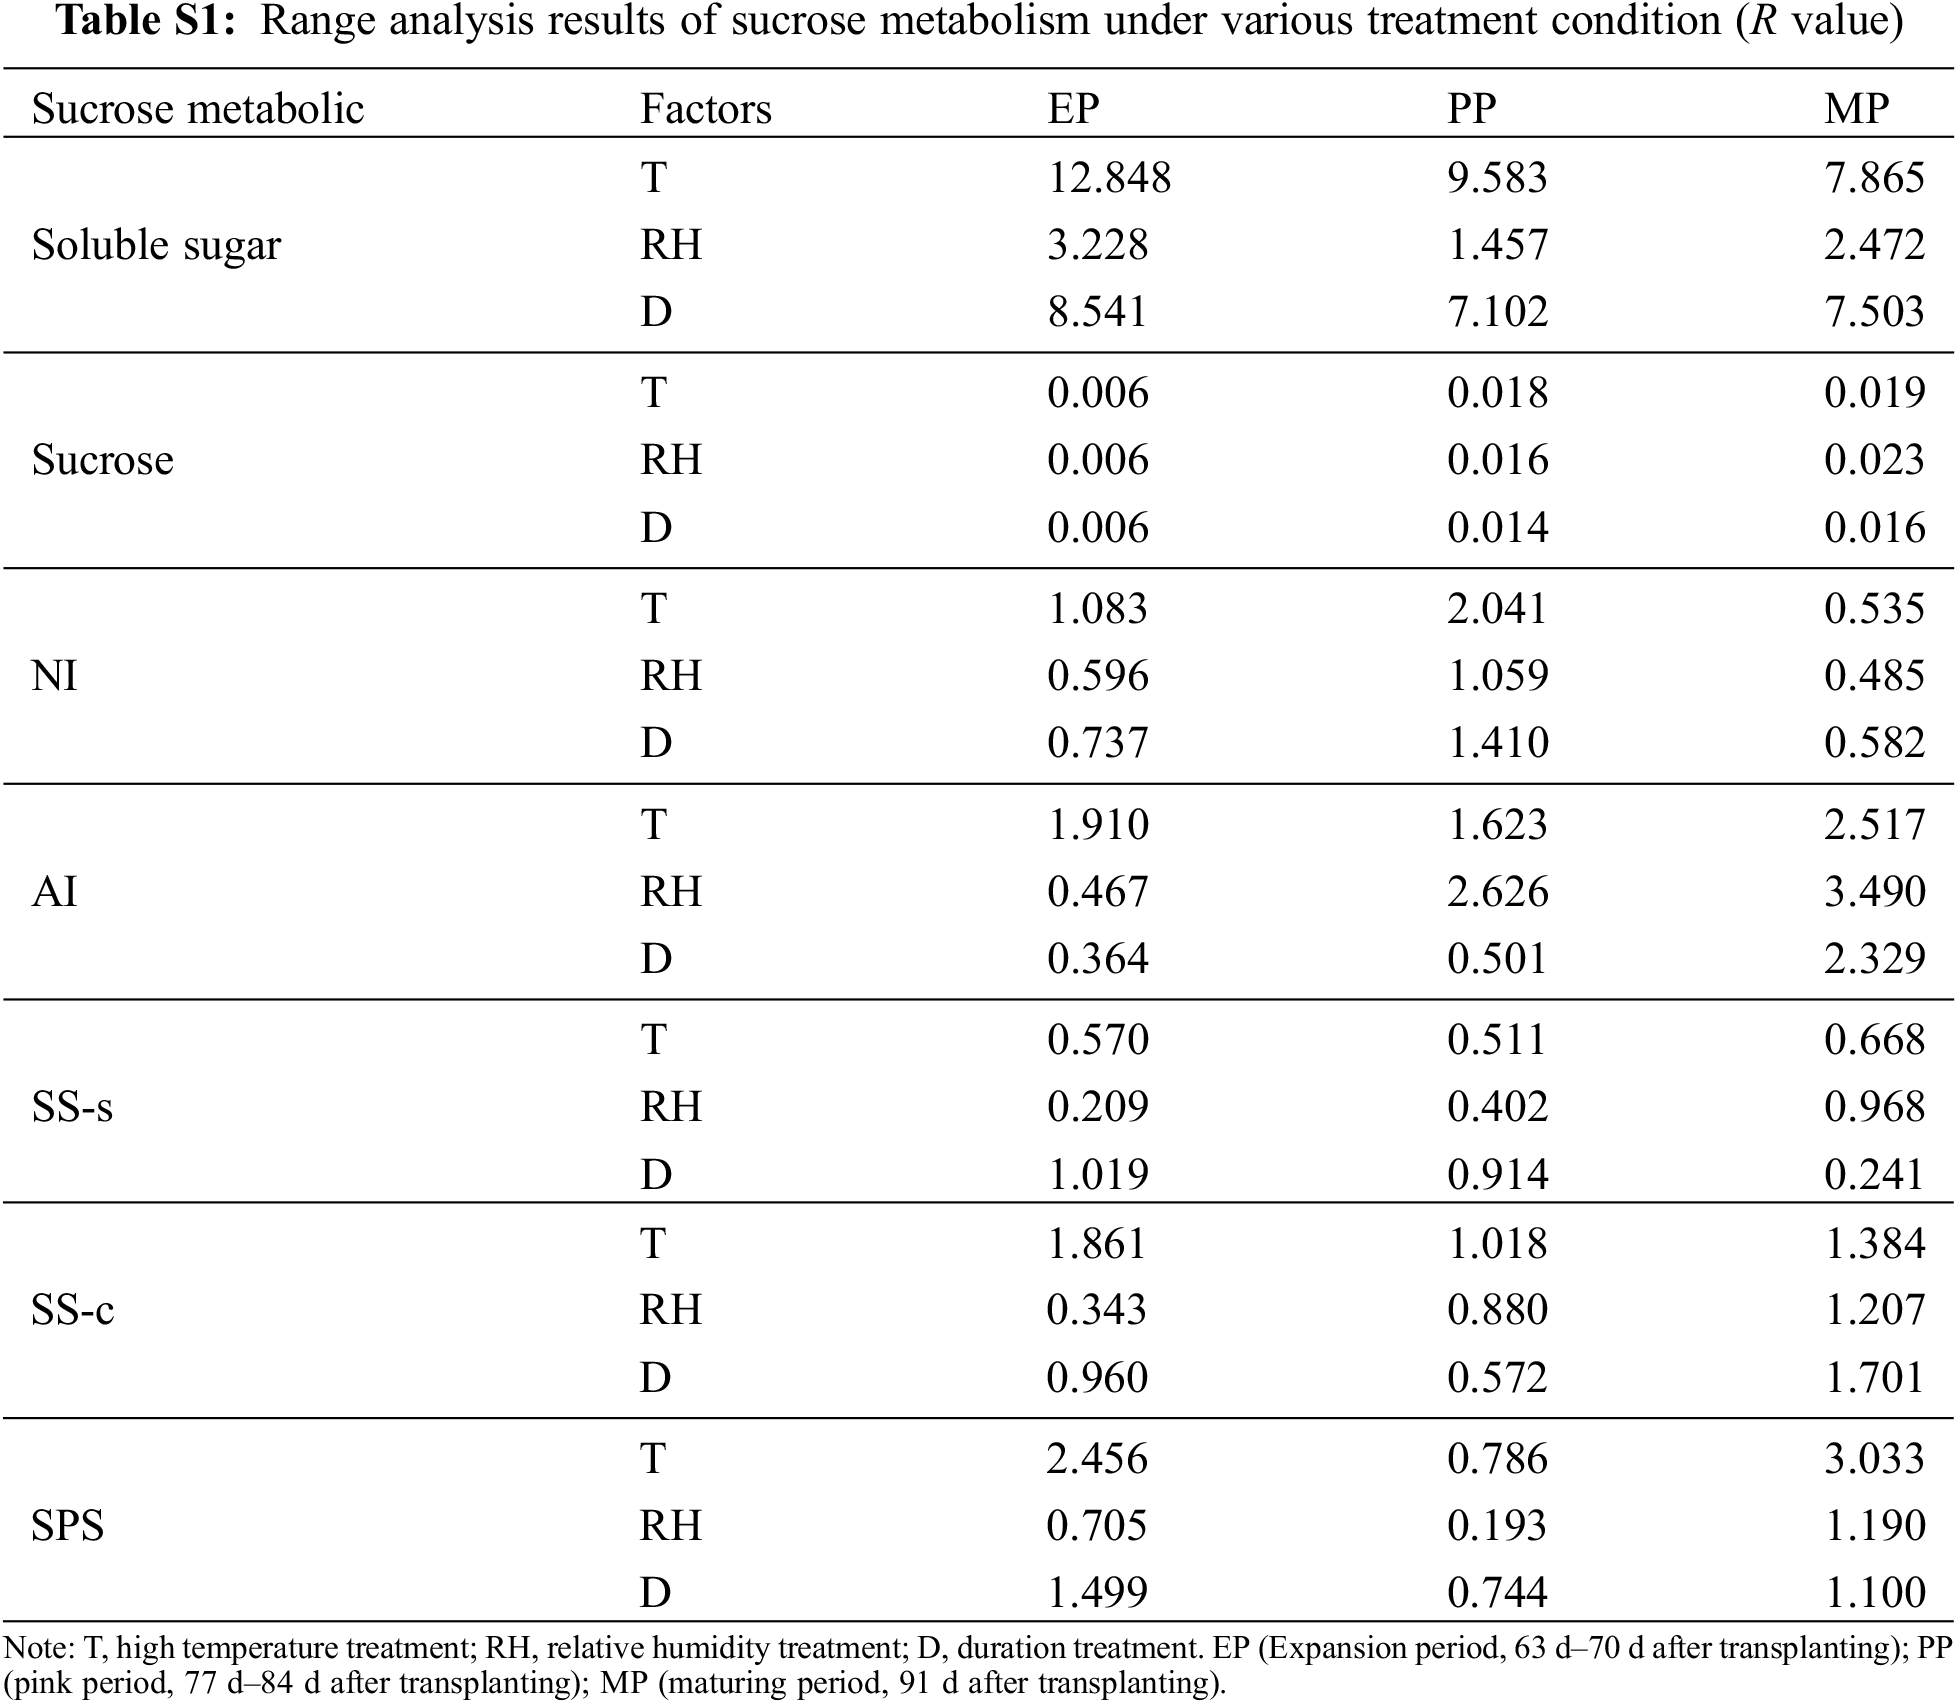
To investigate the effect of different T, RH and D condition on sucrose metabolism during fruit development, we used range analysis method to analyze the sucrose metabolism data obtained by the orthogonal experiment (Table S1). The range of sugar content (soluble sugar and sucrose) and enzyme activities in sucrose metabolism was RT > RD > RTH. Therefore, the sensitivity of T, RH and D to sucrose metabolism was T > D > RH, that was, T had the greatest impact on fruit sugar metabolism, indicating high temperature was the controlling factor of the fruit sugar metabolism, which ultimately affected the fruit quality. In the three stages of fruit development, the maximum range of T, RH, and D of soluble sugar content appeared in the EP period, while the range of sucrose content and the enzyme activities of AI, SS-s, SS-c and SPS was the largest in the MP period.
The most important organic acids in tomato fruits were citric acid (CA) (1.164 mg g−1 FW) and malic acid (Mal) (0.710 mg g−1 FW), and contained a small amount of tartaric acid (TA) (0.598 mg g−1 FW), succinic acid (SA) (0.502 mg g−1 FW), α-Ketoglutaric acid (α-KG) (0.252 mg g−1 FW) and acetic acid (AA) (0.231 mg g−1 FW). During tomato fruit development, CA content initially showed a sharp increase but then dropped significantly, reaching the maximum during PP period. In contrast, Mal content decreased from EP period, was lowest at PP period, and increased until the fruit ripening. The content of other small amounts of organic acids increased as the fruit matures (Fig. 6).
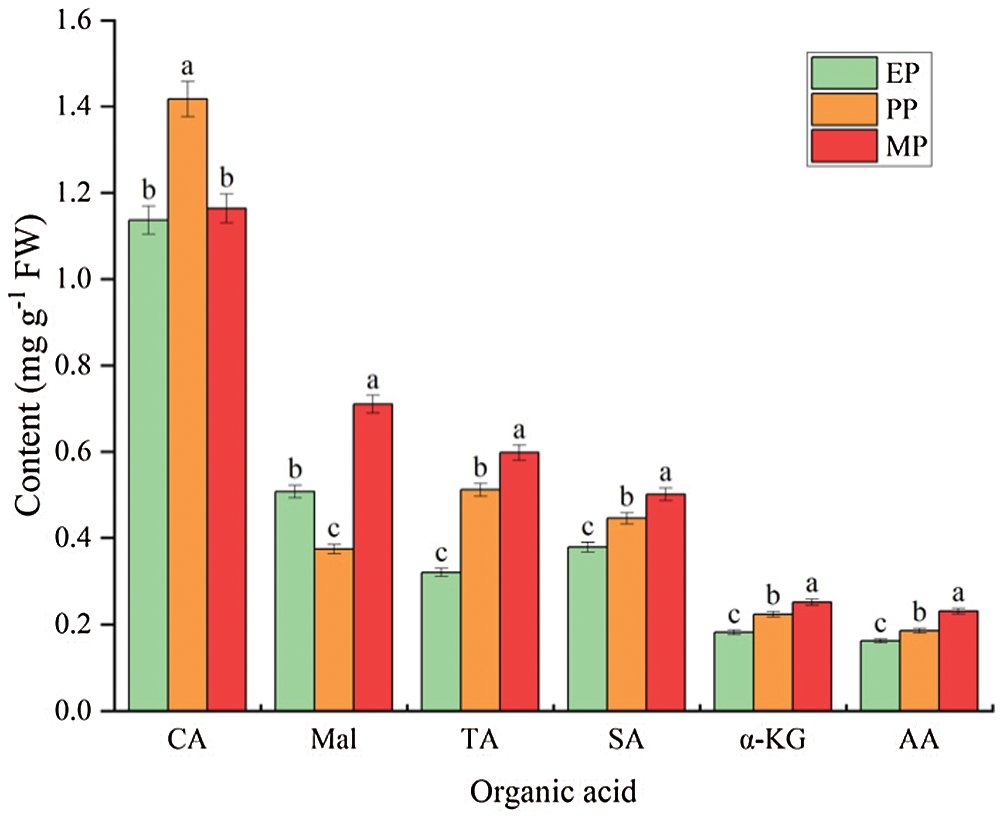
Figure 6: Main organic acid content of tomato fruit along development under CK conditions. Relative metabolite contents of fruits harvested from expansion period until maturing period. CA (citric acid); Mal (malic acid); TA (tartaric acid); SA (succinic acid); α-KG (α-ketoglutaric acid); AA (acetic acid). EP (Expansion period, 63–70 d after transplanting); PP (pink period, 77–84 d after transplanting); MP (maturing period, 91 d after transplanting). Data are mean ± SD (n = 3); alphabetical letters (a, b and c) indicate significant differences, as determined by ANOVA followed by Tukey’s tests (P ≤ 0.05)
The organic acid components and contents were measured to compare the effects of different treatments conditions (T, RH and D) at three stages of fruit development on organic acid metabolism in tomato fruit (Fig. 7). The organic acid concentrations increased with high temperature treatment conditions, and with the increased of high temperature intensity, except for CA, the organic acid contents also increased, which was significantly higher than that of CK (Fig. 7A). Intriguingly, CA content was lower than CK from 32°C to 38°C, while it was slightly higher at T41°C compared with CK.
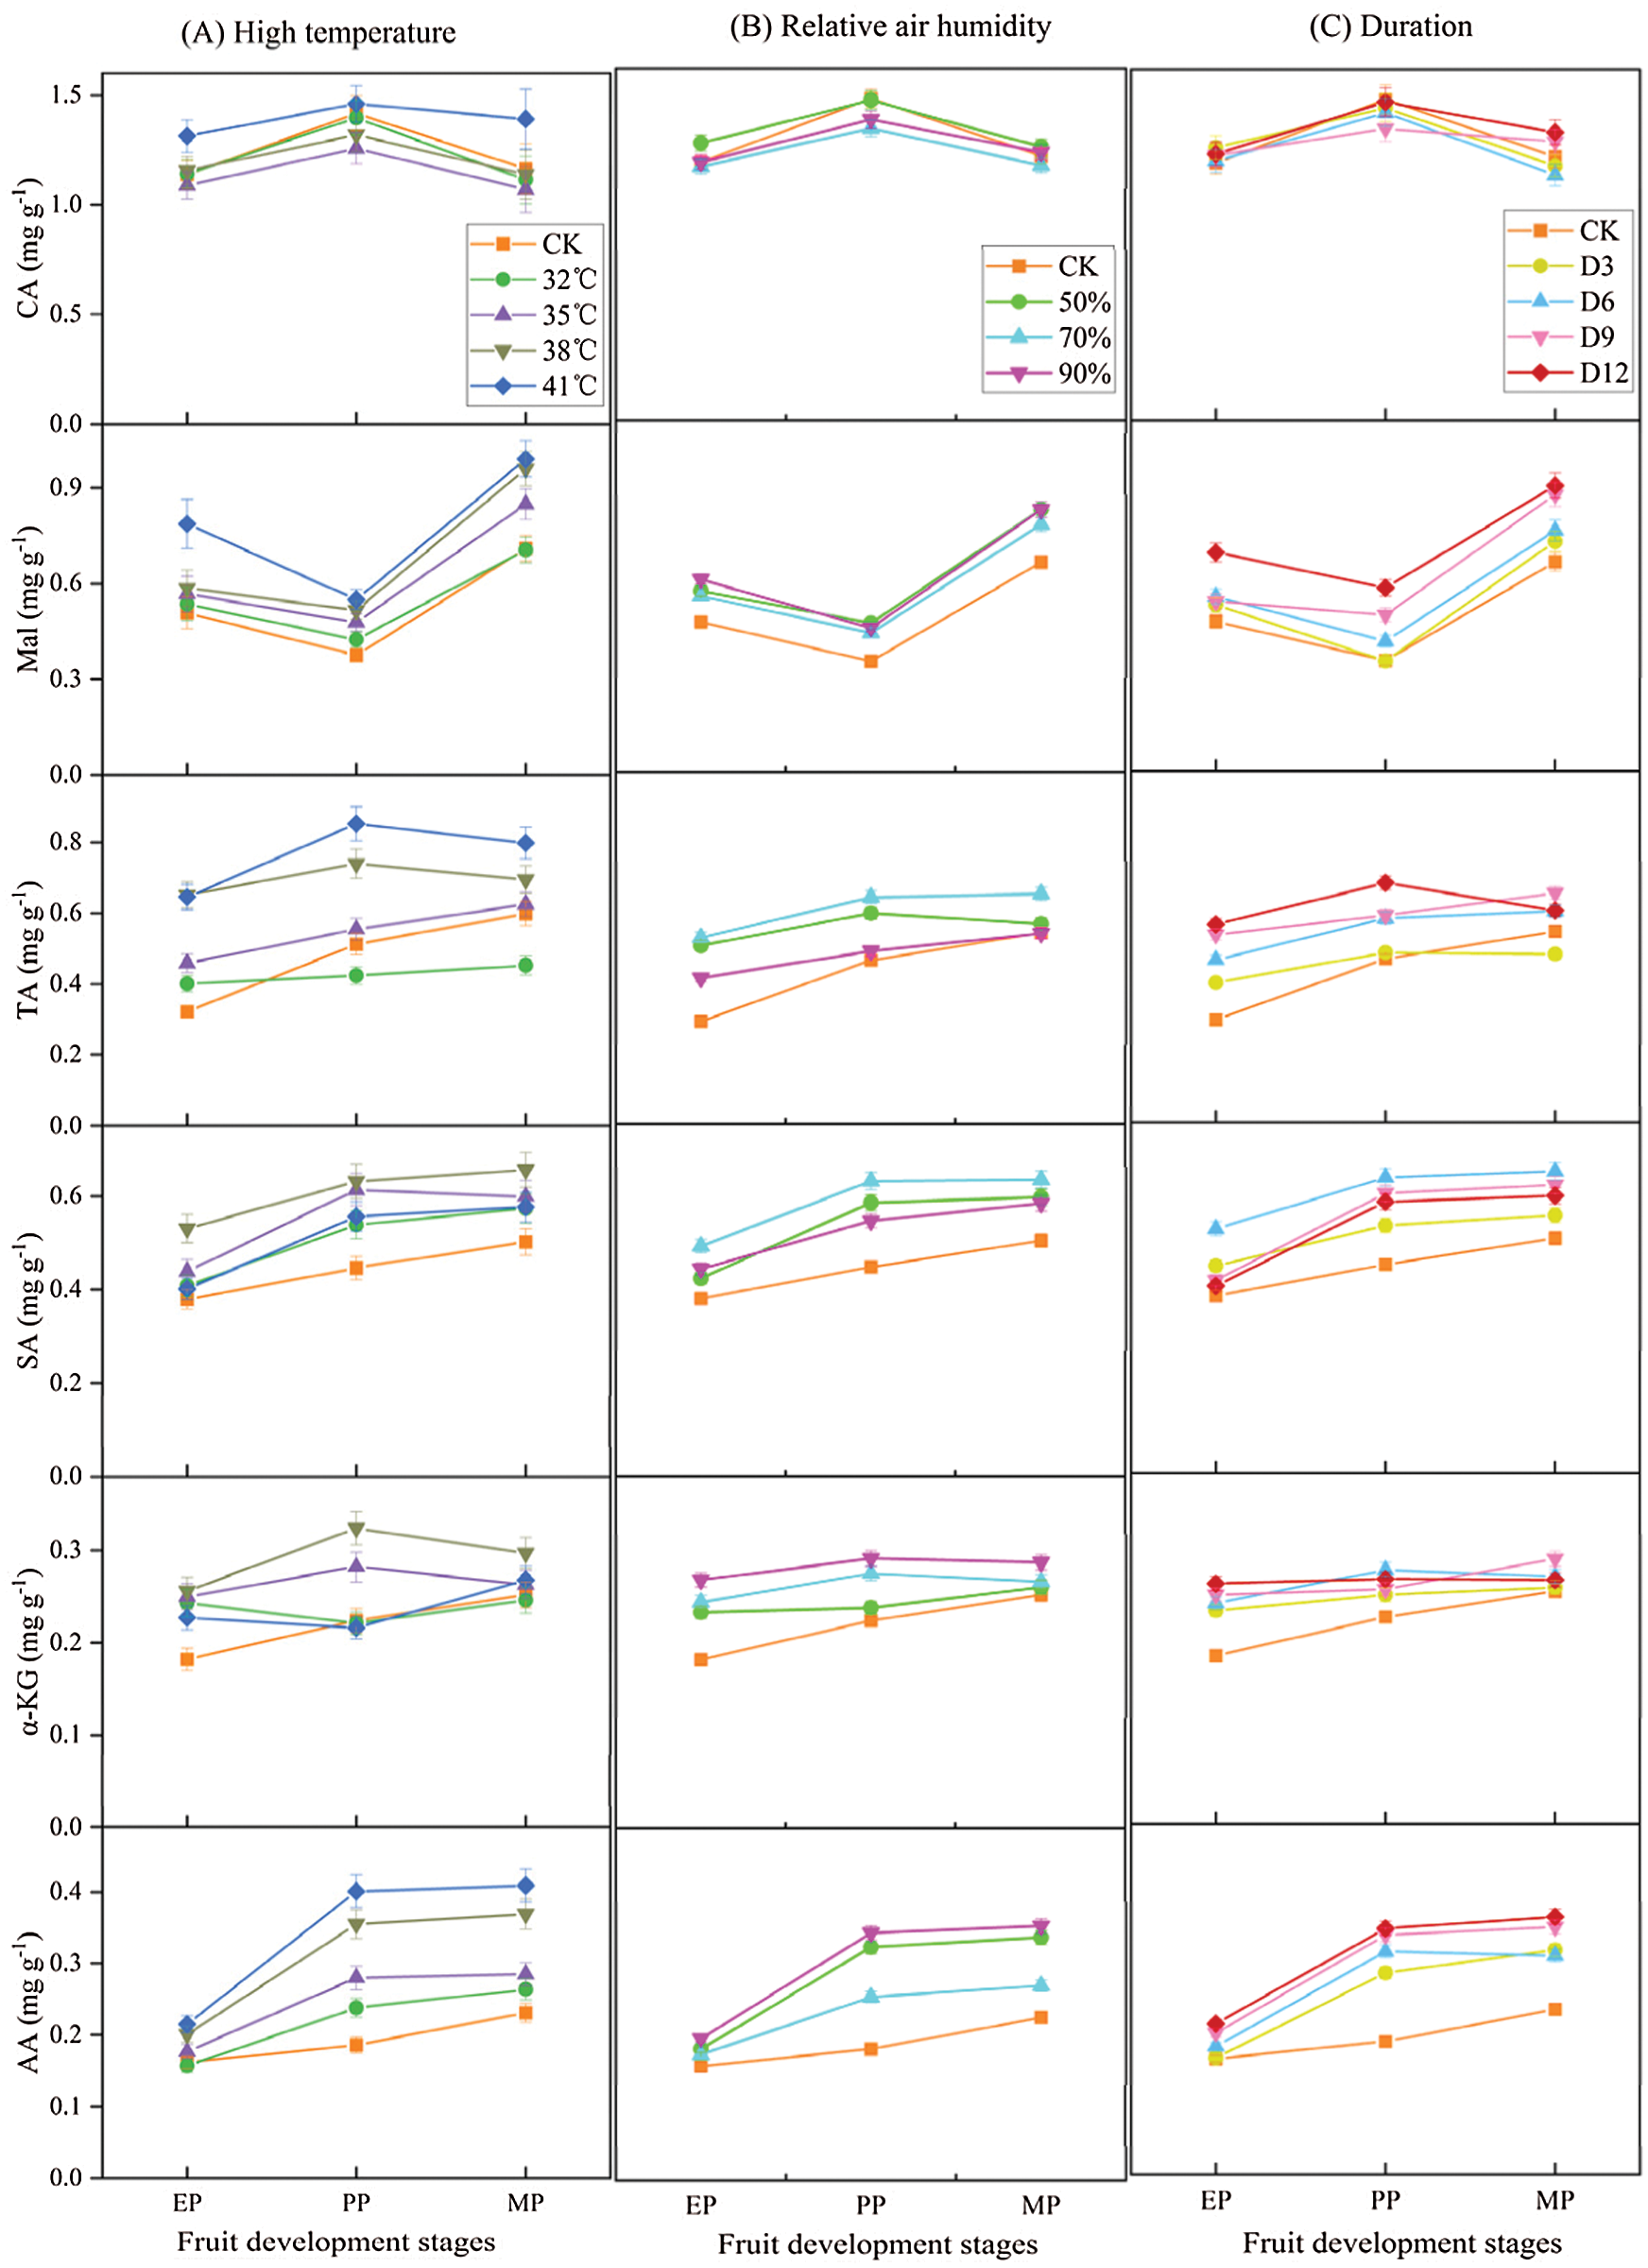
Figure 7: Organic acid components and contents of tomato fruit along development under different treatment conditions. The unit of organic acid content is mg g−1 FW. EP (Expansion period, 63–70 d after transplanting); PP (pink period, 77–84 d after transplanting); MP (maturing period, 91 d after transplanting). Data are mean ± SD (n = 3)
Similarly, the organic acid contents showed an increase with various relative humidity treatments at high temperature conditions compared to CK (Fig. 7B). Among them, the contents of Mal, α-KG, and AA gradually increased with the increased of relative air humidity, and reached their maximum at RH90% treatments. In contrast, the contents of CA, TA, and SA were highest at RH70% condition, and then decreased with RH90% treatments.
The organic acid contents showed an increase under various duration conditions compared to CK (Fig. 7C). Among them, the contents of Mal, TA and AA were highest under D12 treatment, while SA and α-KG contents reached the maximum at D6 treatments.
Enzyme activity involved in organic acid metabolism throughout tomato fruit development at CK treatments showed a different trend (Fig. 8). Specifically, the activities of PEPC and CS initially showed a sharp increase but then dropped significantly and abruptly at the MP period; on the contrast, cyt-ACO and mit-ACO showed a different pattern (decreased at PP period followed increased). Intriguingly, MDH and IDH showed a significant increase trend, especially MDH, increased by 88.108% at MP period. ME enzyme activity was never significantly different throughout fruit development.
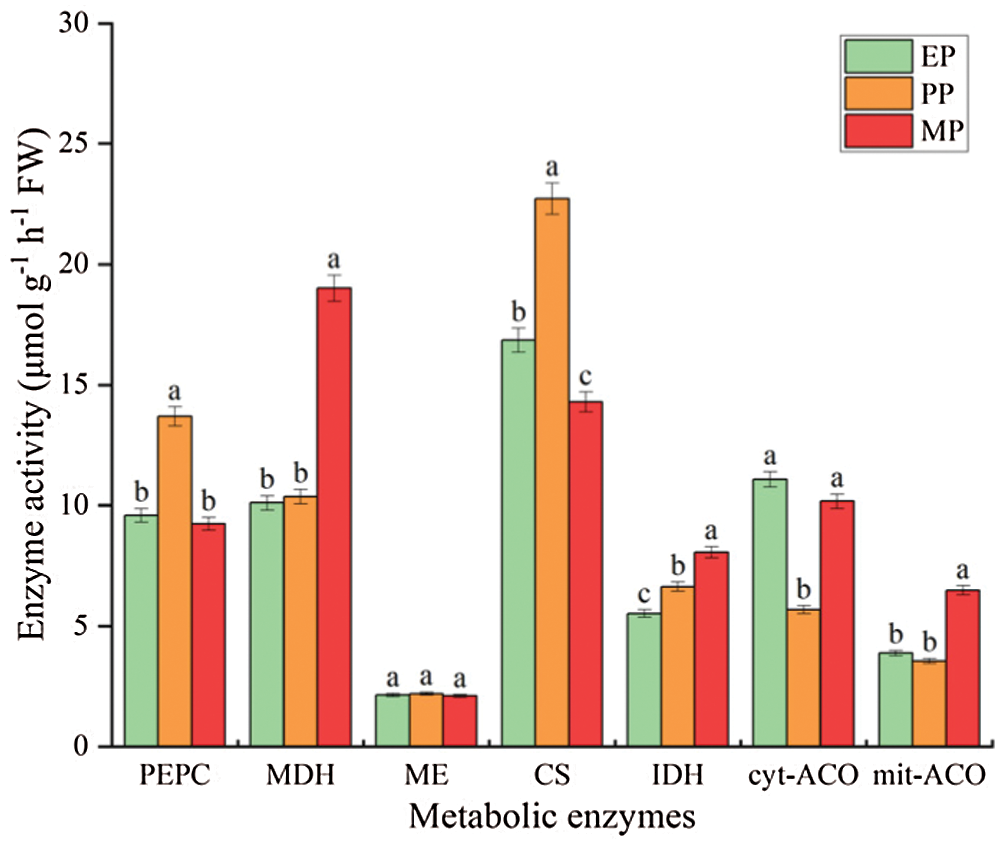
Figure 8: Organic acid metabolism related enzyme activity of tomato fruit along development under CK conditions. Relative metabolite contents of fruits harvested from expansion period until maturing period. EP (Expansion period, 63–70 d after transplanting); PP (pink period, 77–84 d after transplanting); MP (maturing period, 91 d after transplanting). Data are mean ± SD (n = 3); alphabetical letters (a, b and c) indicate significant differences, as determined by ANOVA followed by Tukey’s tests (P ≤ 0.05)
The enzyme activities were measured to compare the effects of different treatments conditions (T, RH and D) at three stages of fruit development on organic acid metabolism in tomato fruit (Fig. 9). The enzyme activities increased with high temperature treatment conditions compared to CK (Fig. 9A), activities of PEPC, MDH and CS increased as the increased of temperature, and reached the maximum at T41°C condition, while IDH, cyt-ACO and mit-ACO was highest in activity at T38°C, and the enzyme activity decreased when the temperature was higher than 38°C. Similarly, enzyme activities showed an increase under relative air humidity treatments compared to CK (Fig. 9B). The enzyme activity was the largest under RH50% treatments, and there was no difference in enzyme activity between RH50% and RH90% treatments, especially in the EP and MP stages, except for IDH and cyt-ACO. The enzyme activity showed an increase under various duration conditions compared to CK (Fig. 9C), and was highest at D12 treatment condition, except for ME and cyt-ACO.
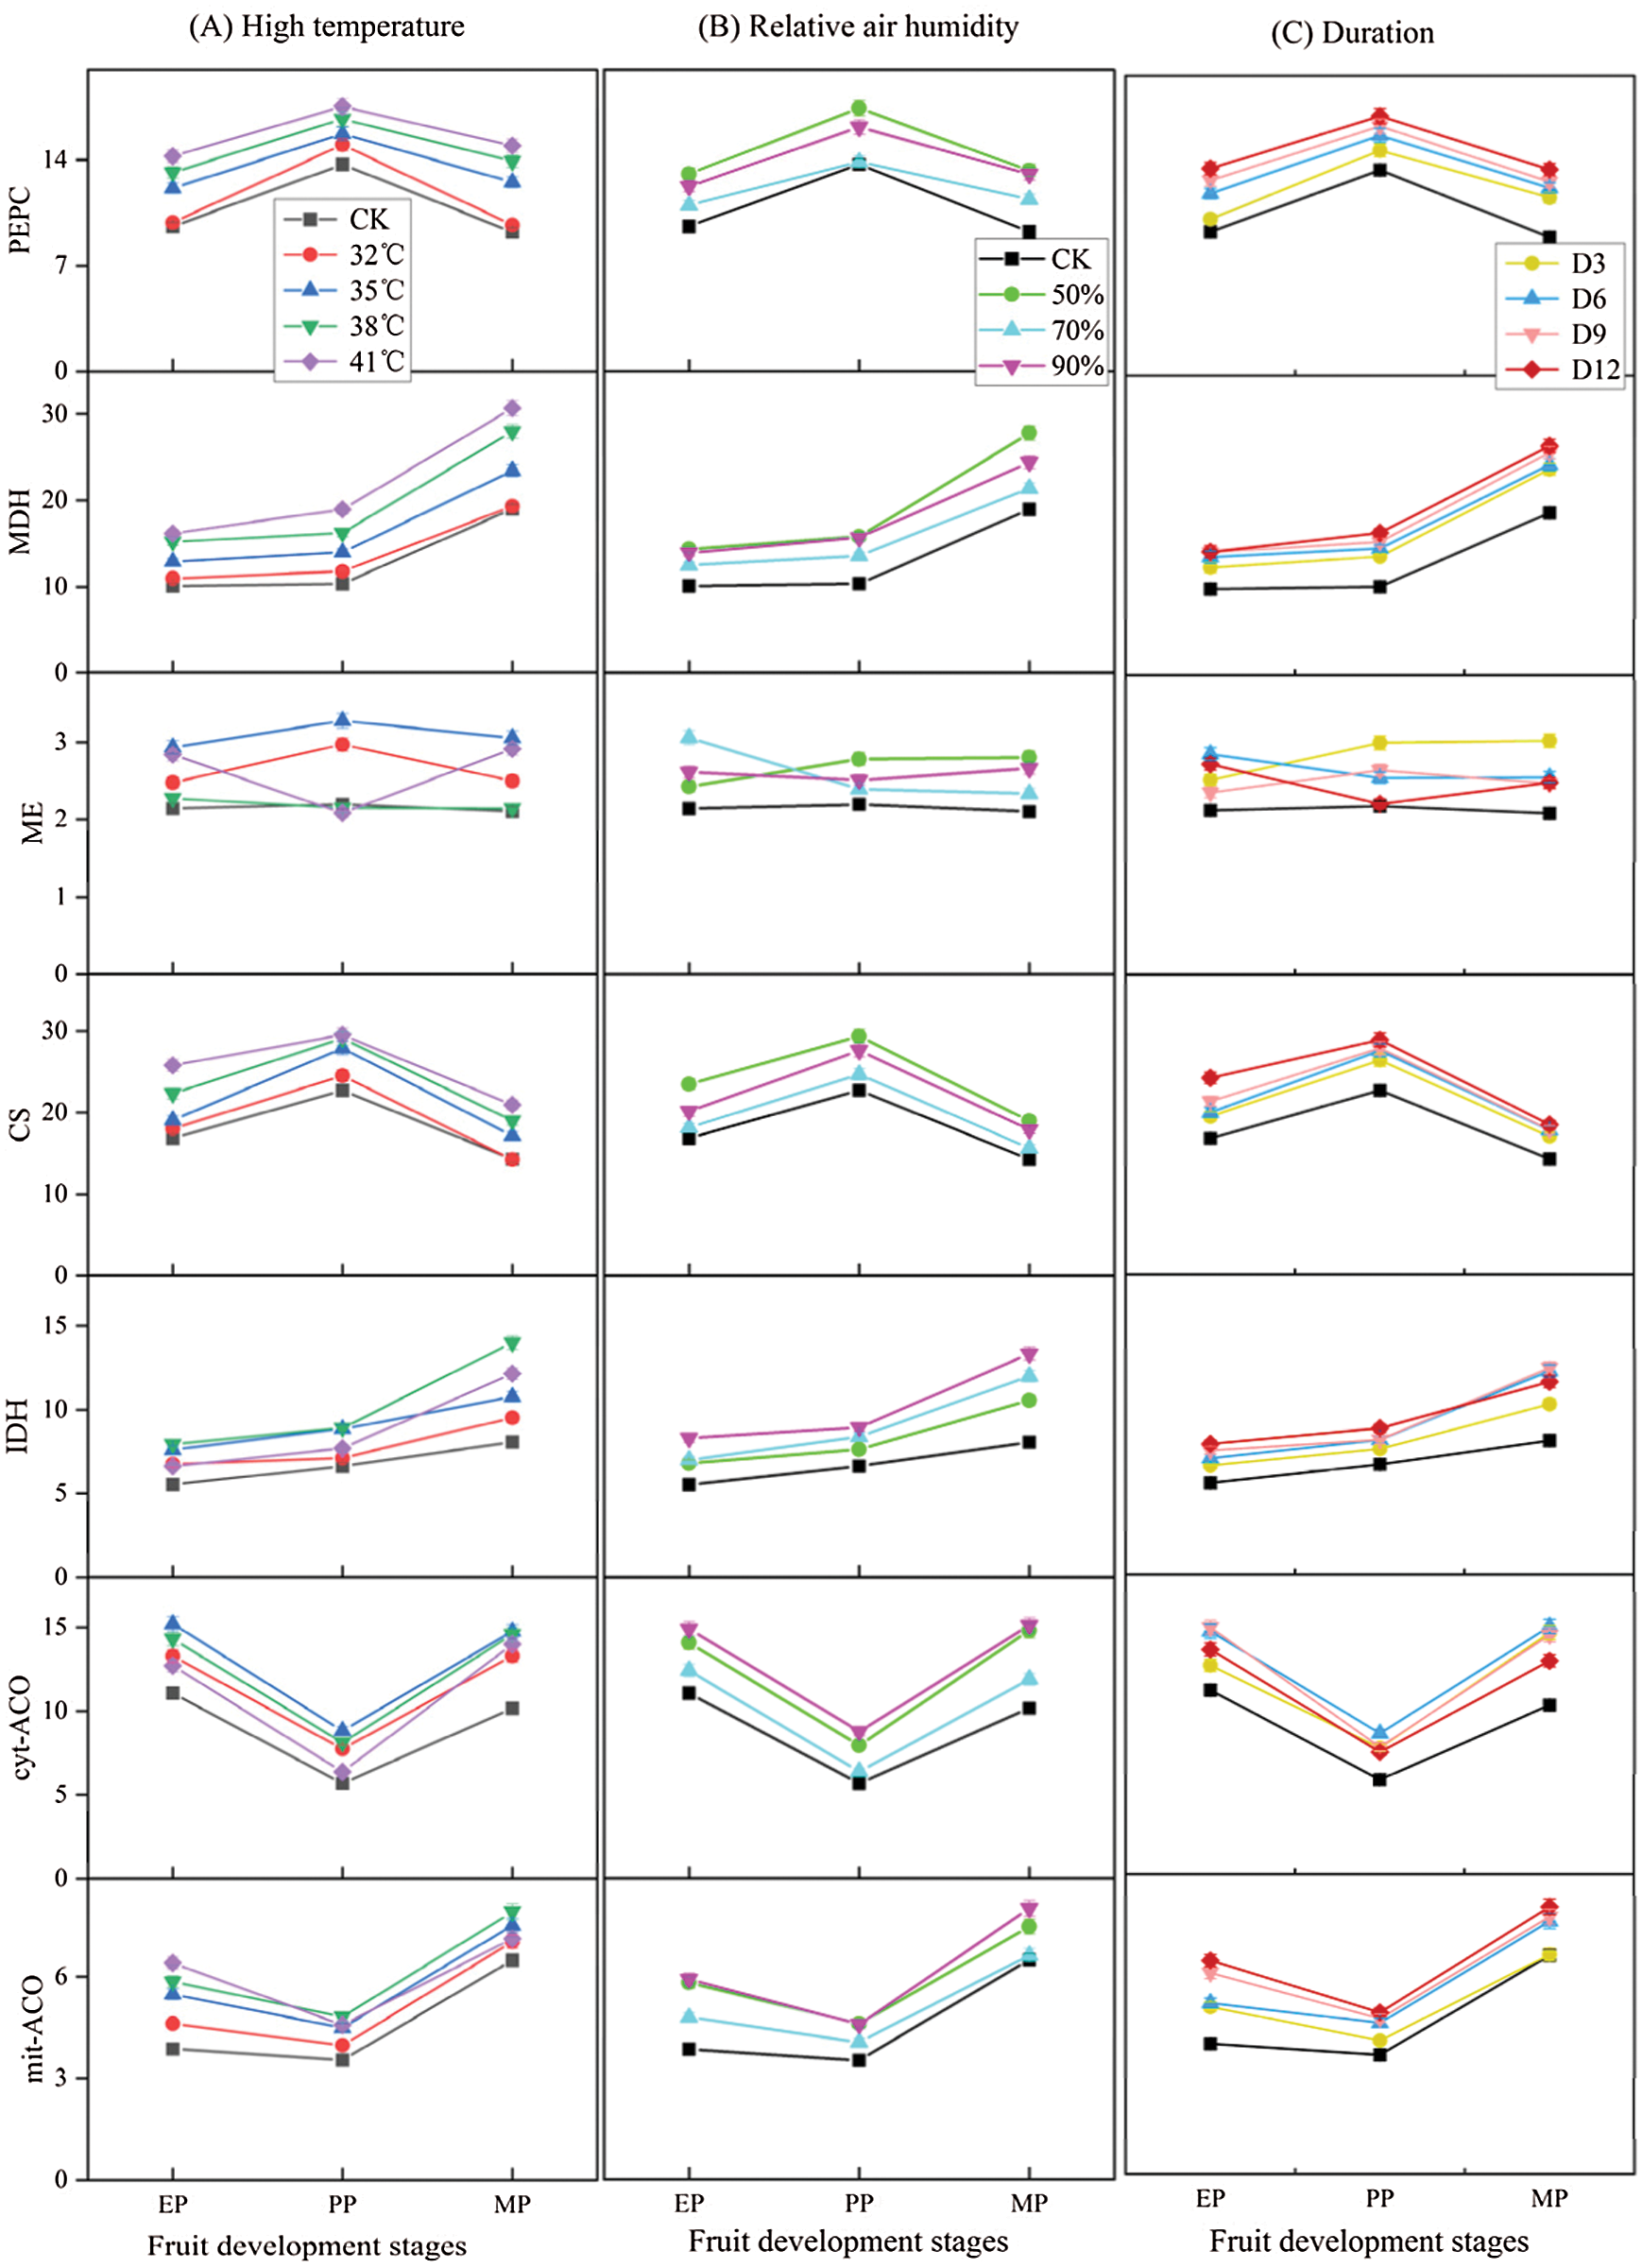
Figure 9: Organic acid metabolism enzyme activity of tomato fruit under different treatment conditions. The unit of organic acid metabolism enzyme activity is μmol g−1 h−1 FW. EP (Expansion period, 63–70 d after transplanting); PP (pink period, 77–84 d after transplanting); MP (maturing period, 91 d after transplanting). Data are mean ± SD (n = 3)
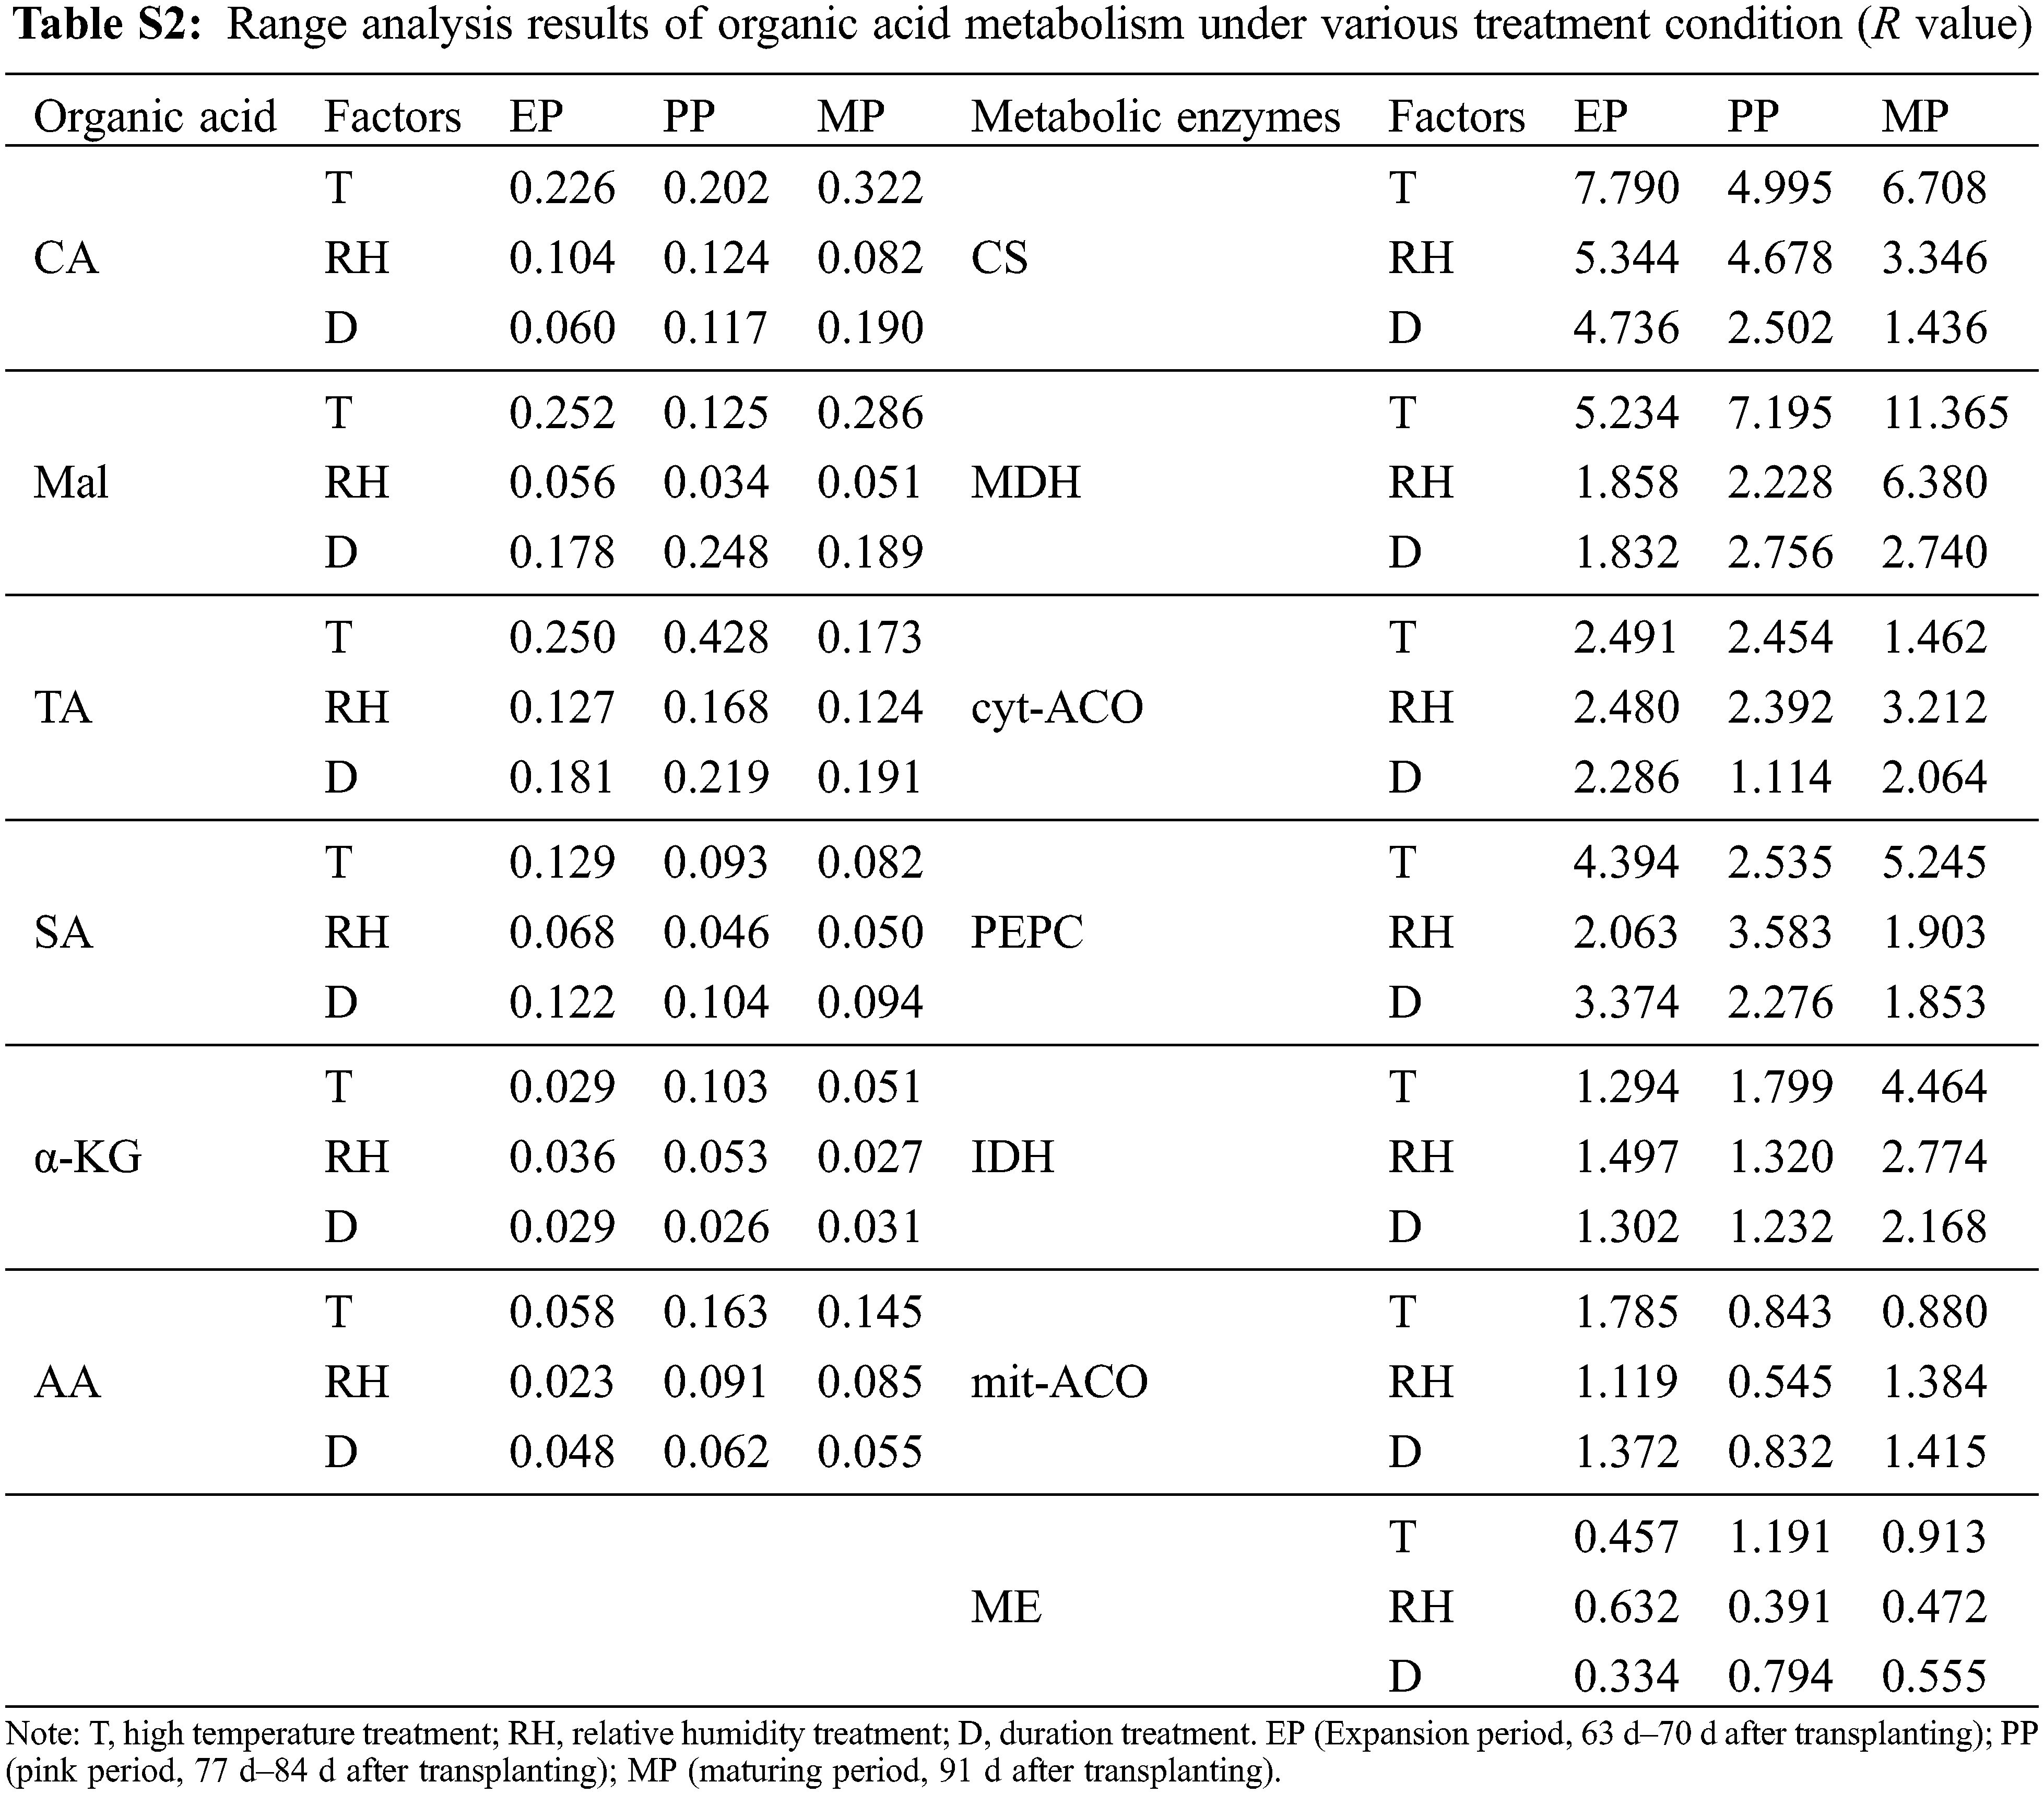
The range of organic acid and enzyme activities in organic acid metabolism was RT > RD > RTH (Table S2). Therefore, the sensitivity of T, RH and D to organic acid metabolism was T > D > RH. The result indicates that organic acid metabolism was strongly affected by high temperature environment. Among the three stages of fruit development, the maximum R of CA appeared in MP period, while the maximum R of TA, α-KG and AA appeared in PP period. In addition, the R value of metabolic enzyme activity was the largest in EP period.
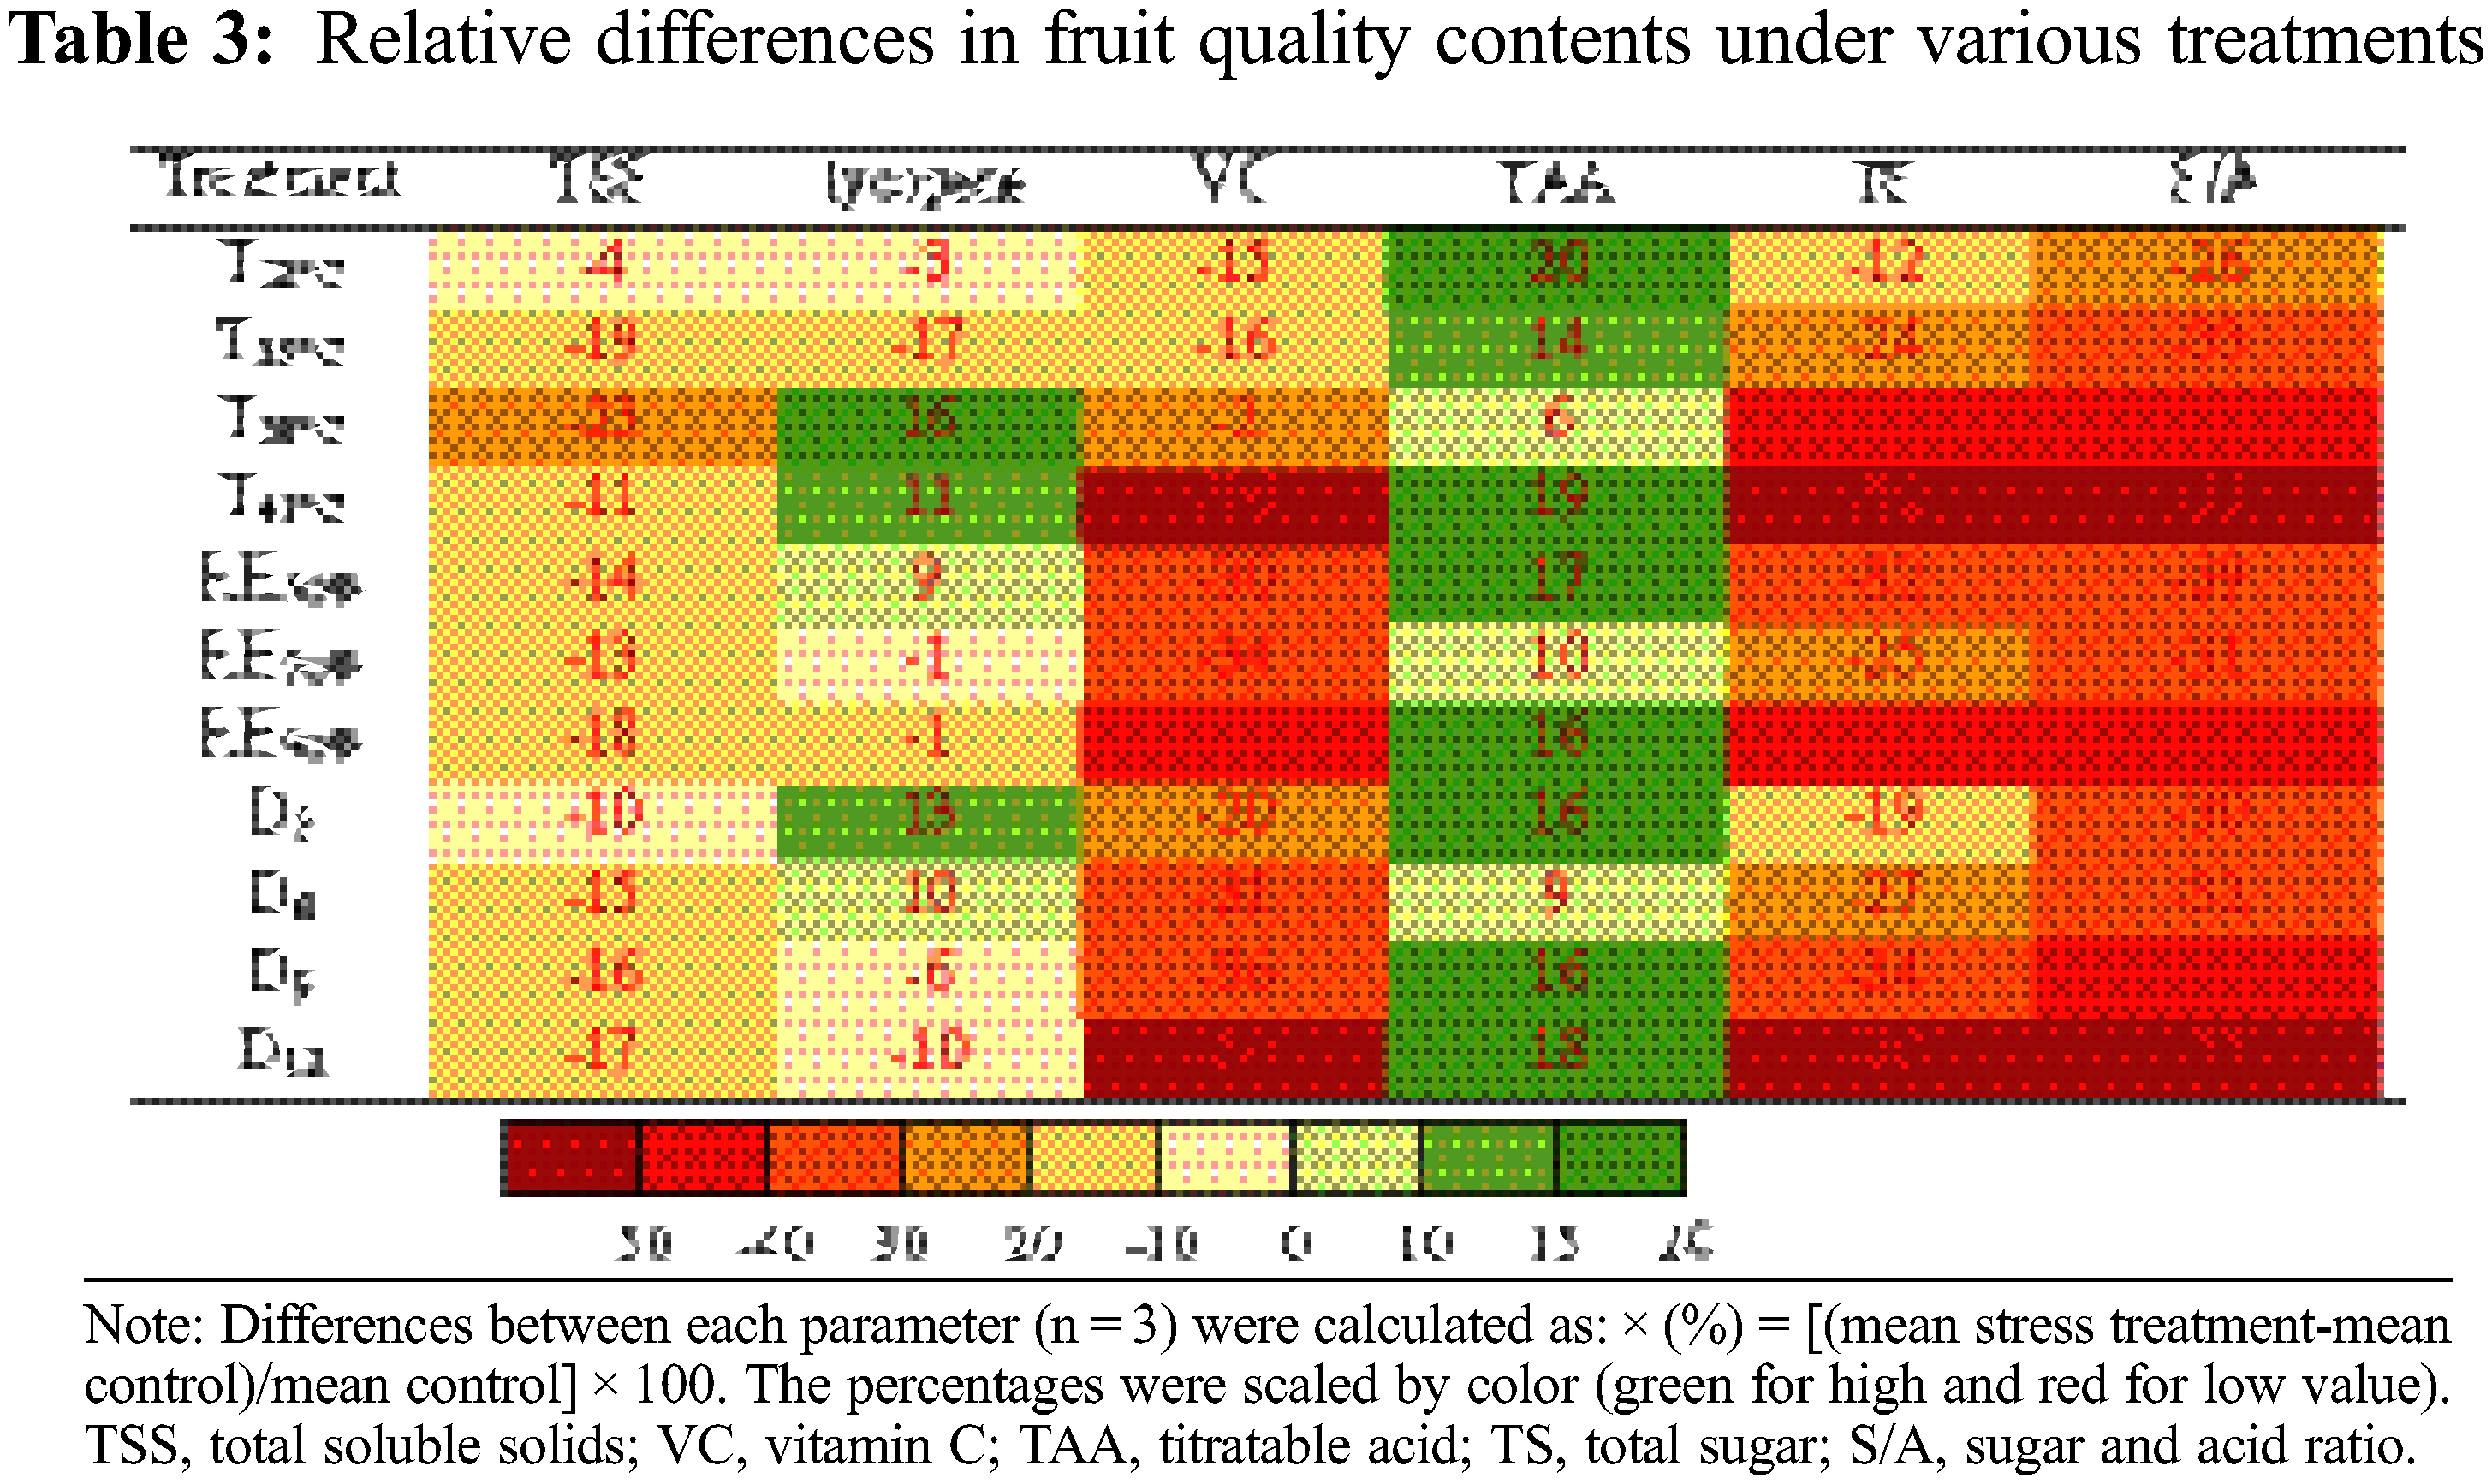
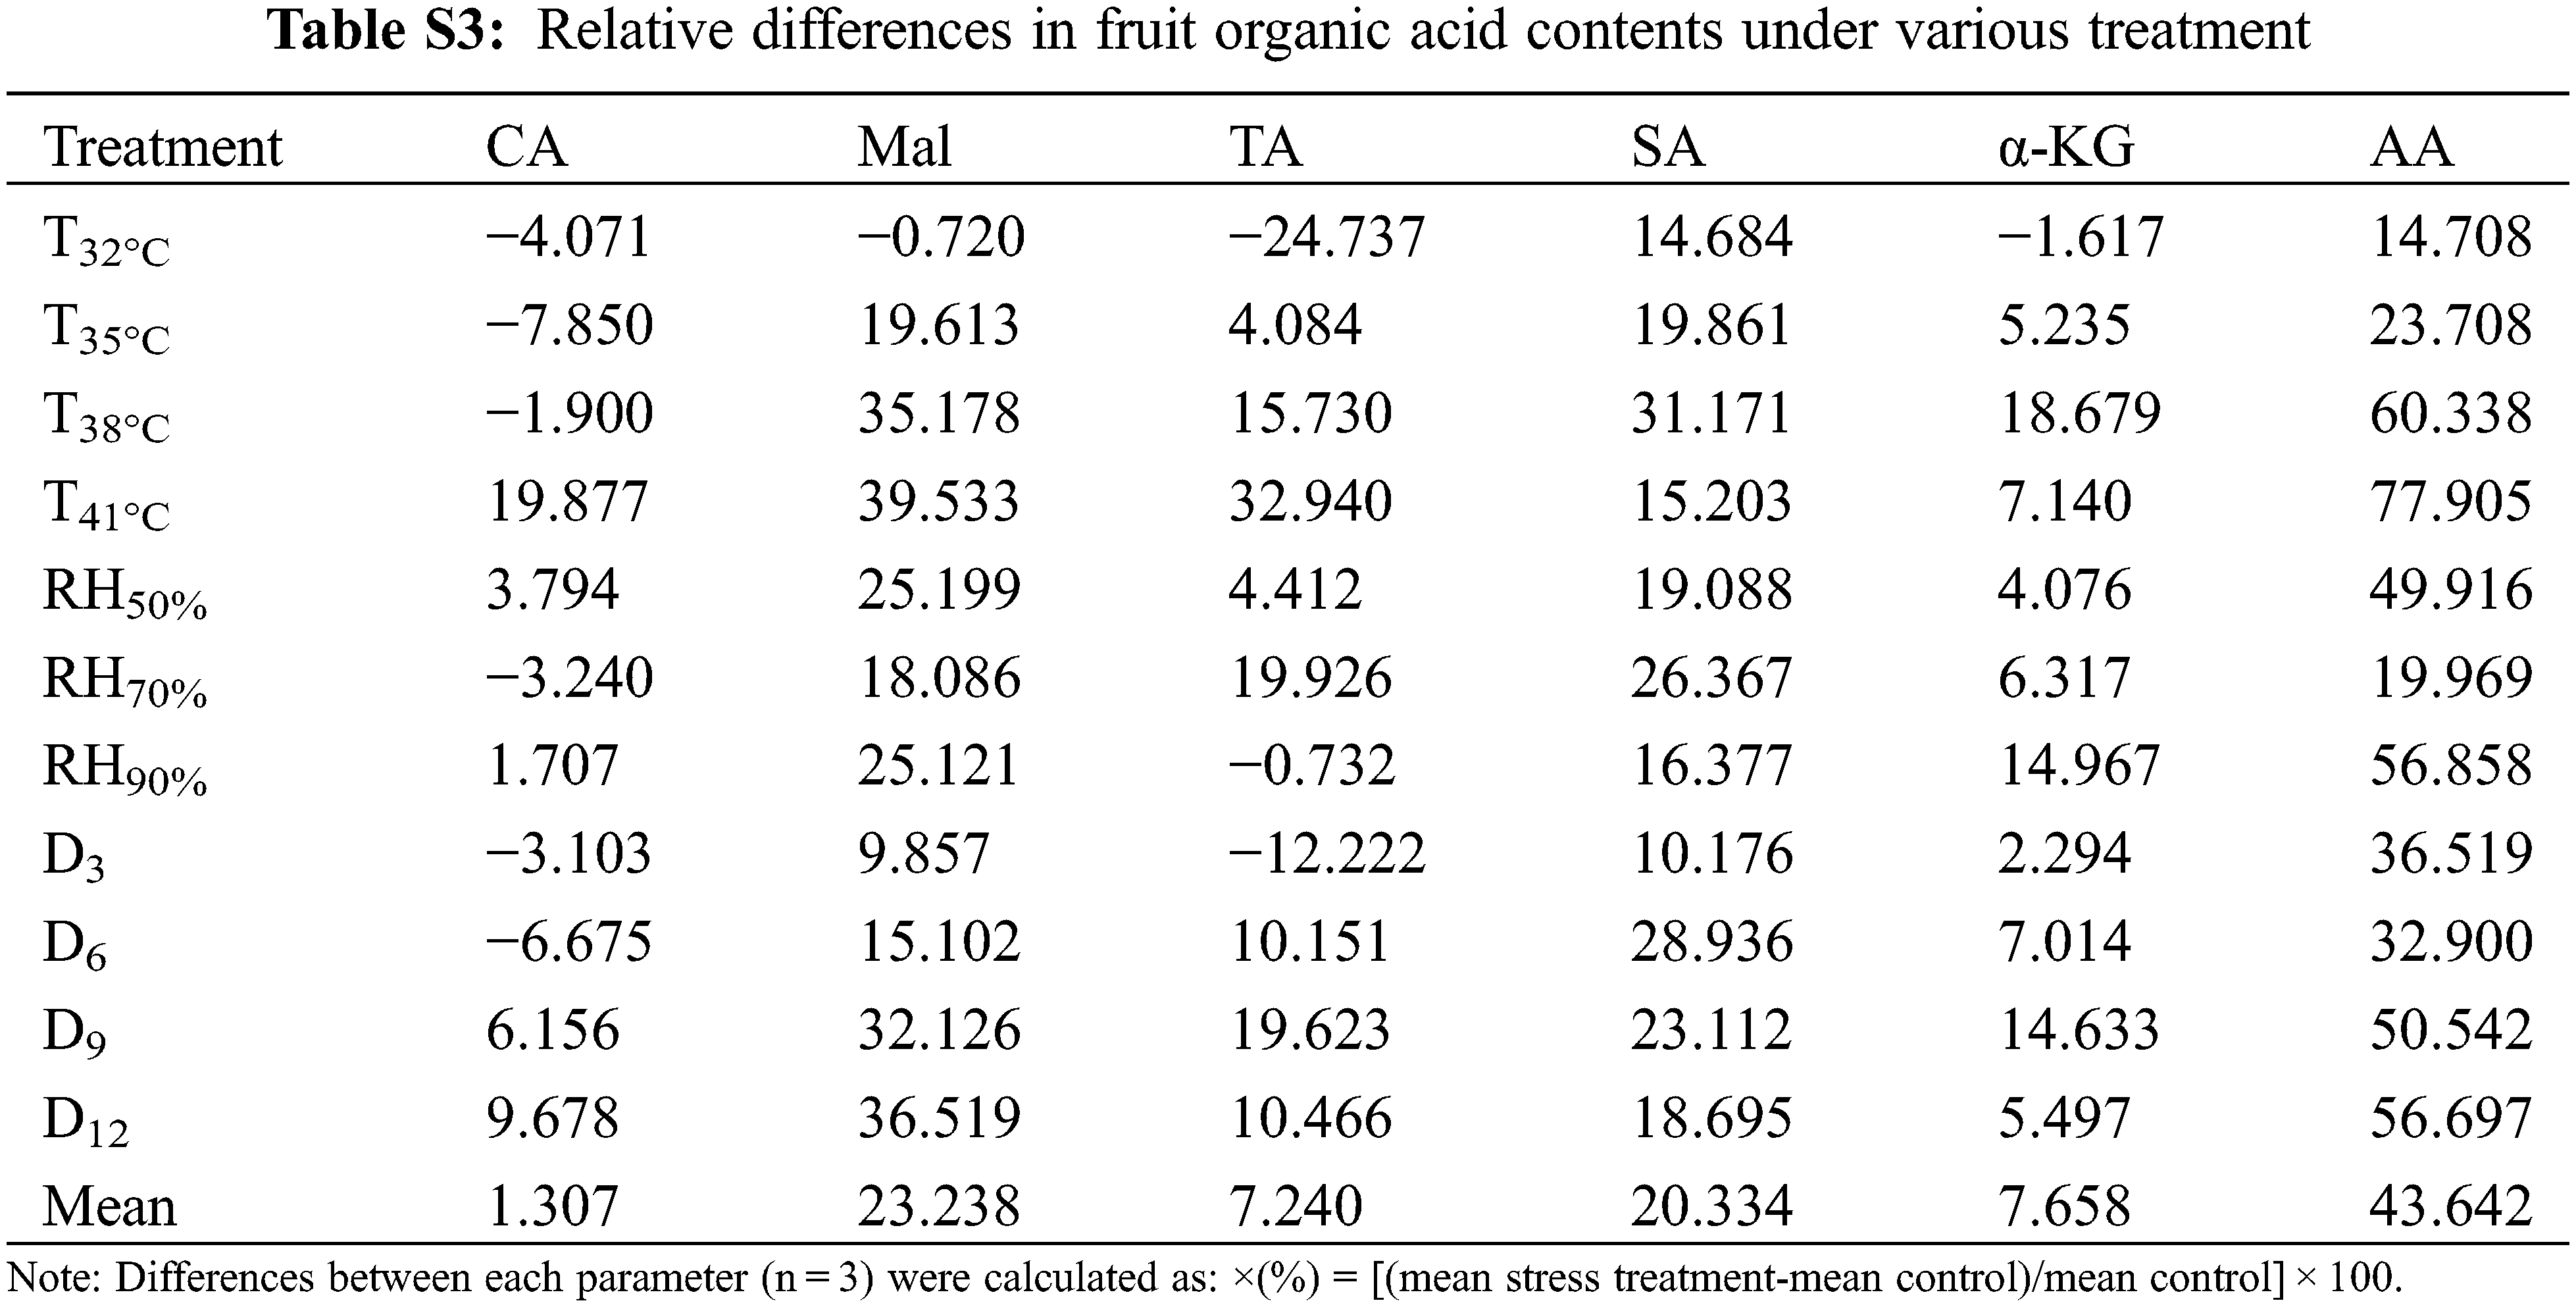
Tomato fruit qualities involved in TSS, lycopene, VC, TAA, TS, sugar and acid ratio (S/A) were measured at maturity. The tomato fruit quality showed a decreased trend in various T, RH and D treatment conditions (Table 3). Notably, TAA was increased in the various treatments, mainly due to higher accumulation of both Mal (23%, compared to CK) and AA (44%) (Table S3). On the contrary, TS accumulation was greatly reduced, especially in T41°C treatment (−52%) and D12 treatment (−50%). Hence the S/A was reduced by the three treatments, which seriously reduced the flavor quality of the fruit. The accumulation of TSS also decreased under various treatments. Nutritional quality lycopene content was no significantly affected by the various treatments compared with the change of sugar and acid accumulation, except for T38°C, T41°C and D3 treatments, increased by 16%, 11% and 13%, respectively. In contrast, the content of another nutritional quality VC was significantly reduced, especially in the treatment of T41°C (−76%).
Normally, the reproductive stage (flowering and fruit setting stage) was more sensitive to heat stress than the vegetative stage [14]. Early development (fruit cell division stage) was the golden period of the whole fruit development process, which played an important role in the final formation of the fruit [41]. In this study, the range of soluble sugar and organic acid content was the largest at the EP stage (Tables S1, S2), indicating that the external environmental conditions during the flowering period had the greatest impact on the sugar and acid content in the early stage of the fruit and affected the final quality. Researcher believed that the sensory and nutritional quality characteristics of ripe tomato fruits were also determined in the early stages [42].
Sugar accumulation was the key to the formation of tomato fruit quality [43]. Sucrose formed by photosynthesis of leaves was transported into the fruit through the phloem and was broken down into hexose under the action of sucrose metabolizing enzymes [18]. Environmental conditions could directly change the synthesis/degradation process of tomato fruit sugar metabolites. In this study, a decrease of soluble sugar content was observed at high temperature conditions compared to CK (Fig. 5). The reasons were as follows: firstly, SS activity decreased at high temperature treatment. Demnitz et al. [44] found that in the early stage of tomato fruit development, the change of SS activity could directly affect the accumulation rate of dry matter in the fruit and the decomposition index of sucrose, which in turn affected the sucrose input capacity in young fruit. Our study showed that SS-c activity was reduced under high temperature conditions, which reduced the sucrose content unloaded from the phloem to the fruit, resulting in a decrease in carbohydrates in the fruit. Secondly, under high temperature conditions, the respiration and material metabolism of the tomato fruit were stimulated, and cells that constituted the pulp tissue developed rapidly, which promoted the hypertrophy of the fruit, leading to the advancement of the fruit growth period, which may change the final fruit quality components. Soluble sugars in tomato fruits include fructose and glucose, which have different contributions to fruit sweetness. This article only studied the content of total soluble sugars. The changes of fructose and glucose content in fruits under high temperature and high humidity treatment and their relationship with sucrose metabolizing enzymes need to be further studied.
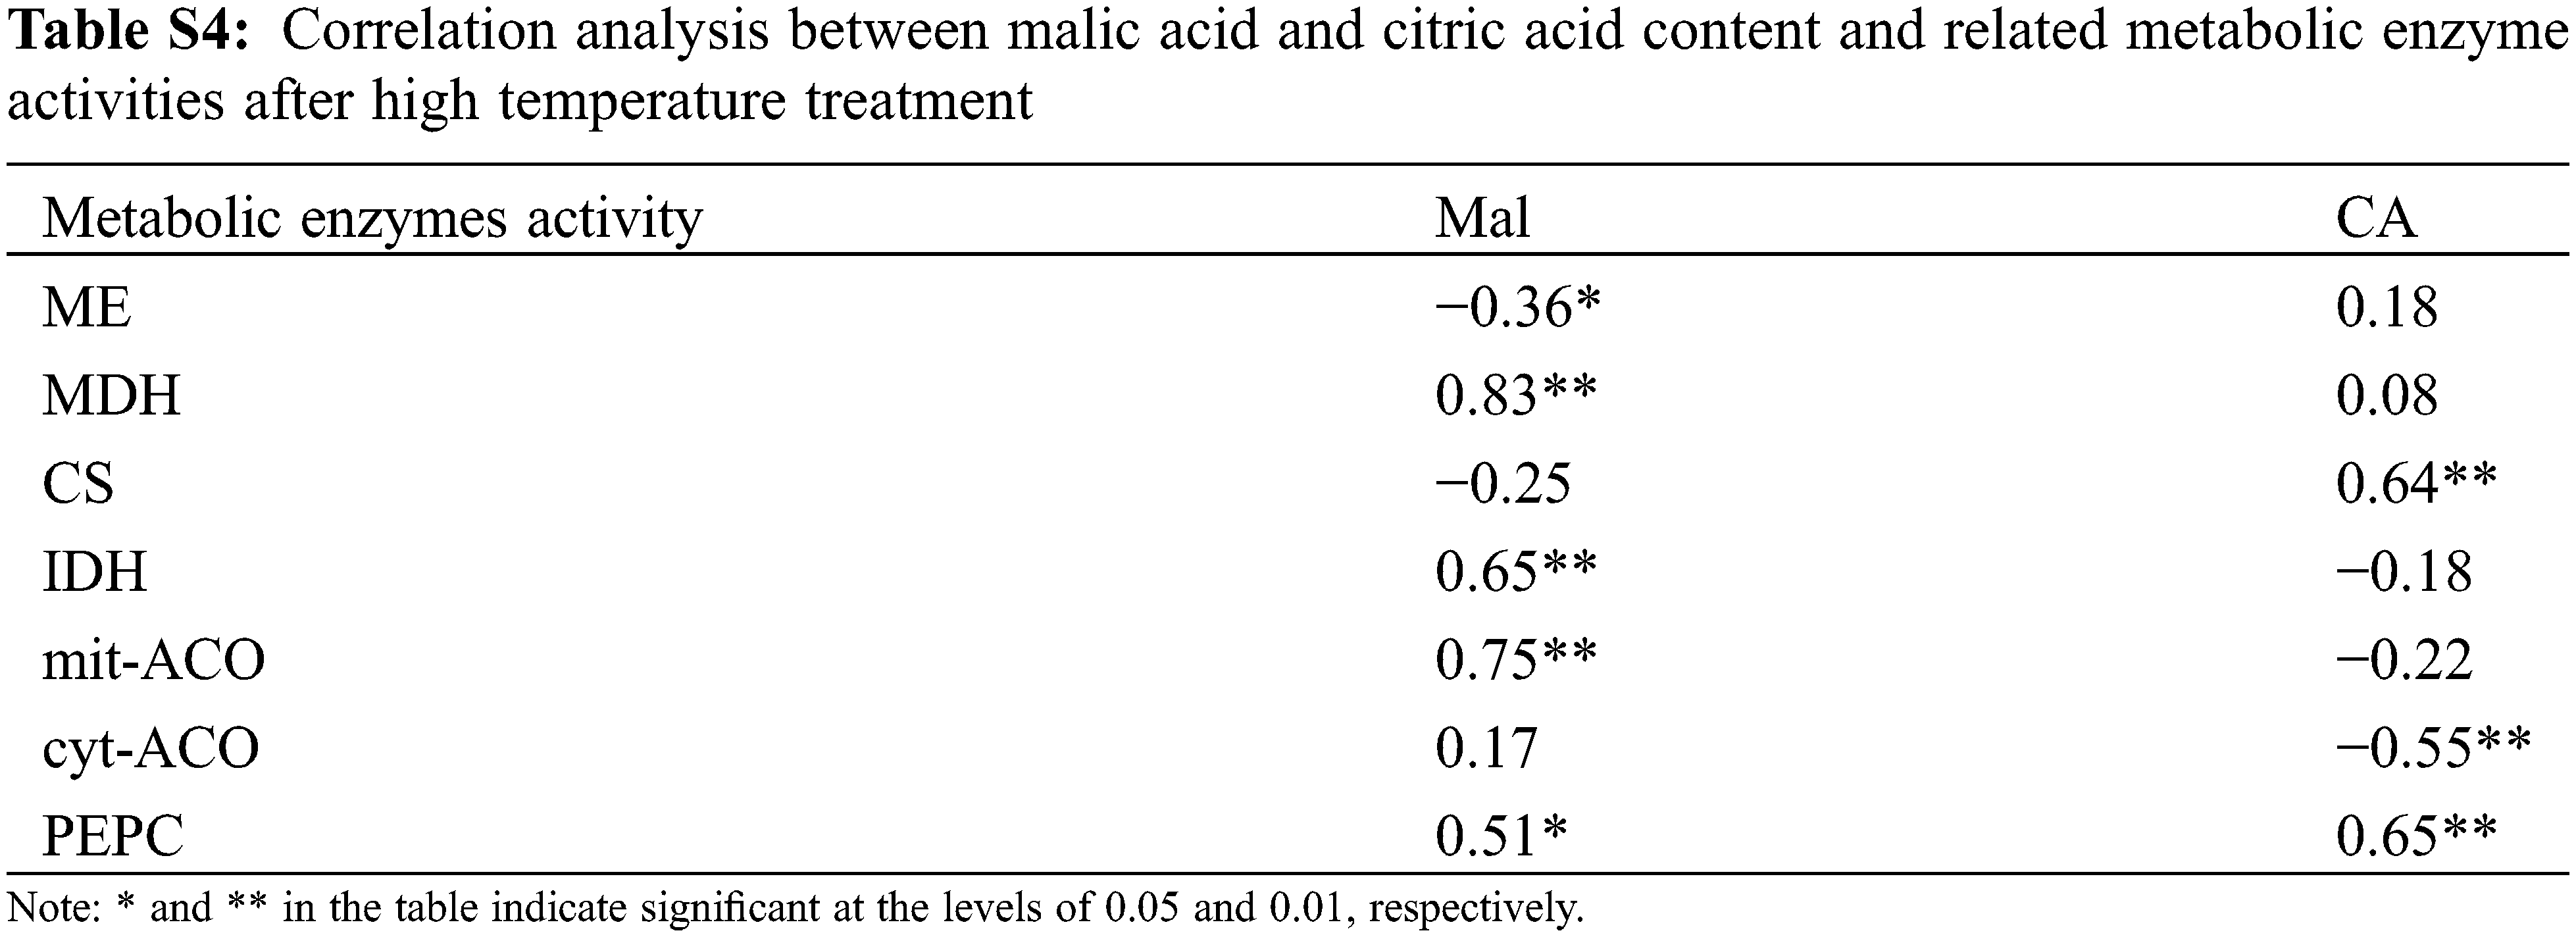
Organic acids were an important component of tomato flavor quality [16], and environmental conditions could also directly change the synthesis/degradation process of fruits organic acid metabolites. In this study, organic acids increased with high temperature stress, except for CA, which was consistent with the conclusion of Ruiz-Nieves et al. [45]. Below T38°C condition, CA content gradually decreased with the increased of the stress intensity and the stress time (Fig. 7), while it was higher compared to CK at T41°C. It was speculated that higher CA content may help plants resist heat stress according to Zhao et al. [46]. In our study, CA content was higher than CK at T41°C, which may be a way for plants to cope with heat stress. Organic acids in fruit mainly come from the tricarboxylic acid cycle (TCA) in mitochondrion. Under normal environment, organic acids in TCA will not accumulate in large amounts, but it will decrease or accumulate if certain enzyme activity changes in this pathway [47]. In our study, PEPC activity increased under high temperature (Fig. 9), and there was a significant positive correlation between PEPC and CA content (Table S4). This may be related to the increase in expression of certain genes at high temperatures, which makes PEPC activity no longer affected by the concentration of Mal [48]. Furthermore, cyt-ACO activity was significantly negatively correlated with CA, indicating that the decomposition site of CA may be in cytoplasm. Most importantly, Mal was significantly positively correlated with MDH, and MDH activity increases under high temperature, which was beneficial to the synthesis of Mal. Also, ME was not sensitive to ambient temperature [49]. Therefore, high temperature treatment resulted in the increased of Mal.
High temperature reduced tomato yield and quality and changed the sensory and nutritional quality of the fruit [22]. In our study, S/A sharply decreased with high temperature conditions (Table 3), which resulted from a decrease in soluble sugar content and an increase of TA, that ultimately led to a decrease of tomato taste. In addition, our results showed that TSS was reduced under various treatments. Similar results were reported by Li et al. [50] in that the reduction of transpiration, respiration and photosynthesis rate may help reduce the amount of carbohydrates entering peach fruit, thereby reducing the content of soluble solids. Furthermore, treatment with high temperature and duration resulted in a decrease of VC, which was attributed to the enhancement of ascorbateperoxidase and ascorbate oxidase activities and the decrease of dehydroascorbate reductase [23].
It was observed that TSS and S/A in ripe fruit under RH70% conditions were significantly higher than RH50% and RH90% treatments (Fig. S1), indicating that increasing the relative humidity to 70% at high temperature environment can alleviate high temperature stress and improve the negative effect of high temperature on fruit quality. Harel et al. [10] reported that during the hot summer in the Mediterranean, the daily temperature was achieved to 26°C and relative humidity 70%, that was conducive to pollen quality and fruit setting, which in turn increased the yield and quality of tomato. Huang et al. [25] also found that increased humidity (60%–70%) improved pollen and fertilization in comparison with humidity 30%–40% at high temperatures. This will help plants relieve high temperature stress and improve fruit sets rate, thereby improving the yield and quality.
The soluble sugar content in tomato fruits decreases at the environment of high temperature and relative humidity during flowering, and with the extension of high temperature intensity and duration, the content decreases more obviously. At the same time, PEPC, MDH and CS enzyme activities increase, leading to a large accumulation of organic acids, especially Mal, which result in a sharp decrease of S/A and flavor quality and nutritional quality. A temperature of 32°C and a relative air humidity of 70% were the best growth conditions for tomato fruit quality. The external environment (high temperature and relative humidity) during the flowering stage has the greatest impact on the sugar and acid metabolism during EP period. Taken together, our observations indicate that the combined stress of high temperature and relative humidity during flowering reduces fruit sugar content, increases organic acid content, and reduces fruit quality at maturity. The relative humidity is increased to 70% under high temperature, which can relieve high temperature stress and improve fruit quality. This study indirectly contributes to reducing risks of greenhouse tomato production and increasing profit.
Acknowledgement: We thank Xuran Zhang, Shiqiong Yang and Jiashuai Li for their assistance in the experiments.
Funding Statement: This research was funded by National Natural Science Foundation of China under Grant No. 41775104 and National Key Research and Development Plan of China under Grant No. 2019FYD1002202.
Conflicts of Interest: The authors declare that they have no conflicts of interest to report regarding the present study.
1. Carmody, N., Goi, O., Angowski, U., O’Connell, S. (2020). Ascophyllum nodosum extract biostimulant processing and its impact on enhancing heat stress tolerance during tomato fruit set. Frontiers in Plant Science, 11, 807. DOI 10.3389/fpls.2020.00807. [Google Scholar] [CrossRef]
2. Thole, V., Philippe, V., Cathie, M. (2021). Effect of elevated temperature on tomato post-harvest properties. Plants, 10(11), 2359. DOI 10.3390/plants10112359. [Google Scholar] [CrossRef]
3. Rieu, I., Twell, D., Firon, N. (2017). Pollen development at high temperature: From acclimation to collapse. Plant Physiology, 173(4), 1967–1976. DOI 10.1104/pp.16.01644. [Google Scholar] [CrossRef]
4. Zhu, Y., Sims, C. A., Klee, H. J., Sarnoski, P. J. (2018). Sensory and flavor characteristics of tomato juice from garden gem and roma tomatoes with comparison to commercial tomato juice. Journal of Food Science, 83(1), 153–161. DOI 10.1111/1750-3841.13980. [Google Scholar] [CrossRef]
5. Ro, S., Chea, L., Sreymey, N., Stewart, Z. P., Roeurn, S. et al. (2021). Response of tomato genotypes under different high temperatures in field and greenhouse conditions. Plants, 10(3), 449. DOI 10.3390/plants10030449. [Google Scholar] [CrossRef]
6. Shamshiri, R. R. (2017). Measuring optimality degrees of microclimate parameters in protected cultivation of tomato under tropical climate condition. Measurement, 106, 236–244. DOI 10.1016/j.measurement.2017.02.028. [Google Scholar] [CrossRef]
7. Zheng, Y. J., Yang, Z. Q., Xu, C., Wang, L., Yang, S. Q. (2020). The interactive effects of daytime high temperature and humidity on growth and endogenous hormone concentration of tomato seedlings. HortScience, 55(10), 1575–1583. DOI 10.21273/HORTSCI15145-20. [Google Scholar] [CrossRef]
8. Bita, C., Gerats, T. (2013). Plant tolerance to high temperature in a changing environment: Scientific fundamentals and production of heat stress-tolerant crops. Frontiers in Plant Science, 4(273), 1–18. DOI 10.3389/fpls.2013.00273. [Google Scholar] [CrossRef]
9. Li, S., Willits, D. H. (2008). Comparing low-pressure and high-pressure fogging systems in naturally ventilated greenhouses. Biosystems Engineering, 101(1), 69–77. DOI 10.1016/j.biosystemseng.2008.06.004. [Google Scholar] [CrossRef]
10. Harel, D., Fadida, H., Gantz, S., Shilo, K., Yasuor, H. (2013). Evaluation of low pressure fogging system for improving crop yield of tomato (Lycopersicon esculentum Mill.Grown under heat stress conditions. Agronomy, 3, 497–507. DOI 10.3390/agronomy3020497. [Google Scholar] [CrossRef]
11. Xin, X. F., Nomura, K., Aung, K., Velasquez, A. C., Yao, J. et al. (2016). Bacteria establish an aqueous living space in plants crucial for virulence. Nature, 539, 524–529. DOI 10.1038/nature20166. [Google Scholar] [CrossRef]
12. Janka, E., Körner, O., Rosenqvist, E., Ottosen, C. O. (2016). A coupled model of leaf photosynthesis, stomatal conductance, and leaf energy balance for chrysanthemum (Dendranthema grandiflora). Computers and Electronics in Agriculture, 123, 264–274. DOI 10.1016/j.compag.2016.02.022. [Google Scholar] [CrossRef]
13. Iddio, E., Wang, L., Thomas, Y., Mcmorrow, G., Denzer, A. (2020). Energy efficient operation and modeling for greenhouses: A literature review. Renewable Sustainable Energy Reviews, 117, 109480. DOI 10.1016/j.rser.2019.109480. [Google Scholar] [CrossRef]
14. Alsamir, M., Chattha, T. M., Trethowan, R., Ahmad, N. M. (2021). An overview of heat stress in tomato (Solanum lycopersicum L.). Saudi Journal of Biological Sciences, 28(3), 1654–1663. DOI 10.1016/j.sjbs.2020.11.088. [Google Scholar] [CrossRef]
15. Bhattarai, S., Harvey, J. T., Djidonou, D., Leskovar, D. I. (2021). Exploring morpho-physiological variation for heat stress tolerance in tomato. Plants, 10(2), 347. DOI 10.3390/plants10020347. [Google Scholar] [CrossRef]
16. Cheng, G., Chang, P., Shen, Y., Wu, L., Liang, Y. (2020). Comparing the flavor characteristics of 71 tomato (Solanum lycopersicum) accessions in central Shaanxi. Frontiers in Plant Science, 11, 586834. DOI 10.3389/fpls.2020.586834. [Google Scholar] [CrossRef]
17. Liu, T., Cheng, Z., Meng, H., Ahmad, I., Zhao, H. (2014). Growth, yield and quality of spring tomato and physicochemical properties of medium in a tomato/garlic intercropping system under plastic tunnel organic medium cultivation. Scientia Horticulturae, 170, 159–168. DOI 10.1016/j.scienta.2014.02.039. [Google Scholar] [CrossRef]
18. Shang, L., Song, J., Wang, J., Zhang, Y., Ye, Z. (2019). Research progress on quality formation and molecular mechanism of tomato fruit. China Vegetables, 4, 21–28. [Google Scholar]
19. Zhang, J., Li, T. (2008). Effects of sub-high temperature treatment in different stages on tomato yield and quality in solar greenhouse. Jiangsu Agricultural Sciences, (1), 131–133. [Google Scholar]
20. Gautier, H., Diakou-Verdin, V., Bénard, C., Reich, M., Buret, M. et al. (2008). How does tomato quality (sugar, acid, and nutritional quality) vary with ripening stage, temperature, and irradiance? Journal of Agricultural and Food Chemistry, 56(4), 1241. DOI 10.1021/jf072196t. [Google Scholar] [CrossRef]
21. Almeida, J., Perez-Fons, L., Fraser, P. D. (2020). A transcriptomic, metabolomic and cellular approach to the physiological adaptation of tomato fruit to high temperature. Plant, Cell & Environment, 44(7), 2211–2229. DOI 10.1111/pce.13854. [Google Scholar] [CrossRef]
22. Hernández, V., Hellín, P., Fenoll, J., Cava, J., Garrido, I. et al. (2018). The use of biostimulants can mitigate the effect of high temperature on productivity and quality of tomato. Acta Horticulturae, 85–90. DOI 10.17660/ActaHortic.2018.1194.14. [Google Scholar] [CrossRef]
23. Hernández, V., Hellín, P., Fenoll, J., Flores, P. (2015). Increased temperature produces changes in the bioactive composition of tomato, depending on its developmental stage. Journal of Agricultural and Food Chemistry, 63(9), 2378–2382. DOI 10.1021/jf505507h. [Google Scholar] [CrossRef]
24. Danny, H., Hadar, F., Alik, S., Shelly, G., Kobi, S. (2014). The effect of mean daily temperature and relative humidity on pollen, fruit set and yield of tomato grown in commercial protected cultivation. Agronomy, 4, 167–177. DOI 10.3390/agronomy4010167. [Google Scholar] [CrossRef]
25. Huang, Y., Li, Y., Wen, X. (2011). The effect of relative humidity on pollen vigor and fruit setting rate of greenhouse tomato under high temperature condition. Acta Agriculturae Boreali-Occidentalis Sinica, 20(11), 105–110. [Google Scholar]
26. Thioune, E. H., Mccarthy, J., Gallagher, T., Osborne, B. (2017). A humidity shock leads to rapid, temperature dependent changes in coffee leaf physiology and gene expression. Tree Physiology, 37(3), 367–379. DOI 10.1093/treephys/tpw129. [Google Scholar] [CrossRef]
27. Huang, S., Yan, H., Zhang, C., Wang, G., Darko, R. O. (2019). Modeling evapotranspiration for cucumber plants based on the shuttleworth-wallace model in a venlo-type greenhouse. Agricultural Water Management, 228, 105861. DOI 10.1016/j.agwat.2019.105861. [Google Scholar] [CrossRef]
28. Yan, H., Zhang, C., Miriam, C. G., Joe, A. S., Zhang, H. et al. (2018). Parametrization of aerodynamic and canopy resistances for modeling evapotranspiration of greenhouse cucumber. Agricultural Forest Meteorology, 262, 370–378. DOI 10.1016/j.agrformet.2018.07.020. [Google Scholar] [CrossRef]
29. Ma, C., Xiao, J., Yang, G., Feng, Y., Lu, B. (2019). Long-term dynamic changes and variability of heavy rainfall in Nanjing. Journal of China Hydrology, 39, 76–80. [Google Scholar]
30. Wei, T., Yang, Z., Wang, L., Zhao, H., Li, J. (2018). Simulation model of hourly air temperature inside glass greenhouse and plastic greenhouse. Chinese Journal of Agrometeorology, 39(10), 26–37. [Google Scholar]
31. Liao, L., Dong, T., Qiu, X., Rong, Y., Zhu, J. (2019). Nitrogen nutrition is a key modulator of the sugar and organic acid content in citrus fruit. PLoS One, 14(10), e0223356. DOI 10.1371/journal.pone.0223356. [Google Scholar] [CrossRef]
32. Zheng, H., Zhang, Q., Quan, J., Zheng, Q., Xi, W. (2016). Determination of sugars, organic acids, aroma components, and carotenoids in grapefruit pulps. Food Chemistry, 205, 112–121. DOI 10.1016/j.foodchem.2016.03.007. [Google Scholar] [CrossRef]
33. Wu, Z., Tu, M., Yang, X., Xu, J., Yu, Z. (2020). Effect of cutting and storage temperature on sucrose and organic acids metabolism in postharvest melon fruit. Postharvest Biology and Technology, 161, 111081. DOI 10.1016/j.postharvbio.2019.111081. [Google Scholar] [CrossRef]
34. Liu, R., Wang, Y., Qin, G., Tian, S. (2016). Molecular basis of 1-methylcyclopropene regulating organic acid metabolism in apple fruit during storage. Postharvest Biology and Technology, 117, 57–63. DOI 10.1016/j.postharvbio.2016.02.001. [Google Scholar] [CrossRef]
35. Han, S., Nan, Y., Qu, W., He, Y., Ban, Q. (2018). Exogenous γ-aminobutyric acid treatment that contributes to regulation of malate metabolism and ethylene synthesis in apple fruit during storage. Journal of Agricultural and Food Chemistry, 66(51), 13473–13482. DOI 10.1021/acs.jafc.8b04674. [Google Scholar] [CrossRef]
36. Tang, M., Bie, Z. L., Wu, M. Z., Yi, H. P., Feng, J. X. (2010). Changes in organic acids and acid metabolism enzymes in melon fruit during development. Scientia Horticulturae, 123(3), 360–365. DOI 10.1016/j.scienta.2009.11.001. [Google Scholar] [CrossRef]
37. Li, H., Liu, H., Gong, X., Li, S., Pang, J. et al. (2021). Optimizing irrigation and nitrogen management strategy to trade off yield, crop water productivity, nitrogen use efficiency and fruit quality of greenhouse grown tomato. Agricultural Water Management, 245, 106570. DOI 10.1016/j.agwat.2020.106570. [Google Scholar] [CrossRef]
38. Aubert, C., Chalot, G., Lurol, S., Ronjon, A., Valentine, C. (2019). Relationship between fruit density and quality parameters, levels of sugars, organic acids, bioactive compounds and volatiles of two nectarine cultivars, at harvest and after ripening. Food Chemistry, 297, 124954. DOI 10.1016/j.foodchem.2019.124954. [Google Scholar] [CrossRef]
39. Frías-Moreno, M. N., Espino-Díaz, M., Dávila-Avia, J., Gonzalez-Aguilar, G. A., Orozco, G. (2020). Preharvest nitrogen application affects quality and antioxidant status of two tomato cultivars. Bragantia, 79, 1–11. DOI 10.1590/1678-4499.20190247. [Google Scholar] [CrossRef]
40. Liu, R., Zhang, Y., Wen, C., Tang, J. (2010). Study on the design and analysis methods of orthogonal experiment. Experimental Technology and Management, 27(9), 52–55. [Google Scholar]
41. Tanksley, S. D. (2004). The genetic, developmental, and molecular bases of fruit size and shape variation in tomato. Plant Cell, 16, S181–S189. DOI 10.1105/tpc.018119. [Google Scholar] [CrossRef]
42. Hiroshi, E., Tohru, A., Jordi, G. M., Jocelyn, R. (2016). Functional genomics and biotechnology in solanaceae and cucurbitaceae crops. Berlin: Springer. [Google Scholar]
43. D’Angelo, M., María, I. Z., María, S., Pablo, R. C., Silvana, B. B. et al. (2018). Contrasting metabolic profiles of tasty andean varieties of tomato fruit in comparison with commercial ones. Journal of the Science of Food and Agriculture, 98(11), 4128–4134. DOI 10.1002/jsfa.8930. [Google Scholar] [CrossRef]
44. Demnitz-King, A., Ho, L. C., Baker, D. A. (1997). Activity of sucrose hydrolysing enzymes and sugar accumulation during tomato fruit development. Plant Growth Regulation, 22(3), 193–201. DOI 10.1023/A:1005985213777. [Google Scholar] [CrossRef]
45. Ruiz-Nieves, J. M., Ayala-Garay, O. J., Serra, V., Dumont, D., Gautier, H. (2020). The effects of diurnal temperature rise on tomato fruit quality. Can the management of the greenhouse climate mitigate such effects? Scientia Horticulturae, 278, 109836. DOI 10.1016/j.scienta.2020.109836. [Google Scholar] [CrossRef]
46. Zhao, Z., Hu, L., Hu, T., Fu, J. (2015). Differential metabolic responses of two tall fescue genotypes to heat stress. Acta Prataculturae Sinica, 24(3), 58–69. [Google Scholar]
47. Xu, X. (2009). Effects of nitrogen forms on the dynamic changes of tomato fruit growth and organic acid metabolism (Master Thesis). Nanjing Agricultural University, China. [Google Scholar]
48. Sweetman, C., Sadras, V. O., Hancock, R. D., Soole, K. L., Ford, C. M. (2014). Metabolic effects of elevated temperature on organic acid degradation in ripening vitis vinifera fruit. Journal of Experimental Botany, 65(20), 5975–5988. DOI 10.1093/jxb/eru343. [Google Scholar] [CrossRef]
49. Rienth, M., Torregrosa, L., Sarah, G., Ardisson, M., Brillouet, J. M. et al. (2016). Temperature desynchronizes sugar and organic acid metabolism in ripening grapevine fruits and remodels their transcriptome. BMC Plant Biology, 16(1), 164. DOI 10.1186/s12870-016-0850-0. [Google Scholar] [CrossRef]
50. Li, S. H., Génard, M., Bussi, C., Huguet, J. G., Habib, R. et al. (2001). Fruit quality and leaf photosynthesis in response to microenvironment modification around individual fruit by covering the fruit with plastic in nectarine and peach trees. Journal of Pomology and Horticultural Science, 76(1), 61–69. DOI 10.1080/14620316.2001.11511328. [Google Scholar] [CrossRef]
Supplemental Information
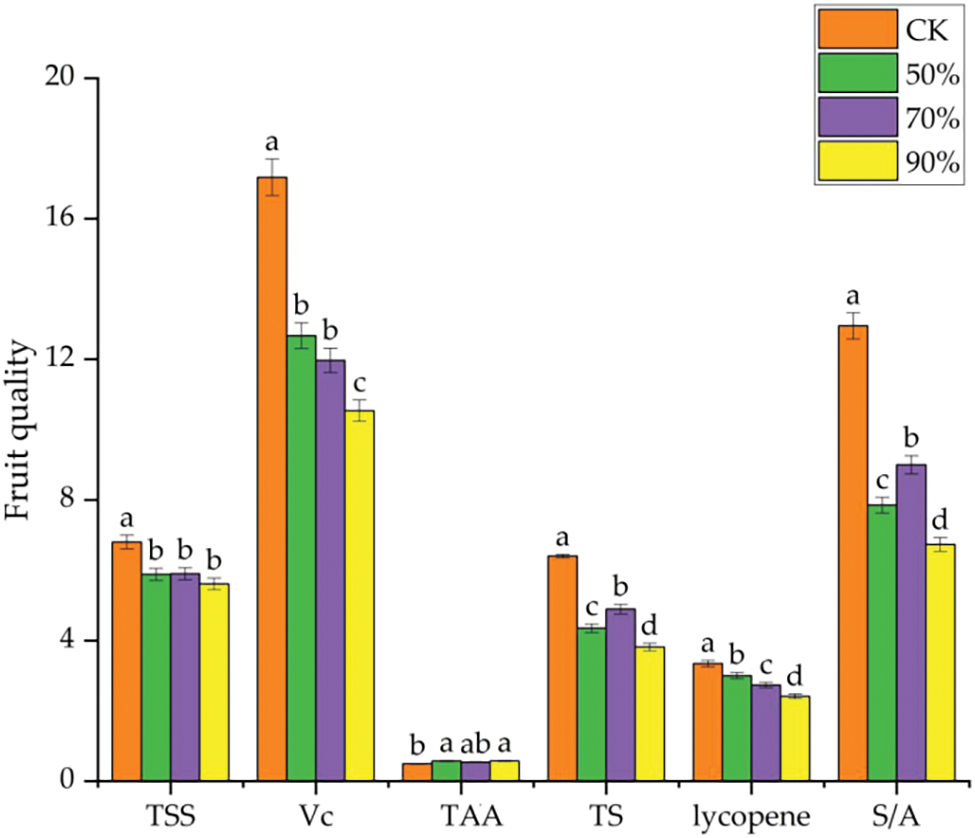
Figure S1: Tomato fruit quality at the mature stage under different relative humidity in high temperature environment. TSS, total soluble solids; Vc, Vitamin C; TAA, titratable acid; TS, total sugar; S/A, sugar and acid ratio. Data are mean ± SD (n = 3); alphabetical letters (a, b) indicate significant differences, as determined by ANOVA followed by Tukey’s tests (P < 0.05).
 | This work is licensed under a Creative Commons Attribution 4.0 International License, which permits unrestricted use, distribution, and reproduction in any medium, provided the original work is properly cited. |