| Phyton-International Journal of Experimental Botany |
DOI: 10.32604/phyton.2022.021069
ARTICLE
Agro-Morphological Characterization and Genetic Dissection of Linseed (Linum usitatissimum L.) Genotypes
1Department of Crop Botany, Bangladesh Agricultural University, Mymensingh, 2202, Bangladesh
2Spices Research Sub-Centre, Bangladesh Agricultural Research Institute, Lalmonirhat, 5500, Bangladesh
3Department of Genetics and Plant Breeding, Agricultural University, Mymensingh, 2202, Bangladesh
4Pulse Research Centre, Bangladesh Agricultural Research Institute, Ishurdi, 6620, Bangladesh
5Department of Biology, College of Science, Taif University, Taif, 21944, Saudi Arabia
6Department of Plant Molecular Biology, AGERI, Agricultural Research Center, Giza, 12619, Egypt
*Corresponding Author: Md. Sabibul Haque. Email: mshaqcb@bau.edu.bd
Received: 25 December 2021; Accepted: 09 February 2022
Abstract: Linseed is a multipurpose crop and the crop needs further improvement to increase production and yield due to its high value and demand. This study aimed to assess the extent and pattern of genetic variability of forty linseed genotypes based on diverse agro–morphological and yield attributes. The field experiment was conducted following a Randomized Complete Block Design with three replications. Linseed germplasm showed a wide range of phenotypic expression, genetic variability and heritability for 30 studied traits. A low to high phenotypic coefficient of variation (PCV) and genotypic coefficient of variation (GCV) were observed. The lowest genotypic (σ2g) and phenotypic variances (σ2p) were found in capsule diameter (CD), length of calyx (LC), capsule length (CL), seed length (SL), and seed breadth (SB). High broad-sense heritability (h2b) with high genetic advance as a percentage of mean (GAM) were observed in days to germination started (DGS), days to 80% emergence (DE), plant height at 28 and 40 DAS, number of flowers (NFPP), filled capsules (NFCPP) and yield per plant (YPP) indicating additive gene action exists for these characters. Hierarchical cluster analysis separated 40 genotypes into five clusters, where Clusters I to V assembled with 13, 4, 4, 5 and 14 genotypes, respectively. Considering yield and yield attributes, Cluster-IV (G3, G4, G6, G10 and G31) genotypes showed promising while, Cluster-II (G2, G16, G35, G36) and Cluster-III (G1, G33, G39 and G40) genotypes were dominant on plant morphological traits. Based on principal component analysis (PCA), few characters such as YPP, NFPP, NFCPP, days to first flowering and capsule formation, early emergence, days to branch initiation and plant heights at different growth stages revealed important and effective traits for consideration in the selection of linseed breeding programs.
Keywords: Genetic variability; heritability; genetic advance; principal component analysis; hierarchical clustering; linseed
Linseed (Linum usitatissimum L.) belongs to the family Linaceae, originated in the Indian sub-continent and domesticated worldwide. It is a self-pollinated plant that is grown during the rabi (winter) season in Bangladesh and is one of the oldest plant species cultivated for oil and fiber [1]. It is a multipurpose crop that is cultivated for fiber, fuel, industrial, and possibly pharmaceutical purposes, as well as in animal feed and poultry diets [2]. Linseed is an important agricultural crop since it contains 40% oil, 28% starch, 21% protein, 7.4% water, 3.4% different minerals and a lot of unsaturated fatty acids, especially linolenic acid [3]. Linseed is unique among oilseeds, and its high content of omega-3, alpha-linolenic acid (36%–57%), an essential polyunsaturated fatty acid, as well as omega-6, linoleic acid (18%–24%), has reawakened interest in the emerging market of functional foods in recent years [4–6]. Linseed is an important industrial crop for its unique drying and hardening properties, mostly used for industrial purposes like making paints, varnishes, soaps, and printing inks [7,8], while its low linolenic acid content is needed for human consumption.
Linseed is grown in 3.26 million hectares worldwide, with a yield of about 3.18 million tons and productivity of 1011 kilograms per hectare [9]. Currently, Bangladesh produces only 4000 tons of seed from 5,700 ha of land in 2017–2018. However, the country imports linseed waste by using a huge amount of money, roughly 270.45 m BDT [10]. The economic yield, a very complex trait of crops, depends on both the inheritance and climatic conditions of a particular region. Moreover, the crop faces several biotic and abiotic stresses as well as a low response to inputs [11]. The introduction of new germplasm is needed to broaden the genetic diversity and invigorate breeding stocks. As a result, increasing productivity is an important task to reduce the current yield gap and produce high-yielding varieties.
The study of genetic variability allows for better selection and aids in the development of high-yielding varieties. The magnitude of heritable variation in the traits studied is extremely important for selecting the genotype for any breeding program. Specific genotypes in a population’s propensity to differ from one another are measured by genetic variability. Genetic heterogeneity in a population is crucial for biodiversity because, without it, a population’s ability to adapt to environmental changes is hampered and thus makes it more prone to extinction. Genetic variation and the mode of inheritance of quantitative and qualitative traits are crucial in the planning of a breeding program [12,13]. Genetic parameters such as the genotypic coefficient of variation (GCV) and the phenotypic coefficient of variation (PCV) can be used to detect the amount of heterogeneity in a germplasm sample [14,15]. The evaluation of the variability of the yield and its related traits becomes essential before planning a suitable breeding strategy for genetic improvement [14].
Plant breeders may use the diversity of plant genetic resources to create new and improved cultivars with desirable traits, including farmer-preferred traits (high yield capacity, broad seed, etc.) as well as breeder-preferred traits (pest and disease tolerance, photosensitivity, etc.) [16]. Understanding the genetic diversity of linseed is vital for its continued improvement and production in the agricultural system, and germplasm characterization is a vital link between the conservation and utilization of plant genetic resources. Germplasm is the most important resource for developing superior varieties because it contains all the required characteristics. Characterization engages estimating the amount of variation present in a group of populations [17–19]. The use of standard descriptors to describe the characteristics of a crop species is useful for better germplasm use and conservation [20,21]. The information regarding genetic variability pattern presents in the existing population of a given crop, is therefore necessary for further crop improvement. Moreover, understanding the degree of relationships among important agro-morphological characters would aid in the formulation of an efficient scheme of multiple traits. Multivariate analysis is a widely used technique for exploring the relationships among a wide range of variables and for identifying genetic variations within complex data sets [22]. Principal component analysis (PCA) is very useful to dissect the traits correlation and interaction and to evaluate the genotypic performance in crop plants. Therefore, in the current study, 40 linseed genotypes were characterized based on morphological and yield traits at different developmental stages using multivariate analysis to identify genetic variability among them and to select effective traits for consideration in future developmental programs of linseed.
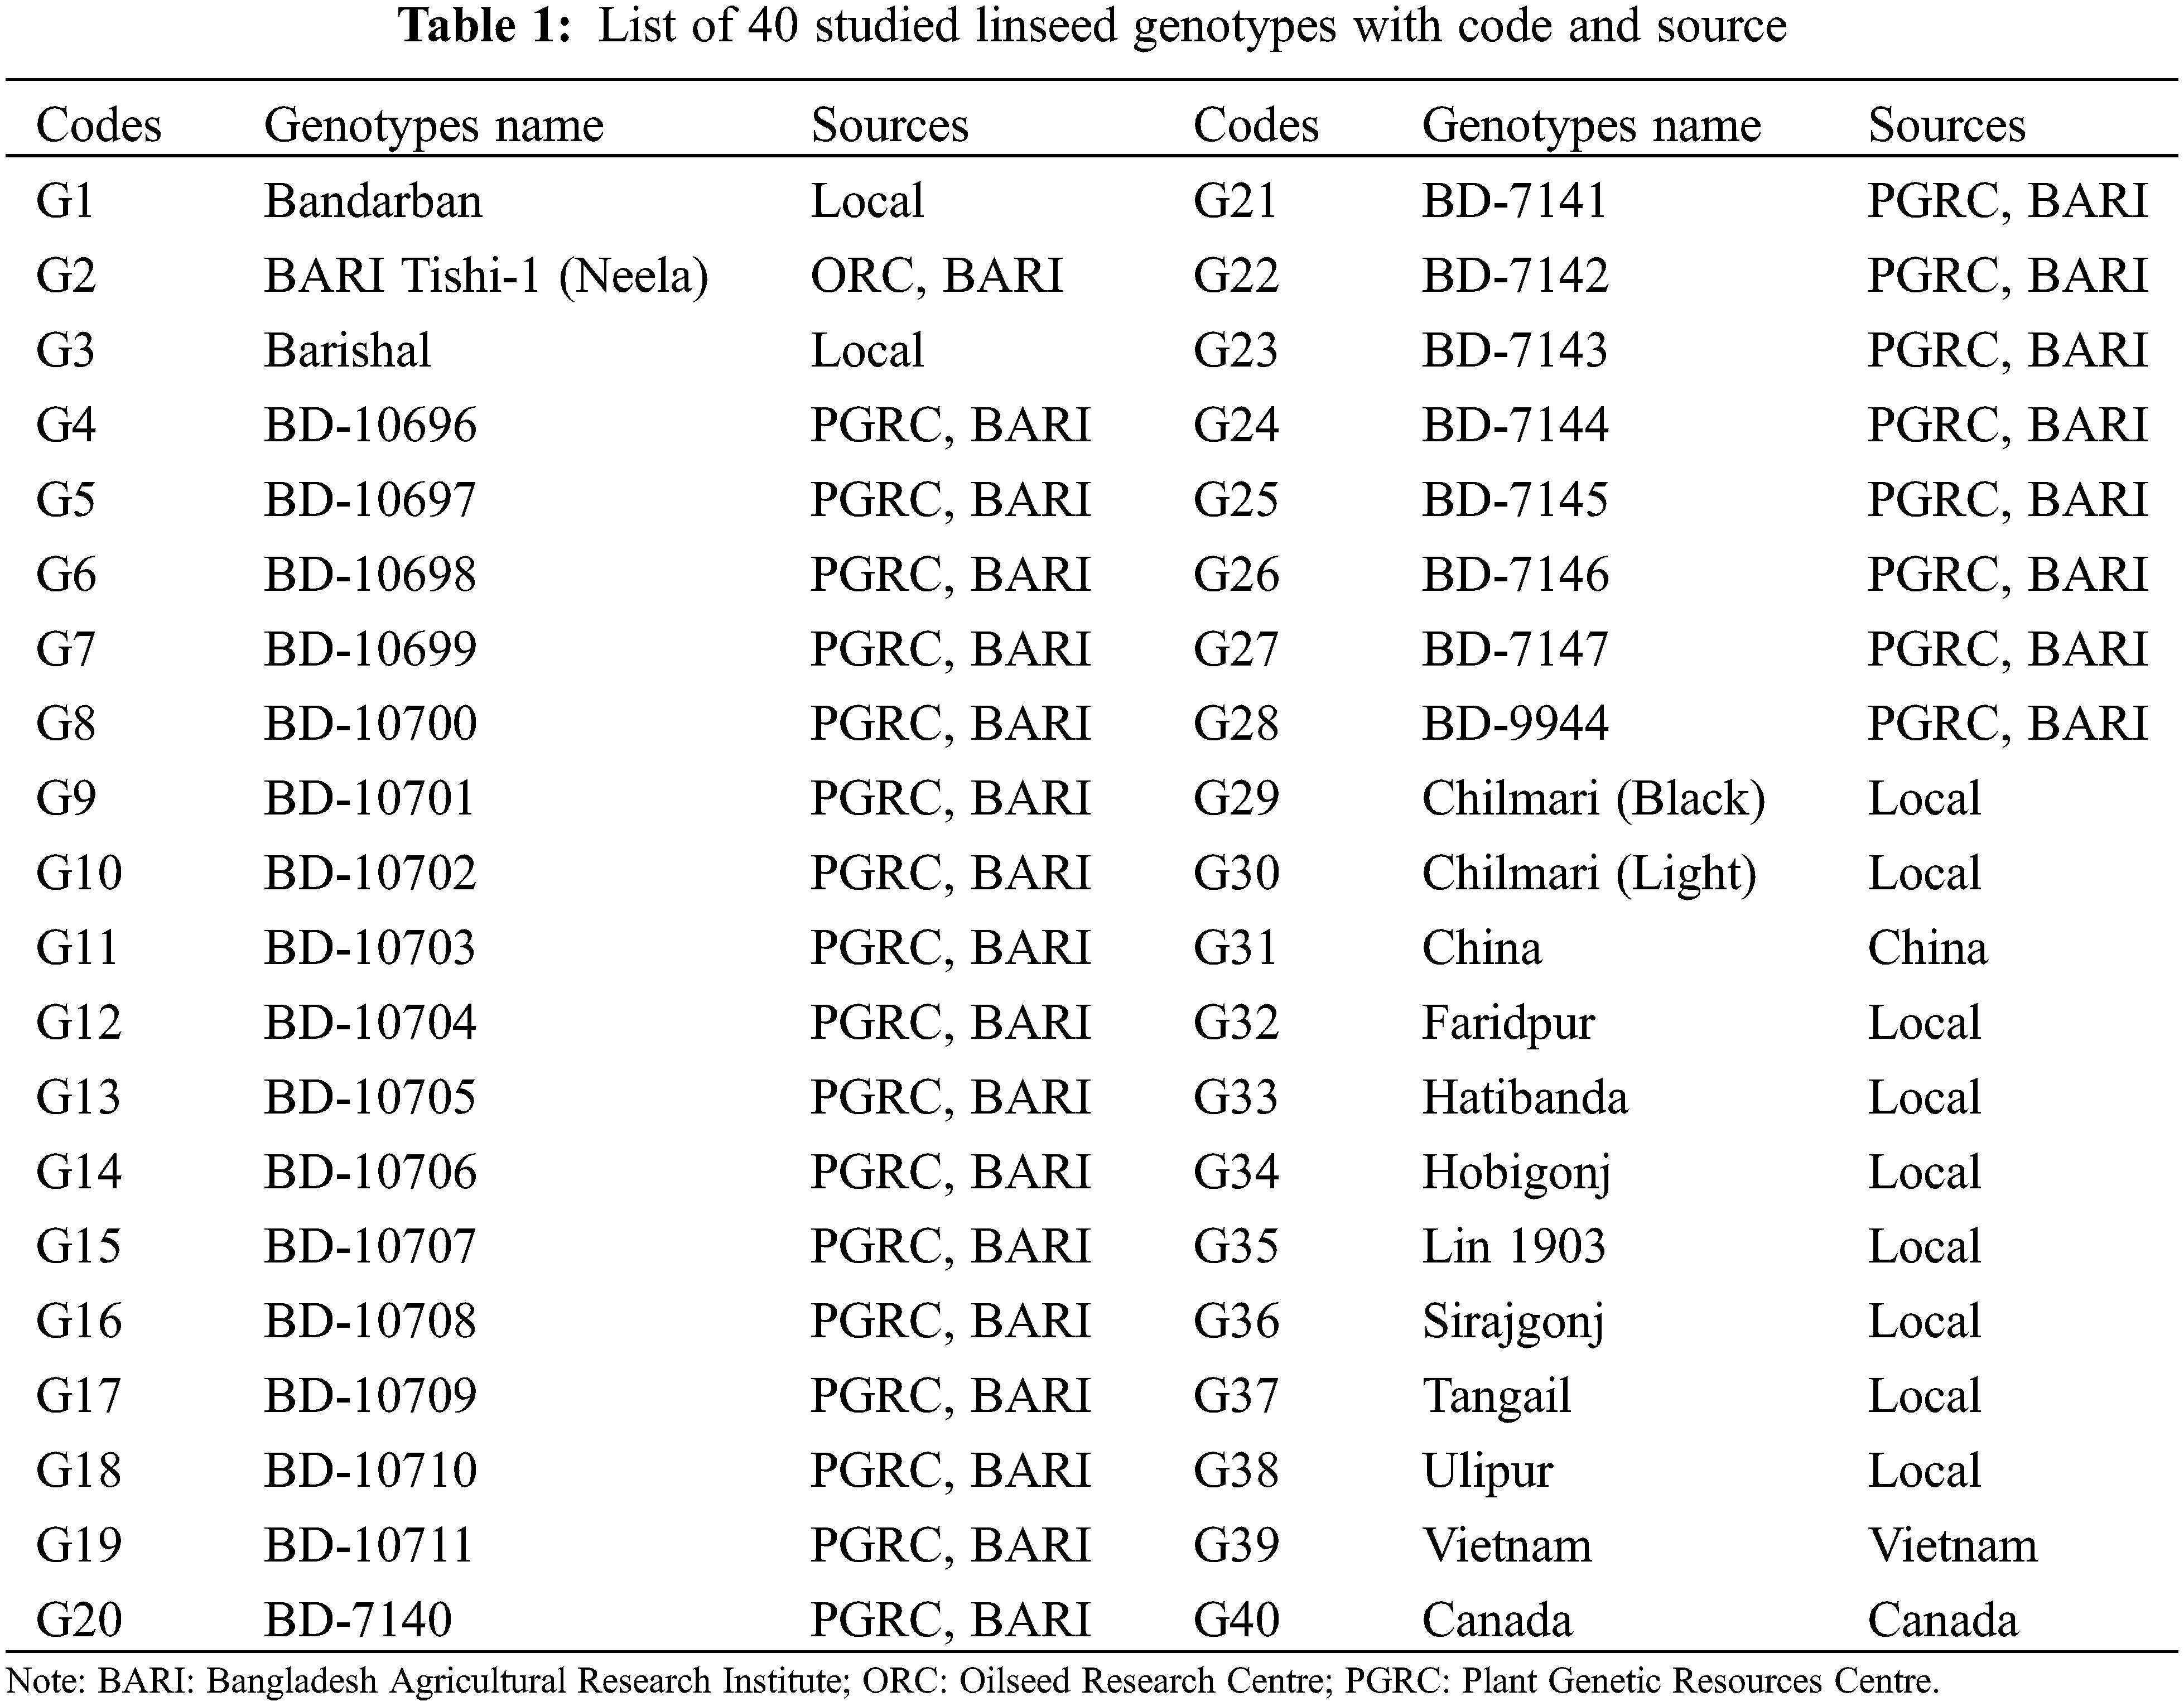
A total of 40 diverse linseed genotypes was used in this study for characterization. Among them, 26 genotypes were collected from Plant Genetic Resources Centre (PGRC), Bangladesh Agricultural Research Institute (BARI), 11 genotypes from various agro-ecological areas in Bangladesh, and the remaining three from abroad (China, Vietnam and Canada). The detailed information of these genotypes is presented in Table 1. For documenting various morphological descriptors, all the genotypes were raised at farmers’ field, Shoreartol, Alamnagar, Rangpur, Bangladesh from October to March in 2018–2019. The area resembles the Tista Meander Floodplain (Agro-Ecological Zone-3) with heavy annual rainfall (2498 mm) [23].
2.2 Experimental Design and Crop Management
During the 2018–2019 cropping season, the 40 genotypes were planted in the field for evaluating the morphological and plant architecture traits. The experiment was set following Randomized Complete Block Design (RCBD) with three replications. Each replication consists of two rows of each genotype. With continuous line sowing, the unit plot was 3.0 m × 0.6 m (two lines). The plant-to-plant spacing within a row was maintained at 5–7 cm (DAS). To ensure adequate germination, pre-sowing irrigation was used. Before sowing, the experimental plots were well prepared, and Farm Yard Manure (FYM) was added. Linseed cultivation was carried out using the prescribed fertilizer and manure doses [24]. Irrigation was delivered as required, and the trial was weeded regularly. Other cultural practices were done as and when necessary.
2.3 Determination of Agro-Morphological Traits
The agro–morphological traits, yield attributes and yield data were recorded on five randomly selected plants from each plot. The following data were recorded.
Days to germination started (DGS), 80% emergence (DE) and branch initiation (DBI)
The number of days from sowing to seed germination, 80% emergence and branch initiation were counted based on the sowing date.
Plant height
At 28, 40, 60 and 82 d after sowing (DAS), the height of each selected plant was measured in centimeters from the surface of the soil to the top of the plant and average values were calculated.
Number of leaves and branches plant–1
The number of leaves plant–1 (NLPP) was counted at 30 DAS and the number of branches produced by each plant was recorded at 40 DAS.
Base diameter (BD) and main branch diameter (MBD)
The base diameter was measured at 2 cm above the soil surface and main branch diameter was measured at 6 cm above the soil surface at 42 DAS.
Days to top branch initiation (DTBI), first flowering (DFF) and height of main stem (HMS)
The number of days from sowing to top branch initiation and first flowering was counted based on the sowing date. The height of the main stem was measured in centimeters in selected plants at 82 DAS.
Length of pedicel (LP), calyx (LC) and flower (LF)
The length of flower with its different whorls was measured in millimeters and average values were used for statistical analysis.
Days to flower stops (DFS) and capsule formation (DCF)
The number of days to flower stops and capsule formation were counted on the basis of sowing date.
Number of flowers (NFPP), filled and unfilled capsules per plant (NFCPP and NUFCPP)
The counting of number of flowers, filled and unfilled capsules per selected plants were done at 115 DAS.
Capsule length (CL) and diameter (CD)
The length and diameter of capsules were measured in millimeter at 115 DAS.
Seed characteristics
After harvesting, the selected plants were manually threshed in the threshing floor and cleaned properly. Then the seed length (SL) and seed breadth (SB) of each seed were measured in millimeter. The number of seeds of each capsule (NSPC) was counted and replication wise mixed in a lot. Then 1000 seeds were randomly selected from each lot and weighed (TSW) in grams on sensitive electric balance in the laboratory. Finally, seed yield plant–1 (YPP) was determined in grams.
The results for different agro–morphological characteristics were analyzed using the Statistix 10 software package, and the means were separated using Duncan’s multiple range test (DMRT) at a 5% level of significance. The genotypic variance (σ2g) and phenotypic variance (σ2p) were calculated as:
Variances below zero were adjusted to zero according to Robinson et al. [25]. Heritability in broad-sense (h2b) was computed according to Falconer [26].
Heritability was categorized as low (0–0.30), moderate (0.30–0.60) and high (>0.60) [27]. A covariance analysis was performed to calculate coefficient of variations. The genotypic coefficient of variation (GCV) and phenotypic coefficient of variation (PCV) expressed in per cent were estimated as described by Singh et al. [28].
where σ2g = genotypic variance, σ2p = phenotypic variance,
Genetic advance (GA) and Genetic advance as a per cent of mean (GAM) were computed by the following formula [29,30]:
where, k = selection differential at 5% selection intensity; σp = phenotypic standard deviation; h2b = broad-sense heritability.
Genetic advance as a per cent of mean was categorized as low (<10%), moderate (10%–20%) and high (>20%) [31].
The multivariate analysis was performed using R (v4.0.5) and R Studio software [32]. Cluster analysis was performed for grouping of genotypes based on the traits and principal component analysis (PCA) was done to assume the extent of association among traits. The two–way hierarchical clustering heatmap was constructed following Euclidean distance and Ward.D methods using ComplexHeatmap package of R software. The PCA–biplot was constructed using ggplot2, Factoextra and FactomineR packages of R. The correlation matrix was made from corrplot package in R arranging hclust order. The cluster means and standard deviations for all the traits were obtained from cluster analysis. The one-way ANOVA with multiple comparisons (Tukey’s HSD test) was performed to test significance among different clusters.
3.1 Genotypic Variations in Morphological Characters
The 30 measured traits showed significant variations among genotypes except for NB40, BD42, MBD42, NB60, NUFCPP, CD, CL, SB and NSPC (Table A1). The mean values for all traits in the examined 40 linseed genotypes are presented in Table 2. The DGS was observed to have a mean of 5.18 d, with a range of 4.33–7.67 d for genotypes G2 and G39, respectively. Most genotypes (34) showed 6 d for 80% germination with an overall mean of 6.28 days. The DE and DBI values ranged from 6–9 d (G9 and G39) and from 25–28 d (G9 and G1) with the grand means of 5.18 and 6.28, respectively (Table 2). The plant height increased from vegetative stage towards maturity and the height at 82 DAS (PH82) varied from 58.67 to 100.67 cm, with a grand mean of 72.55 cm (Table 2). The height of main stem at 82 DAS (HMS82) differentiated significantly among genotypes and the highest and lowest values were recorded in G40 (54 cm) and G30 (27.4 cm), respectively while the mean HMS72 was 37.8 cm (Table A1; Table 2). The branch formation (DTBI) was initiated at an earlier time in G2 (30 d) and G35 (32.3 d) and prolonged to G9 (46 d) followed by G1 (45 d). The genotype G36 (100.36 cm) was the tallest, while G14 (58.67 cm) was the smallest followed by G13 (61.67 cm). The genotypes significantly varied in DFF and the earliest flowering was observed in G2 (38.7 d) followed by G17 (39 d) whereas, delayed flowering was recorded in G33 (58.3) followed by G28 (57.3 d) (Table A1; Table 2). The similar trend was observed for DCF as DFF and the earlier flowering genotypes formed earlier capsules accordingly (Table 2). A substantial variation in DFS was found among genotypes and G2 stopped flowering at 78 DAS whereas, G29 stopped flowering after 108 DAS (Table A1; Table 2).
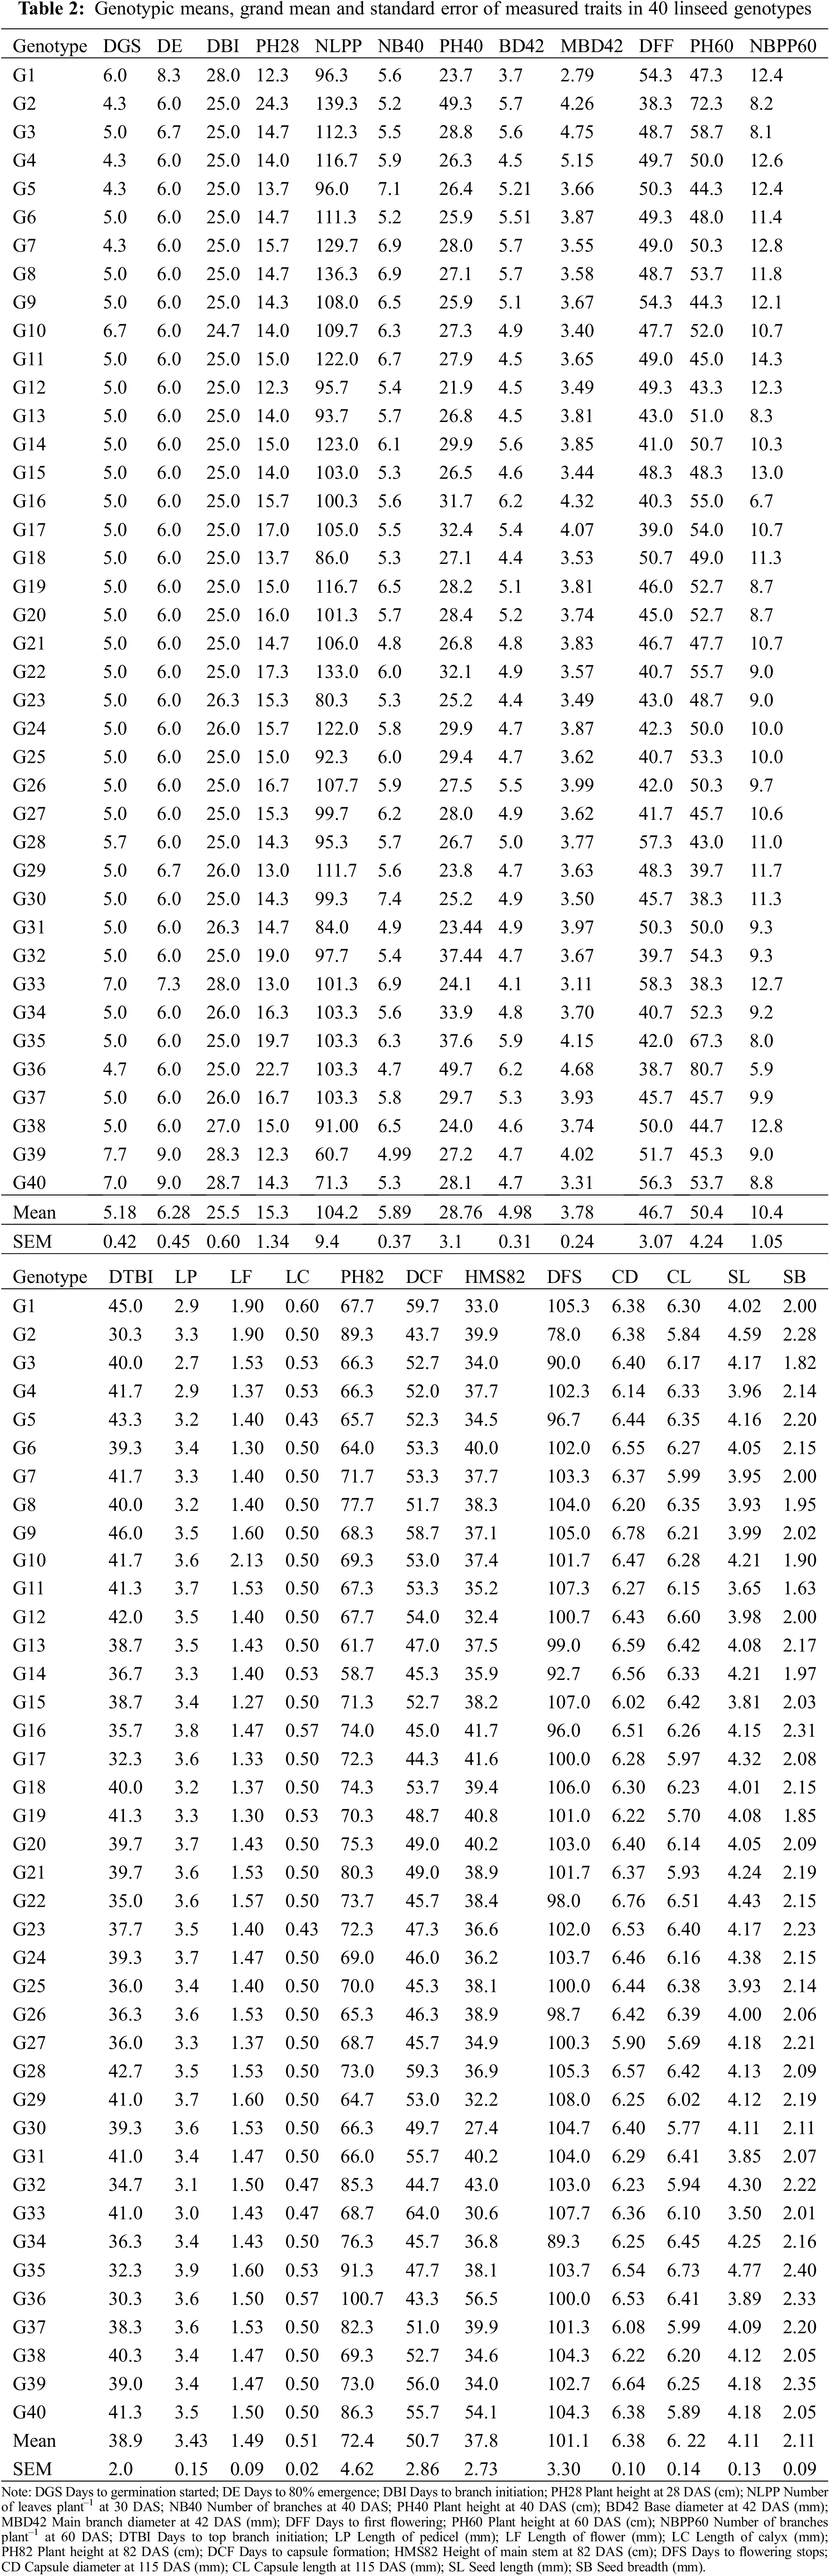
3.2 Genotypic Variations in Yield Attributes
The genotypes varied significantly in relation to yield and yield attributing characters (Table A1, Fig. 1). The average NFPP was 301, ranging from 188 for G40 to 409 for G34 (Fig. 1). The NFCPP varied from 150 for G40 to 344 for G34 with an average of 253. The genotype G35 (6.73 mm) had the longest capsule (CL) followed by G12 (6.60 mm) and G22 (6.51 mm), while the minimum capsule length was observed in G27 (5.69 mm) (Table 2). The NSPC was found maximum in G31 (9.89) followed by G14, G10, and G6 (each with 9.78) and the grand mean of NSPC for all genotypes was 8.91. The TSW ranged from 3.74 g for G40 to 5.29 g for G6 with an average of 4.41 g. The genotypes showed considerable variation in seed yield per plant. The highest YPP was observed in G6 (15.3 g) followed by G31 (13.94 g) followed by G8 (12.6 g) and G3 (12.4 g) while, the lowest YPP was recorded in G40 (5.26 g) followed by G29 (7.26 g) (Fig. 1).
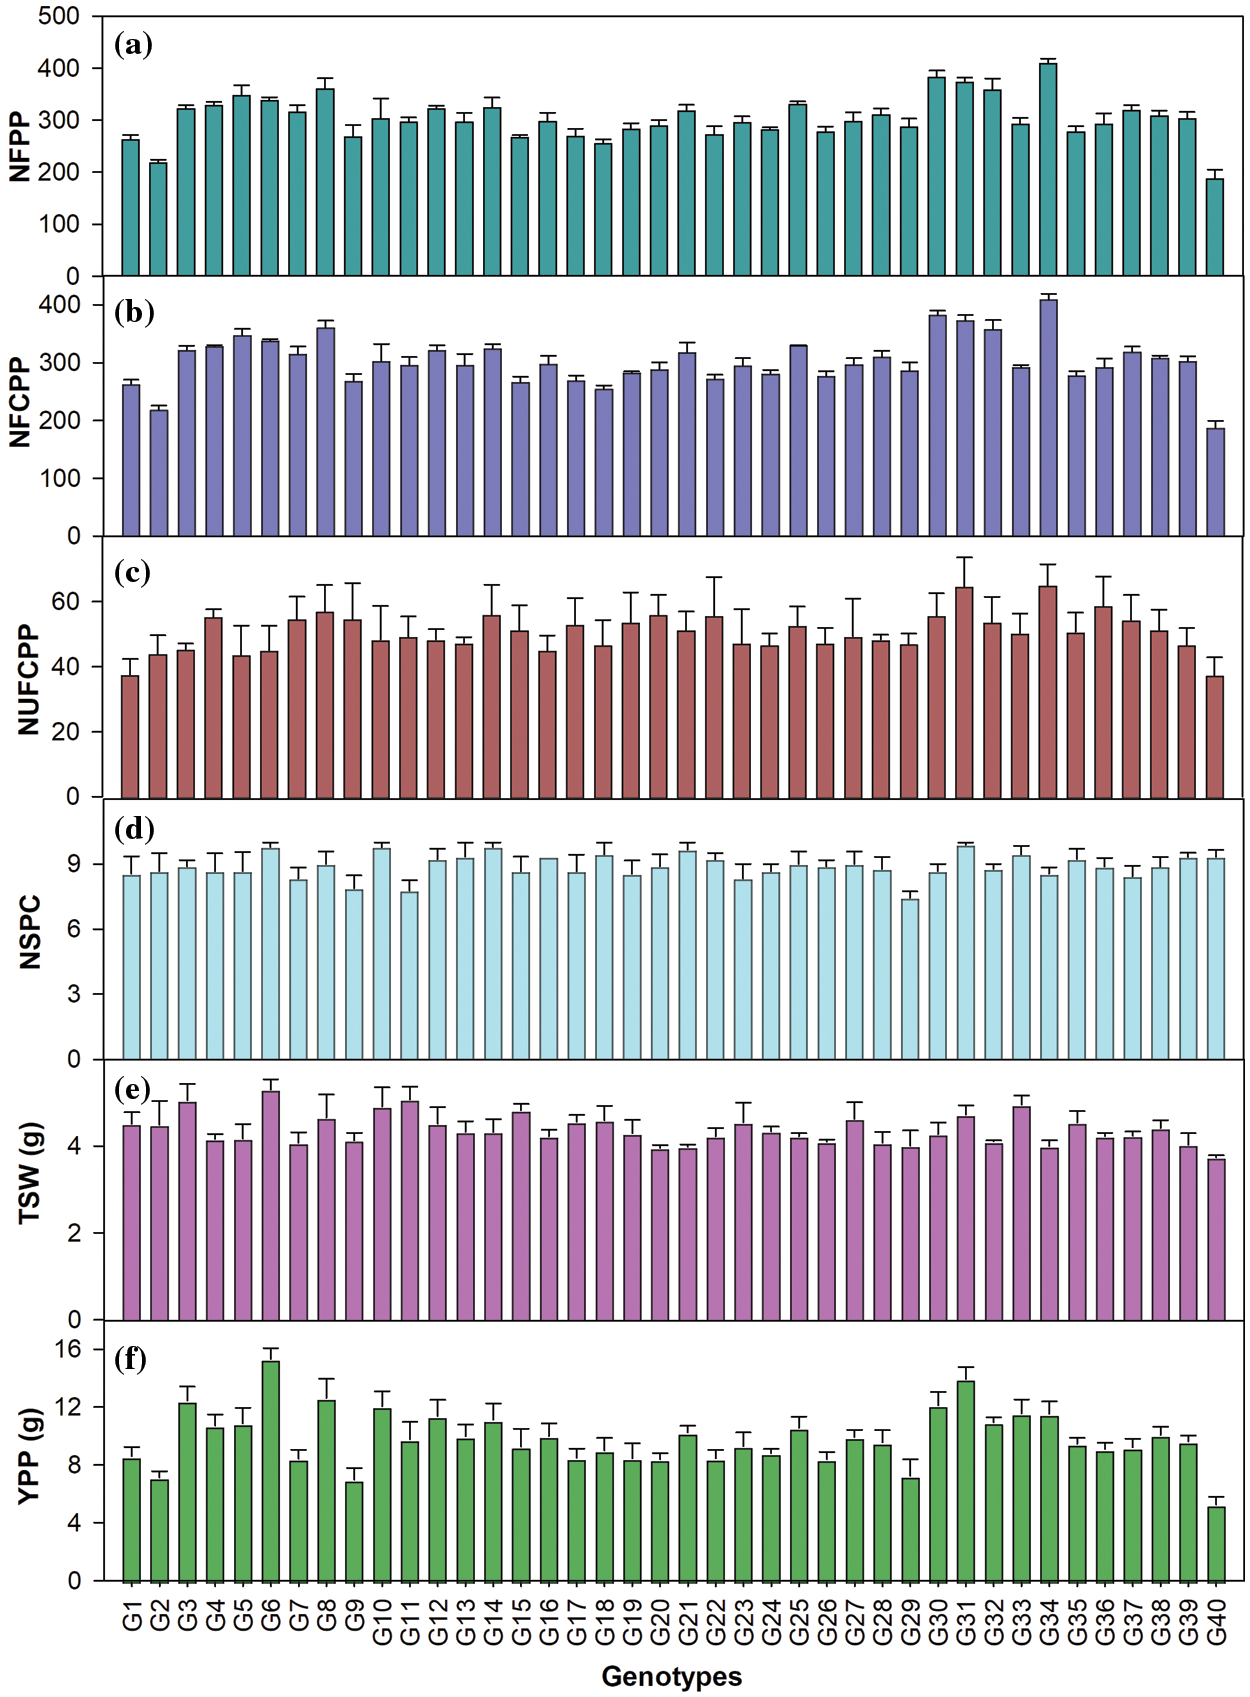
Figure 1: (a) Number of flowers plant–1 (NFPP); (b) Number of filled capsules plant–1 (NFCPP); (c) Number of unfilled capsules plant–1 (NUFCPP); (d) Number of seeds capsule–1 (NSPC); (e) 1000-seed weight (TSW, g) and (f) Yield plant–1 (YPP, g) in 40 linseed genotypes. Vertical bars are SEM (n = 3)
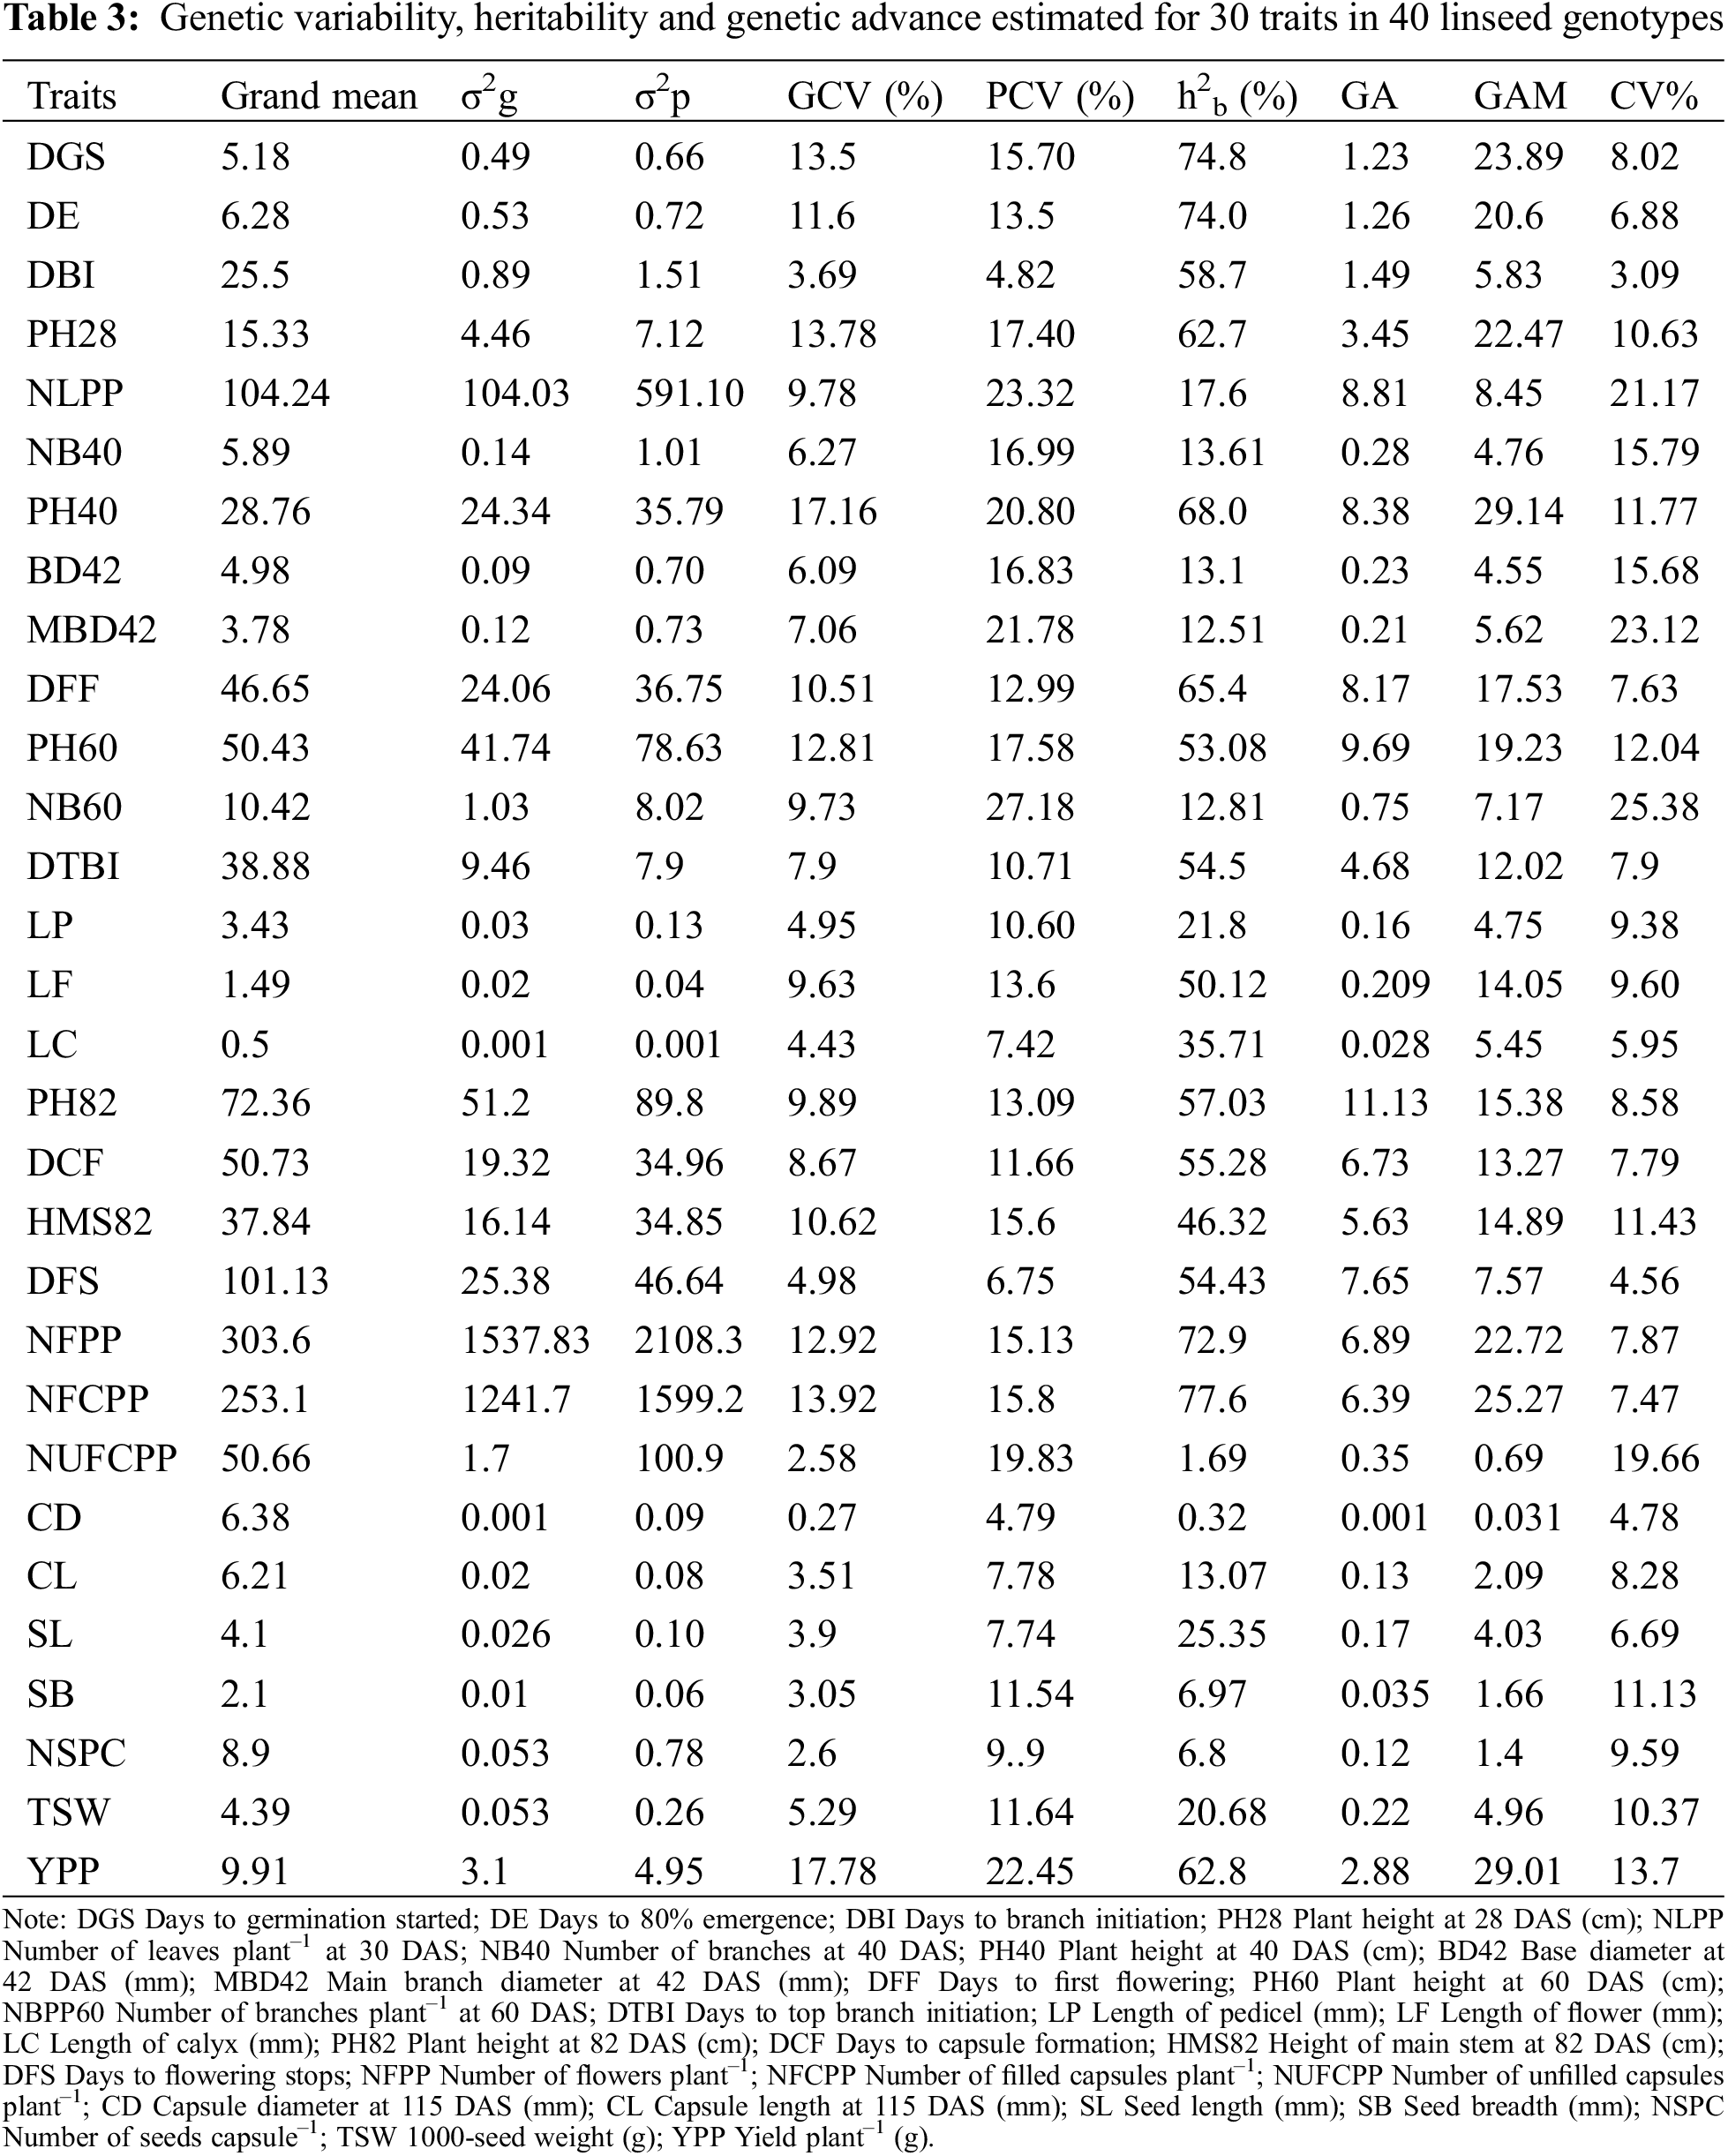
3.3 Genetic Variability, Heritability and Genetic Advance
In the present study, high magnitude of phenotypic variance (σ2p) and genotypic variance (σ2g) were recorded in NFPP, NFCPP, NLPP and low magnitude in most of the traits like DGS, DE, DBI, BD42, MBD42, LP, LF, LC, CD, CL, SL, SB, NSPC and TSW (Table 3). In a breeding program, higher proportion of genotypic and phenotypic coefficient of variation is advisable. The coefficient of variation studies indicated that the values of phenotypic coefficient of variation (PCV) were higher than those of genotypic coefficient of variation (GCV) for all studied traits (Table 3) representing that all the traits were influenced by the environment to some extent in linseed genotypes at different growth stages. The higher PCV and GCV values were estimated in YPP (22.45% and 17.78%) followed by PH40 (20.80% and 17.16%), PH28 (17.40% and 13.78%), DGS (15.70% and 13.5%), PH60 (17.58% and 12.81%), NFCPP (15.8% and 13.92%), NFPP (15.13% and 12.92%), DFF (12.99% and 10.51%), DE (13.5% and 11.6%) whereas the lowest values were observed in CD (4.79% and 0.27%). Importantly, low difference of PCV and GCV were observed for DE, DBI, DTBI, DFS, NFPP and NFCPP on the other hand high differences were recorded in NUFCPP, MBD42 and NSPC.
Heritability is a strong indicator of character transfer from parents to offspring. Estimation of heritability of broad-sense (h2b) in the present study indicated that most of the studied traits were low (<30%) to moderately (30%–60%) heritable and a few traits were highly heritable (Table 3). The high heritability (>60%) values were estimated for NFCPP (77.6%), DGS (74.8%), DE (74.0%), NFPP (72.9%), PH40 (68.0%), DFS (65.4%) and YPP (62.8%) presented in Table 3. Genetic advance (GA) is a useful indicator of effective and efficient selection progress that can be expected as a result of exercising selection on a base population. In the present study, moderate GA (10–20%) was revealed only for PH82, while other traits manifested low GA (<10%) (Table 3). Moderate heritability with low GA was revealed for DGS, DE, DBI and PH82 (Table 3). The anticipated genetic advance as a percentage of mean (GAM) was maximum in PH40 (29.14) followed by YPP (29.01), NFCPP (25.27), DGS (23.89), PH28 (22.47) and DE (20.6) (Table 3). The DFF, PH60, DTBI, LF, PH82, DCF, and HMS82 demonstrated moderate GAM (10%–20%), whereas other traits demonstrated a low GAM (<10%) (Table 3).
3.4 Cluster Analysis of Genotypes and Traits
The result of cluster analysis for yield and yield contributing morphological traits and their relative contribution towards the total genetic divergence is shown in Fig. 2 and Table 4. The Euclidean distance was estimated for 40 linseed genotypes using standardized morphological data, and a two-way (genotypes and traits; row and column) hierarchical clustering heatmap is presented in Fig. 2. The optimum number of clusters both for traits and genotypes were determined using gap statistic method prior to clustering. The left (row) dendrogram of heatmap revealed that the 40 linseed genotypes were grouped into five clusters based on the variations existed in traits (Fig. 2). The maximum number of closely related genotypes (14) were observed in Cluster-V while, Cluster-II and Cluster-III comprised four genotypes of each. The Cluster-I and Custer-IV contained 13 and 5 genotypes, respectively (Fig. 2). In contrast, the measured traits were grouped into three column clusters where, Cluster-1, Cluster-2 and Cluster-3 comprised of 8, 10 and 12 traits, respectively. The highly related traits such as DGS, DBI, DE, DTBI, DFF, DCF, NBPP60 and DFS were assembled in Cluster-1 while, the traits PH28, PH40, PH60, PH82, HMS82, BD42, MBD42, LP, SL and SB were placed in Cluster-2. All the yield and yield attributing characters such as NUFCPP, YPP, NFPP, NFCPP, LF, LC, CD, CL, NSPC and TSW were closely associated and assembled in Cluster-3 (Fig. 2). The Cluster-IV with the genotypes G3, G4, G6, G10 and G31 were grouped largely depending on the yield attributes of trait Cluster-3. Besides, the genotypes of Cluster-II (G2, G15, G35, G36) and Cluster-III (G1, G33, G39, G40) were separated focusing on the plant morphological traits in the Cluster-1 and Cluster-2, respectively (Fig. 2).
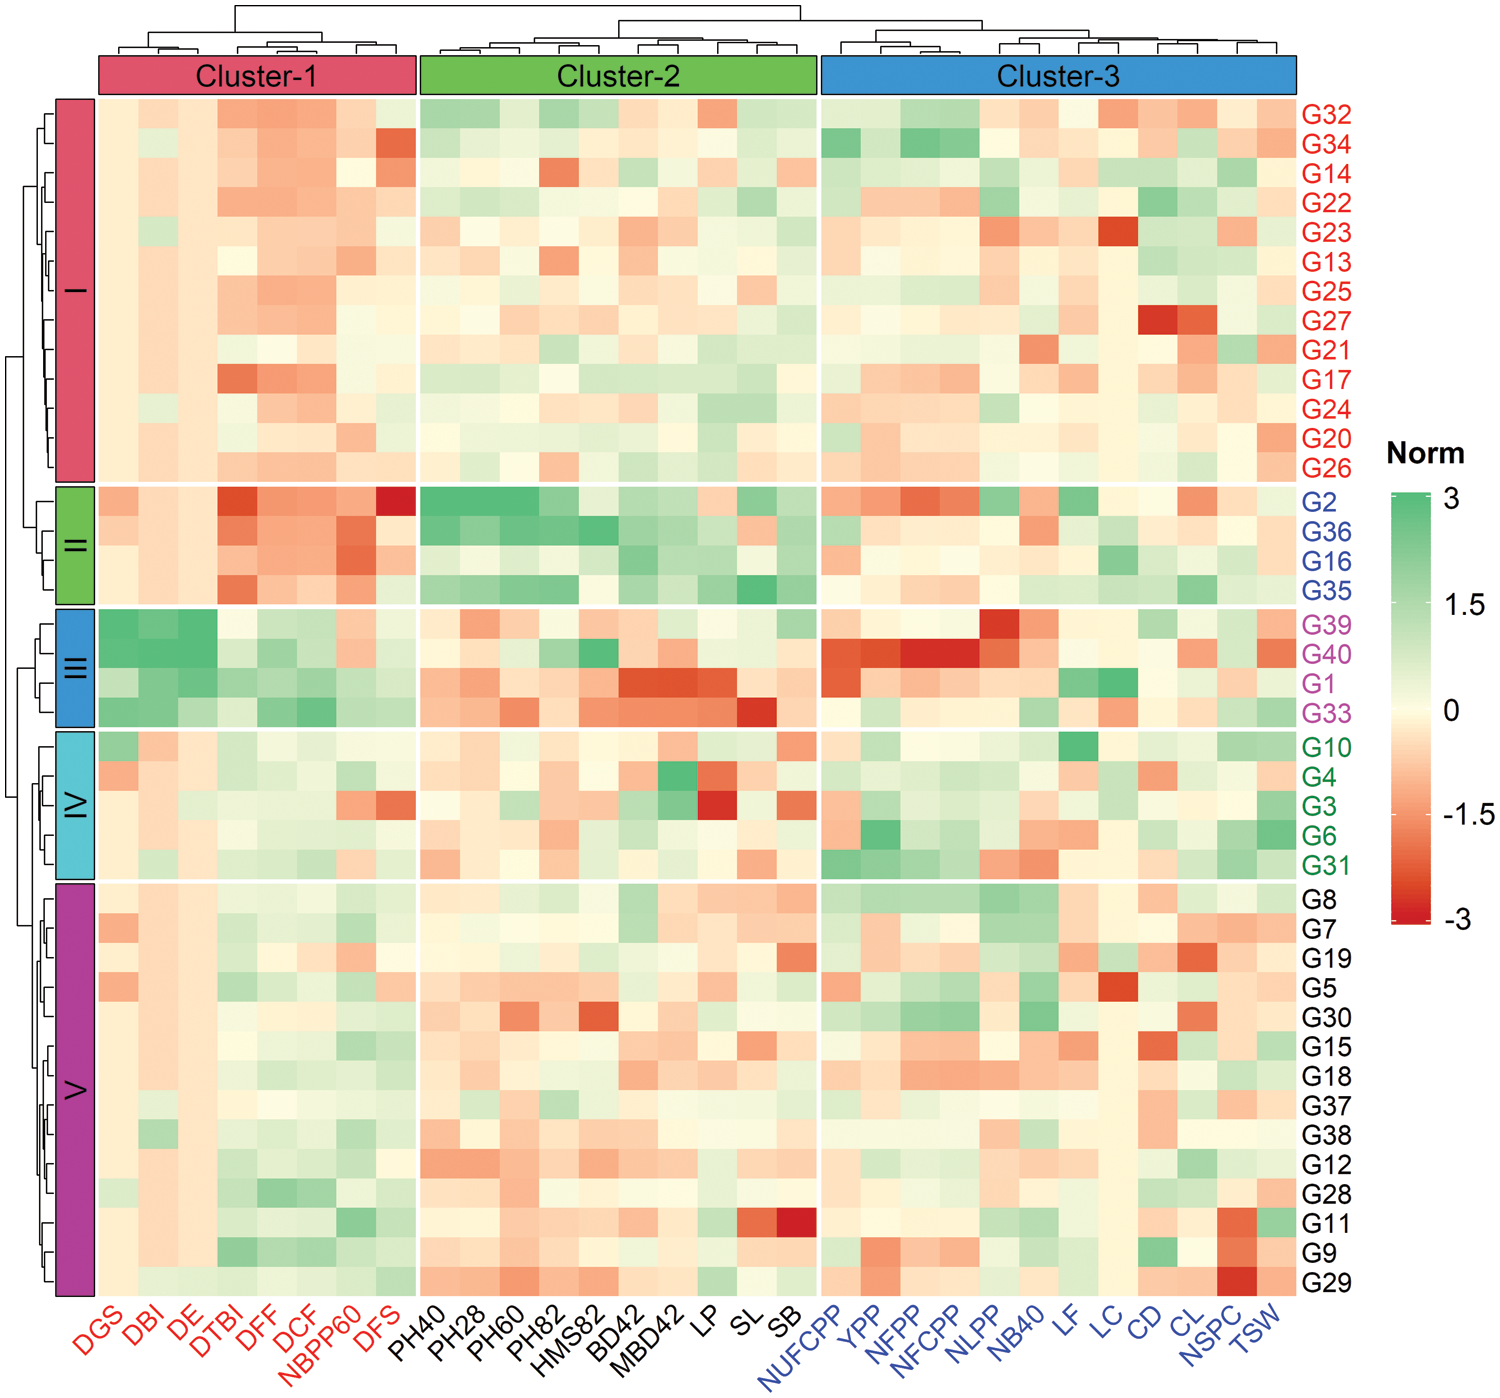
Figure 2: Two-way (row and column) hierarchical clustering heatmap showing grouping of genotypes and traits. The 40 linseed genotypes and 30 measured traits were grouped into six (row) and three (column) clusters, respectively. The mean values of traits are normalized and used to construct heatmap (scaling from −3 to +3). Traits description: DGS Days to germination started; DE Days to 80% emergence; DBI Days to branch initiation; PH28 Plant height at 28 DAS (cm); NLPP Number of leaves plant–1 at 30 DAS; NB40 Number of branches at 40 DAS; PH40 Plant height at 40 DAS (cm); BD42 Base diameter at 42 DAS (mm); MBD42 Main branch diameter at 42 DAS (mm); DFF Days to first flowering; PH60 Plant height at 60 DAS (cm); NBPP60 Number of branches plant–1 at 60 DAS; DTBI Days to top branch initiation; LP Length of pedicel (mm); LF Length of flower (mm); LC Length of calyx (mm); PH82 Plant height at 82 DAS (cm); DCF Days to capsule formation; HMS82 Height of main stem at 82 DAS (cm); DFS Days to flowering stops; NFPP Number of flowers plant–1; NFCPP Number of filled capsules plant–1; NUFCPP Number of unfilled capsules plant–1; CD Capsule diameter at 115 DAS (mm); CL Capsule length at 115 DAS (mm); SL Seed length (mm); SB Seed breadth (mm); NSPC Number of seeds capsule–1; TSW 1000-seed weight (g); YPP Yield plant–1 (g)
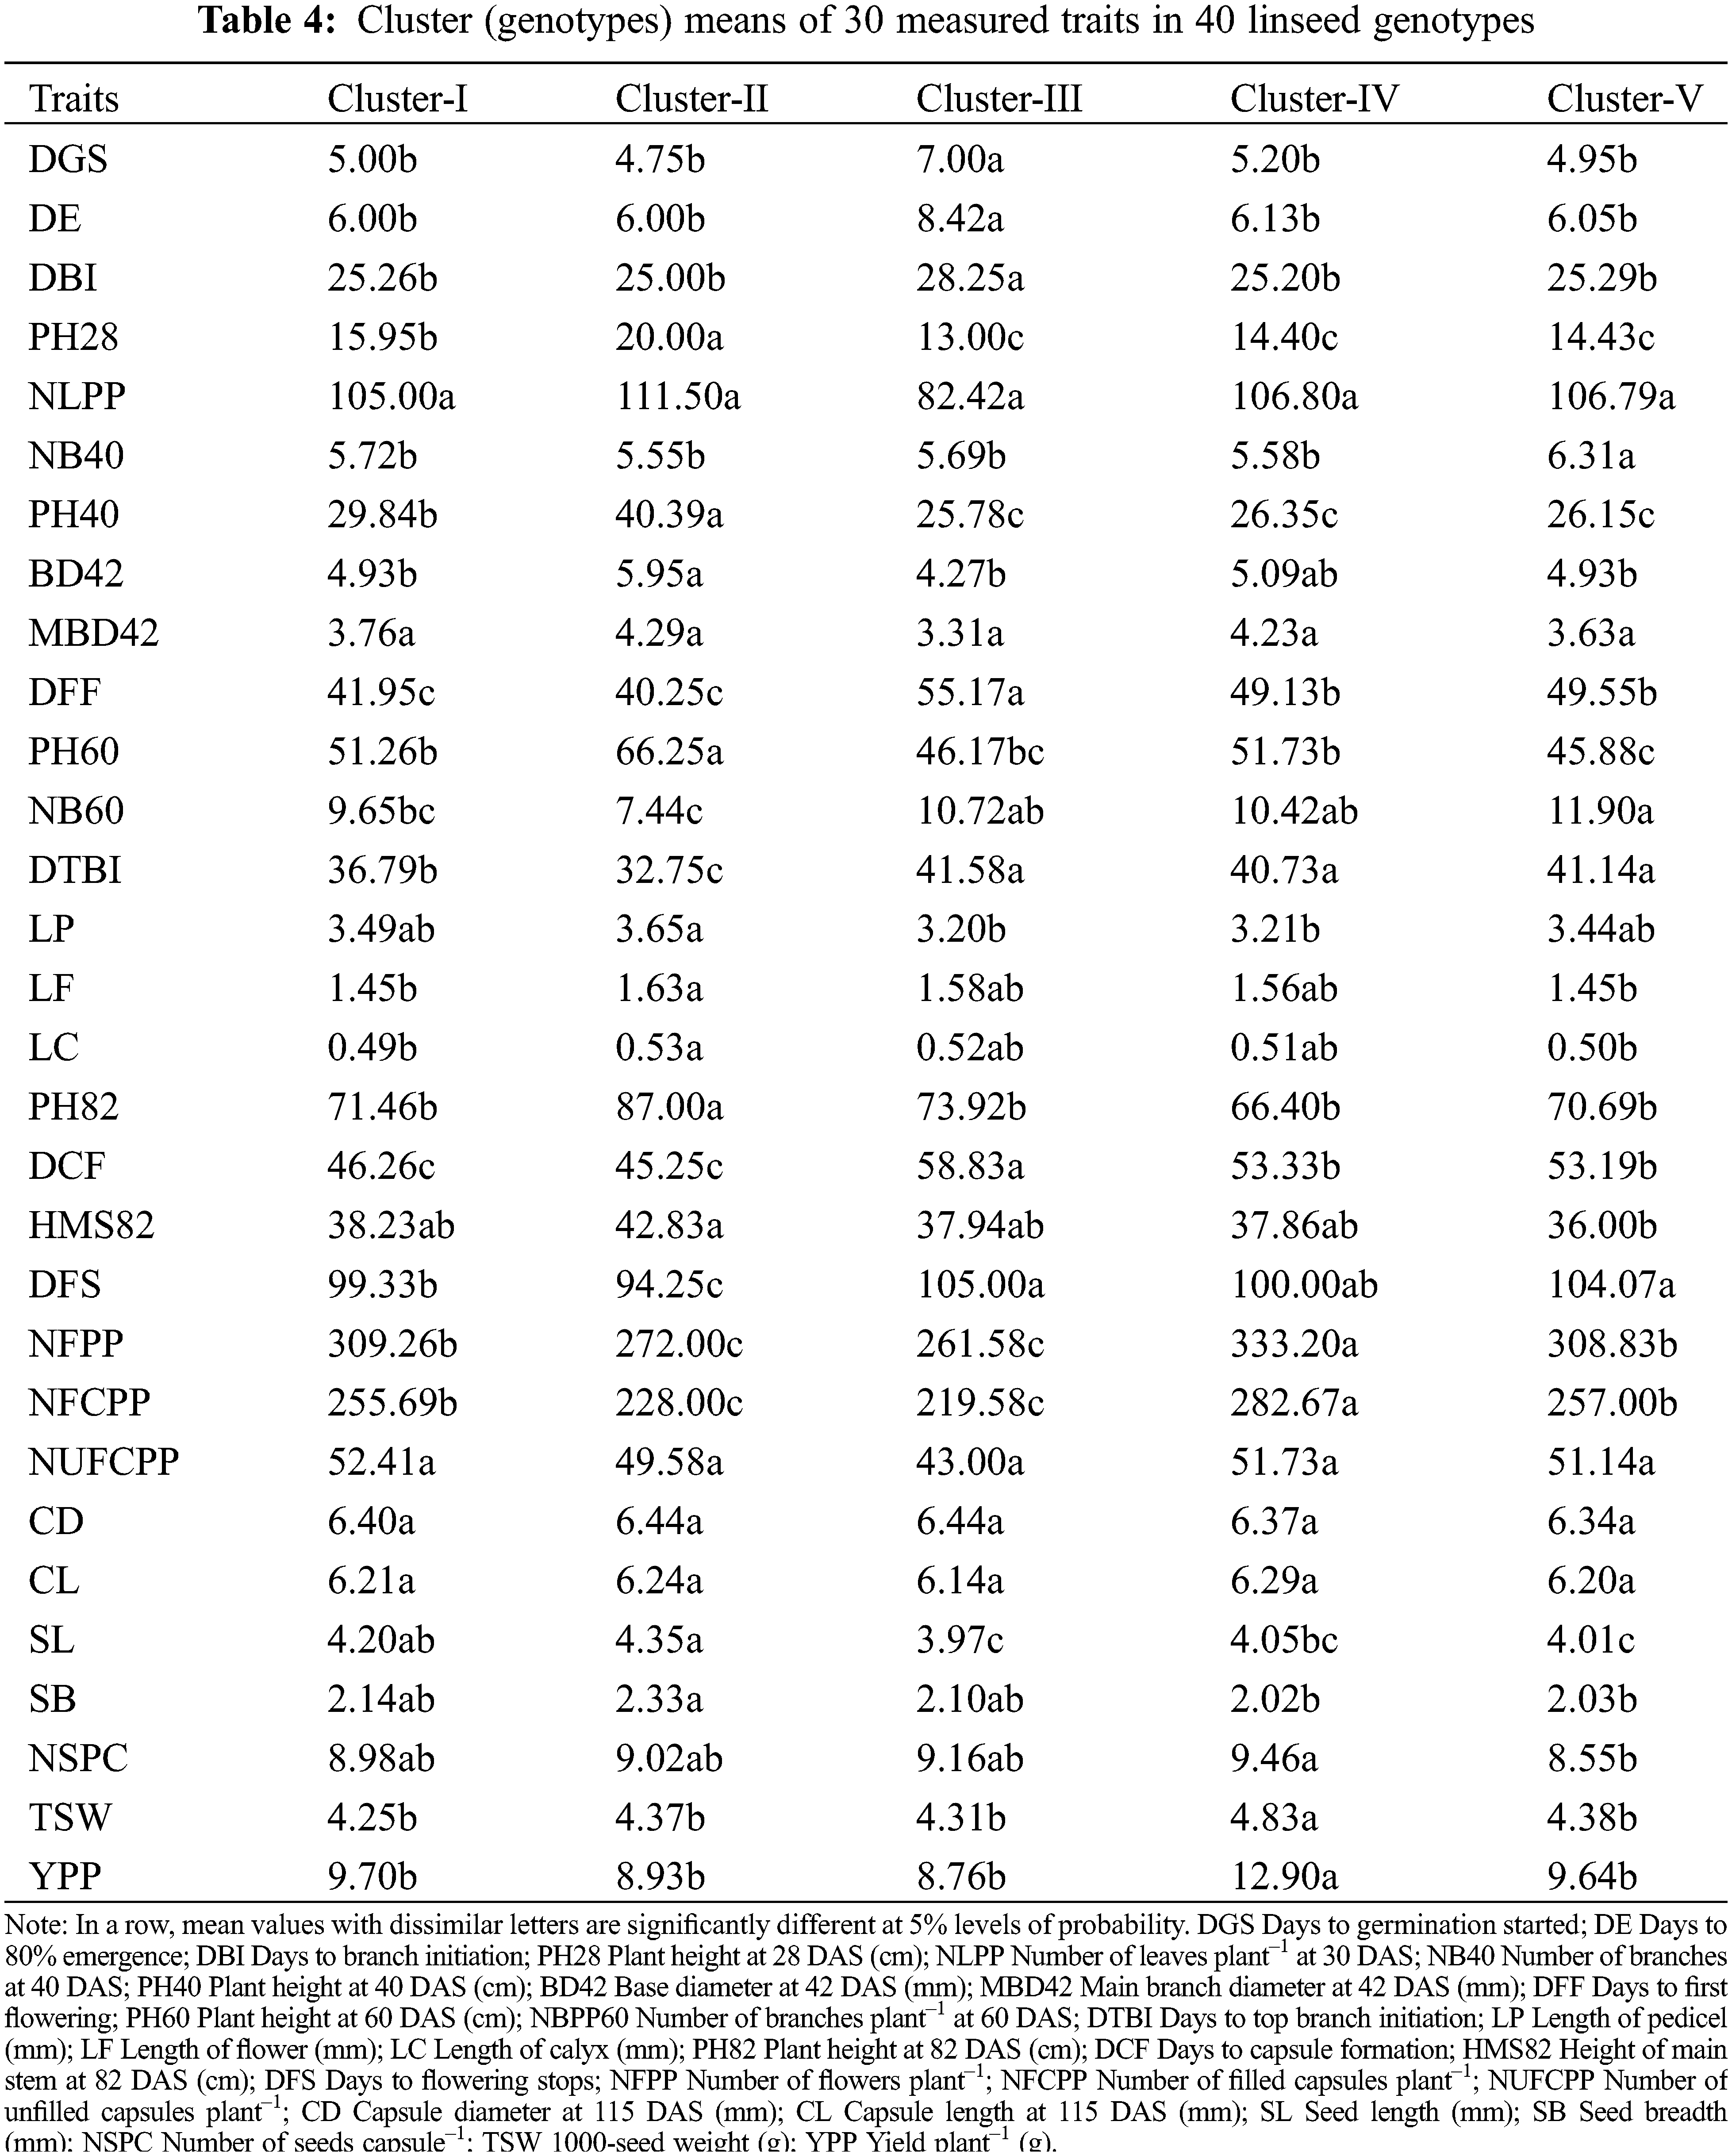
The mean values of measured traits for each cluster are summarized in Table 4. All the genotypic clusters of 40 genotypes were varied significantly (Table 4). Cluster-III had significantly higher values for DGS, DE, DBI, DFF, DTBI, DCF and DFS in comparison to other clusters. Cluster-II consisted of four genotypes (G2, G16, G35 and G36) which exhibited significantly higher PH28, NLPP, PH40, BD42, MBD42, PH60, LP, LF, LC, PH82, HMS82, NUFCPP, SL and SB (Table 4). The result revealed that genotypes included in Cluster-III required a shorter time for germination, first flowering and capsule formation while, the plants of the genotypes in Cluster-II were taller and thicker. A significantly higher NFPP (303.2), NFCPP (282.7), NSPC (9.46), TSW (4.83 g) and YPP (12.9 g) compared to other clusters. No significant differences in NLPP, MBD42, NUCPP, CD and CL among the clusters were recorded (Table 4).
3.5 Principal Component Analysis (PCA)
PCA is useful for the identification of determinants of quantitative trait variability when a large number of accessions are to be accessed for several characters of morphological and agronomic importance. In the present investigation, the nine principal components with Eigen values greater than one were used and cumulatively they explained 70% of the total variability (Figs. 3, 4a, 4b). The first and second PCs accounted 35% of total variability and PCA-biplot was constructed using the first two PCs (Fig. 3). PC1 explained 22.6% of the total variation and contributed strongly to plant height at various stages, DFF, DCF, DTBI, DFS, BD42 and DBI (Fig. 4c). The PC2 accounted for 12.4% of the total variation and was mostly associated with yield attributes such as NFCPP, NFPP, YPP and NUFCPP (Fig. 4d). The PC3 contributed 7% of the total variation with the contributing traits CD, CL, NSPC, SL, NUFCPP, NLPP, TSW and HMS82 (Fig. 4e). Three distinct sets of characteristics (higher contributing traits) were found in our data set using the PCA biplot while simultaneously evaluating PC1, PC2 and PC2 (Fig. 4). The plant height at various stages and DFF, DCF, DTBI, and DFS those grouped into traits Cluster 1 and 2 (Fig. 2) were strongly and positively contributed mainly to PC1 (Figs. 3 and 4a). In contrast, the major yield and yield attributing characters such as NFPP, NFCPP, NUFCPP, TSW and YPP assembled in trait Cluster-3 were mostly associated and contributed positively to PC2 and PC3 (Figs. 2, 3 and 4d, 4e). Based on the yield attributing characters, the genotypes under Cluster-IV dominated strongly and highlighted positively both in PC1 and PC2 (Fig. 3) whereas, the Cluster-II and Cluster-III were highly expressed by the traits such as plant height at different stages, main stem height, quick emergence, early flowering and capsule formation (Cluster-1 and Cluster-2 traits in Fig. 2).
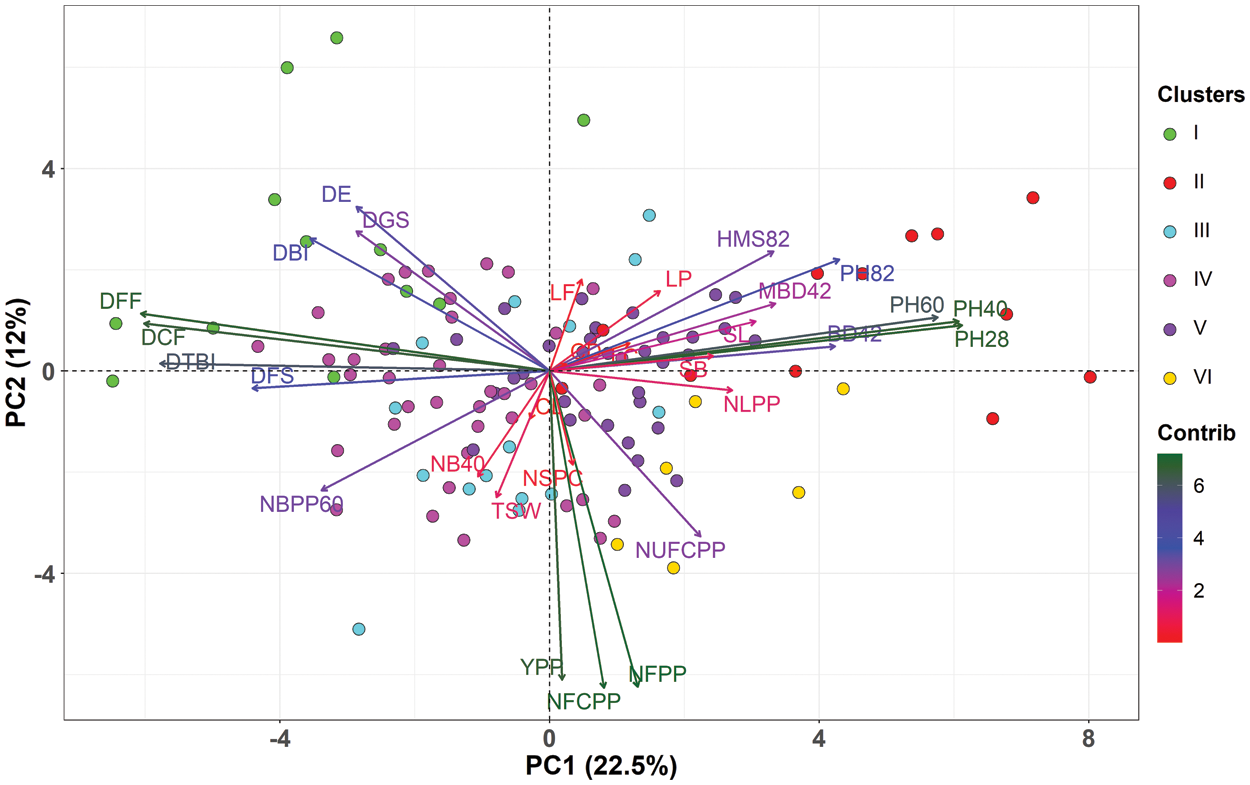
Figure 3: Principal Component Analysis (PCA)–biplot illustrating the association between measured traits and linseed genotypes. Different colors of the individuals (genotypes) represent five clusters of 40 linseed genotypes. The length and color intensity of the arrows denote the extent of total contribution of the variables to PC1 and PC2. PC1 in x-axis explained 22.6% of total variability while, PC2 contributed 12% of total variability in y-axis. Morphological traits: DGS Days to germination started; DE Days to 80% emergence; DBI Days to branch initiation; PH28 Plant height at 28 DAS (cm); NLPP Number of leaves plant–1 at 30 DAS; NB40 Number of branches at 40 DAS; PH40 Plant height at 40 DAS (cm); BD42 Base diameter at 42 DAS (mm); MBD42 Main branch diameter at 42 DAS (mm); DFF Days to first flowering; PH60 Plant height at 60 DAS (cm); NBPP60 Number of branches plant–1 at 60 DAS; DTBI Days to top branch initiation; LP Length of pedicel (mm); LF Length of flower (mm); LC Length of calyx (mm); PH82 Plant height at 82 DAS (cm); DCF Days to capsule formation; HMS82 Height of main stem at 82 DAS (cm); DFS Days to flowering stops; NFPP Number of flowers plant–1; NFCPP Number of filled capsules plant–1; NUFCPP Number of unfilled capsules plant–1; CD Capsule diameter at 115 DAS (mm); CL Capsule length at 115 DAS (mm); SL Seed length (mm); SB Seed breadth (mm); NSPC Number of seeds capsule–1; TSW 1000-seed weight (g); YPP Yield plant–1 (g)
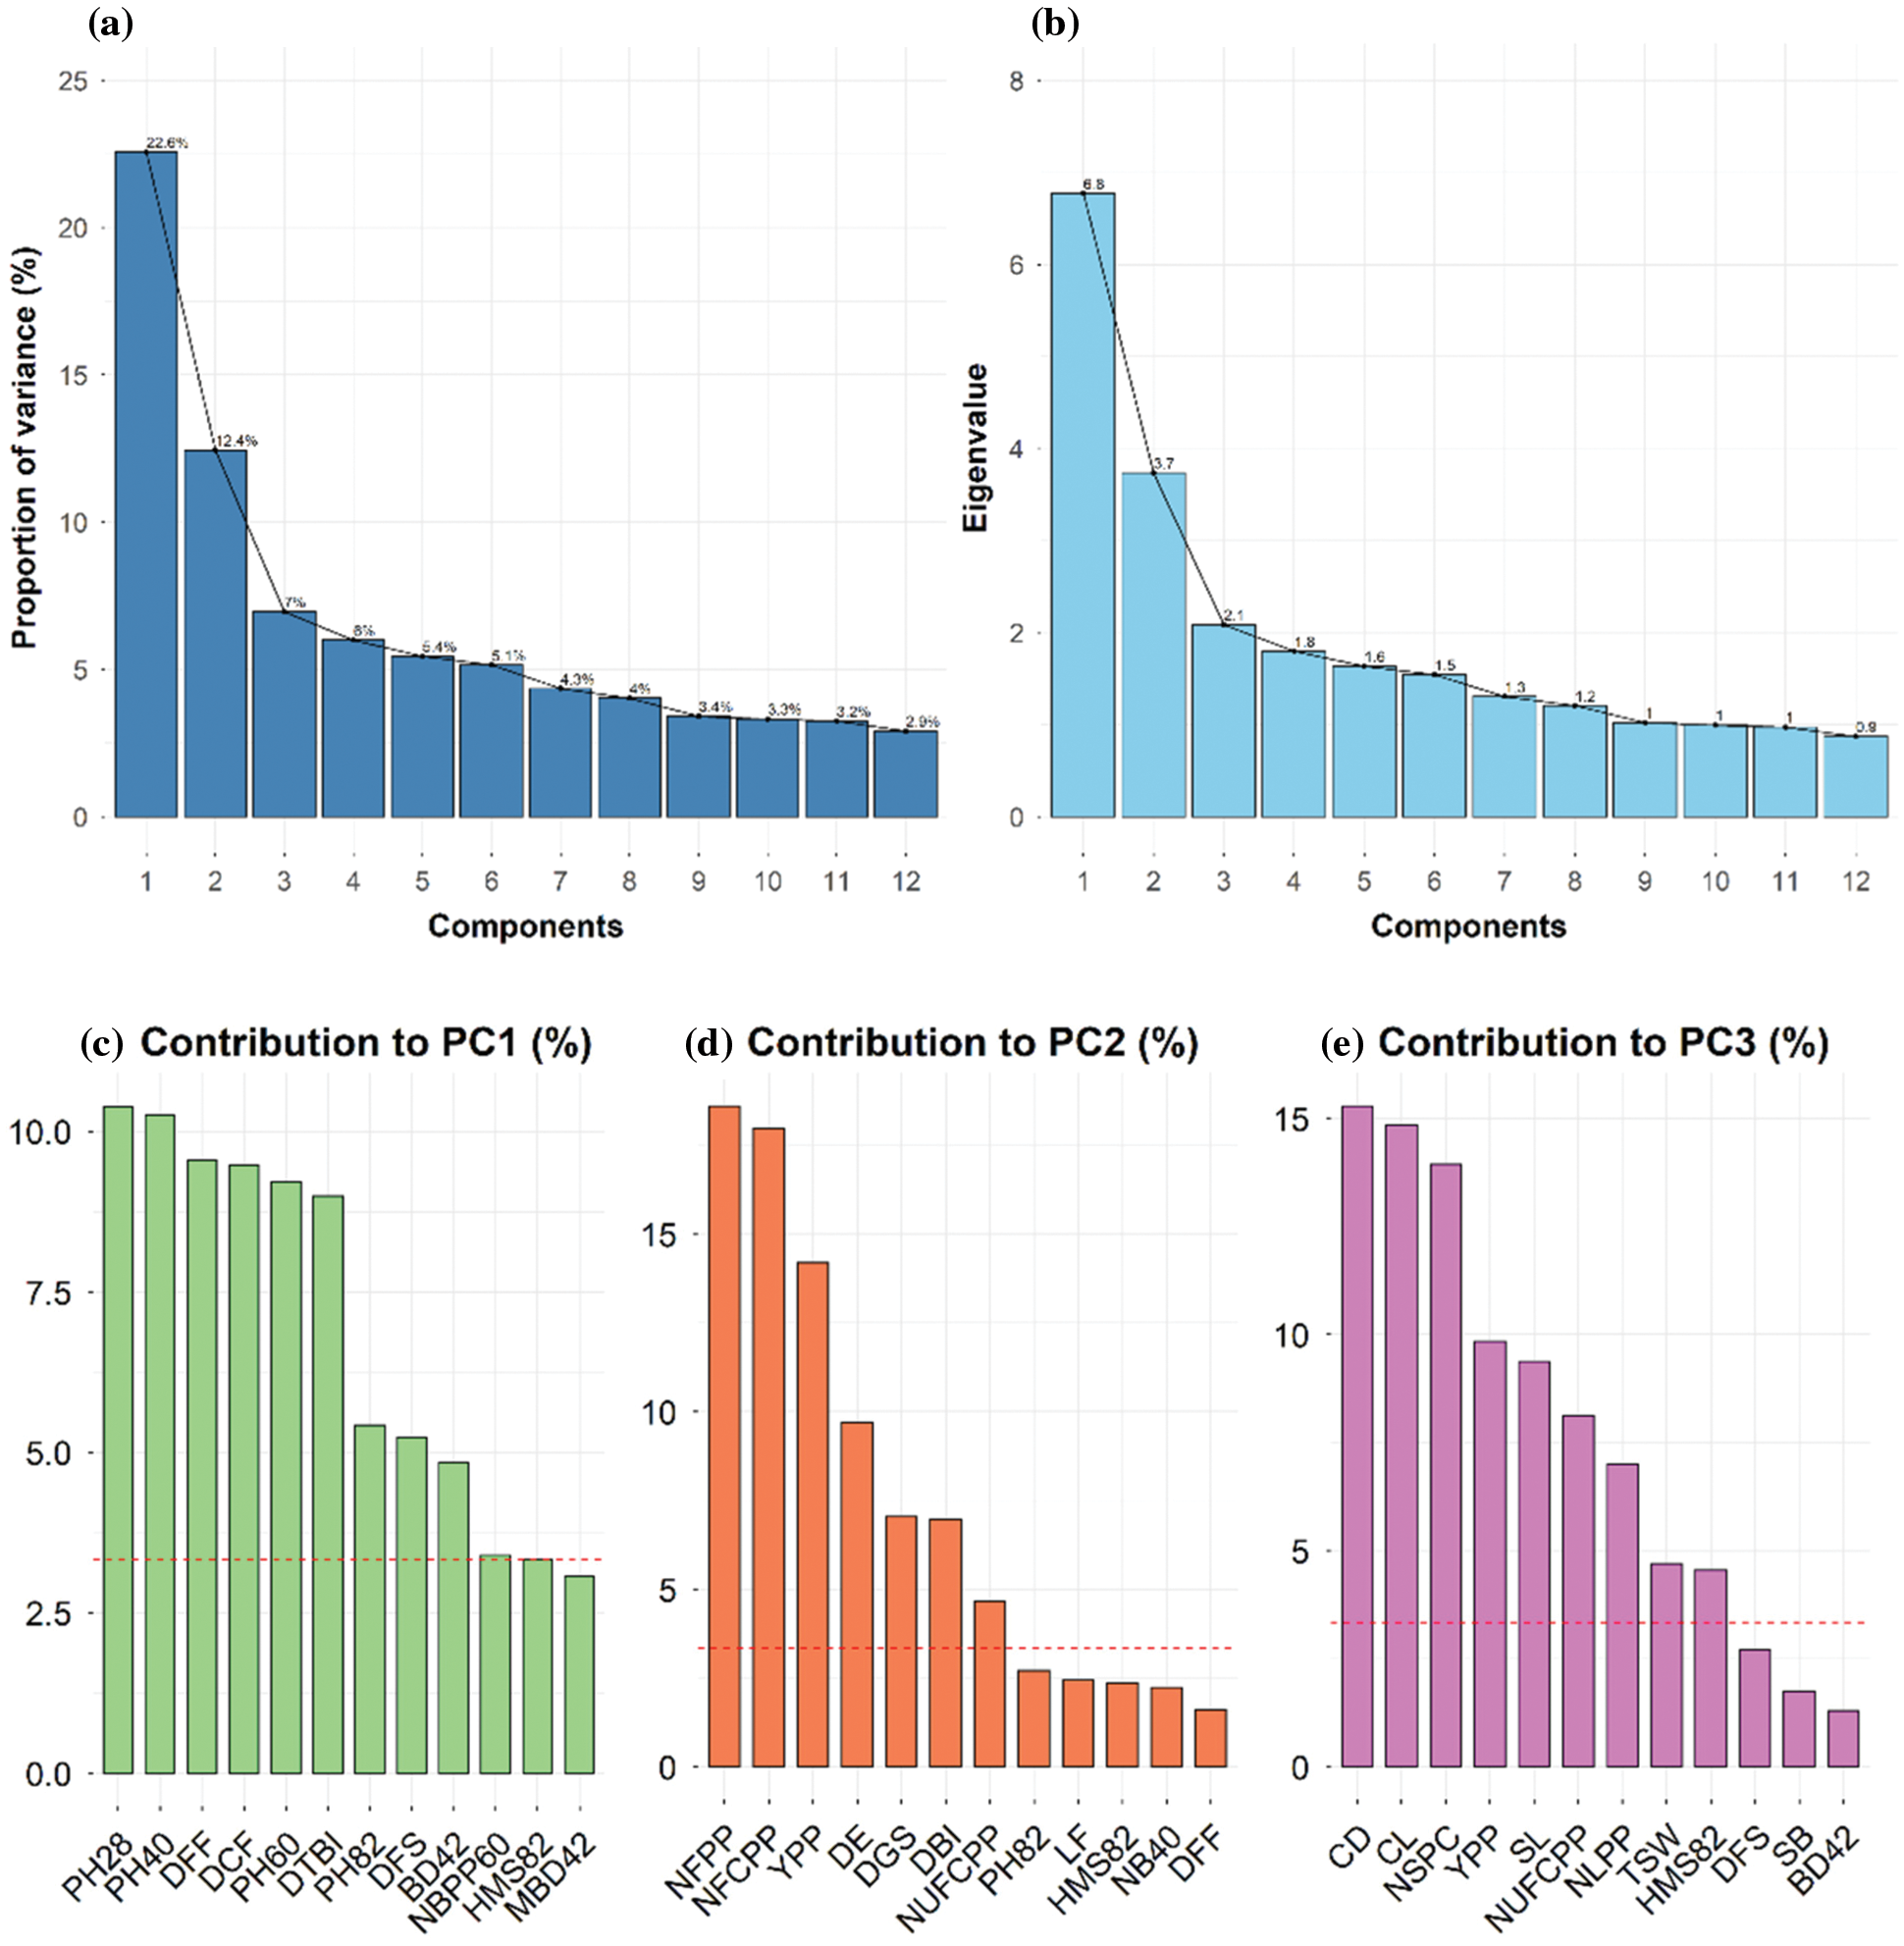
Figure 4: (a) Proportion of variance (%) of top 12 principal components (PCs), (b) Eigen values of top 12 PCs, (c) Contribution of variables to PC1 (%), (d) Contribution of variables to PC2 (%), and (e) Contribution of variables to PC3 (%) derived from principal component analysis (PCA). Red dashed lines across bar plots are the reference lines and the variable bars above the reference lines are considered as important in contributing to the respected PCs
The correlation matrix of 30 measured traits was presented in Fig. 5 to understand the extent of relationships among them. The traits DFS, DTBI, DFF and DCF were significantly and highly negatively correlated with base diameter (BD42 and MBD42) and plant height at different stages (PH28, PH40, PH60 and PH82) of development (Fig. 5). The DBI and DE were negatively associated with NLPP, NUFCPP, BD42 and PH40. The DBI, DGS, DE, DFS, DTBI, DFF and DCF closely associated and maintained strong positive correlations among them. Association between different yield-related components revealed that seed YPP showed a highly significant (P < 0.001) positive correlation with NFPP, NFCPP, NSPC and TSW (Fig. 5). The NFPP positively and significantly correlated with NFCPP and NUFCPP. The results revealed that the seed yield was directly correlated with the number of flowers and filled capsules, number of seeds per capsule and thousand seed weight per plant (Fig. 5).
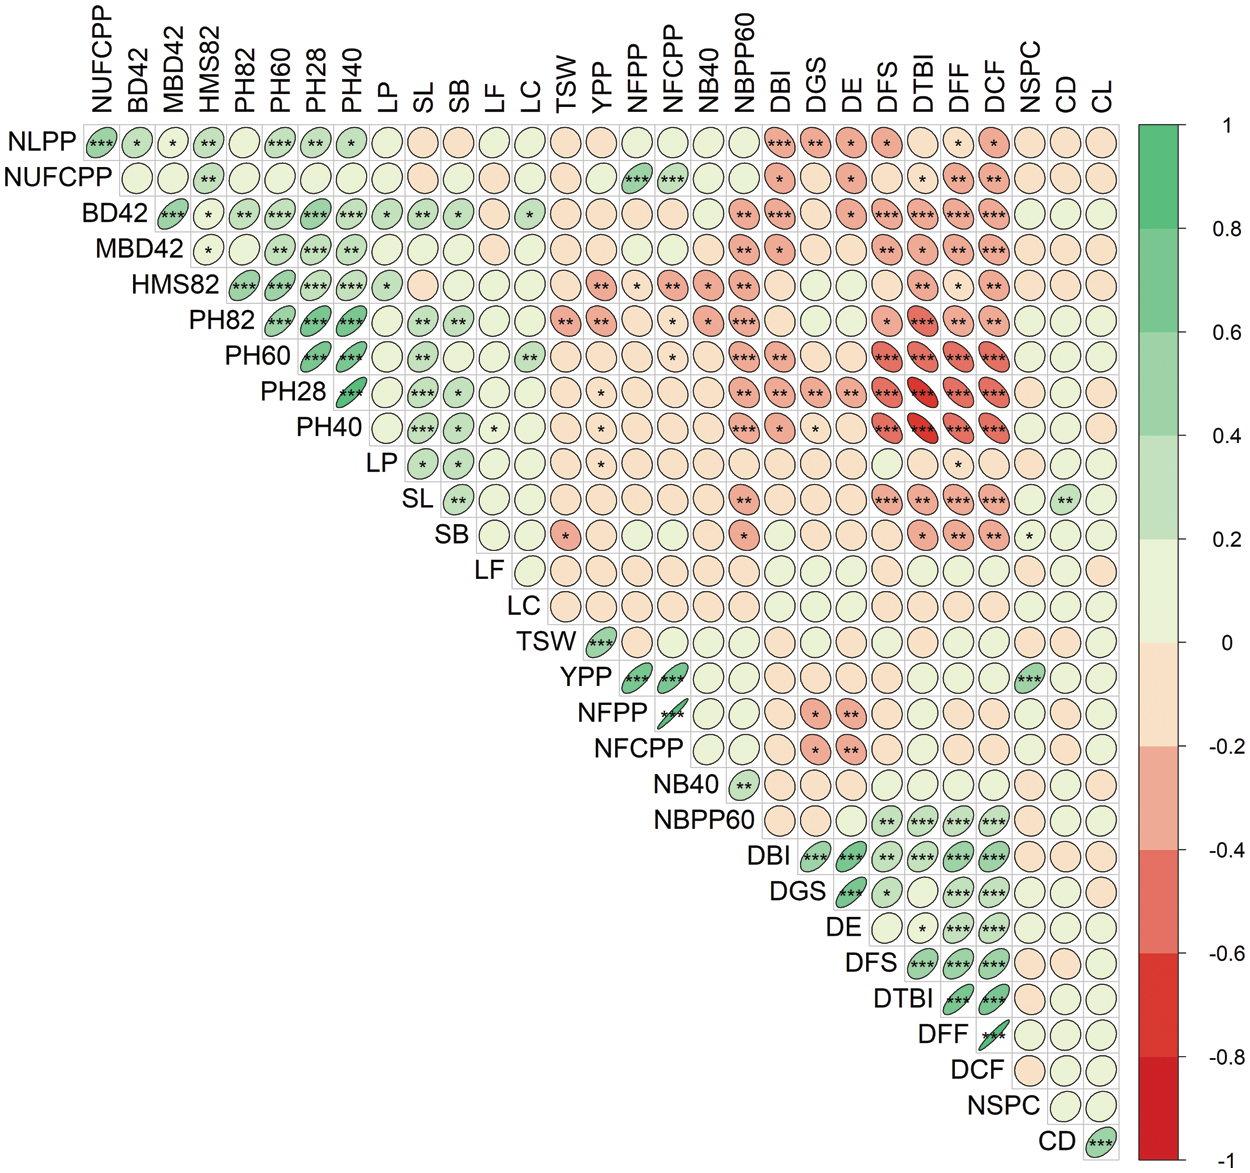
Figure 5: Correlation matrix and heatmap of the 30 measured traits of 40 linseed genotypes. Red and green ellipses indicate negative and positive correlations, respectively. The higher color intensity reflects a higher coefficient. The shape of the ellipses shows the degree of linearity in the relationships. *, ** and *** denote 5%, 1% and 0.1% levels of significance. Traits description: DGS Days to germination started; DE Days to 80% emergence; DBI Days to branch initiation; PH28 Plant height at 28 DAS (cm); NLPP Number of leaves plant–1 at 30 DAS; NB40 Number of branches at 40 DAS; PH40 Plant height at 40 DAS (cm); BD42 Base diameter at 42 DAS (mm); MBD42 Main branch diameter at 42 DAS (mm); DFF Days to first flowering; PH60 Plant height at 60 DAS (cm); NBPP60 Number of branches plant–1 at 60 DAS; DTBI Days to top branch initiation; LP Length of pedicel (mm); LF Length of flower (mm); LC Length of calyx (mm); PH82 Plant height at 82 DAS (cm); DCF Days to capsule formation; HMS82 Height of main stem at 82 DAS (cm); DFS Days to flowering stops; NFPP Number of flowers plant–1; NFCPP Number of filled capsules plant–1; NUFCPP Number of unfilled capsules plant–1; CD Capsule diameter at 115 DAS (mm); CL Capsule length at 115 DAS (mm); SL Seed length (mm); SB Seed breadth (mm); NSPC Number of seeds capsule–1; TSW 1000-seed weight (g); YPP Yield plant–1 (g)
The breeding strategy is determined by the magnitude of genetic variation in agro–morphological traits related to yield. Genetic diversity and multivariate analysis research are critical for successful evaluation of genotypes. Genetic variability studies provide useful information that can be used as selection criteria in breeding programs [33–34,15]. In the current study, 30 quantitative traits were assayed in 40 linseed genotypes for selecting the superior genotypes and traits. ANOVA revealed significant differences in the measured descriptors including yield attributes indicating the existence of high degree of genetic variation among linseed genotypes that might be useful for future selection breeding program (Table A1; Table 2). Previous studies also reported a wide range of genetic variability of economically relevant traits in linseed that are in confirmation with the results of the present study [35–38]. A wide range of variations was observed for most of the traits presented in Table 2. The traits such as DGS, PH28, NB40, PH40, BD42, DFF, PH60, NBPP60, DTBI, PH82, DCF, HMS82, DFS, DCF, NFPP, NFCPP, NUFCPP, NSPC and YPP manifested very big range in mean performance and the results are supported by other previous studies [36,39]. Yield is one of the most significant economic characteristics, and it is the result of the multiplicative interactions of the features that contribute to it [40]. Seed yield and associated characteristics exhibited considerable phenotypic heterogeneity. The mean performance in this study revealed a high degree of variability in yield and its related traits (Table 2; Fig. 1), implying that future breeding programs will have a larger opportunity to utilize these characteristics [41]. In agreement with the present study results, significant variability in yield and its related attributes of linseed were also reported by other researchers including our previous study with 26 linseed accessions [35,36,42]. We obtained that the phenotypic variance (σ2p) had been always higher than the genotypic variance (σ2g) for all of the studied traits (Table 3), indicated that the environmental factors regulated the expression of traits in linseed. The highest PCV and GCV recorded in YPP followed by PH40, PH28, DGS, PH60, NFCPP, NFPP, DFF and DE suggesting the variation existed among these traits might allow selection to improve these characters. On the other hand, the lowest values of PCV and GCV were measured in CD. These results are in agreement with those recorded by previous researchers in linseed [36,43]. In this study, closer PCV and GCV values were measured in DE, DBI, DTBI and DFS indicating less influenced by environmental factors suggesting the reliability of selection based on these traits in future breeding program. The results of closeness between PCV and GCV were also consistent with many related researches [44–47].
Estimation of high heritability (h2b) along with high genetic advance is an efficient tool for predicting gain under selection rather than heritability alone [28]. Similarly, the character showing high heritability will also exhibit high genetic advance [31]. In the present study, most of the traits exhibited low to moderate broad-sense heritability and a few traits were highly heritable (Table 3). Hence the traits DGS, DE, PH40, DFF, NFPP, NFCPP and YPP had high heritability values (>60%), these traits might get priority during selection for the improvement of linseed genotypes. In our study, most of traits showed low genetic advance (GA) indicated that these characters were highly affected by the environmental factors and mainly control by non-additive genes, and selection of such traits may not be effective for improving yield. These environmental effects may be due to differences in soil fertility status and other unstable factors [48]. It has been suggested that management practices rather than selection are needed to improve the characteristics of such traits [49]. High heritability in integration with high GAM (>20%) was recorded for the DGS, PH28, PH40, NFPP, NFCPP and YPP indicating a predominance of additive gene action for these characters suggested that selection of traits might be effective for increasing yield. This finding is in line with an investigation reported by Paul about linseed genotypes [50].
Genetic improvement was done via selection and hybridization based on the genetic diversity between parents. Genetically diverse parents may result in the creation of desirable recombinants and transgressive segregants, which may lead to the improvement of good performing varieties. Cluster analysis set a large number of accessions into a small number of homogeneous clusters, facilitating the selection of diverse accessions. The study used 40 genotypes that were classified into five clusters based on divergence analysis, as shown in Fig. 2 and Table 4. The clustering of genotypes was not related to their geographical origin, but rather to their morphological similarities among them. Clustering occurred randomly and independently, with cluster V being the biggest of all clusters, followed by Cluster-I, Cluster-IV, Cluster-II, and Cluster-III. The clustering of genotypes into five groups indicated that the material under examination has a significant level of genetic diversity. The genotypes under Cluster-IV possessed higher yield and yield attributes suggesting to use of these genotypes for cultivation in the studied environmental conditions for better yield and productivity (Table 4). On the other hand, the genotypes in Cluster-III were characterized by early emergence and germination, early flowering and capsule formation with the lowest days to stop flower blooming (Fig. 2). The increased plant and main stem heights and stem diameter was observed in Cluster-II genotypes. An earlier study analyzed 103 linseed accessions for genetic diversity using seven quantitative characteristics and classified them into 12 clusters, with Cluster-I having the highest accessions at 23 [51]. Similarly, various researchers have found distinct clustering patterns in linseed genotypes [50,52]. Thus, such a wide and diversified clustering pattern indicates that the linseed germplasm has a large amount of diversity and variation.
The variance and the relative contribution of the measured traits to overall variability were estimated using principal component analysis (PCA) (Figs. 3 and 4). PCA–biplot is a type of multivariate analysis which integrates traits and genotypes two dimensionally minimizing overlapping variations from complex data set and facilitates the determination of main characters for selection. In this study, PC1 contributed 22.6% of total variability, while PC2, PC3, PC4, and PC5 contributed 12.4%, 7%, 6%, 5.4% and 5.1%, respectively (Fig. 4a). PCA identifies the characteristics with the greatest variability. PCA–biplot revealed that the morphological traits such as plant height at different DAS, days to first flowering, days to capsule formation, days to first flowering and base diameter were contributed by PC1 while, PC2 was responsible for yield and yield-related characteristics. Thus, PCA showed a clear differentiation among traits as well as substantial variability among the five clusters of 40 linseed genotypes (Fig. 4). According to the results obtained, the traits DFF, DCF, DTBI, NFPP, NFCPP, YPP, plant height at different DAS, DGS, DE and DBI were highly contributed to describe the variations across the genotypes and therefore, it will be possible for genetic improvement of linseed genotypes by selection process using these obtained traits. According to Singh et al. [53], the feature that contributes the most divergence should be given more emphasis when selecting the type of cluster to use for further selection, and the pare to use for hybridization [53]. The variability of traits established by PCA–biplot and cluster analysis was also supported by the correlation matrix of the measured traits in Fig. 5. The traits assembled in Cluster-1 such as DBI, DE, DGS, DTBI, DFF and DCF (Fig. 2) those were mostly contributed by PC1 and PC2 and maintained a strong negative correlation with the traits in Cluster-2 (plant heights at different DAS, stem base diameter and main stem height). In contrast, a strong positive correlation between YPP and NFPP, NFCPP, NUFCPP, NSPC and TSW (Cluster-2 traits and mostly associated with PC2) were observed suggesting that selection for these characteristics would result in increased seed production. Similar observations were also established by some other studies [38,54,55]. The results of this study indicated that positive and important characteristics associated with grain yield have the potential to improve seed production. These characteristics were given consideration throughout the selection process since they showed a positive and statistically significant relationship with grain yield. When single characteristic is selected, it will have a direct impact on the other traits, as demonstrated by the strong and positive correlation of the traits, therefore allowing successful selection for breeding programs.
The present study’s findings demonstrate the existence of sufficient genetic diversity within and among genotypes, implying the possibility of future genetic improvement in linseed for economic characteristics. Cluster analysis revealed a clear separation of 40 genotypes into five clusters showing a significant genetic variability among them. The genotypes G3, G4, G6, G10 and G31 were shown to be promising for early flower and capsule formation in association with yield and yield attributing characters. The genotypes assembled in Cluster-II and III performed better in relation to morphological characters. According to different genetic variability estimation, a significant genetic variation was detected for most of the characteristics examined. The genetic variability study and multivariate analysis showed that the traits such as days to first flowering and capsule formation, days to emergence and germination, plant height at different DAS, number of flowers and filled capsules per plant and finally yield per plant were found important and could be effectively used for selection criteria for the development of linseed breeding. The genetic diversity of studied linseed genotypes detected in this study will aid useful information for further trait–specific breeding programs.
Authorship: The authors confirm contribution to the paper as follows: study conception and design: Conceptualization: A.K.M.G.S., and M.S.H.; methodology: A.K.M.G.S., M.E.H., M.G.A., and M.S.H.; formal analysis: M.G.A., M.S.H., and M.N.U.; data curation: M.S.H., M.N.U., M.G.A., M.A.H., and M.S.H.; statistical expertise: M.S.H., and M.G.A.; writing—original draft preparation: A.K.M.G.S., M.S.H., M.G.A., M.A.H.; writing—review and editing: M.N.U., M.A.H., E.S.D., and M.A.B.; visualization: M.A.H., M.N.U., M.G.A., M.S.H.; supervision: A.K.M.G.S., M.E.H., and M.S.H.; project administration: A.K.M.G.S., E.S.D., and M.A.B.; funding acquisition: A.K.M.G.S., E.S.D., and M.A.B. All authors have read and agreed to the published version of the manuscript.
Acknowledgement: The authors extend their appreciation to Taif University for funding current work by Taif University Researchers Supporting Project No. (TURSP-2020/85), Taif University, Taif, Saudi Arabia and Ministry of Education, Government of the People’s Republic of Bangladesh.
Funding Statement: The current work was funded by Taif University Researchers Supporting Project No. (TURSP-2020/85), Taif University, Taif, Saudi Arabia and “Grant of Advanced Research in Education”, Ministry of Education, Government of the People’s Republic of Bangladesh (Project No. BS-37.20.0000.004.033.020.2016.65).
Conflicts of Interest: The authors declare that they have no conflicts of interest to report regarding the present study.
1. Lay, C. L., Dybing, D. D. (1989). Linseed. In: Robbelen, G., Downey, R. K., Ashri, A. (Eds.Oil crops of the world, pp. 416–430. New York, USA: McGraw-Hill. [Google Scholar]
2. Khan, M. A., Mirza, M. Y., Amjad, M., Nawaz, N., Nawa, M. S. et al. (2013). Assessment of genetic diversity in germplasm of linseed (Linum usitatissimum L.). Pakistan Journal of Agricultural Research, 26(3), 178–184. [Google Scholar]
3. Khan, M. L., Sharif, M., Sarwar, M., Ameen, M. (2010). Chemical composition of different varieties of Linseed. Pakistan Veterinary Journal, 30(2), 79–82. [Google Scholar]
4. Ganorkar, P. M., Jain, R. K. (2013). Flaxseed–A nutritional punch. International Food Research Journal, 20(2), 519–525. [Google Scholar]
5. Nôžková, J., Pavelek, M., Bjelková, M., Brutch, N., Tejklová, E. et al. (2016). Descriptor list for flax (Linum usitatissimum L.), pp.102, Nitra, Solovakia: Slovak University of Agriculture in Nitra. DOI 10.15414/2016.9788055214849. [Google Scholar] [CrossRef]
6. You, F. M., Cloutier, S., Rashid, K. Y., Duguid, S. D. (2019). Flax (Linum usitatissimum L.) genomics and breeding. In: Advances in plant breeding strategies: Industrial and food crops, pp. 277–317. Berlin, Germany: Springer. [Google Scholar]
7. Wakjira, A. (2007). Linseed (Linumusitatissimum L.). In: van der Vossen, H. A. M., Mikilamo, G. S.(Eds.Plant resources of Tropical Africa 14. Vegetable oils. PROTA foundation, pp. 108–115. Wageningen, Netherlands/ Backhuys Publishers, Leiden, Netherlands. https://www.Prota.org. [Google Scholar]
8. Biradar, S. A., Ajithkumar, K., Rajanna, B., Savitha, A. S., Shubha, G. V. et al. (2016). Prospects and challenges in linseed (Linum usitatissimum L.) production: A review. Journal of Oilseeds Research, 33(1), 1–13. [Google Scholar]
9. FAOSTAT (2018). Food and Agriculture Organization. http://www.fao.org/faostat/en/#data/QC. [Google Scholar]
10. BBS (Bangladesh Bureau of Statistics) (2018). Statistical year book Bangladesh 2018 (38th Editionpp. 148–302. Dhaka, Bangladesh: Statistics and Informatics Division, Ministry of Planning, Government of the People’s Republic of Bangladesh. [Google Scholar]
11. Negash, K. (2006). Studies on genetic divergence in common bean (Phaseolus vulgaris L.) introductions of Ethiopia (MS Thesis). School of Graduate Studies, Addis Abeba University. [Google Scholar]
12. Kumar, N., Paul, S., Dhial, R. S. (2016). Study on genetic variability, heritability and genetic advance for agro-morphological traits of linseed (Linum usitatissimum L.). Research in Environment and Life Sciences, 9, 16–18. [Google Scholar]
13. Shah, K. A., Liaqat, S., Asif, A., Qaizar, A., Zhou, L. (2015). Genetic variability and heritability studies for leaf and quality characters in flue cured Virginia tobacco. Academia Journal of Agricultural Research, 3(3), 44–48. DOI 10.15413/ajar.2015.01052. [Google Scholar] [CrossRef]
14. Kumar, S., Ram, S., Chakraborty, M., Ahmad, E., Verma, N. et al. (2019). Role of genetic variability for seed yield and its attributes in linseed (Linum usitatissimum L.) improvement. Journal of Pharmacognosy and Phytochemistry, 2, 266–268. [Google Scholar]
15. Upadhyay, S., Nandan, M., Ashish, K. T. (2019). Assessment of variability among flax type linseed genotypes (Linum usitatissimum L.) of Chhattisgarh plains. International Journal of Current Microbiology and Applied Sciences, 8(6), 2633–2637. DOI 10.20546/ijcmas.2019.806.316. [Google Scholar] [CrossRef]
16. Rahman, M. A., Thomson, M. J., Shah-E-Alam, M., de Ocampo, M., Egdane, J. (2016). Exploring novel genetic sources of salinity tolerance in rice through molecular and physiological characterization. Annals of Botany, 117(6), 1083–1097. DOI 10.1093/aob/mcw030. [Google Scholar] [CrossRef]
17. Franco, T. L. (2003Análisis Estadístico de Datos de Caracterización Morfológica de Recursos Fitogenéticos-Boletin Tecnico IPGRI No. 8. Rome, Italy: Biodiversity International. [Google Scholar]
18. Singh, A., Tewari, N. (2016). Combining ability analysis for yield and yield contributing attributes in linseed (Linum usitatissimum L.). Journal of Oilseeds Research, 33, 75–78. [Google Scholar]
19. Tripathi, A., Kumar, S., Singh, M. K., Kumar, A., Karnwal, M. K. (2017). Phenotypic assessment of rice (Oryza sativa L.) genotypes for genetic variability and varietal diversity under direct seeded condition. Journal of Applied and Natural Science, 9(1), 6–9. DOI 10.31018/jans.v9i1.1138. [Google Scholar] [CrossRef]
20. Diederichsen, A., Richards, K. (2003). Cultivated flax and the genus Linum L. In: Muir, A. D., Westcott, N. D. (Eds.Taxonomy and germplasm conservation, pp. 22–54. London: CRC Press. [Google Scholar]
21. Kumari, A. (2017). Histochemical and organolyptic analysis of major aroma compound (2-acetyl-1-pyrroline) in Kalanamak rice landraces and some Basmati rice varieties. Cell & Cellular Life Sciences Journal, 2(2), 1–5. DOI 10.23880/cclsj-16000112. [Google Scholar] [CrossRef]
22. Böhm, K., Smidt, E., Tintner, J. (2013). Application of multivariate data analyses in waste management. In: de Freitas, L. V., de Freitas, A. P. B. R. (Eds.Multivariate analysis in management, engineering and the sciences. London, UK: IntechOpen. [Google Scholar]
23. FAO (Food and Agriculture Organization of the United Nations) and UNDP (United Nations Development Programme) (1988). Land Resources Appraisal of Bangladesh for Agricultural Development Report No. 2. Agro-Ecological Regions of Bangladesh. UNDP and FAO, Rome, Italy. [Google Scholar]
24. BARC (Bangladesh Agricultural Research Council) (2018). Fertilizer recommendation guide. Dhaka, Bangladesh: Farm Gate. [Google Scholar]
25. Robinson, H. F., Comstock, R. E., Harvey, P. H. (1955). Genetic variances in open pollinated varieties of corn. Genetics, 40(1), 45–60. DOI 10.1093/genetics/40.1.45. [Google Scholar] [CrossRef]
26. Falconer, D. S. (1981). Introduction to quantitative genetics (2nd Editionpp. 1–133. London: Longman Group, Ltd. [Google Scholar]
27. Robinson, H. F., Comstock, R. E., Harvey, P. H. (1949). Estimates of heritability and the degree of dominance in corn. Agronomy Journal, 41(8), 353–359. DOI 10.2134/agronj1949.00021962004100080005x. [Google Scholar] [CrossRef]
28. Singh, R. K., Chaudhary, B. D. (1985). Biometrical methods in quantitative genetics analysis, pp. 318. New Delhi, India: Kalyani Publishers. [Google Scholar]
29. Allard, R. W. (1961). Principles of plant breeding. London & New York: John Wiley & Sons. [Google Scholar]
30. Souza, E., Sorrells, M. E. (1991). Relationships among 70 North American oat germplasms: II. Cluster analysis using qualitative characters. Crop Science, 31(3), 605–612. DOI 10.2135/cropsci1991.0011183X003100030010x. [Google Scholar] [CrossRef]
31. Johnson, H. W., Robinson, H. F., Comstock, R. E. (1955). Genotypic and phenotypic correlations in soybeans and their implications in selection. Agronomy Journal, 47(10), 477–483. DOI 10.2134/agronj1955.00021962004700100008x. [Google Scholar] [CrossRef]
32. Team, R. C. (2013). R: A language and environment for statistical computing. R Foundation Statistical Computation, Vienna, Austria. http://www.R-project.org/. [Google Scholar]
33. Singh, V. K., Sharma, V., Kumar, S. P., Chaudhary, M., Sharma, B. et al. (2016). Study on genetic variability, heritability and genetic advance for yield and its contributing traits in linseed (Linum usitatissimum L.). Current Advances in Agricultural Sciences, 8(2), 192–194. DOI 10.5958/2394-4471.2016.00046.0. [Google Scholar] [CrossRef]
34. Myint, K. A., Amiruddin, M. D., Rafii, M. Y., Abd Samad, M. Y., Ramlee, S. I. et al. (2019). Genetic diversity and selection criteria of MPOB-Senegal oil palm (Elaeis guineensis Jacq.) germplasm by quantitative traits. Industrial Crops and Products, 139(20), 111558. DOI 10.1016/j.indcrop.2019.111558. [Google Scholar] [CrossRef]
35. Rajanna, B., Biradar, S. A., Ajithkumar, K. (2014). Correlation and path coefficient analysis in linseed (Linum usitatissimum L.). The Bioscan, 9(4), 1625–1628. [Google Scholar]
36. Bindra, S., Paul, S. (2016). Genetic variability and association studies in linseed (Linum usitatissimum L.). The Bioscan, 11(3), 1855–1859. [Google Scholar]
37. Terfa, G. N., Gurmu, G. N. (2020). Genetic variability, heritability and genetic advance in linseed (Linum usitatissimum L.) genotypes for seed yield and other agronomic traits. Oil Crop Science, 5(3), 156–160. DOI 10.1016/j.ocsci.2020.08.002. [Google Scholar] [CrossRef]
38. Dabalo, D. Y., Singh, B. C. S., Weyessa, B. (2020). Genetic variability and association of characters in linseed (Linum usitatissimum L.) plant grown in central Ethiopia region. Saudi Journal of Biological Sciences, 27(8), 2192–2206. DOI 10.1016/j.sjbs.2020.06.043. [Google Scholar] [CrossRef]
39. Choudhary, A. K., Marker, S., Rizvi, A. F. (2017). Genetic variability and character association for seed yield in linseed (Linum usitatissimum L.) under rainfed conditions. Journal of Pharmacognosy and Phytochemistry, 6(5), 457–460. [Google Scholar]
40. Kant, L., Gulati, S. C. (2001). Genetic analysis for yield and its components and oil content in Indian mustard [B. juncea (L.) Czern & Coss.]. Indian Journal of Genetics, 61(1), 37–40. [Google Scholar]
41. Kumar, M. S., Mawlong, I., Rani, R. (2020). Biofortification of brassicas for quality improvement. In: Wani, S. H., Thakur, A. K., Khan, Y. J. (Eds.Brassica improvement, pp. 127–145. Cham: Springer. [Google Scholar]
42. Sarwar, A. K. M. G., Haque, M. E., Khatun, M. M., Haque, M. S. (2020). Agro-morphological characterization of flax (Linum usitatissimum L.) accessions at north-western part of Bangladesh. Archives of Agriculture and Environmental Science, 5(4), 465–469. DOI 10.26832/24566632.2020.050405. [Google Scholar] [CrossRef]
43. Kaur, V., Kumar, S., Yadav, R., Wankhede, D. P., Aravind, J. et al. (2018). Analysis of genetic diversity in Indian and exotic linseed germplasm and identification of trait specific superior accessions. Journal of Environmental Biology, 39(5), 702–709. DOI 10.22438/jeb/39/5/MRN-849. [Google Scholar] [CrossRef]
44. Akbar, M., Mahmood, T., Anwar, M., Ali, M., Shafiq, M. et al. (2003). Linseed improvement through genetic variability, correlation and path coefficient analysis. International Journal of Agriculture and Biology, 5(3), 303–305. [Google Scholar]
45. Gokulakrishnan, J., Kumar, B. S., Prakash, M. (2012). Studies on genetic diversity in mung bean (Vigna radiata L.). Legume Research, 35(1), 50–52. [Google Scholar]
46. Kumar, N., Paul, S. (2016). Selection criteria of linseed genotypes for seed yield traits through correlation, path coefficient and principal component analysis. Journal of Animal and Plant Science, 26(6), 1688–1695. [Google Scholar]
47. Manggoel, W. (2012). Genetic variability, correlation and path coefficient analysis of some yield components of ten cowpea Vigna unguiculata (L.) Walp accessions. Journal of Plant Breeding and Crop Science, 4(5), 80–86. DOI 10.5897/jpbcs12.007. [Google Scholar] [CrossRef]
48. Reddy, M. T., Babu, K. H., Ganesh, M., Reddy, K. C., Begum, H. et al. (2012). Genetic variability analysis for the selection of elite genotypes based on pod yield and quality from the germplasm of okra (Abelmoschus esculentus (L.) Moench). Journal of Agricultural Technology, 8(2), 639–655. [Google Scholar]
49. Vashistha, A., Dixit, N. N., Dipika, S. S. K., Sharma, K., Marker, S. (2013). Studies on heritability and genetic advance estimates in Maize genotypes. Bioscience Discovery, 4(2), 165–168. [Google Scholar]
50. Paul, S., Kumar, N., Kumar, A. (2017). Characterization and genetic variation study among linseed (Linum usitatissimum L.) genotypes for seed yield and related traits in Mid-Hills of North-West Himalayas. Plant Archives, 17(1), 407–411. [Google Scholar]
51. El-Nsar, T. H. S. A., Hassanien, M. S., Ottai, M. E. S., Al-Kordy, M. (2014). Genetic diversity among five Romanian linseed varieties under Egyptian conditions. Middle East Journal of Applied Science, 4(1), 114–121. [Google Scholar]
52. Patial, R., Paul, S., Sharma, D., Sood, V. K., Kumar, N. (2019). Morphological characterization and genetic diversity of linseed (Linum usitatissimum L.). Journal of Oilseeds Research, 36(1), 8–16. [Google Scholar]
53. Singh A., Tewari N. (2015). Predictors of linseed improvement identified through correlation and path coefficient analysis. Current Advances in Agricultural Sciences, 7(2), 114–116. DOI 10.5958/2394-4471.2015.00028.3. [Google Scholar] [CrossRef]
54. You, F. M., Jia, G., Xiao, J., Duguid, S. D., Rashid, K. Y. et al. (2017). Genetic variability of 27 traits in a core collection of flax (Linum usitatissimum L.). Frontiers in Plant Science, 8, 1636. DOI 10.3389/fpls.2017.01636. [Google Scholar] [CrossRef]
55. Saroha, A., Pal, D., Kaur, V., Kumar, S., Bortwal, A. et al. (2022). Agro-morphological variability and genetic diversity in linseed (Linum usitatissimum L.) germplasm accessions with emphasis on flowering and maturity time. Genetic Resources and Crop Evolution, 69(1), 315–333. DOI 10.1007/s10722-021-01231-3. [Google Scholar] [CrossRef]
Appendix A

 | This work is licensed under a Creative Commons Attribution 4.0 International License, which permits unrestricted use, distribution, and reproduction in any medium, provided the original work is properly cited. |