| Phyton-International Journal of Experimental Botany |
DOI: 10.32604/phyton.2022.020515
ARTICLE
De novo Transcriptome Analysis in Leymus mollis to Unveil Genes Involved in Salt Stress Response
1College of Agriculture, Ludong University, Yantai, 264025, China
2Engineering Research Institute of Agriculture and Forestry, Ludong University, Yantai, 264025, China
3Key Laboratory of Molecular Module-Based Breeding of High Yield and Abiotic Resistant Plants in Universities of Shandong, Ludong University, Yantai, 264025, China
*Corresponding Author: Luying Zhu. Email: 1742@ldu.edu.cn
Received: 28 November 2021; Accepted: 13 December 2021
Abstract: Leymus mollis, a wild relative of wheat, is very tolerant to salt stress, and has been considered as a valuable genetic resource for wheat breeding. However, the genetic basis for salt tolerance of this species is still largely unknown. In this study, de novo sequencing, assembly and analysis of L. mollis transcriptome in response to salt stress was performed. A total of 110,323 and 112,846 unigenes were generated for the NaCl-free (CK) and 180 mM NaCl-treated (CT) library, respectively. For the two libraries, 73,414 unigenes were successfully annotated in five common protein databases, and 7521 differentially expressed genes (DEGs) between CK and CT libraries were identified. GO enrichment analysis of the DEGs showed that the significantly enriched GO terms were predominantly involved in environmental adaptation (including “response to abiotic stimulus”, “response to water deprivation”), regulation of signaling pathway (such as “regulation of abscisic acid mediated signaling pathway”, “regulation of cell communication”), and photosynthesis (including “response to light stimulus”, “photosynthesis, light harvesting” and “chlorophyll metabolic process”). KEGG pathway enrichment analysis showed that “mRNA surveillance pathway”, “RNA transport” and “plant hormone signal transduction” were predominantly enriched pathways, followed by several secondary metabolic pathways, photosynthesis, carbohydrate metabolism and lipid metabolism. In addition, DEGs related to osmotic stress, ion homeostasis and oxidative stress, including four dehydrins, five aquaporins, an LmNHX2 and several antioxidant enzymes or proteins genes, were found to be up-regulated in response to salt stress. These results will be helpful for further studies on the molecular mechanisms of salt responses in L. mollis.
Keywords: Leymus mollis; transcriptome; salt stress
Abbreviations
| CK | NaCl-free sample |
| CT | NaCl-treated sample |
| DEG | Differentially expressed gene |
| GO | Gene Ontology |
| KEGG | Kyoto Encyclopedia of Genes and Genomes |
| NR | NCBI non-redundant protein |
| COG | Clusters of Orthologous Groups |
| SRA | NCBI Sequence Read Archive |
| FPKM | Fragments per kilobase per million fragments |
| FDR | False discovery rate |
| NHX | Vacuolar Na+/H+ antiporter |
| DHN | Dehydrin |
| AVP | Vacuolar proton-inorganic pyrophosphatase |
| HAK | K+ transporter |
| ROS | Reactive oxygen species |
| POD | Peroxidase |
| TRX | Thioredoxin |
| APX | L-ascorbate peroxidase |
| GST | Glutathione-S-transferase |
| CAT | Catalase |
| qRT-PCR | Real-time quantitative PCR |
Soil salinity can severely affect plant growth and development, and consequently reduce crop yield and food production. Currently, more than 6% of lands throughout the world are affected by salinity [1]. Therefore, improving the resistance of crops to salt stress and the utilization efficiency of salty land have become one of the most important objectives for crop breeders.
Generally, increased soil salt concentration first causes osmotic stress which instantly affects plant growth. Then ion toxicity occurs when the salt taken up by roots reaches a threshold level, beyond which the plant cannot maintain ion homeostasis [2]. Osmotic stress and ion toxicity often cause oxidative stress and a series of secondary stresses. These harmful effects caused by salt stress inhibit plant growth and productivity in various ways, including impairing physiological and biochemical metabolic processes, decreasing photosynthetic efficiency and causing nutritional disorders in plants [3,4].
In order to survive under adverse environmental conditions, plants have developed a serie of mechanisms involving developmental, morphological, physiological and biochemical strategies. Osmotic adjustment and maintaining ion balance are two important mechanisms at a molecular level for plant resistance to salinity stress [1,5]. In addition, some antioxidant enzymes and transcription factors also respond to and regulate plant tolerance to salt stress [6]. In recent years, more and more gene expression information involved in signal transduction, regulation of transcription and metabolism, redox reaction and other processes in response to salt stress have been reported [7–11].
Wheat (Triticum aestivum L.) is one of the most important grain crops moderately tolerant to saline conditions and its production is often limited by soil salinization. Therefore, it is necessary to seek a salt-tolerance genetic resource among various genotypes or wild relatives for wheat resistance breeding. Leymus mollis (Triticeae; Poaceae), a dune grass growing mainly along sea coasts and in inland dry areas, is a wild relative of wheat [12]. This species is tolerant to salt and drought, and resistant to various diseases [13–15]. However, the genetic basis for its biochemical and physiological responses to salt and drought stresses still remains largely unknown, despite the high tolerance of this species to multiple environmental stresses.
Transcriptome sequencing using next-generation sequencing technology is a fast and effective approach to generate genome-scale sequence resources, and provides an efficient way to investigate the mechanisms of plant response to various stresses [16–20]. To better understand the salt-stress response of L. mollis at transcriptional level, a comparative transcriptome analysis was performed based on the Illumina sequencing in this study. Numerous differentially expressed genes in L. mollis responsive to salt stress were identified and classified.
2.1 Plant Growth and Salt Stress Treatments
Leymus mollis seeds were immersed in water for 12 h and then planted into vermiculite in a chamber at a day/night temperature of 25/20°C with a 14 h light/10 h dark photoperiod. After germination, seedlings of the same size with the first fully expanded true leaf were transferred into a 1/2 hoagland nutrient solution and grew under the above temperature and light conditions. For comparative transcriptome analysis, three-week-old uniform plants with three true leaves were treated with 180 mM NaCl and the first true leaves were collected after treated with NaCl for 0, 6, 12, 24 and 48 h. All leaf samples were immediately frozen in liquid nitrogen and stored at −80°C for RNA extraction.
2.2 RNA Extraction, cDNA Library Construction and Sequencing
Total RNA was extracted from the frozen leaf samples using Trizol reagent (Invitrogen, USA) according to the manufacture’s protocol, and then digested with RNase-free DNase I (Takara, Japan) to remove the residual genomic DNA. The quantity and quality of total RNAs were determined with spectrophotometry and electrophoresis assays. To obtain a global and high-quality overview of the L. mollis leaf transcriptome, individual RNA obtained from different samples collected at different time points (6, 12, 24 and 48 h after the initiation of NaCl treatment) was equally pooled for library construction, and RNA from NaCl-untreated samples was used as the control.
cDNA libraries were constructed following the Illumina manufacturer’s instructions. Briefly, the poly (A) mRNA was purified from pooled total RNA using Oligo (dT) magnetic beads, and fragmented into short fragments. The first-strand was synthesized using the short fragments as templates with random hexamer-primer, and then the second-strand was amplified. The short cDNA fragments were purified and ligated to sequencing adapters. Then suitable fragments were chosen for PCR amplification to create final cDNA libraries. The resultant cDNA libraries were sequenced on the Illumina HiSeq 2000 platform at Beijing Genomic Institute (BGI) Life Tech Co., Ltd. (China).
2.3 De novo Assembly and Functional Annotation
After the clean reads were obtained by trimming adapters and removing low-quality sequencing, de novo transcriptome assembly was performed using the Trinity program [21]. The generated transcript sequences were subjected to BLASTx against the protein databases, including NCBI non-redundant protein (NR) database, Swiss-Prot protein database, Clusters of Orthologous Groups (COG), Gene Ontology (GO) and Kyoto Encyclopedia of Genes and Genomes (KEGG) pathway database, using an E-value < 10−5, retrieving proteins with the highest sequence similarity along with their protein functional annotations. The sequencing raw data have been deposited to the NCBI Sequence Read Archive (SRA) database (http://www.ncbi.nlm.nih.gov/Traces/sra) with an accession number SRP109343.
2.4 Identification of Differentially Expressed Genes (DEGs)
Transcriptional expression levels were calculated using the FPKM (fragments per kilobase per million fragments) method [22]. Genes that were differentially expressed between the control and NaCl-treated groups were considered to be significantly different at an FDR (false discovery rate) ≤ 0.001 and an absolute value of log2 ratio ≥1, according to the method described previously [23]. GO functional and KEGG pathway enrichment analysis of the DEGs were performed with the threshold of P value ≤ 0.01 to isolate significantly enriched functional classification and metabolic pathways.
2.5 Quantitative Real-Time PCR (qRT-PCR) Validation
For the validation of differentially expressed genes, qRT-PCR analyses were performed. Total RNAs isolated from the control and NaCl-treated samples were used to conduct qRT-PCR according to the manufacturer’s protocols of PrimeScript™ RT reagent Kit with gDNA Eraser (Takara, Japan) and TransStart Tip Green qPCR SuperMix (TransGen Biotech, China), respectively. The primer sequences used in qRT-PCR analysis were designed based on the assembled transcript sequences and shown in Table S1. PCR reaction was carried out on an ABI 7500 Real-Time PCR System (Thermo Fisher Scientific, USA) with a condition of 94°C for 30 s, 40 cycles of 94°C for 5 s, 55°C for 15 s, and 72°C for 34 s. Each experiment was performed in three biological replicates and actin gene was used as the reference gene. Expression levels of the selected genes were calculated using the 2−ΔΔCT method.
3.1 RNA-Seq and De novo Assembly
In order to obtain a global view of gene expression response to salt stress in L. mollis, we constructed two cDNA libraries from NaCl-free (CK) and 180 mM NaCl-treated (CT) L. mollis leaves and performed Illumina HiSeqTM 2000 platform sequencing. A total number of more than 46.91 and 47.30 Mb raw reads were respectively generated for the CK and CT libraries (Table 1). After the removal of low-quality reads and adapter sequences, 46.15 Mb clean reads were obtained for the CK library and 46.41 Mb clean reads were obtained for the CT library. The Q20 and GC percentages obtained from the CK and CT libraries were 96.44% and 55.18%, and 96.96% and 55.90%, respectively. All these results suggested that the quantity and quality of the sequencing data were good enough for accurate sequence assembly and adequate transcriptome coverage.

We then used the clean reads to perform de novo assembly analyses with the Trinity software. A total number of 218,966 and 228,637 contigs with a mean length of 382 and 376 bp for CK and CT libraries were generated, respectively. Then these contigs were connected into unigenes to generate 110,323 unigenes with a mean length of 825 bp for the CK library, and 112,846 unigenes with a mean length of 795 bp for the CT library. The N50 of all unigenes were 1379 and 1319 bp for the CK and CT libraries, respectively (Table 1).
3.2 Functional Annotation and Classification
We further performed functional annotation using all the assembled unigenes with NR, Swiss-Prot, COG, GO and KEGG functional databases. In total, 73,414 unigenes for the two libraries were successfully annotated in at least one of the above databases. Among them, 49,225 (67.05%) unigenes showed significant matches in the NR database, and 36,630 (49.90%) unigenes showed significant matches in the GO database (Table 2). In addition, some unigenes (47.53%) showed no significant similarity to any known functional proteins. These unigenes might be long noncoding RNAs or novel genes, and might also play important roles in the L. mollis response to salt stress.

3.3 Identification of Differentially Expressed Genes (DEGs) in Response to Salt Stress
To reveal the transcriptional changes in L. mollis leaves in response to salt stress, the transcription levels based on the RPKM values of the unigenes from the NaCl treated library were compared with those of the control library. A total number of 7521 DEGs were identified using the combined criteria of at least a two-fold change and an FDR ≤ 0.001. Among them, 4112 were up-regulated and 3409 were down-regulated (Fig. 1). Therefore, a number of genes were involved into salt stress responses, implying the complexity of salt stress response in L. mollis.

Figure 1: Number of up- and down-regulated differentially expressed genes (DEGs) between NaCl-free (CK) and NaCl-treated (CT) L. mollis leaves
3.4 GO Functional Analysis of the DEGs
To understand the possible functions of these DEGs in L. mollis leaves in response to salt stress, we conducted GO functional enrichment analysis. All the DEGs including both up- and down-regulated were classified into three categories: biological progress, molecular function and cellular component. Based on the results of GO enrichment analyses, the significantly enriched GO terms in the biological process category were closely associated with environmental adaptation (including “response to abiotic stimulus” and “response to water deprivation”), regulation of signaling pathway (such as “regulation of abscisic acid mediated signaling pathway”, “regulation of cell communication”, “regulation of signal transduction” and “hormone-mediated signaling pathway”) and photosynthesis (including “response to light stimulus”, “photosynthesis, light harvesting” and “chlorophyll metabolic process”). The significantly enriched GO terms in the molecular function and cellular component categories were respectively associated with “oxidoreductase activity”, “heme binding”, “monooxygenase activity” and “abscisic acid 8’-hydroxylase activity”, and “nucleosome”, “intrinsic to membrane”, “thylakoid” and “membrane” (Fig. 2). These results suggested that under short term salt stress conditions, L. mollis has been subjected to osmotic and oxidative stresses, which negatively affected a wide spectrum of biochemical responses, especially photosynthesis and metabolic process. In addition, the significantly enriched GO terms in the biological process category were also closely associated with “cuticle development”, “wax biosynthetic process” and “fatty acid biosynthetic process”, suggesting that the cuticularization in L. mollis leaves may be a protective way for its adaptation to salt stress.

Figure 2: GO functional enrichment analysis of DEGs in response to salt stress in L. mollis leaves. Significantly enriched GO terms in the biological progress, molecular function and cellular component categories are shown
3.5 KEGG Pathway Analysis of DEGs
We further performed a KEGG pathway enrichment analysis to help interpret the possible functions of the DEGs. According to the KEGG pathway analysis results, the basic pathways “mRNA surveillance pathway” and “RNA transport”, followed by “biosynthesis of secondary metabolites”, “plant hormone signal transduction”, and several secondary metabolic (such as “carotenoid biosynthesis”, “stilbenoid, diarylheptanoid and gingerol biosynthesis”, “limonene and pinene degradation” and “flavonoid biosynthesis”) and photosynthesis pathways were predominantly enriched in response to salt stress in L. mollis. Furthermore, pathways involved in carbohydrate metabolism (including “galactose metabolism”, “ascorbate and aldarate metabolism”, “fructose and mannose metabolism” and “pentose phosphate pathway”) and lipid metabolism (including “cutin, suberine and wax biosynthesis”, “glycerolipid metabolism” and “fatty acid elongation”) were also significantly enriched. These results imply that salt stress could make a great impact on these pathways in L. mollis (Fig. 3).

Figure 3: The scatter plot of KEGG pathway enrichment assay in response to salt stress in L. mollis leaves. Each circle represents a KEGG pathway. The size of circle indicates the number of enriched transcripts in the pathway
3.6 DEGs Related to Osmotic Stress and Ion Homeostasis
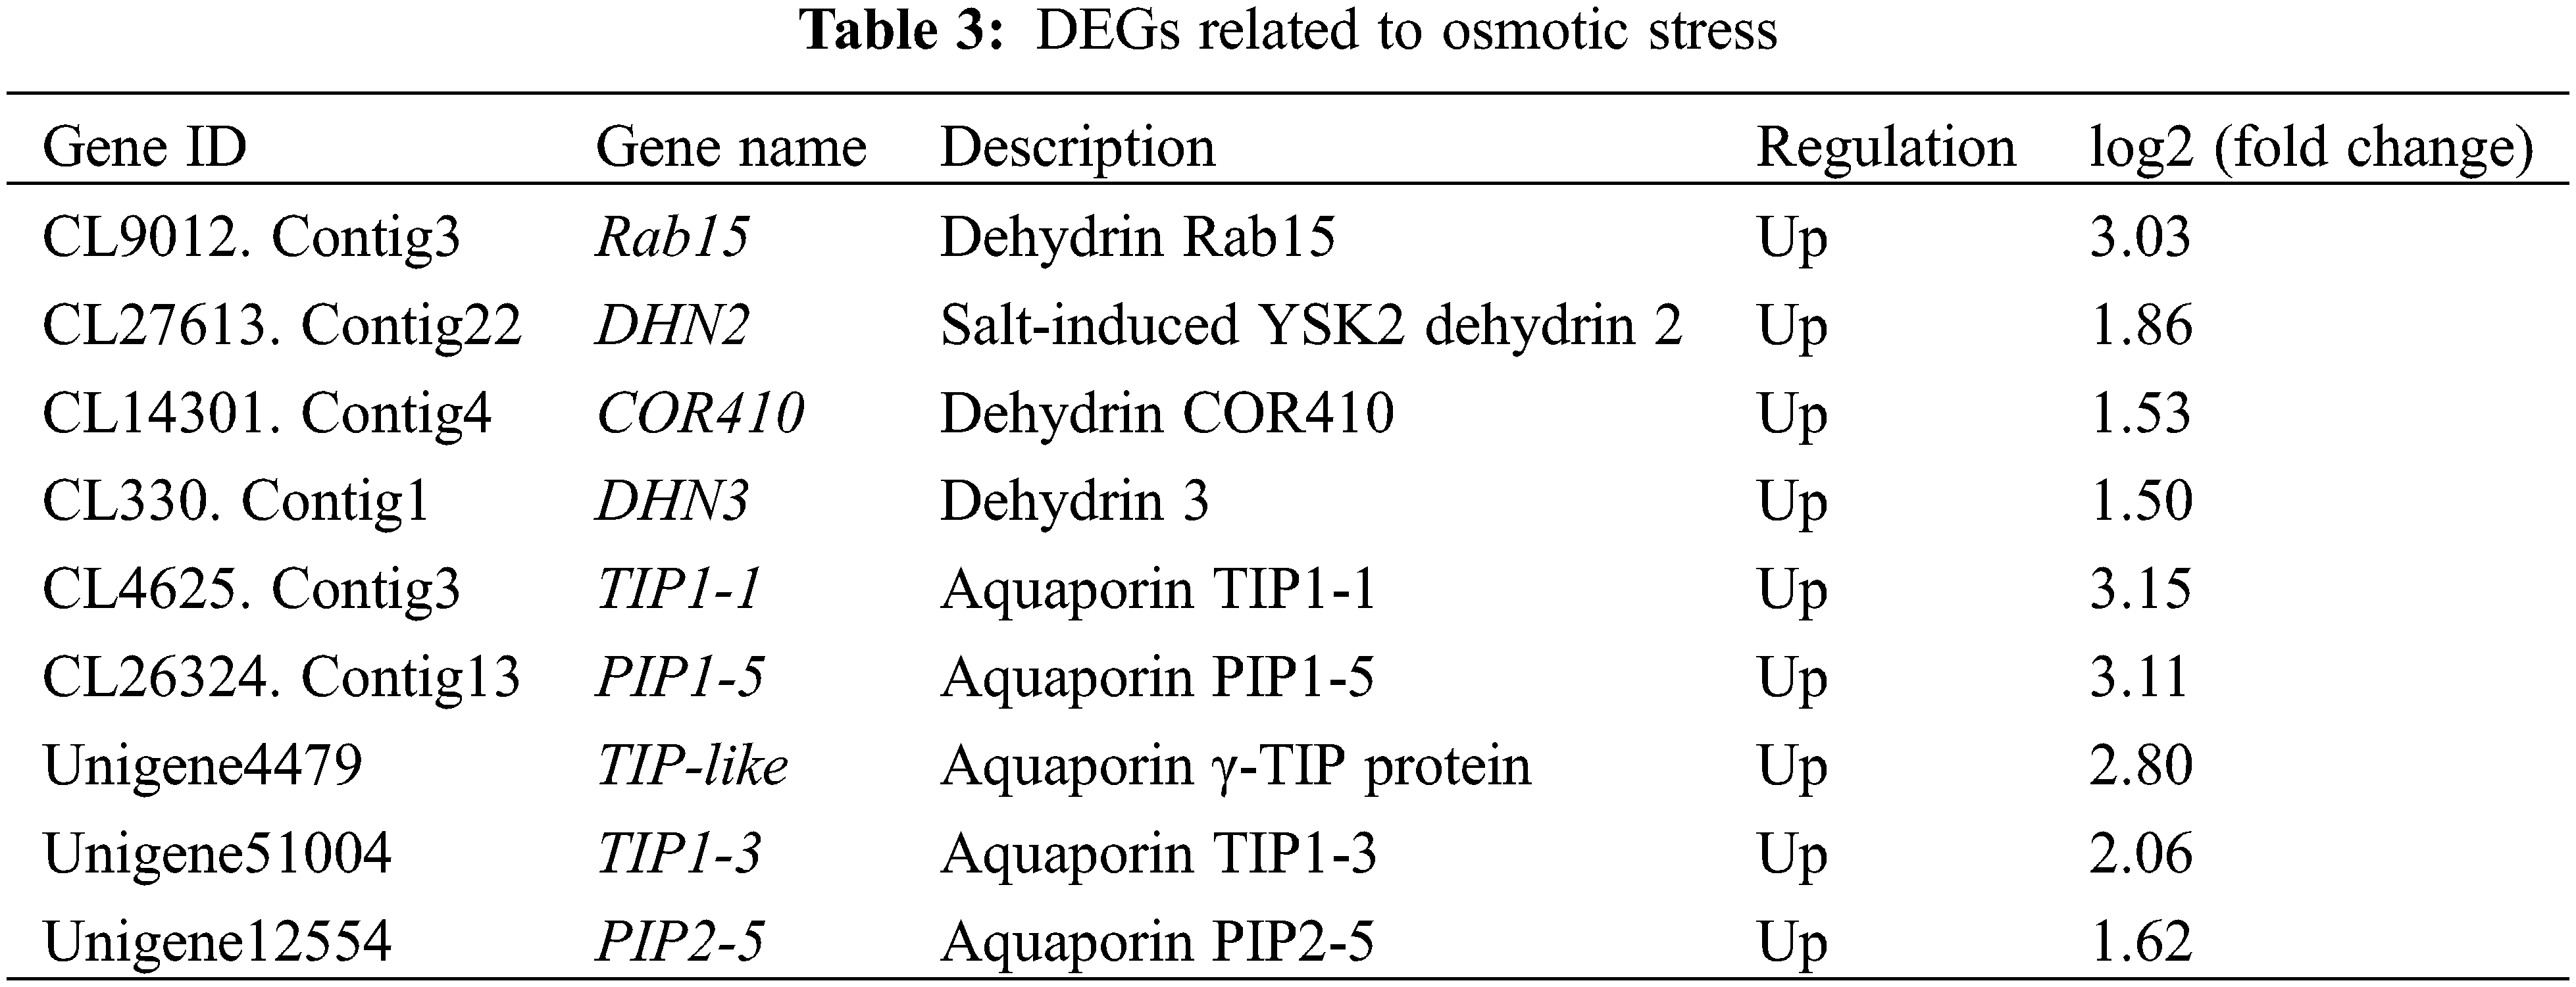
Under salt stress conditions, a high concentration of salt ions around the plant roots reduces the water potential on the root surface and inhibits the absorption of water by plants, leading to osmotic stress [24]. We found that among the DEGs involved in osmotic stress and water deprivation, 4 dehydrin genes and 5 aquaporin genes were up-regulated in response to salt stress in L. mollis leaves (Table 3). Among them, compared with CK, the unigenes annotated as “dehydrin Rab15”, “aquaporin TIP1-1” and “aquaporin PIP1-5” in CT were respectively up-regulated by 3.03, 3.15 and 3.11 times, suggesting that these genes could play important roles in the adaptation of L. mollis to salt stress.
In saline environments, Na+ is the main harmful ion. High concentrations of Na+ in the cytoplasm of leaf cells hinder the normal absorption of K+, resulting in a K+/Na+ imbalance and metabolic disorders in plants [25]. We also analyzed DEGs related to ion homeostasis in this study. We found that the DEG annotated as “vacuolar Na+/H+ antiporter 2 (NHX2)” was up-regulated, whereas the DEG annotated as “vacuolar proton-inorganic pyrophosphatase 1 (AVP1)”, which was considered to provide energy for the activity of the NHXs, was down-regulated, although no significant alterations were observed on most NHXs and proton pumps genes at the transcript level after a salt treatment. In addition to NHX2 and AVP1, four HAK genes encoding K+ transporters HAK24 and HAK25, and HAK27 and HAK7, were respectively up- and down-regulated (Table 4).

3.7 DEGs Related to Oxidative Stress
Osmotic stress, ion toxicity and the secondary effects caused by salt stress, induce the production of reactive oxygen species (ROS) which leads to oxidative stress in plants [26,27]. To alleviate the peroxidation damage, the reactive oxygen scavenging mechanism is activated in plants [28,29]. We further analyzed the DEGs involved in the reactive oxygen species scavenging system. We observed that DEGs encoding peroxidases (POD) showed different inducible expression patterns, where two genes (POD21, POD1) were up-regulated and three genes (POD70, POD16 and PODP7) were down-regulated in response to salt stress. Three DEGs encoding thioredoxin (CDSP32, TRXM2 and TRXH) and one gene encoding L-ascorbate peroxidase 2 (APX2) exhibited a significant up-regulated expression in response to the salt treatment, while the DEG annotated as “probable L-ascorbate peroxidase 8” was down-regulated. The DEGs encoding for the glutathione-S-transferase (GST) and Catalase 1 (CAT1) were also up-regulated by salt stress (Table 5).

3.8 The Expression of DEGs is Validated by qRT-PCR
To confirm the accuracy and reproducibility of the Illumina sequencing results, a total number of 13 up-regulated and 9 down-regulated DEGs in response to salt stress were randomly selected for qRT-PCR analyses. The result showed that the expression trends of these selected DEGs were consistent with those concluded by Illumina sequencing analyses, indicating that the transcriptome data in this study are reliable (Fig. 4).

Figure 4: qRT-PCR validation of the differentially expressed genes (DEGs) between NaCl-free (CK) and NaCl-treated (CT) L. mollis. The expression levels of DEGs randomly selected from RNA-Seq data were verified by qRT-PCR analyses
Salt stress generally causes osmotic stress, ion toxicity, oxidative damage and even nutrient imbalance on plants, which adversely affect plant growth and development [24]. To survive salt stress, plants respond and adapt to the saline environment at physiological, biochemical, morphological and developmental levels through regulating massive gene expressions [1,3,4]. In this study, a total number of 7521 DEGs between the control and the salt treatment groups (Fig. 1), involving a wide range of GO categories and KEGG pathways, were obtained. Among them, GO categories and KEGG pathways involved in responses to abiotic stimulus, water deprivation, plant hormone signaling, photosynthesis, secondary product metabolism, lipid metabolism, carbohydrate metabolism and amino acid metabolism were significantly enriched (Figs. 2 and 3). These results reflected the complexity of salt signal transduction and its influence on photosynthesis and metabolism in L. mollis.
Plant responses to salinity stress generally occur in two phases: a rapid response largely due to osmotic stress, and a slower response resulted by the accumulation of Na+ in the shoot [1]. For the DEGs responsive to salt stress in L. mollis, the significantly enriched GO terms were predominantly associated with “response to abiotic stimulus”, “response to water deprivation” and “oxidoreductase activity”, suggesting that L. mollis was subjected to severe osmotic stress and oxidative stress under short-term salt stress (Fig. 2). However, genes related to “response to salt stress” did not exhibit the same enrichment possibly because of the Na+ absorbed by the samples collected (in the first 48 h after salt treatment) did not accumulate to the level that causes serious ion toxicity.
Dehydrins are a kind of hydrophilic proteins belonging to the late embryogenesis abundant protein family. They protect biomacromolecules in plant cells from being damaged during dehydration [30,31]. Once plants are in a state of cellular dehydration, such as osmotic, temperature and salt stresses, dehydrins will accumulate in the growing tissues [32–34]. Aquaporins are a class of water transport proteins belonging to the major intrinsic protein (MIP) family and regulate cell water potential [35]. Thereinto, PIP and TIP are aquaporins located on the plasma membrane and vacuolar membrane, respectively, and they work together to maintain the normal metabolic process and improve the stress tolerance of plants [36]. In this study, four dehydrin genes and five aquaporin genes exhibited up-regulated expression in response to salt stress, indicating that L. mollis changed the membrane permeability to water by regulating aquaporin, and on the other hand, reduced the damage from salt stress by dehydrin to adapt to the saline environment (Table 3).
Cuticular wax is an important hydrophobic structure outside the epidermal cell wall of plants. It can reduce the non-stomatal dissipation of water and enhance the resistance of plants to drought, salt and high temperature [37]. In barley, it was found that leaf wax content and cuticular transpiration were significantly negatively correlated; when leaf wax content increased, cuticular transpiration decreased under salt stress [38]. Similar results were also observed in this study (Figs. 2 and 3). The DEGs related to synthesis of cuticular wax were significantly enriched, suggesting that L. mollis possibly regulates cuticular transpiration by accumulating cuticular wax on leaves to improve the salt tolerance.
In saline environments, excessive Na+ absorbed by roots is transported to the shoots over long distances, and eventually is accumulated in the leaves. High concentrations of Na+ in the cytoplasm of leaves hinder the normal absorption of K+, leading to K+/Na+ imbalance and metabolic disorders [25]. To prevent cytosolic Na+ toxicity and maintain ion homeostasis inside the cell, plants generally exclude Na+ to the apoplast and compartmentalize Na+ into the vacuole by operating the Na+/H+ exchangers (NHXs) [39,40]. The vacuolar membrane Na+/H+ antiporters (NHXs) compartmentalize excess Na+ from the cytoplasmic matrix into the vacuole to reduce the concentration of Na+ in the cytoplasm. This process is energized by the H+-ATPase or H+-pyrophosphorylase located in the vacuolar membrane [5,41]. We found that the transcriptional level of LmNHX2 was significantly increased in response to salt stress, suggesting that it may play an important role in ion compartmentation (Table 4). LmAVP1 exhibited a decreased expression after salt treatment, indicating that LmNHX2 was possibly driven by the proton pumps, other than AVP1, in L. mollis leaf cells (Table 4).
Salt stress can induce plants to produce reactive oxygen species (ROS) [26]. Low concentrations of ROS can act as signal molecules to regulate many biological processes in plants, including plant growth and responses to a variety of stresses [42,43]. However, excessive accumulation of ROS under abiotic stress conditions would result in oxidative stress, including lipid peroxidation in cellular membranes, DNA damage, protein denaturation and impairment of enzymatic activities [42]. To reduce the oxidative damage under high salinity conditions, plants rely on the activation of antioxidant enzymes and nonenzymatic antioxidant metabolites to scavenge excessive ROS [28]. We found that the transcriptional levels of genes encoding peroxidase, thioredoxin, L-ascorbate peroxidase, glutathione-S-transferase and catalase all exhibited a significant altered expression in response to NaCl treatment (Table 5). In addition, the DEGs involved in the biosynthesis of secondary metabolites (including carotenoid and flavonoid) showed significant enrichment (Fig. 3). All these results suggest that these antioxidant enzymes and secondary metabolites may take part in protecting L. mollis from oxidative damage caused by salt stress.
In this study, we sequenced and de novo assembled the transcriptome, and investigated the transcriptomic changes of L. mollis leaves in response to salt stress. A total of 110,323 and 112,846 unigenes were assembled for the NaCl-free (CK) and NaCl-treated (CT) libraries, respectively. 73,414 unigenes were successfully annotated for two libraries, and 7521 DEGs were identified between the CK and CT libraries. Numerous DEGs involved in environmental adaptation, signal pathway, photosynthesis and metabolism were identified. In addition, DEGs related to osmotic stress, ion homeostasis and oxidative stress were also analyzed. Our findings in this study will provide helpful cues for further research on the molecular mechanisms of salt responses in L. mollis.
Author Contributions: Luying Zhu designed the experiments. Wenting Wu, Yajing Zhang, Yu Gaoand Kai Zhang conducted the experiments and analyzed the data. Luying Zhu and Hongxia Zhang wrote the manuscript.
Availability of Data and Materials: The raw sequencing data in this study were deposited at the NCBI Sequence Read Archive (SRA) database (Accession No. SRP109343).
Funding Statement: This work was supported by the National Natural Science Foundation of China (31400226), the Key Research and Development Program of Shandong Province (2019GSF110015), the Project of Shandong Province Higher Educational Science and Technology Program (J14LE07) and the Key Research and Development Program of Yantai, Shandong Province (2018XSCC043).
Conflicts of Interest: The authors declare that they have no conflicts of interest to report regarding the present study.
1. Munns, R., Tester, M. (2008). Mechanisms of salinity tolerance. Annual Review of Plant Biology, 59 (1), 651–681. DOI 10.1146/annurev.arplant.59.032607.092911. [Google Scholar] [CrossRef]
2. Horie, T., Schroeder, J. I. (2004). Sodium transporters in plants. Diverse genes and physiological functions. Plant Physiology, 136(1), 2457–2462. DOI 10.1104/pp.104.046664. [Google Scholar] [CrossRef]
3. Zhang, J. L., Shi, H. Z. (2013). Physiological and molecular mechanisms of plant salt tolerance. Photosynthesis Research, 115(1), 1–22. DOI 10.1007/s11120-013-9813-6. [Google Scholar] [CrossRef]
4. Deinlein, U., Stephan, A. B., Horie, T., Luo, W., Xu, G. et al. (2014). Plant salt-tolerance mechanisms. Trends in Plant Science, 19(6), 371–379. DOI 10.1016/j.tplants.2014.02.001. [Google Scholar] [CrossRef]
5. Zhu, J. K. (2003). Regulation of ion homeostasis under salt stress. Current Opinion in Plant Biology, 6(5), 441–445. DOI 10.1016/s1369-5266(03)00085-2. [Google Scholar] [CrossRef]
6. Zhou, C., Busso, C. A., Yang, Y. G., Zhang, Z., Wang, Z. W. et al. (2017). Effect of mixed salt stress on malondialdehyde, proteins and antioxidant enzymes of Leymus chinensis in three leaf colors. Phyton-International Journal of Experimental Botany, 86(1), 205–213, DOI 10.32604/phyton.2017.86.205. [Google Scholar] [CrossRef]
7. Puranik, S., Jha, S., Srivastava, P. S., Sreenivasulu, N., Prasad, M. (2011). Comparative transcriptome analysis of contrasting foxtail millet cultivars in response to short-term salinity stress. Journal of Plant Physiology, 168(3), 280–287. DOI 10.1016/j.jplph.2010.07.005. [Google Scholar] [CrossRef]
8. Wang, H., Zhang, M., Guo, R., Shi, D., Liu, B. et al. (2012). Effects of salt stress on ion balance and nitrogen metabolism of old and young leaves in rice (Oryza sativa L.). BMC Plant Biology, 12, 194. DOI 10.1186/1471-2229-12-194. [Google Scholar] [CrossRef]
9. Yao, D., Zhang, X., Zhao, X., Liu, C., Wang, C. et al. (2011). Transcriptome analysis reveals salt-stress-regulated biological processes and key pathways in roots of cotton (Gossypium hirsutum L.). Genomics, 98(1), 47–55. DOI 10.1016/j.ygeno.2011.04.007. [Google Scholar] [CrossRef]
10. Çiçek, N., Oukarroum, A., Strasser, R. J., Schansker, G. (2018). Salt stress effects on the photosynthetic electron transport chain in two chickpea lines differing in their salt stress tolerance. Photosynthesis Research, 136(9), 291–301. DOI 10.1007/s11120-017-0463-y. [Google Scholar] [CrossRef]
11. Zhang, H., Yang, Z., You, X., Heng, Y., Wang, Y. (2021). The potassium transporter AtKUP12 enhances tolerance to salt stress through the maintenance of the K+/Na+ ratio in Arabidopsis. Phyton-International Journal of Experimental Botany, 90(2), 389–402. DOI 10.32604/phyton.2021.014156. [Google Scholar] [CrossRef]
12. Fan, X., Sha, L. N., Yang, R. W., Zhang, H. Q., Kang, H. Y. et al. (2009). Phylogeny and evolutionary history of Leymus (Triticeae; Poaceae) based on a single copy nuclear gene encoding plastid acetyl-CoA carboxylase. BMC Evolutionary Biology, 9, 247. DOI 10.1186/1471-2148-9-247. [Google Scholar] [CrossRef]
13. McGuire, P. E., Dvorak, J. (1981). High salt-tolerance potential in wheatgrasses. Crop Science, 21(5), 702–705. DOI 10.2135/cropsci1981.0011183x002100050018x. [Google Scholar] [CrossRef]
14. Fatih, A. M. B. (1983). Analysis of the breeding potential of wheat-Agropyron and wheat-Elymus derivatives. Hereditas, 98(2), 287–295. DOI 10.1111/j.1601-5223.1983.tb00607.x. [Google Scholar] [CrossRef]
15. Habora, M. E. E., Eltayeb, A. E., Tsujimoto, H., Tanaka, K. (2012). Identification of osmotic stress-responsive genes from Leymus mollis, a wild relative of wheat (Triticum aestivum L.). Breeding Science, 62, 78–86. DOI 10.1270/jsbbs.62.78. [Google Scholar] [CrossRef]
16. Wang, J., Li, B., Meng, Y., Ma, X., Lai, Y. et al. (2015). Transcriptomic profiling of the salt-stress response in the halophyte Halogeton glomeratus. BMC Genomics, 16, 169. DOI 10.1186/s12864-015-1373-z. [Google Scholar] [CrossRef]
17. Cui, J., Ren, G., Qiao, H., Xiang, X., Huang, L. et al. (2018). Comparative transcriptome analysis of seedling stage of two sorghum cultivars under salt stress. Journal of Plant Growth Regulation, 37(3), 986–998. DOI 10.1007/s00344-018-9796-9. [Google Scholar] [CrossRef]
18. Yuenyong, W., Chinpongpanich, A., Comai, L., Chadchawan, S., Buaboocha, T. (2018). Downstream components of the calmodulin signaling pathway in the rice salt stress response revealed by transcriptome profiling and target identification. BMC Plant Biology, 18, 335. DOI 10.1186/s12870-018-1538-4. [Google Scholar] [CrossRef]
19. Arisha, M. H., Aboelnasr, H., Ahmad, M. Q., Liu, Y., Tang, W. et al. (2020). Transcriptome sequencing and whole genome expression profiling of hexaploid sweetpotato under salt stress. BMC Genomics, 21, 197. DOI 10.1186/s12864-020-6524-1. [Google Scholar] [CrossRef]
20. Zhang, P., Duo, T., Wang, F., Zhang, X., Yang, Z. et al. (2021). De novo transcriptome in roots of switchgrass (Panicum virgatum L.) reveals gene expression dynamic and act network under alkaline salt stress. BMC Genomics, 22, 82. DOI 10.1186/s12864-021-07368-w. [Google Scholar] [CrossRef]
21. Grabherr, M. G., Haas, B. J., Yassour, M., Levin, J. Z., Thompson, D. et al. (2011). Full-length transcriptome assembly from RNA-seq data without a reference genome. Nature Biotechnology, 29(7), 644–652. DOI 10.1038/nbt.1883. [Google Scholar] [CrossRef]
22. Mortazavi, A., Williams, B. A., McCue, K., Schaeffer, L., Wold, B. (2008). Mapping and quantifying mammalia transcriptome by RNA-seq. Nature Methods, 5(7), 621–628. DOI 10.1038/nmeth.1226. [Google Scholar] [CrossRef]
23. Audic, S., Claverie, J. M. (1997). The significance of digital gene expression profiles. Genome Research, 7(10), 986–995. DOI 10.1101/gr.7.10.986. [Google Scholar] [CrossRef]
24. Hasegawa, P. M., Bressan, R. A., Zhu, J. K., Bohnert, H. J. (2000). Plant cellular and molecular responses to high salinity. Annual Review of Plant Physiology and Molecular Biology, 51(1), 463–499. DOI 10.1146/annurev.arplant.51.1.463. [Google Scholar] [CrossRef]
25. Kronzucker, H. J., Coskun, D., Schulze, L. M., Wong, J. R., Britto, D. T. (2013). Sodium as nutrient and toxicant. Plant and Soil, 369(1–2), 1–23. DOI 10.1007/s11104-013-1801-2. [Google Scholar] [CrossRef]
26. Asada, K. (2006). Production and scavenging of reactive oxygen species in chloroplasts and their functions. Plant Physiology, 141(2), 391–396. DOI 10.1104/pp.106.082040. [Google Scholar] [CrossRef]
27. Choudhury, F. K., Rivero, R. M., Blumwald, E., Mittler, R. (2017). Reactive oxygen species, abiotic stress and stress combination. The Plant Journal, 90(5), 856–867. DOI 10.1111/tpj.13299. [Google Scholar] [CrossRef]
28. Hanin, M., Ebel, C., Ngom, M., Laplaze, L., Masmoudi, K. (2016). New insights on plant salt tolerance mechanisms and their potential use for breeding. Frontiers in Plant Science, 7, 1787. DOI 10.3389/fpls.2016.01787. [Google Scholar] [CrossRef]
29. Kao, C. H. (2017). Mechanisms of salt tolerance in rice plants: Reactive oxygen species scavenging-systems. Journal of Taiwan Agricultural Research, 66(1), 1–8. DOI 10.6156/JTAR/2017.06601.01. [Google Scholar] [CrossRef]
30. Brini, F., Saibi, W., Hanin, M., Amara, I., Gargouri, A. et al. (2010). The wheat dehydrin DHN-5 exerts a heat-protective effect on β-glucosidase and glucose oxidase activities. Bioscience Biotechnology and Biochemistry, 74(5), 1050–1054. DOI 10.1271/bbb.90949. [Google Scholar] [CrossRef]
31. Hanin, M., Brini, F., Ebel, C., Toda, Y., Takeda, S. et al. (2011). Plant dehydrins and stress tolerance: Versatile proteins for complex mechanisms. Plant Signaling and Behavior, 6(10), 1503–1509. DOI 10.4161/psb.6.10.17088. [Google Scholar] [CrossRef]
32. Danyluk, J., Perron, A., Houde, M., Limin, A., Fowler, B. et al. (1998). Accumulation of an acidic dehydrin in the vicinity of the plasma membrane during cold acclimation of wheat. Plant Cell, 10(4), 623–638. DOI 10.2307/3870737. [Google Scholar] [CrossRef]
33. Saavedra, L., Svensson, J., Carballo, V., Izmendi, D., Welin, B. et al. (2006). A dehydrin gene in Physcomitrella patens is required for salt and osmotic stress tolerance. The Plant Journal, 45(2), 237–249. DOI 10.1111/j.1365-313x.2005.02603.x. [Google Scholar] [CrossRef]
34. Haimi, P., Vinskienė, J., Stepulaitienė, I., Baniulis, D., Stanienė, G. et al. (2017). Patterns of low temperature induced accumulation of dehydrins in Rosaceae crops-evidence for post-translational modification in apple. Journal of Plant Physiology, 218, 175–181. DOI 10.1016/j.jplph.2017.08.008. [Google Scholar] [CrossRef]
35. Maurel, C., Verdoucq, L., Luu, D. T., Santoni, V. (2008). Plant aquaporins: Membrane channels with multiple integrated functions. Annual Review of Plant Biology, 59(1), 595–562. DOI 10.1146/annurev.arplant.59.032607.092734. [Google Scholar] [CrossRef]
36. Maurel, C., Boursiac, Y., Luu, D. T., Santoni, V., Shahzad, Z. et al. (2015). Aquaporins in plants. Physiological Reviews, 95, 1321–1358. DOI 10.1152/physrev.00008.2015. [Google Scholar] [CrossRef]
37. Carvalho, H. D. R., Heilman, J. L., McInnes, K. J., Rooney, W. L., Lewis, K. L. (2020). Epicuticular wax and its effect on canopy temperature and water use of Sorghum. Agricultural and Forest Meteorology, 284, 107893. DOI 10.1016/j.agrformet.2019.107893. [Google Scholar] [CrossRef]
38. Hasanuzzaman, M., Davies, N. W., Shabala, L., Zhou, M., Brodribb, T. J. et al. (2017). Residual transpiration as a component of salinity stress tolerance mechanism: A case study for barley. BMC Plant Biology, 17(1), 107. DOI 10.1186/s12870-017-1054-y. [Google Scholar] [CrossRef]
39. Ward, J. M., Hirschi, K. D., Sze, H. (2003). Plants pass the salt. Trends in Plant Science, 8(5), 200–201. DOI 10.1016/s1360-1385(03)00059-1. [Google Scholar] [CrossRef]
40. Bassil, E., Blumwald, E. (2014). The ins and outs of intracellular ion homeostasis: NHX-type cation/H+ transporters. Current Opinion in Plant Biology, 22, 1–6. DOI 10.1016/j.pbi.2014.08.002. [Google Scholar] [CrossRef]
41. Maeshima, M. (2001). Tonoplast transporters: Organization and function. Annual Review of Plant Physiology and Plant Molecular Biology, 52, 469–497. DOI 10.1146/annurev.arplant.52.1.469. [Google Scholar] [CrossRef]
42. Apel, K., Hirt, H. (2004). Reactive oxygen species: Metabolism, oxidative stress, and signal transduction. Annual Review of Plant Biology, 55(1), 373–399. DOI 10.1146/annurev.arplant.55.031903.141701. [Google Scholar] [CrossRef]
43. Baxter, A., Mittler, R., Suzuki, N. (2013). ROS as key players in plant stress signaling. Journal of Experimental Botany, 65(5), 1229–1240. DOI 10.1093/jxb/ert375. [Google Scholar] [CrossRef]

 | This work is licensed under a Creative Commons Attribution 4.0 International License, which permits unrestricted use, distribution, and reproduction in any medium, provided the original work is properly cited. |