| Phyton-International Journal of Experimental Botany |
DOI: 10.32604/phyton.2022.019842
ARTICLE
Discovering Candidate Chromosomal Regions Linked to Kernel Size-Related Traits via QTL Mapping and Bulked Sample Analysis in Maize
1College of Agronomy and Biotechnology, Southwest University, Chongqing, 400715, China
2Department of Agronomy, Faculty of Agriculture, Paktia University, Gardiz, 2201, Afghanistan
*Corresponding Authors: Qianlin Xiao. Email: xiaoql1853@swu.edu.cn; Zhizhai Liu. Email: liu003@swu.edu.cn
Received: 19 October 2021; Accepted: 15 December 2021
Abstract: Kernel size-related traits, including kernel length, kernel width, and kernel thickness, are critical components in determining yield and kernel quality in maize (Zea mays L.). Dissecting the phenotypic characteristics of these traits, and discovering the candidate chromosomal regions for these traits, are of potential importance for maize yield and quality improvement. In this study, a total of 139 F2:3 family lines derived from EHel and B73, a distinct line with extremely low ear height (EHel), was used for phenotyping and QTL mapping of three kernel size-related traits, including 10-kernel length (KL), 10-kernel width (KWid), and 10-kernel thickness (KT). The results showed that only one QTL for KWid, i.e., qKWid9 on Chr9, with a phenotypic variation explained (PVE) of 13.4% was detected between SNPs of AX-86298371 and AX-86298372, while no QTLs were detected for KL and KT across all 10 chromosomes. Four bulked groups of family lines, i.e., Groups I to IV, were constructed with F2:3 family lines according to the phenotypic comparisons of KWid between EHel and B73. Among these four groups, Group I possessed a significantly lower KWid than EHel (P = 0.0455), Group II was similar to EHel (P = 0.34), while both Group III and Group IV were statistically higher than EHel (P < 0.05). Besides, except Group IV exhibited a similar KWid to B73 (P = 0.11), KWid of Groups I to III were statistically lower than B73 (P < 0.00). By comparing the bulked genotypes of the four groups to EHel and B73, a stable chromosomal region on Chr9 between SNPs of AX-86298372 to AX-86263154, entirely covered by qKWid9, was identified to link KWid with the positive allele of increasing phenotypic effect to KWid from B73, similar to that of qKWid9. A large amount of enzyme activity and macromolecule binding-related genes were annotated within this chromosomal region, suggesting qKWid9 as a potential QTL for KWid in maize.
Keywords: Maize (Zea mays L.); kernel size-related traits; QTL mapping; bulked sample analysis (BSA)
Maize (Zea mays L.) is a very valuable agricultural crop which plays an important role as food, animal feeding and raw materials of bioenergy worldwide [1]. Food security is influenced directly by maize yield [2]. High grain yield has always been the most significant objective of maize breeding. Most yield traits are quantitatively controlled by multiple genes [3]. Kernel size, a key component determining kernel weight, is one of the most important yield traits, which incorporates kernel length, width, and thickness [4]. Therefore, in maize breeding, the advancement of kernel size is of huge significance [2,5].
At present, the effectual tools for analyzing the genetic structure of complex quantitative traits are quantitative trait loci (QTL) mapping and genome-wide association studies (GWAS) [4]. Since Helentjaris and colleagues issued the first piece of a molecular marker linkage map of maize in 1986 [6], hundreds of QTLs for yield and yield-related traits have been found out on the maize genome through linkage mapping [7]. Our knowledge of the genetic basis of yield and yield-related traits has been developed by these intensifying QTL data. Then, in maize based on constructed genetic maps enhancing QTLs controlling essential agronomic traits were detected by analyzing phenotypic values [1]. These identified QTLs were distributed on all 10 maize chromosomes [2,8]. In a most recent report, 50 QTLs were detected for kernel size traits in the intermated B73 × Mo17 (IBM) Syn10 doubled haploid (DH) population [4], of which eight of them were repetitively identified in at least three environments. Similarly, for single environment analysis and mixed linear model-based composite interval mapping (CIM) for joint analysis, a total of 55 and 28 QTLs for kernel traits were acknowledged by using CIM, respectively, with 270 F2:3 families extracted from the cross between V671 (large kernel) × Mc (small kernel) in five environments [1,9].
Selective genotyping and bulked sergeant analysis are more useful and cost-effective as compared to conventional genetic mapping, which requires analyzing all individuals for the traits of interest in the sampled populations, especially for major genes controlling traits and QTLs with large effects.
Bulked-sergeant analysis can be used for biparental segregating populations as well as for natural populations with the advancement of next-generation sequencing (NGS) technologies [10,11]. Bulked sample analysis (BSA) as a sampling bulking method selects extremes or representative samples from any population and pools them as bulks [10]. Sample selection and size are seriously affected by the power of bulked sample analysis (BSA). Bidirectional selection can be generated with a selected sample when the two tails of a distribution are considered or by single selection when only one tail is evaluated [12]. Bidirectional selection is extensively used and commonly more effective as it avoids the effect of segregation distortion. However, a single selection is more appropriate for traits under a strong negative or lethal selection pressure. Forrest et al. reported that such a rust resistance in wheat [13]. With the advancement of high throughput genotyping platforms, chip-based BSA has been effectively used to detect QTL for traits of agronomic importance: kernel row number in maize [14], and salt tolerance and blast disease in rice [15,16]. BSA becomes increasingly prominent in genetic mapping, due to its depletion in genotyping cost and high detection power, including identifying gene(s) for stripe rust resistance in hexaploid wheat [17], waterlogging tolerant QTL in maize [18], and charcoal rot resistance-related genomic regions in soybean [19].
In the present study, we constructed F2 and F3 populations from the cross between EHel × B73. By integrating the chipset-based genotyping and phenotypic characterization, we intended to 1) identify QTLs for kernel length (KL), width (KWid), and thickness (KT) in maize, and 2) validate the interval of QTLs by the procedure of bulked sample analysis (BSA). The summarized results of the present study would provide both practical guidelines and theoretical references for the improvement of kernel-related traits in maize.
In 2016, the distinct line EHel, derived from the cross of D299 and a Pioneer hybrid, was crossed with pollen collected from the sequencing line B73. EHel exhibited an extremely low ratio of ear to plant height, and smaller kernels than those of B73. F1 of EHel × B73 was self-pollinated to generate F2 seeds in 2017, and then all of 222 F2 individuals were continuously self-pollinated to generate F2:3 population (F3 family lines) in the following year. Finally, a set of 139 F2 ears bearing more than 60 kernels were selected for further phenotyping in the next season.
2.2 Experiment Design and Data Collection
In 2019, parental lines of EHel and B73, and all 139 F3 family lines were planted in the field of the college farm at Xiema (29° 45′39″ N, 106° 23′32″ E, Beibei, Chongqing, China) using a randomized block design with three replications. Each plot contained a single row with 4 m row length and 1 m row spacing. All the materials were bunch-planted within each plot with 10 bunches per row, and thinned to 2 individuals at each bunch. The final planting density was 5 × 10⁴ plants per ha. After harvesting and air-drying all cobson each plot, all kernels were collected from the ears, and they were mixed completely by plot. 10 kernels were randomly selected from the mixed sample of each line for measuring three kernel size-related traits, including length (KL, cm), width (KWid, cm), and thickness (KT, cm) [20]. The average performance and standard deviation (S.D., n = 3) of KL, KWid, and KT were calculated via Microsoft-Excel 365 for further analysis and QTL mapping.
All collected data were input into Microsoft-Excel 365 for chart demonstration. R software (Version 3.6.1) was used for Pearson correlation analysis of KL, KWid, and KT, and for pairwise t-test of parental lines and groups. The characteristics of the phenotypic frequency distribution of KL, KWid, and KT within the F2:3 population were revealed by the Shapiro-Wilk method via R (Version 3.6.1).
Genomic DNA was extracted from the leaf materials of parental lines of EHel and B73, and 139 individuals of F2 by CTAB procedure. All DNA samples were sent to China Golden Marker Biotechnology Co., Ltd. (Beijing, China) for chipset-based genotyping. ∼10000 SNPs integrated into the chipset were used for the fingerprinting of both parental lines and F2 individuals.
2.5 Screening of Polymorphic SNPs and Construction of Linkage Map
After deleting the markers with missing value or heterozygous genotypes at EHel or B73, 8338 SNPs presenting homologous genotypes on both EHel and B73 were selected from all SNPs integrated into the chipset. By comparing the genotypes of EHel and B73 at each selected SNP, only those exhibiting different genotypes were kept. Finally, 2108 polymorphic SNPs were screened out for further analysis. According to the instruction of QTL IciMapping software (Version 4.5.3), the genotype of each F2 individual on 2108 polymorphic SNPs was transferred to 2 (homologous genotype of EHel/EHel), 0 (homologous genotype of B73/B73), 1 (heterozygous genotype of EHel/B73), or −1 (missing). Thereafter, the total dataset was imported into the QTL IciMapping for linkage map construction [21].
2.6 QTL Mapping for Three Kernel Size-Related Traits
The ICIM-ADD model of QTL IciMapping was used to detect QTL for KL, KWid, and KT. QTL for three traits were scanned across the whole genome by both procedures of fixed LOD of 2.5 and permutation. By using permutation, the repeated scanning time was set to 1000, and type I error was set as 0.05. All detected QTL was named as qABi-j, where q means QTL, AB refers to trait abbreviation, i refers to chromosome number (i.e., 1 to 10) and j to QTL serial if there were more than one QTL on the same chromosome. Gene action of detected QTL was determined by the absolute ratio of dominant effect by additive effect [22]. According to the ratio, the gene action of each QTL was identified as additive (A, ratio < 0.2), partial dominance (PD, ratio ranging from 0.21 to 0.80), dominance (D, ratio ranging from 0.81 to 1.20), and over dominance (OD, ratio > 1.21) [22].
2.7 Verification of Candidate Chromosomal Region via Bulked Strategy
In order to verify the candidate chromosomal region for the target trait, a bulked strategy [i.e., bulked sample analysis (BSA)] was used to detect the association of genotype and target trait [10]. By using this bulked strategy, lines that possessed certain phenotypic performance of target trait were selected from the F2:3 population to form four different groups, i.e., Group I to Group IV. Lines within each group were bulked together, to form the bulked genotype of each group. Besides, the average phenotypic performance of each group was calculated across all lines within the corresponding group. The statistical difference of each group vs. EHel or B73 was carried out by a pairwise t-test via R (Version 3.6.1).
2.8 Genomic Annotation of Target Chromosomal Region
The genomic annotation of selected chromosomal areas on Chr 9 was obtained from the maize genome database (https://www.maizegdb.org), and their biological and molecular functions were confirmed. We used the online tool (http://bioinformatics.psb.ugent.be/webtools/Venn/) to do the Venn analysis after obtaining the genes that integrated into the given physical interval.
3.1 Phenotypic Performance of Three Kernel Size-Related Traits
Phenotyping results showed that for both EHel and B73, the average KL in 2018 was significantly lower than that in 2019 (Fig. 1). For EHel, the average KWid in 2018 was significantly higher than that in 2019, while the contrary trend was observed for B73 in the same years (Fig. 1). Different from both KL and KWid, no statistical difference was observed between the average KT for EHel in both 2018 and 2019, while the average KT of B73 in 2018 was significantly lower than that in 2019 (Fig. 1). Between the two parents, EHel possessed a statistically higher KL in 2018 than B73, while a contrary result was observed for KL between EHel and B73 in 2019 (Fig. 1). KWid also presented a similar trend to KL between EHel and B73 in both 2018 and 2019, while no statistical difference was observed for KT between parents in both years (Fig. 1).
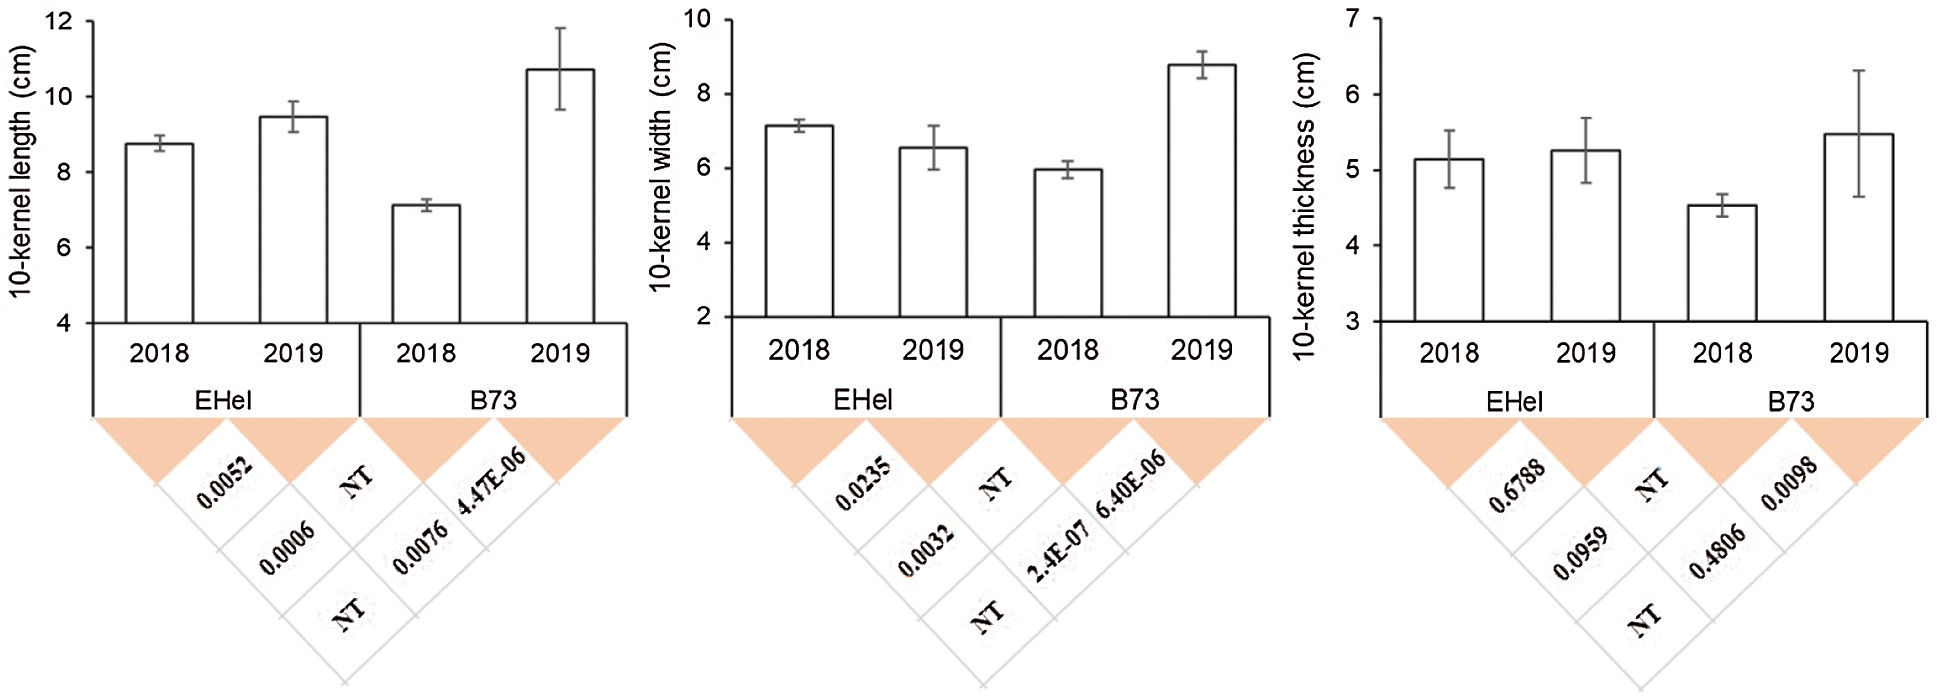
Figure 1: Phenotypic performance of 3 kernel size-related traits on parental lines of EHel and B73
Note: In both years, ears of about 60 individuals of the corresponding parental lines were harvested and the kernels of EHel and B73 were mixed after shelling for the phenotyping of KL, KWid, and KT. NT, not tested.
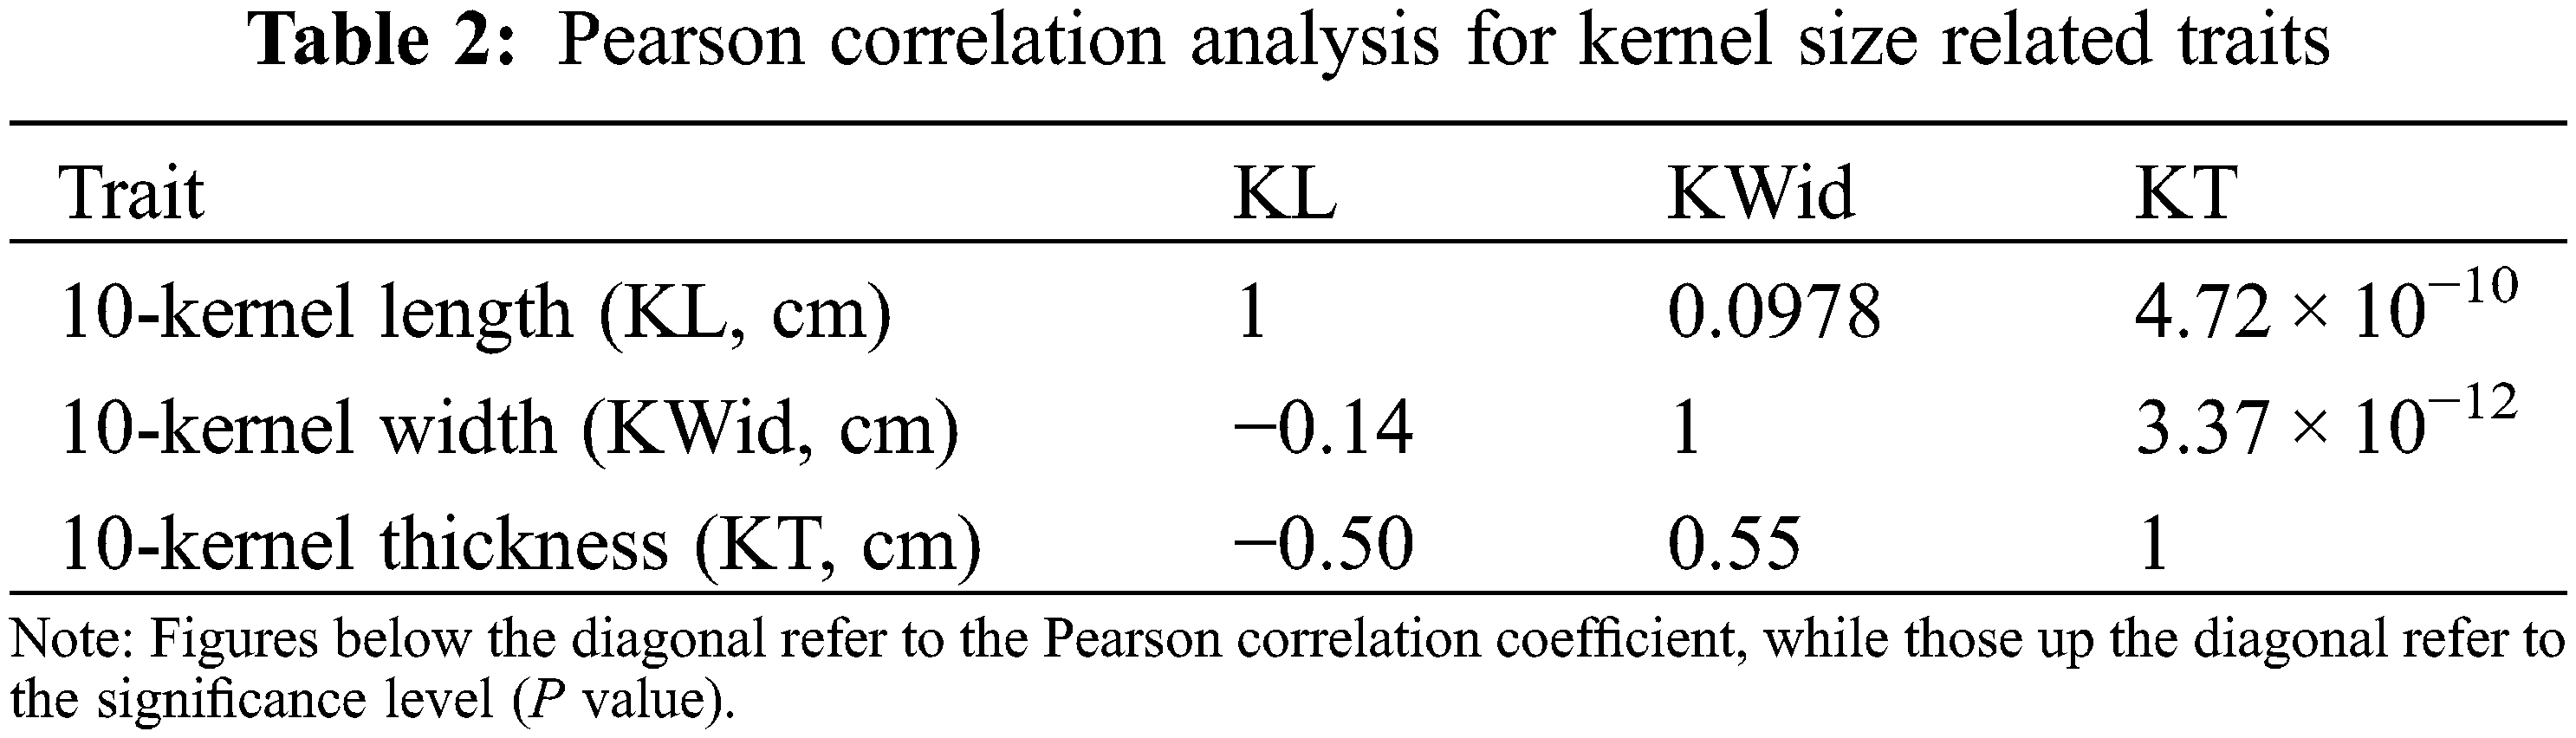
Among 139 lines of the F3 population, the observed 10-kernel length ranged from 7.43 to 12.23 cm, averaging with 10.10 cm, which was equal to the average performance of the parental lines of EHel and B73 at this trait. The observed performances of 10-kernel width and 10-kernel thickness ranged from 5.78 to 8.73 cm and 3.92 to 6.70 cm, respectively, and averaged 7.26 and 5.08 cm, respectively (Table 1).
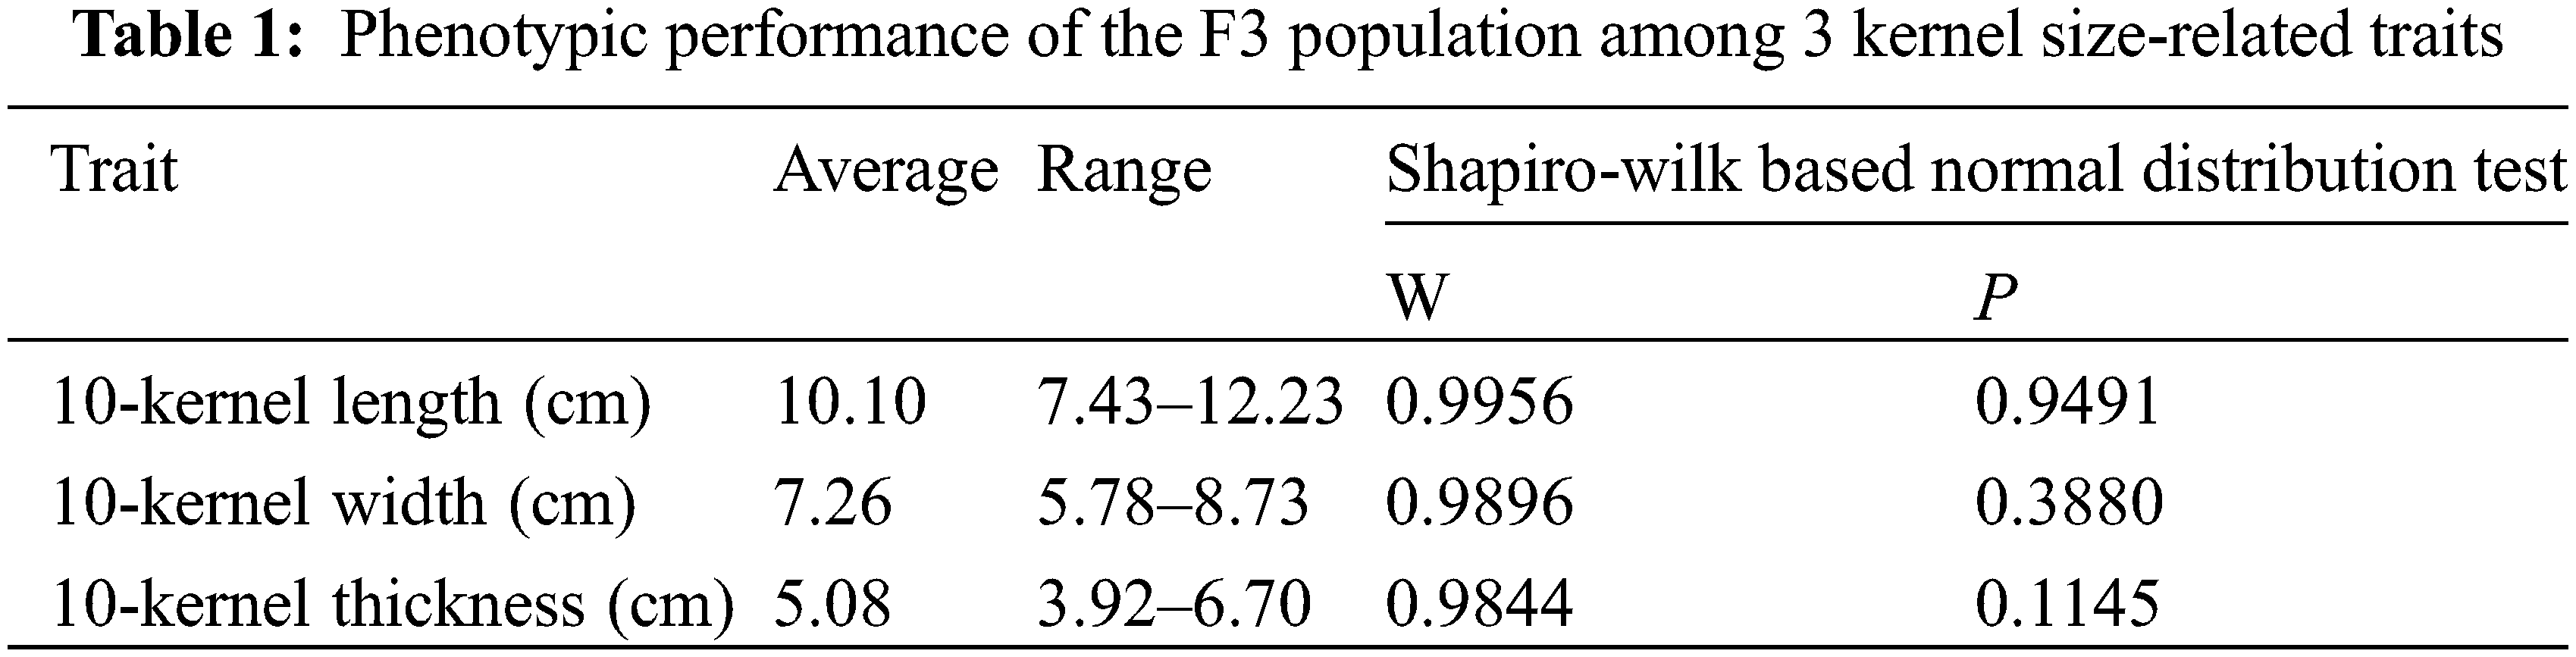
The Shapiro-Wilk method was used to test whether the distribution of these 3 kernel size-related traits within the F3 population matched the normal distribution. By using the Shapiro-Wilk method, P values > 0.05, and lower than W values suggest that the distribution of the dataset matched the normal distribution. Among all 3 kernel size-related traits, similar P < W trends were observed, including 0.9491 (P value for 10-kernel length) vs. 0.9955 (W value for 10-kernel length), 0.3380 vs. 0.9896 (P vs. W for 10-kernel width), and 0.1145 vs. 0.9844 (P vs. W for 10-kernel thickness) (Table 1). These results indicated that the frequency distribution of all the interest kernel size-related traits of the F3 population matched the normal distribution (Fig. 2).
Figure 2: Frequency distribution of 3 kernel size-related traits in the F3 population. (A) 10-kernel length (B) 10-kernel width (C) 10-kernel thickness
3.2 Correlation Analysis of Phenotypic Traits
Pearson correlation analysis showed that 10-kernel length (KL) was negatively correlated with 10-kernel width (KWid) (R = −0.14), while no statistical difference was observed for this correlation coefficient (P = 0.0978) (Table 2). A negative correlation was also detected between KL and 10-kernel thickness (KT) with R = −0.50; the P value for this correlation coefficient was 4.72 × 10⁻¹⁰, suggesting an extremely negative significant correlation between KL and KT (Table 2). The correlation coefficient for KWid vs. KT was 0.55, with a P value of 3.37 × 10⁻¹², indicating an extremely positive significant relationship between this pair of traits in the F3 population (Table 2).
3.3 Construction of Linkage Map
From ∼10,000 SNPs integrated on the chipset, a total of 2108 polymorphism SNPs were screened out between the parental lines EHel and B73. All these 2108 polymorphism SNPs covered the entire maize genome, i.e., 10 chromosomes. Based on all these polymorphism SNPs, software QTL IciMapping (V4.1) was used to construct the linkage map of the segregating population derived from the crossing of EHel and B73.
The results showed that the constructed map included 10 linkage groups, corresponding to 10 chromosomes (Chr) of the maize genome. The total length of the linkage map formed by all these 2108 polymorphism SNPs was 3309.35 cm, ranging from 177.02 cm (Chr10) to 553.40 cm (Chr3). The average length of the map between each pair of SNPs was 1.57 cm, ranging from 1.10 cm (Chr1) to 2.74 cm (Chr5) (Table 3).
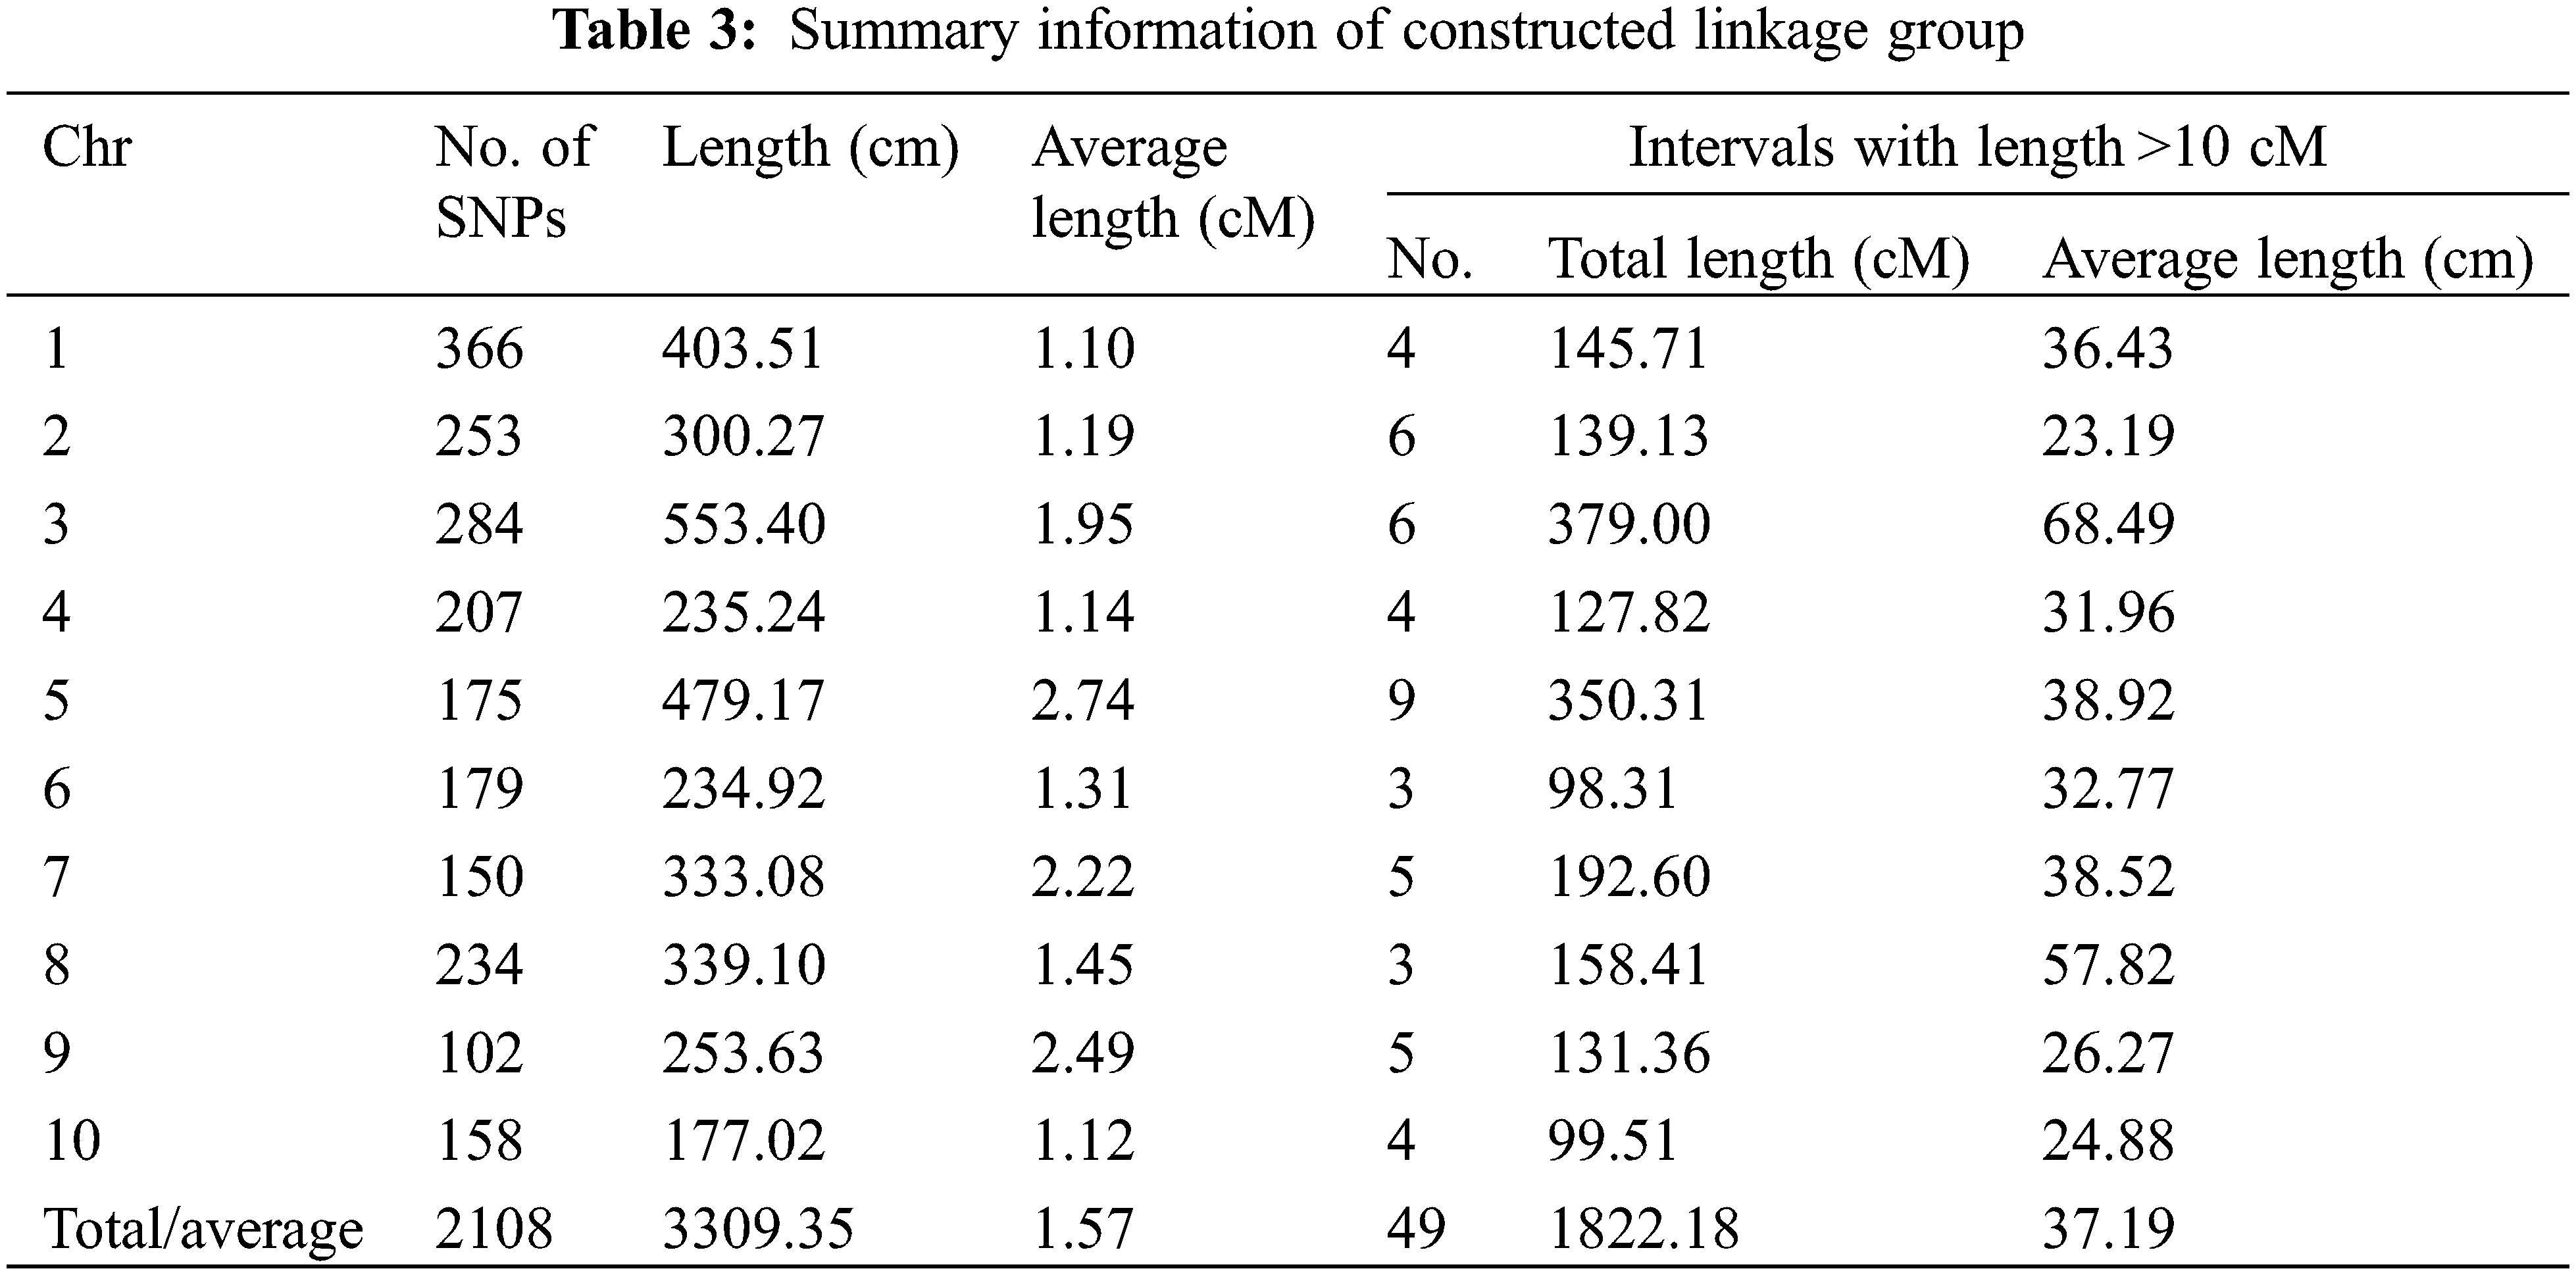
Among these 10 linkage groups or chromosomes, 5 chromosomes (i.e., Chr1, Chr2, Chr3, Chr4, and Chr8) captured more SNPs (>200) than the remaining chromosomes (Table 3). Considering the average interval length of each chromosome, six of them [i.e., Chr1 (1.10 cm), Chr2 (1.19 cm), Chr4 (1.14 cm), Chr6 (1.31 cm), Chr8 (1.45 cm), and Chr10 (1.12 cm)] possessed a shorter average length than the whole genome (1.57 cm), while the remaing 4 chromosomes possessed a larger average length (Table 3).
Though the average length of the map was only 1.57 cm, a total of 49 gaps were observed with >10 cm among the 10 chromosomes (Fig. 3, Table 3). The total length of these 49 gaps was 1822.18 cm, which covered 55.06% of the whole genome (Table 3). The covering ratio of these gaps with >10 cm differed significantly among chromosomes. Chr3 (68.49%) and Chr5 (73.12%) exhibited a higher ratio, while Chr1 (36.14%) possessed the minimum ratio (Table 3). Besides, except 4 chromosomes of Chr1, Chr2, Chr6, and Chr8, all remaing chromosomes exhibited a covering ratio >50% by these gaps (Table 3).
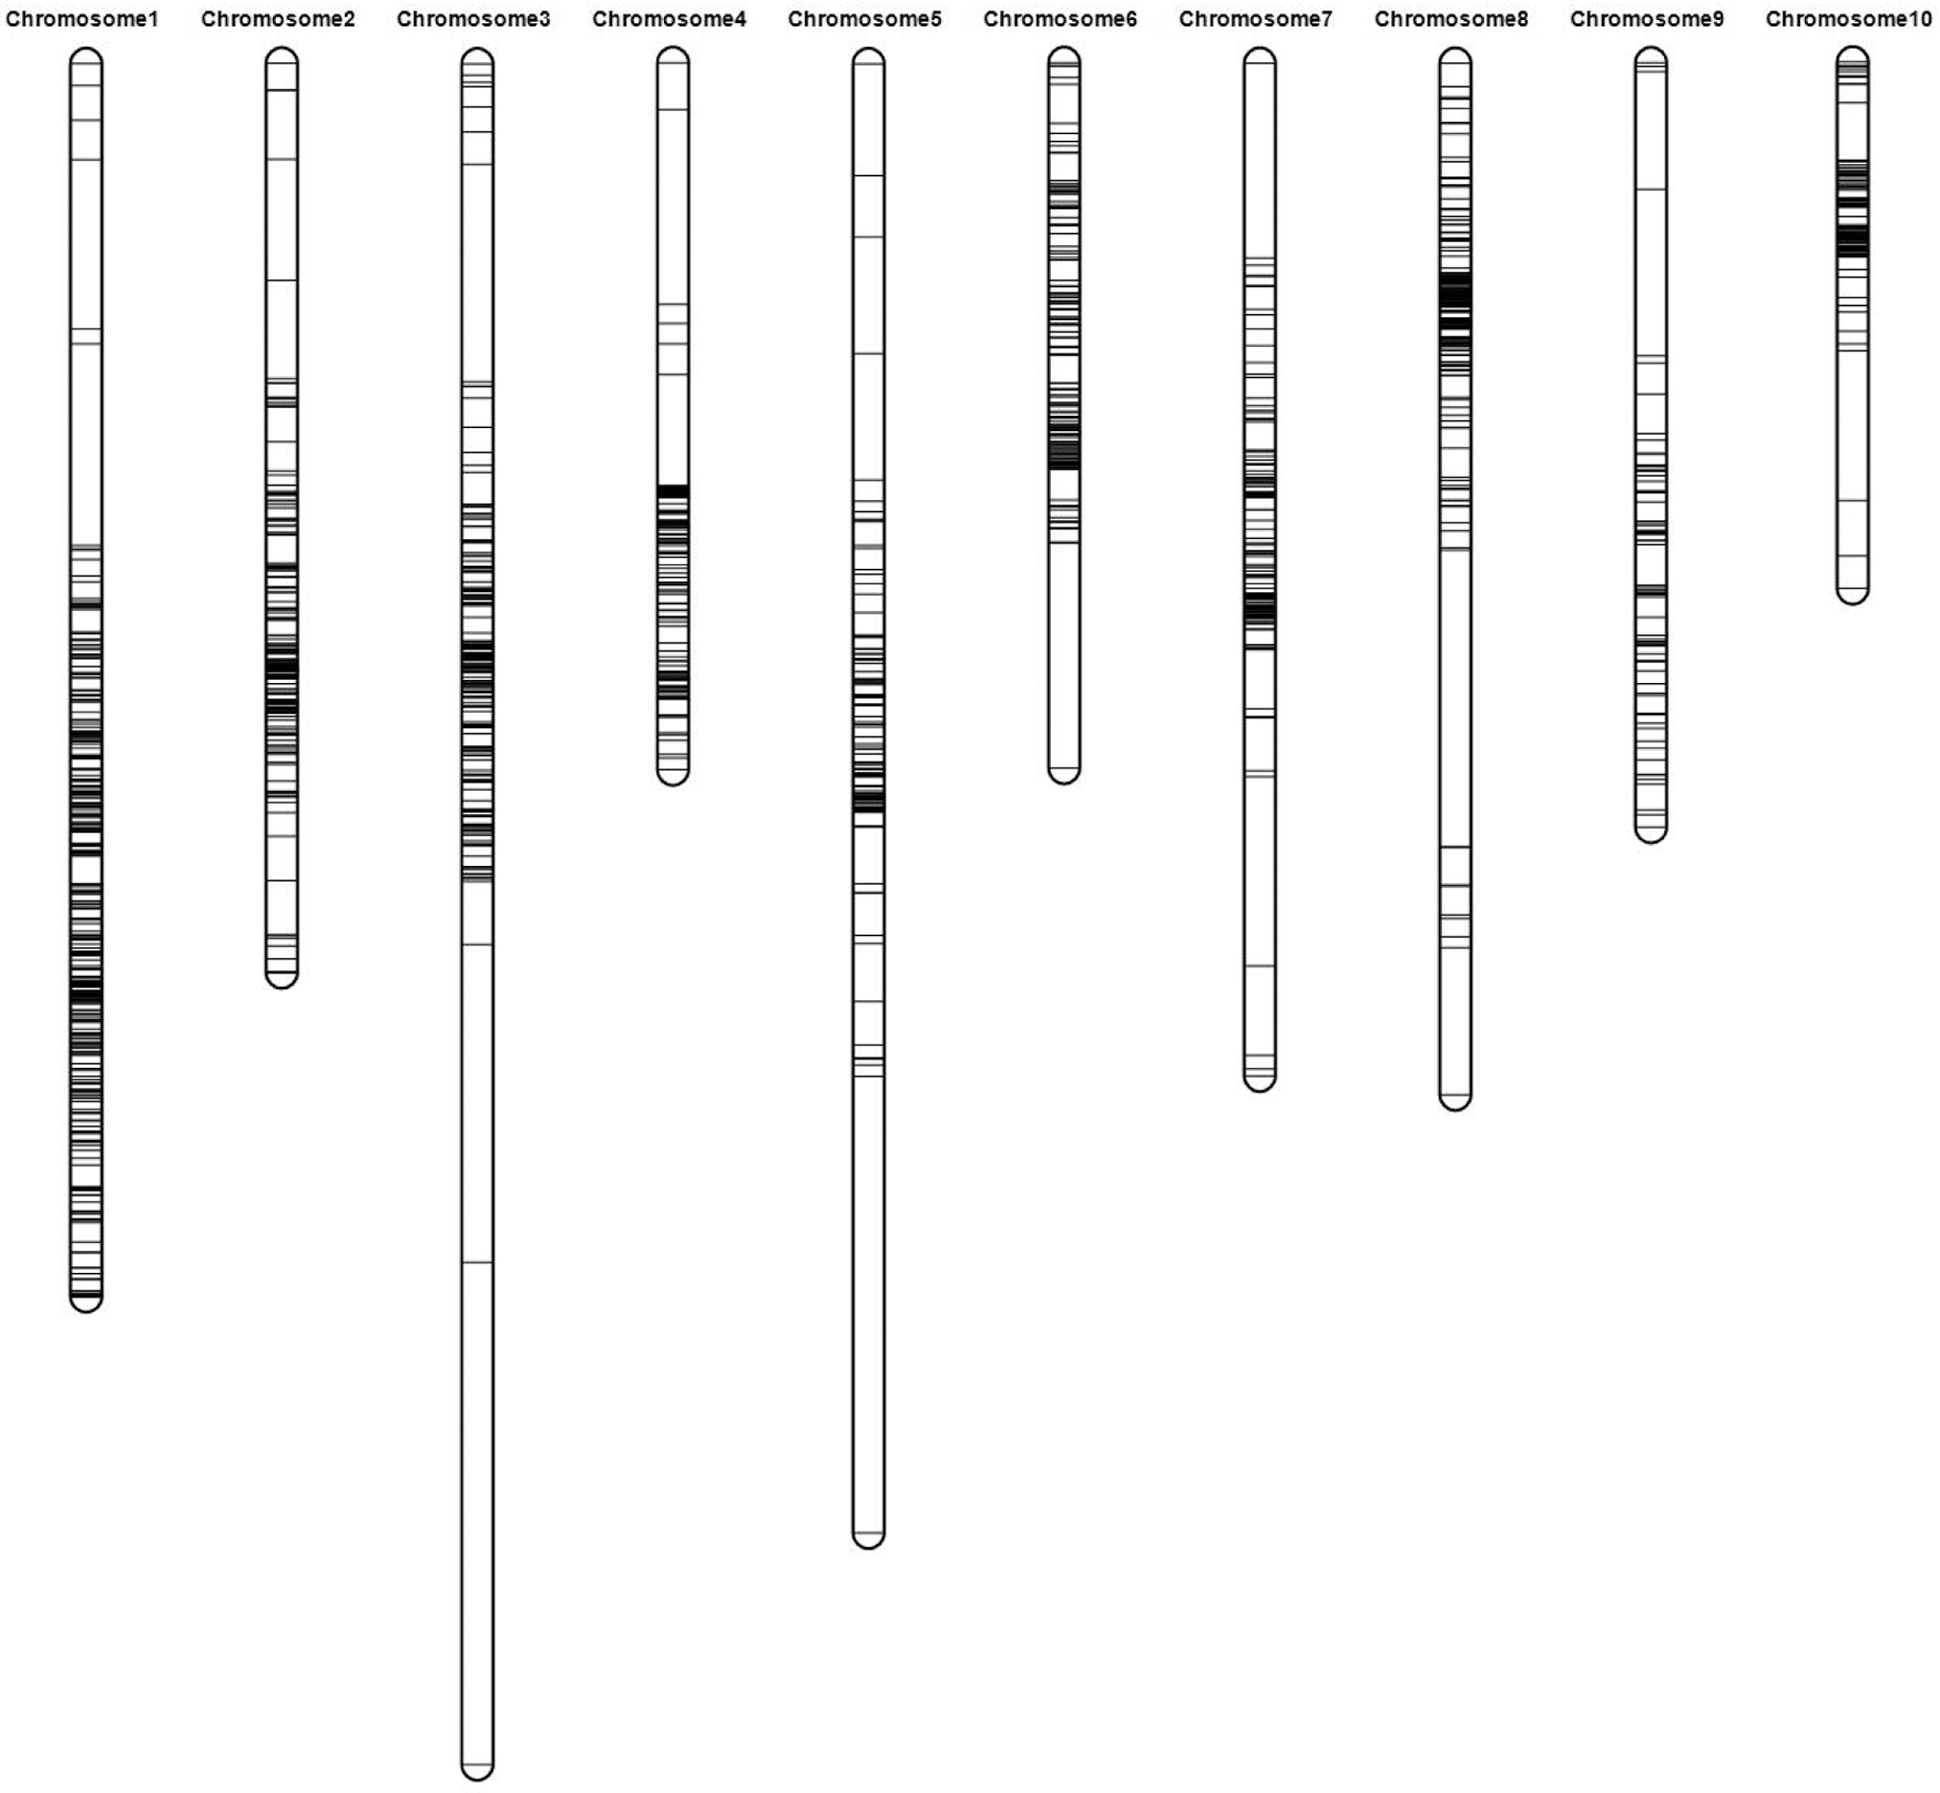
Figure 3: Constructed linkage groups based on 2108 polymorphism SNPs (lines in each bar mean the polymorphism SNPs)
3.4 QTL Mapping for the Target Traits
Two mapping procedures (i.e., fixed LOD of 2.5 and permutation of 1000 times with a Type I error value of 0.05) were used to detect the QTL for KL, KWid, and KT. For both KL and KT, no QTL was detected on all 10 chromosomes via neither permutation with 1000 times nor fixed LOD (Figs. 4A and 4D). For KWid, only one QTL (i.e., qKWid9), was detected on Chr9 by both procedures (Figs. 4B and 4C).
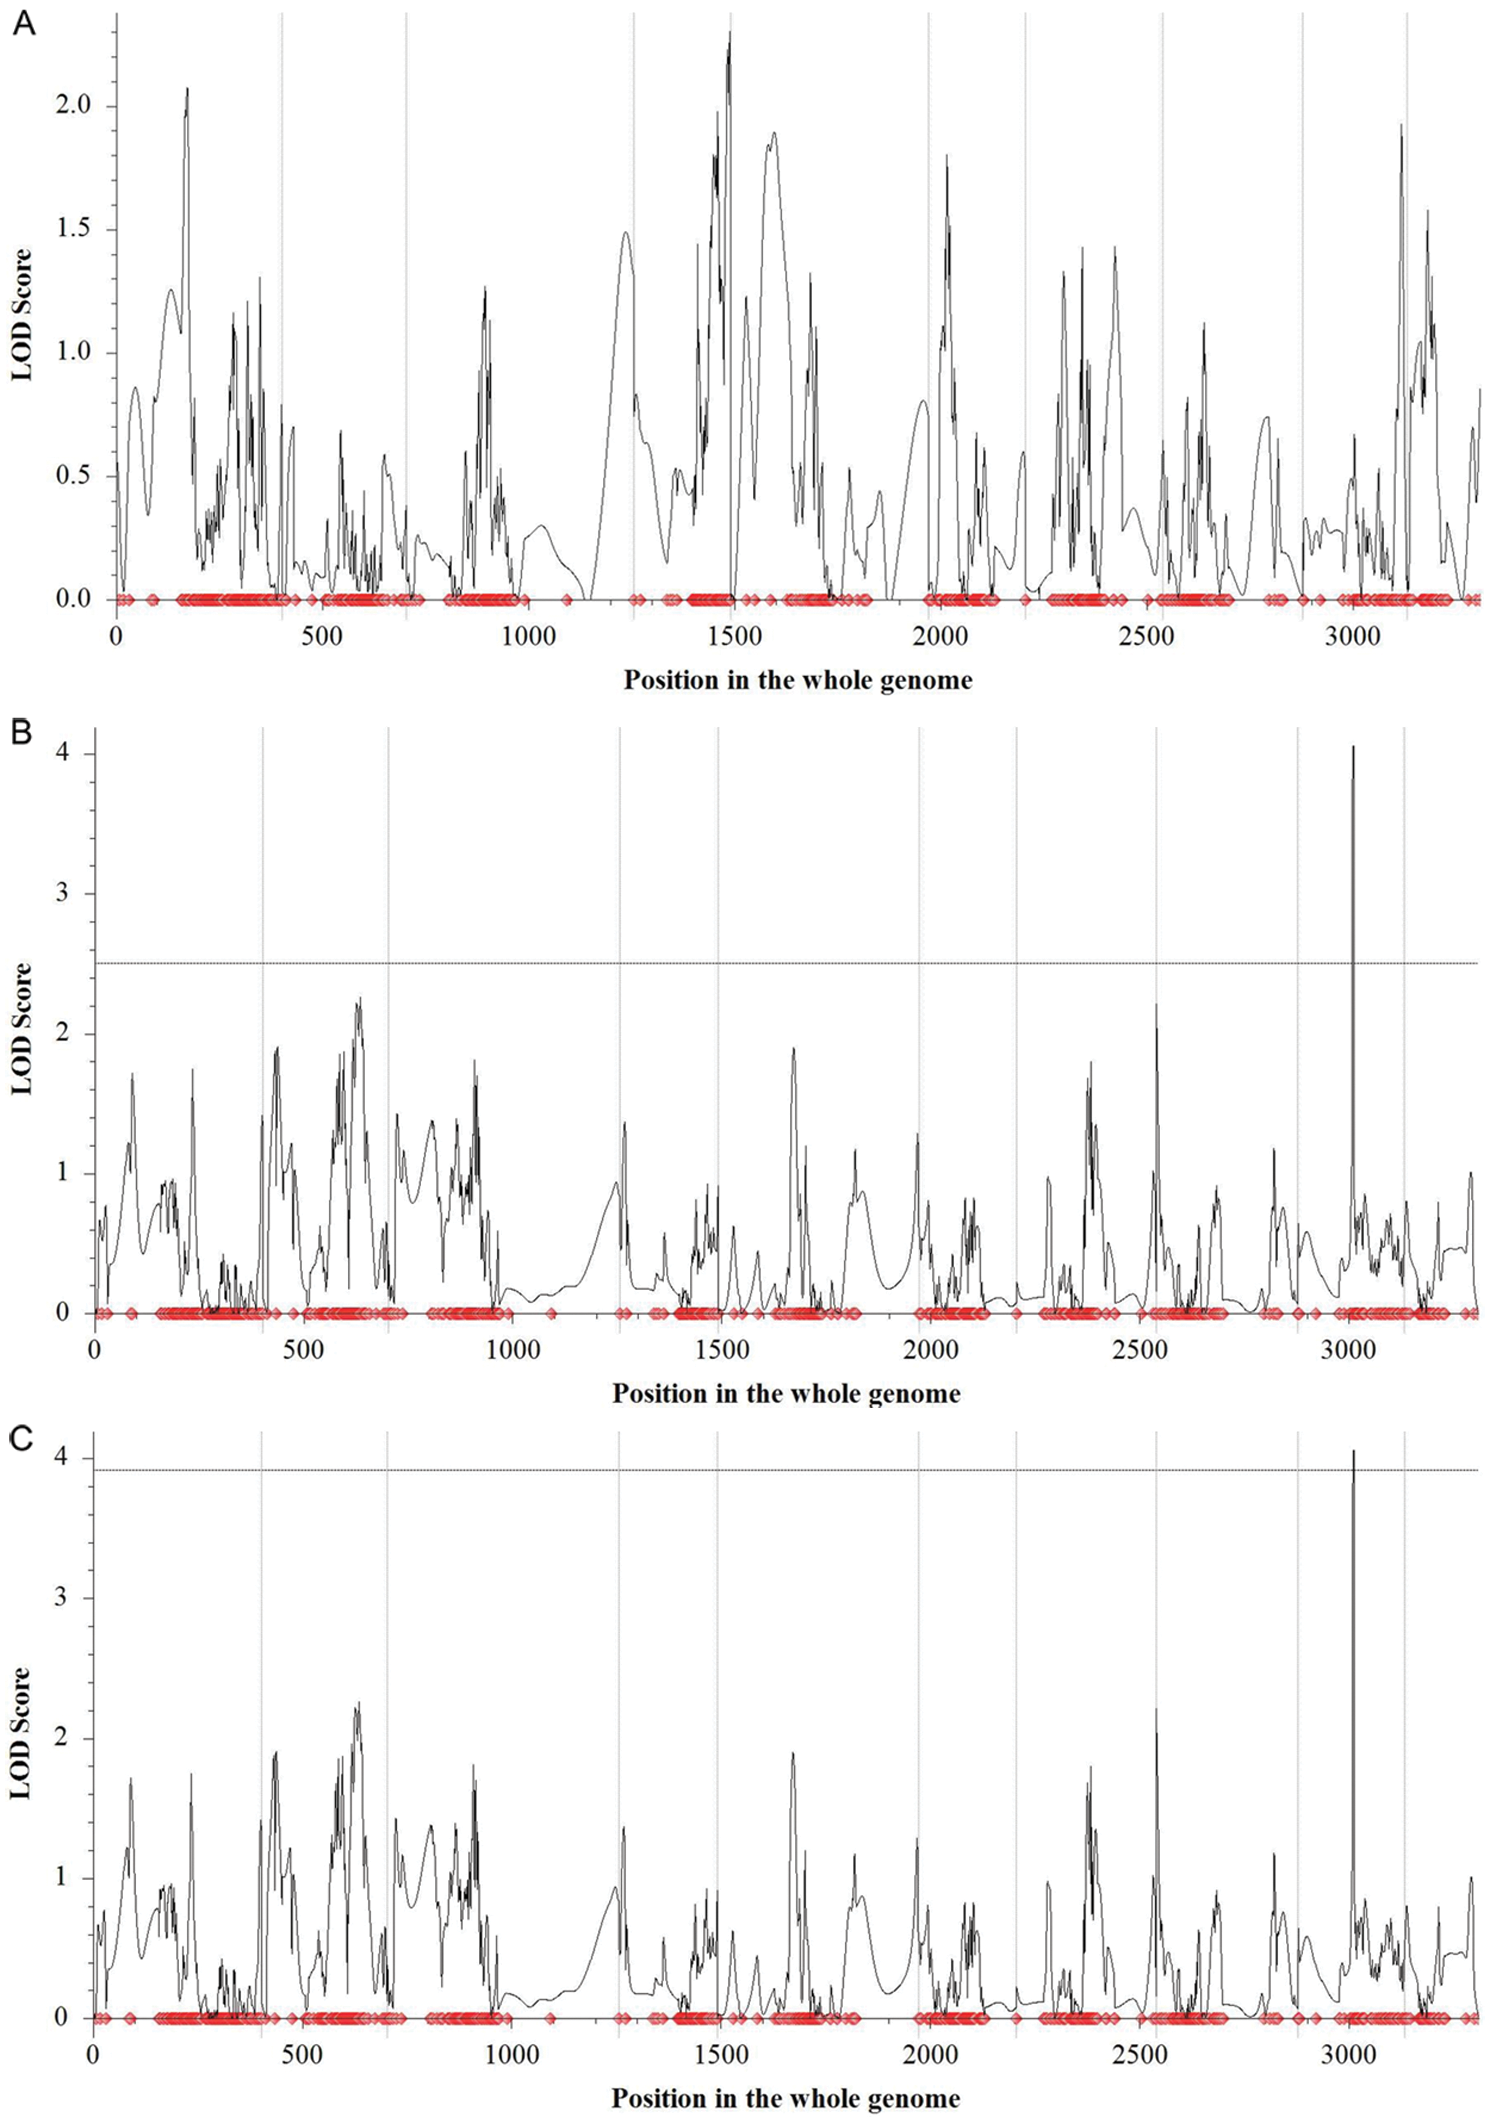
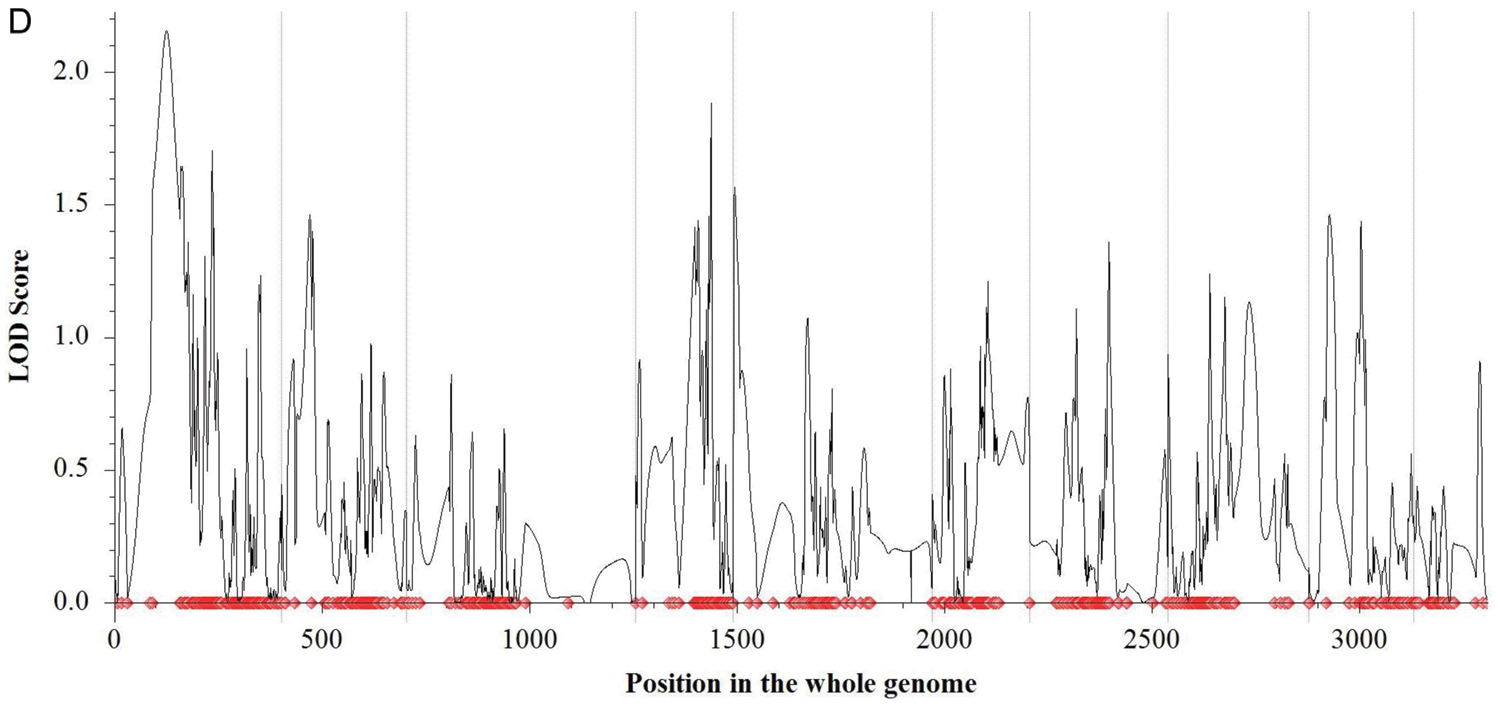
Figure 4: QTL detection for three kernel size-related traits. (A) QTL detection for KL (B) QTL detection for KWid via fixed LOD value of 2.5 (C) QTL detection for KWid via permutation (D) QTL detection for KT. The light grey vertical lines separated the whole genome into ten chromosomes (i.e., Chr1 to Chr10)
qKWid9 located at the position of 133.0 cM on Chr9, with a confidence interval (CI) of 129.5 to 133.5 cM within the marker interval of AX-86268371 and AX-86255482. The phenotypic variance explained (PVE) by qKWid9 was 13.36%, and the positive allele with increasing phenotypic effect to KWid of this QTL was from pollen parent B73. qKWid9 presented the gene action of overdominance (OD) to KWid, suggesting that the genotype at this QTL with a higher frequency of B73/B73 or EHel/B73 tended to increase the phenotypic performance of KWid in maize.
3.5 Primary Verification of Target Chromosomal Region on Chr9 via Bulked Strategy
In order to completely reveal the association of genotype and performance of KWid, 80 family lines were screened from F3, and all these lines were assigned into four different groups (i.e., Group I to Group IV). Group I contained 5 lines, with an average KWid of 6.06 cm, significantly lower than that of EHel (6.56 cm, P = 0.0455) (Fig. 5). Five lines in Group I covered all family lines with statistically lower KWid than that of EHel. Group II and Group III each contained 30 randomly selected lines from F3. The average KWid of Group II was 6.75 cm, with no statistical difference to that of EHel (P = 0.3590, Fig. 5), while that of Group III was 7.15 cm, significantly higher than EHel (P = 0.0168, Fig. 5). Group IV contained all 5 lines with the largest KWid among all family lines of F3, with an average KWid of 8.46 cm, statistically higher than that of EHel (P < 0.00), while no significant difference was observed to B73 (8.78 cm, P = 0.1053) (Fig. 5).
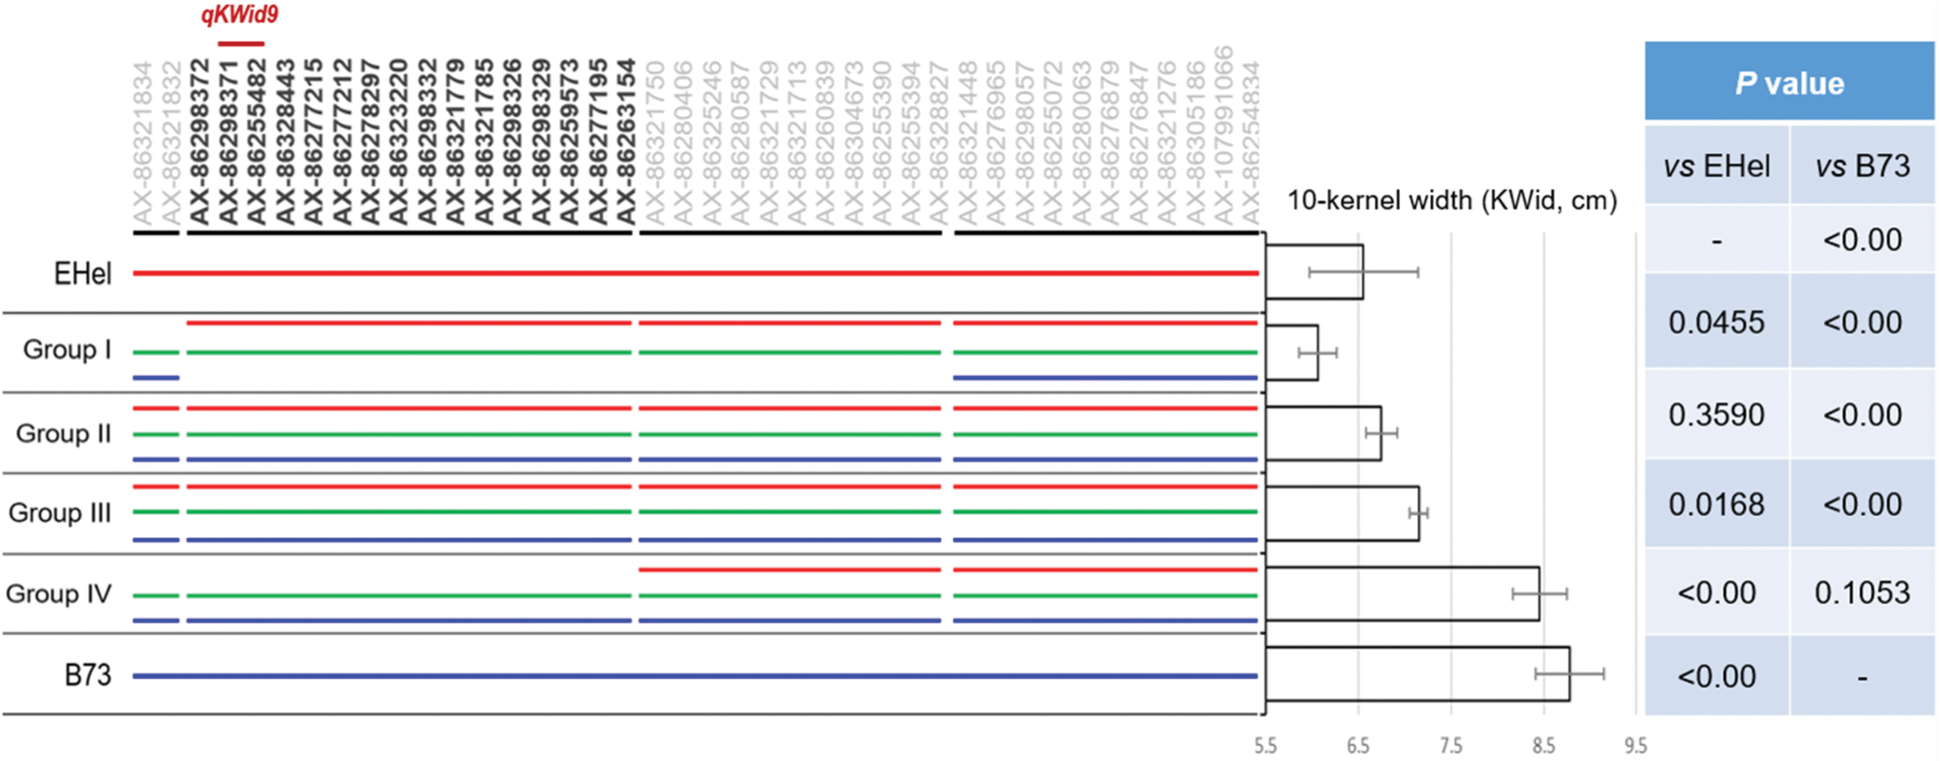
Figure 5: Verification of genotype and phenotype via BSA strategy
Note: In this figure, red and blue lines refer to the homologous genotypes of EHel/EHel and B73/B73, respectively; the green line refers to the heterozygous genotype of EHel/B73. Additionally, SNPs of S1, S3, and S4 were labeled in light gray, while those of S2 were labeled in heavy dark.
Genotypes of all individuals of each group were bulked to represent the genotypes of the corresponding groups. From SNPs of AX-86321834 to AX-86254834 on Chr9, a trending association between genotype and KWid was observed as the Group’s KWid changed. According to the comparison of genotype and KWid performance, the segment formed by these 40 SNPs of AX-86321834 to AX-86254834 could be divided into four sections [i.e., Section1 (S1) to Section4 (S4)] (Fig. 5). S1 covered the first 2 SNPs, S2 covered the following 16 SNPs, S3 covered the following 11 SNPs after S2, and S4 covered the remaining 11 SNPs (Fig. 5).
Along the chromosomal segments of S1 to S4, Group I and Group IV shared the same bulked genotypes (EHel/B37 and B73/B73) within both S1 and S4, while, Group II and Group III exhibited the same bulked genotypes (EHel/EHel, EHel/B73, and B73/B73) among all four segments of S1 to S4 (Fig. 5). At S2, Group I with the lowest KWid only presented the bulked genotypes of EHel/EHel and EHel/B73, without the homologous of B73/B73, differing from the rest 3 groups with a statistically higher performance of KWid. For Group IV with the highest KWid, all lines within this group only presented genotypes of EHel/B73 and B73/B73, without the homologous genotype of EHel/EHel (Fig. 5). Besides, at S3, the homologous genotype of EHel/EHel appeared in Group IV, while lines of Group I still absented the genotype of B73/B73 (Fig. 5).
Combining the analyzed results of bulked genotypes and KWid performance of four groups via bulked strategy, we can speculate that S2 and S3 should serve as the candidate chromosomal regions for KWid. Considering the QTL mapping result, qKWid9 located between SNPs of AX-86298371 and AX-86255482. This interval just located at the left end of S2. The consistency between QTL mapping and bulked strategy confirmed the qKWid9 for the performance of KWid in maize.
3.6 Genomic Annotation of Target Chromosomal Region on Chr9
According to the reference genome of B73, the physical interval of AX-86298371 and AX-86255482 covered 1.268 Mb on Chr9. A total of 195 genes were annotated within this region of 1.268 Mb (Supplementary Table). Among these genes, 52.3% (102 genes) were annotated to participate in biological progresses, 54.9% (107 genes) were annotated with different molecular functions, and 90 genes (46.2%) were annotated to present both biological processes and molecular functions (Fig. 6A).
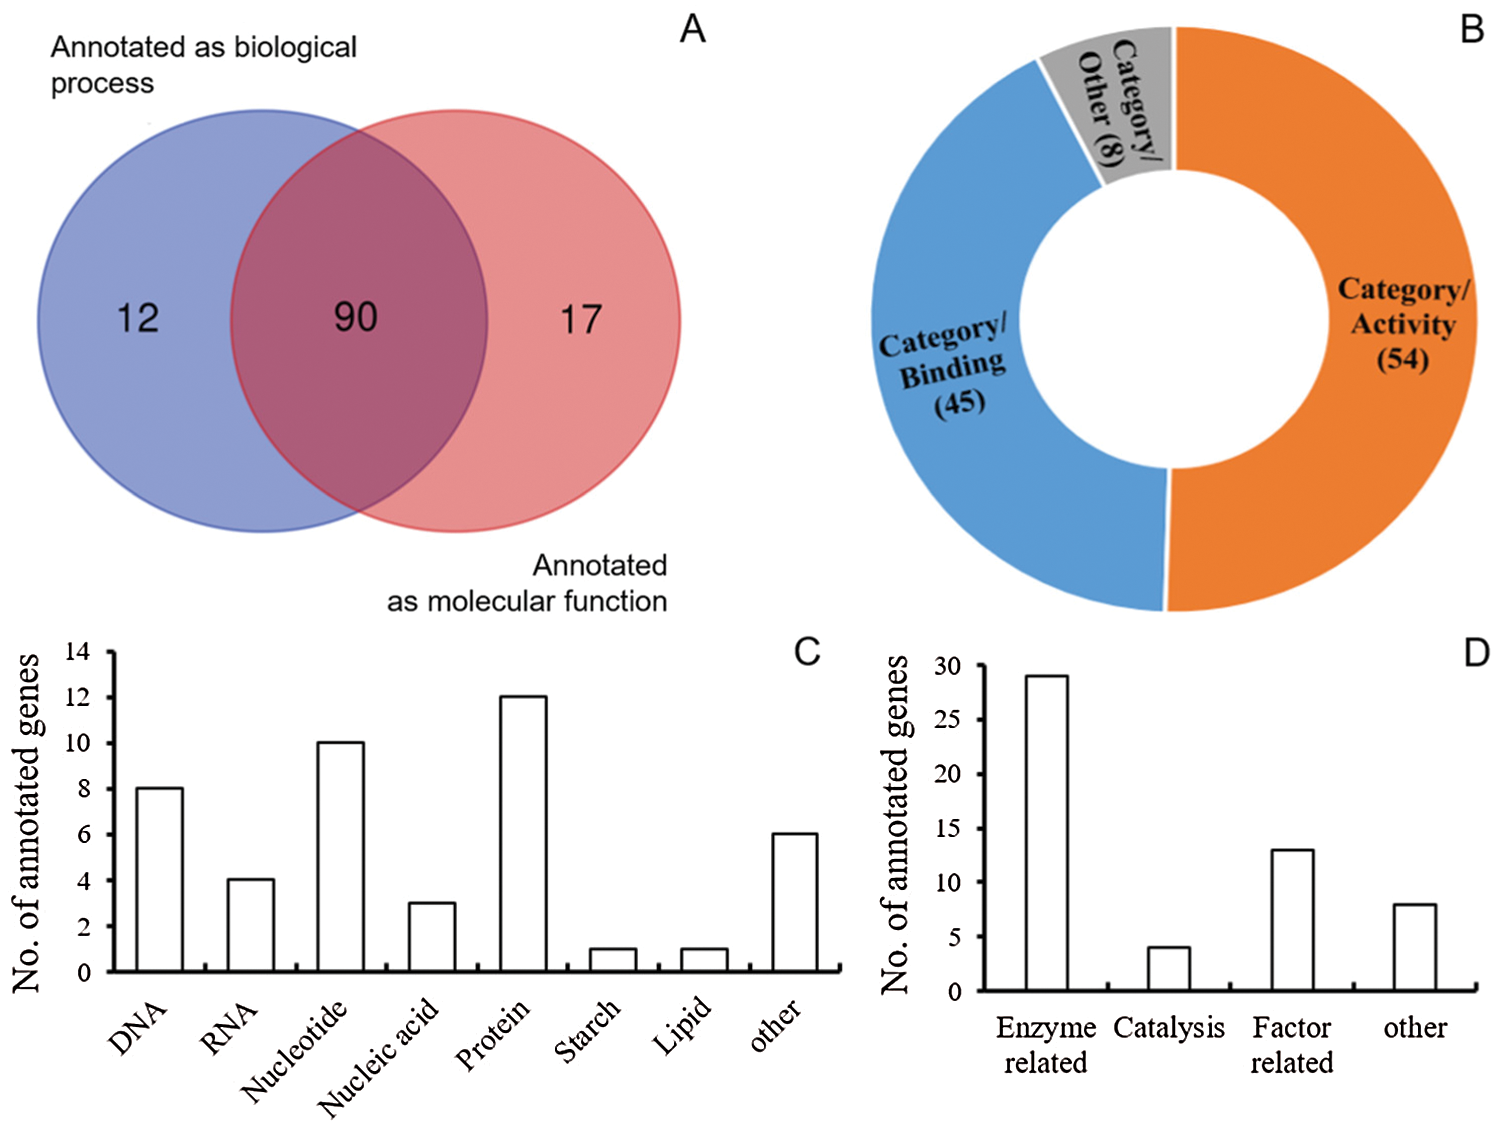
Figure 6: Summary of annotated genes. (A) Venn analysis of annotated genes (B) Category analysis of molecular functions among annotated genes (figures in brackets refer to the number of genes) (C) Number of annotated genes belong to the binding-related category (D) Number of annotated genes belong to the activity-related category
Among the biological processes, the protein-related process covered the most annotated genes, i.e., 24 genes were annotated to involve the protein phosphorylation, dephosphorylation, ubiquitin-dependent catabolism, and protein transport (Supplementary Table). In addition, quite a few annotated genes were presented in the processes of ribosomal small subunit assembly, translation, transcription, lipid/fatty biosynthesis, starch/carbohydrate pathway, auxin signaling pathway, and so on (Supplementary Table).
For 107 genes with certain molecular functions, 45 (42.1%) were annotated with function of binding, i.e., DNA/RNA/nucleic acid/nucleotide binding, and some other macromolecules of protein, starch, lipid, and so on (Figs. 6B and 6C). 54 (50.5%) were annotated with the function of activity, i.e., different kinds of enzyme activity, and activity of factors including transporter, inhibiter, symporter, receptor, and so on (Figs. 6B and 6C, Supplementary Table). All 8 genes gathered in the category of other were annotated to function as structural constituents: 7 were the structural constituent of ribosome, and 1 was the structural constituent of cytoskeleton (Figs. 6B and 6D, Supplementary Table).
Higher yield performance and better kernel quality are the consistent goals for breeders, and most of scientific researchers in maize (Zea mays L.). Maize kernel-related traits, including kernel length, kernel width, and kernel thickness, are critical components in determining the final performance of yield and kernel quality [4,20,23–27]. Numerous reports focused on these traits were documented, including phenotypic and genetic dissection and QTL mapping [2,4,8,24]. Some candidate genes for the detected major QTL were even functional characterized, including the most recently documented ZmPORB2, promoting the accumulation of tocopherol in maize kernels, and qKW9 affecting kernel weight and size in maize [28,29].
Under different backgrounds (i.e., maize-maize, maize-teosinte), statistical positive correlations were observed between kernel length and kernel width in maize [2,8,30]. In the present study, however, only a weak correlation was observed between kernel length and kernel width within the F2:3 population derived from the cross of EHel and B73 (r = −0.14, P = 0.0978, Table 2). A statistical positive correlation was shown between kernel width and kernel thickness in the present study (r = 0.55, P < 0.00, Table 2). The same results were observed in the population derived from a four-way cross population [2], and another F2:3 population derived from the cross of lines Ye478 and Huangzaosi [8]. These results suggested that the maize kernel-related traits, i.e., KL, KWid, and KT, presented a crossed correlation between each other. By considering the candidate gene(s) discovered for kernel-related traits, numerous QTL were discovered across the whole genome of maize [31,32]. In the database of maize genome (https://www.maizegdb.org), 28 QTLs for kernel size-related traits of kernel length (qklen, 25 QTLs) and kernel thickness (qkthick, 3 QTLs) were documented.
In a comparison analysis focusing on traits of kernel size and weight between maize and rice, Liu and colleagues identified a total of 373 QTLs for 100-kernel weight (HKW), kernel length (KL), kernel width (KWid), kernel thickness (KT), and kernel test weight (KTW) among 10 populations formed by 10 sets of recombinant inbred lines (RILs) [33]. Among these QTLs, 57.37% (214) controlled three size-related traits: KL (61 QTLs), KW (64 QTLs), and KT (89 QTLs) [33]. Among all 10 chromosomes, Ch1 and Chr9 captured most of the QTLs for three kernel size-related traits in maize, while different from Chr1, most of the QTLs on Chr9 (63.33%) controlled the phenotypic performance of KW [33]. Besides, the number of QTLs for KW ranged from 2 (DE3× BY815) to 13 (YU87-1× BK) among the 10 RIL populations, exhibiting characteristics of background-specific [33].
For KWid in the present study, only one QTL, i.e., qKWid9, was identified on a short arm of Chr9 via fixed LOD (Fig. 4B). The QTL interval of qKWid9 was confirmed by the procedure of bulked sample analysis (BSA) (Fig. 5). On the same chromosome, Qin and colleagues also discovered a QTL for KW, with LOD and PVE of 3.45 and 8.03%, respectively [32], similar to the present results. Among 19 QTL for KW on Chr9 by Liu et al. [33], more than half located on the short arm of Chr9, with a PVE (or R2) ∼16%. In summary, these results suggested that the short arm of Chr9 might present critical chromosomal regions controlling the final performance of maize kernels.
In addition, on a short arm of Chr9, Peng et al. detected a QTL for grain yield per plant (GYPP) via both conditioned and unconditioned mapping procedures [34]. Besides, some QTLs for the other traits (i.e., grain yield and kernel volume, weight, and length) were also reported to locate on the short arm of Chr9 [8,35–37].
A total of 195 genes were annotated within the selected region, according to Genome Annotation. 102 genes were found to be involved in biological processes, 107 genes were found to have various molecular functions, and 90 genes were found to be involved in both biological processes and molecular functions. These genes mainly involved in protein phosphorylation, dephosphorylation, ubiquitin-dependent catabolism, and protein transport, and few were involved in processes of ribosomal small subunit assembly, translation, transcription, lipid/fatty biosynthesis, starch/carbohydrate pathway, and auxin signaling pathway. Zm00001d048301, an ortholog gene of E3 ubiquitin ligase BIG BROTHER in Arabidopsis is thought to have a role in organ size determination [38]. As a result, organ size determination suggested that it might play a function in kernel formation. Both genes Zm00001d048332 and Zm00001d048320 belong to the pentatricopeptide repeat gene family, which plays a key role in kernel development [39]. The glutathione S-transferase (GST) family is represented by the Zm00001d048354 gene. The greater expression of GST genes in small-seeded cultivars during seed maturation stages revealed that they play an essential role in seed development and seed size determination in chickpea [40], and so proposed their role in kernel width determination.
Further studies focused on qKWid9, and even the short arm of Chr9, might provide potential informative references for the functional characterization of candidate gene(s) for kernel width in maize. They may also provide information on the crossed correlations among this and other traits as well, resulting in more alternative probabilities for the improvement of the final performance of both yield and quality in maize.
By integrating the chipset-based genotyping and phenotypic characterization, a major QTL, i.e., qKWid9, on Chr9 with PVE of 13.36% was identified to respond to the phenotypic performance of kernel width in maize. qKWid9 possessed additive alleles from the pollen parent of B73, acting as the OD to the phenotypic performance of KWid. The marker interval of qKWid9 was also confirmed by the BSA (bulked sample analysis) procedure for marker-trait association, suggesting a candidate chromosomal region for controlling the performance of kernel width in maize.
Acknowledgement: Gul H, Qian M, and Arabzai MG performed the experiment, Gul H, Arabzai MG, Xiao Q, and Liu Z drafted the manuscript; Gul H, Qian M, and Arabzai MG analyzed the data; Huang T, Ma Q, Xing F, Cao W, Liu T, Duan H participated in the phenotypic characterization and data collection; Xiao Q and Liu Z provided ideas, designed the research, and edited the manuscript.
Funding Statement: This work was supported by the Natural Science Foundation of Chongqing (cstc2021jcyj-msxmX0583), Maize Germplasm Resources Protection Project, and Fundamental Research Funds for the Central Universities of Southwest University (SWU118087, XDJK2017C031, XDJK2017D072).
Conflicts of Interest: The authors declare that they have no conflicts of interest to report regarding the current study.
1. Wang, G., Zhao, Y., Mao, W., Ma, X., Su, C. (2020). QTL analysis and fine mapping of a major QTL conferring kernel size in maize (Zea mays). Frontiers in Genetics, 11, 603920. DOI 10.3389/fgene.2020.603920. [Google Scholar] [CrossRef]
2. Chen, L., Li, Y. X., Li, C., Wu, X., Qin, W. et al. (2016). Fine-mapping of qGW4. 05, a major QTL for kernel weight and size in maize. BMC Plant Biology, 16(1), 1–13. DOI 10.1186/s12870-016-0768-6. [Google Scholar] [CrossRef]
3. Zhao, Y., Su, C. (2019). Mapping quantitative trait loci for yield-related traits and predicting candidate genes for grain weight in maize. Scientific Reports, 9(1), 1–10. DOI 10.1038/s41598-019-52222-5. [Google Scholar] [CrossRef]
4. Liu, M., Tan, X., Yang, Y., Liu, P., Zhang, X. et al. (2020). Analysis of the genetic architecture of maize kernel size traits by combined linkage and association mapping. Plant Biotechnology Journal, 18(1), 207–221. DOI 10.1111/pbi.13188. [Google Scholar] [CrossRef]
5. Nzuve, F., Githiri, S., Mukunya, D., Gethi, J. (2014). Genetic variability and correlation studies of grain yield and related agronomic traits in maize. Journal of Agricultural Science, 6(9), 166–176. DOI 10.5539/jas.v6n9p166. [Google Scholar] [CrossRef]
6. Helentjaris, T., Slocum, M., Wright, S., Schaefer, A., Nienhuis, J. (1986). Construction of genetic linkage maps in maize and tomato using restriction fragment length polymorphisms. Theoretical and Applied Genetics, 72(6), 761–769. DOI 10.1007/bf00266542. [Google Scholar] [CrossRef]
7. Huo, D., Ning, Q., Shen, X., Liu, L., Zhang, Z. (2016). QTL mapping of kernel number-related traits and validation of one major QTL for Ear length in maize. PLoS One, 11(5), e0155506. DOI 10.1371/journal.pone.0155506. [Google Scholar] [CrossRef]
8. Peng, B., Li, Y., Wang, Y., Liu, C., Liu, Z. et al. (2011). QTL analysis for yield components and kernel-related traits in maize across multi-environments. Theoretical and Applied Genetics, 122(7), 1305–1320. DOI 10.1007/s00122-011-1532-9. [Google Scholar] [CrossRef]
9. Liu, Y., Wang, L., Sun, C., Zhang, Z., Zheng, Y. et al. (2014). Genetic analysis and major QTL detection for maize kernel size and weight in multi environments. Theoretical and Applied Genetics, 127(5), 1019–1037. DOI 10.1007/s00122-014-2276-0. [Google Scholar] [CrossRef]
10. Zou, C., Wang, P., Xu, Y. (2016). Bulked sample analysis in genetics, genomics and crop improvement. Plant Biotechnology Journal, 14(10), 1941–1955. DOI 10.1111/pbi.12559. [Google Scholar] [CrossRef]
11. Itoh, N., Segawa, T., Tamiru, M., Abe, A., Sakamoto, S. et al. (2019). Next-generation sequencing-based bulked segregant analysis for QTL mapping in the heterozygous species Brassica rapa. Theoretical and Applied Genetics, 132, 2913–2925. DOI 10.1007/s00122-019-03396-z. [Google Scholar] [CrossRef]
12. Sun, Y., Wang, J., Crouch, J. H., Xu, Y. (2010). Efficiency of selective genotyping for genetic analysis of complex traits and potential applications in crop improvement. Molecular Breeding, 26, 493–511. DOI 10.1007/s11032-010-9390-8. [Google Scholar] [CrossRef]
13. Forrest, K., Pujol, V., Bulli, P., Pumphrey, M., Wellings, C. et al. (2014). Development of a SNP marker assay for the Lr67 gene of wheat using a genotyping by sequencing approach. Molecular Breeding, 34, 2109–2118. DOI 10.1007/s11032-014-0166-4. [Google Scholar] [CrossRef]
14. Yang, J., Jiang, H., Yeh, C., Yu, J., Jeddeloh, J. A. et al. (2015). Extreme-phenotype genome-wide association study (XP-GWASA method for identifying trait-associated variants by sequencing pools of individuals selected from a diversity panel. Plant Journal, 84(3), 587–596. DOI 10.1111/tpj.13029. [Google Scholar] [CrossRef]
15. Takagi, H., Uemura, A., Yaegashi, H., Tamiru, M., Abe, A. et al. (2013). MutMap-Gap: Whole-genome resequencing of mutant F2 progeny bulk combined with de novo assembly of gap regions identifies the rice blast resistance gene Pii. New Phytologist, 200(1), 276–283. DOI 10.1111/nph.12369. [Google Scholar] [CrossRef]
16. Takagi, H., Tamiru, M., Abe, A., Yoshida, K., Uemura, A. et al. (2015). MutMap accelerates breeding of a salt-tolerant rice cultivar. Nature Biotechnology, 33(5), 445–449. DOI 10.1038/nbt.3188. [Google Scholar] [CrossRef]
17. Wu, J., Liu, S., Wang, Q., Zeng, Q., Mu, J. et al. (2018). Rapid identification of an adult plant stripe rust resistance gene in haxaploid wheat by high-throughput SNP array genotyping of pooled extremes. Theoretical and Applied Genetics, 131(1), 43–58. DOI 10.1007/s00122-017-2984-3. [Google Scholar] [CrossRef]
18. Guo, Z., Zhou, S., Wang, S., Li, W. X., Du, H. et al. (2021). Identification of major QTL for waterlogging tolerance in maize using genome-wide association study and bulked sample analysis. Journal of Applied Genetics, 62(3), 405–418. DOI 10.1007/s13353-021-00629-0. [Google Scholar] [CrossRef]
19. da Silva, M. P., Zaccaron, A. Z., Bluhm, B. H., Rupe, J. C., Wood, L. et al. (2020). Bulked segregant analysis using next-generation sequencing for identification of genetic loci for charcoal rot resistance in soybean. Physiological and Molecular Plant Biology, 109, 101440. DOI 10.1016/j.pmpp.2019.101440. [Google Scholar] [CrossRef]
20. Shi, Y. S., Li, Y., Wang, T. Y., Song, Y. C. (2006). Description and data standard of maize germplasm, pp. 10–31. Beijing: China Agriculture Press. [Google Scholar]
21. Meng, L., Li, H., Zhang, L., Wang, J. (2015). QTL IciMapping: Integrated software for genetic linkage map construction and quantitative trait locus mapping in biparental populations. Crop Journal, 3(3), 269–283. DOI 10.1016/j.cj.2015.01.001. [Google Scholar] [CrossRef]
22. Stuber, C. W., Edwards, M. D., Wendel, J. F. (1987). Molecular marker facilitated investigations of quantitative trait loci in maize. II. Factors influencing yield and its component traits. Crop Science, 27, 639–648. DOI 10.2135/cropsci1987.0011183X002700040006x. [Google Scholar] [CrossRef]
23. Guo, Y., Yang, X., Chander, S., Yan, J., Zhang, J. et al. (2013). Identification of unconditional and conditional QTL for oil, protein and starch content in maize. Crop Journal, 1(1), 34–42. DOI 10.1016/j.cj.2013.07.010. [Google Scholar] [CrossRef]
24. Zhang, Z., Liu, Z., Hu, Y., Li, W., Fu, Z. et al. (2014). QTL analysis of kernel-related traits in maize using an immortalized F2 population. PLoS One, 9(2), e89645. DOI 10.1371/journal.pone.0089645. [Google Scholar] [CrossRef]
25. Gao, X., Li, Y. X., Yang, M. T., Li, B. B., Li, C. et al. (2017). Genetic dissection of grain filling related traits based on a high-density map in maize. Scientia Agricultura Sninca, 50(21), 4087–4099. DOI 10.3864/j.issn.0578-1752.2017.21.003. [Google Scholar] [CrossRef]
26. Jittham, O., Fu, X., Xu, J., Chander, S., Li, J. et al. (2017). Genetic dissection of carotenoids in maize kernels using high-density single nucleotide polymorphism markers in a recombinant inbred line population. Crop Journal, 5(1), 63–72. DOI 10.1016/j.cj.2016.06.006. [Google Scholar] [CrossRef]
27. Fang, H., Fu, X., Wang, Y., Feng, H., Li, W. et al. (2020). Genetic basis of kernel nutritional traits during maize domestication and improvement. Plant Journal, 101(2), 278–292. DOI 10.1111/tpj.14539. [Google Scholar] [CrossRef]
28. Zhan, W., Liu, J., Pan, Q., Wang, H., Yan, S. et al. (2019). An allele of ZmPORB2 encoding a protochlorophyllide oxidoreductase promotes tocopherol accumulation in both leaves and kernels of maize. Plant Journal, 100(1), 114–127. DOI 10.1111/tpj.14432. [Google Scholar] [CrossRef]
29. Huang, J., Lu, G., Liu, L., Raihan, M. S., Xu, J. et al. (2019). qKW9 encodes a pentatricopeptide repeat protein affecting photosynthesis and grain filling in maize. bioRxiv. DOI 10.1101/847145. [Google Scholar] [CrossRef]
30. Liu, Z., Garcia, A., McMullen, D. M., Flint-Garcia, S. A. (2016a). Genetic analysis of kernel traits in maize teosinte introgression population. G3-Genes, Genomes, Genetics, 6(8), 2523–2530. DOI 10.1534/g3.116.030155. [Google Scholar] [CrossRef]
31. Peng, B., Wang, Y., Li, Y. X., Liu, C., Liu, Z. Z. et al. (2010a). QTL analysis for yield components and kernel-related traits in maize under different water regimes. Acta Agronomica Sinica, 36(11), 1832–1842 (in Chinese with English abstract). DOI 10.3724/SP.J.1006.2010.01832. [Google Scholar] [CrossRef]
32. Qin, W. W., Li, Y. X., Li, C. H., Chen, L., Wu, X. et al. (2015). QTL mapping for kernel related traits based on a high-density genetic map. Acta Agronomica Sinica, 41(10), 1510–1518 (in Chinese with English abstract). DOI 10.3724/SP.J.1006.2015.01510. [Google Scholar] [CrossRef]
33. Liu, J., Huang, J., Guo, H., Lan, L., Wang, H. et al. (2017). The conserved and unique genetic architecture of kernel size and weight in maize and rice. Plant Physiology, 175(2), 774–785. DOI 10.1104/pp.17.00708. [Google Scholar] [CrossRef]
34. Peng, B., Wang, Y., Li, Y. X., Liu, C., Zhang, Y. et al. (2010b). Correlation analysis and conditional QTL analysis of grain yield and yield components inmaize. Acta Agronomica Sinica, 36(10), 1624–1633 (in Chinese with English abstract). DOI 10.3724/SP.J.1006.2010.01624. [Google Scholar] [CrossRef]
35. Beavis, S. D., Smith, O. S., Grant, D., Fincher, R. (1994). Identification of quantitative trait loci using a small sample of top crossed and F4 progeny from maize. Crop Science, 34(4), 882–896. DOI 10.2135/cropsci1994.0011183X003400040010x. [Google Scholar] [CrossRef]
36. Goldman, I. L., Rocheford, T. R., Dudley, J. W. (1994). Molecular markers associated with maize kernel oil concentration in a Illinois high protein × Illinois low protein cross. Crop Science, 34(4), 908–915. DOI 10.2135/cropsci1994.0011183X003400040013x. [Google Scholar] [CrossRef]
37. Austin, D. F., Lee, M. (1998). Detection of quantitative trait loci for grain yield and yield components in maize across generations in stress and nonstress environments. Crop Science, 38(5), 1296–1308. DOI 10.2135/cropsci1998.0011183X003800050029x. [Google Scholar] [CrossRef]
38. Disch, S., Anastasiou, E., Sharma, V. K., Laux, T., Fletcher, J. C. et al. (2006). The E3 ubiquitin jigase BIG BROTHER controls Arabidopsis organ size in a dosage dependent manner. Current Biology, 16(3), 272–279. DOI 10.1016/j.cub.2005.12.026. [Google Scholar] [CrossRef]
39. Chen, L., Li, Y. X., Li, C., Shi, Y., Song, Y. et al. (2018). Genome-wide analysis of the pentatricopeptide repeat gene family in different maize genomes and its important role in kernel development. BMC Plant Biology, 18(1), 366. DOI 10.1186/s12870-018-1572-2. [Google Scholar] [CrossRef]
40. Ghangal, R., Rajkumar, M. S., Garg, R., Jain, M. (2020). Genome-wide analysis of glutathione S-transferase gene family in chickpea suggests its role during seed development and abiotic stress. Molecular Biology Reports, 47(4), 2749–2761. DOI 10.1007/s11033-020-05377-8. [Google Scholar] [CrossRef]
 | This work is licensed under a Creative Commons Attribution 4.0 International License, which permits unrestricted use, distribution, and reproduction in any medium, provided the original work is properly cited. |