| Phyton-International Journal of Experimental Botany |
DOI: 10.32604/phyton.2022.019106
ARTICLE
Transcriptomic and Physiological Analyses of Pigment Accumulation in Eucommia ulmoides ‘Hongye’
1Paulownia R&D Center, State Administration of Forestry and Grassland, Zhengzhou, 450003, China
2College of Forestry, Henan Agricultural University, Zhengzhou, 450003, China
3Department of Statistical and Actuarial Science, Western University, London, N6A 5B7, Canada
4Non-Timber Forestry R&D Center, Chinese Academy of Forestry, Zhengzhou, 450003, China
5Eucommia Engineering Research Center of State Forestry Administration, Zhengzhou, 450003, China
6Key Laboratory of Non-Timber Forest Germplasm Enhancement and Utilization of State Forestry and Grassland Administration, Zhengzhou, 450003, China
*Corresponding Author: Jingle Zhu. Email: zhujingle@caf.ac.cn
Received: 03 September 2021; Accepted: 27 October 2021
Abstract: Eucommia ulmoides ‘Hongye’ is a new ornamental variety of E. ulmoides with excellent red or purple foliage. We found that E. ulmoides ‘Hongye’ exhibited a gradual change from green to red colour under light conditions. However, the colouring mechanism in the leaves of E. ulmoides ‘Hongye’ remains unclear. In this study, we compared the pigment content and leaf colour index of E. ulmoides ‘Hongye’ at five stages with those of E. ulmoides ‘Xiaoye’, which was used as the control variety. The transcriptome sequencing data of the first-period (H1, green) and fifth-period (H5, red) leaves were also analysed and compared. The corresponding gene regulation in anthocyanin-related metabolic pathways was then analysed. Physiological results indicated that the contents of flavonoids and anthocyanins in red leaves (H5) were significantly higher than those in green leaves (H1), whereas the chlorophyll content in red leaves (H5) was lower than that in green leaves (H1). Moreover, the carotenoid content did not significantly differ between the two varieties. A transcriptome analysis identified 4240 differentially expressed genes (DEGs), and 20 of these genes were found to be involved in flavonoid and anthocyanin biosynthesis pathways. The results provide a reference for further study of the leaf colouration mechanism in E. ulmoides.
Keywords: Eucommia ulmoides; leaf colouring; anthocyanin; transcriptomics; flavonoid biosynthesis
As one of the main features of ornamental plants, the leaf colour is attributed to various pigment types, such as chlorophylls, carotenoids, and anthocyanins. Chlorophyll is the main component of green leaves, and anthocyanins are a class of flavonoid pigments that provide species-specific red, blue or purple colours in many plant organs and tissues [1]. The relative amounts of chlorophyll and anthocyanin are the main factors influencing leaf colour [2]. In most species, the colouration of plant tissues is caused by the accumulation of anthocyanin pigments in the vacuoles of epidermal cells. The final colouration of the anthocyanin pigments is dictated by the pH of the anthocyanin-localized vacuoles [3,4], and blue and red colours are observed at neutral and acidic pH values, respectively [5,6].
In addition to providing characteristic colours, anthocyanins are of great physiological significance to plants because they may prevent excessive ultraviolet light and thereby protect plants under extreme temperatures and counteract biotic stress [7]. Increasing studies on the structural genes that control anthocyanin synthesis have been performed in recent years, and transcriptomic studies aiming to mine the structural genes and transcription factors (TFs) of anthocyanin synthesis are continuously being performed. For example, the transcriptome results of black persimmon peel at three periods (namely, when the peel is fully green, beginning to change colour, and exhibits a complete colour change), have indicated that the colour of the black persimmon peel is the effect of anthocyanins and their derivatives. During this colour conversion process, the expression of genes that determine pigment synthesis, such as UF5GT, increased significantly, whereas the leucoanthocyanidin reductase LAR enzyme gene do not show differential expression [8]. In addition, a large number of studies have investigated colour formation in the fruits and peels of commercial crops, such as grapes, kiwis, and red pears [9–11], and the process of colour formation in chrysanthemums and tulips [12].
The anthocyanin biosynthetic pathway, which determines anthocyanin deposition, is largely conserved among different plant species, and genes associated with this pathway have been well characterized [13]. Enzyme genes that control anthocyanin synthesis are usually divided into upstream and downstream gene groups. The upstream genes include CHS, CHI, F3H, F3′5′H and other enzyme genes, and the downstream gene group includes DFR, ANS, GT, AT and MT and other enzyme genes [14]. Notably, the structural genes in the anthocyanin biosynthetic pathway are transcriptionally coregulated via three distinct TFs, i.e., R2R3 MYB, basic helix-loop-helix (bHLH) and WD40 repeat proteins [MBW complex] [15,16].
Eucommia ulmoides is an economically important tree species and an ideal urban greening and ornamental landscape species that is widely distributed in China. E. ulmoides ‘Hongye’, which has red and purple leaves, is an excellent ornamental variety selected by the Non-timber Forest R&D Center, Chinese Academy of Forestry. Previous studies have indicated that the anthocyanin content in E. ulmoides ‘Hongye’ leaves is 2.2- to 3.5-fold higher than that in leaves of common Eucommia [17,18]. However, the mechanism regulating the higher anthocyanin content in E. ulmoides ‘Hongye’ leaves has not been studied and remains unaddressed.
In this study, we analysed the transcriptome, leaf structure and pigment content of E. ulmoides ‘Hongye’ (red and purple foliage) and E. ulmoides ‘Xiaoye’ (green foliage) using comparative transcriptomics and well-established physiological assays. The objective of this study was to discover differentially expressed genes (DEGs) and TFs associated with anthocyanin accumulation to reveal the mechanisms of pigment accumulation in the two varieties.
2.1 Plant Materials and Sample Leaf Collection
In this study, three-year-old E. ulmoides ‘Xiaoye’ and E. ulmoides ‘Hongye’ grafted seedlings were used as the objects (all the rootstocks were common Eucommia ulmoides). E. ulmoides ‘Xiaoye’ and E. ulmoides ‘Hongye’ are both clones obtained through seed breeding methods in Luoyang, Henan. All the samplings were preserved in the experimental base at Yuan Yang County, Henan Province, China (34°55.30′~34°56.45′N; 113°46.24′~113°47.59′E). The annual average temperature is 14.43°C; the annual precipitation is 565.2 mm; the frost-free period is 224 days; the soil is sandy with an organic matter content of 1.04%; the total nitrogen content is 0.097%; the available phosphorus content is 21.27 mg ∙ kg−1; and the available potassium content is 123.04 mg ∙ kg−1.
Under the same growth conditions, 3 plantlets of each variety were selected for leaf sample collection. Each tree contained five typical leaves (from top to bottom, the corresponding ages of these 1–5 leaves were 6, 14, 22, 30, and 38 days, respectively). The sample leaves were numbered as follows: the E. ulmoides ‘Hongye’ leaves were sequentially numbered as H1, H2, H3, H4, and H5, and the E. ulmoides ‘Xiaoye’ leaves were sequentially numbered as G1, G2, G3, G4, and G5.
Half of the samples were immediately frozen in liquid nitrogen. Subsequently, RNA was extracted, and transcriptome sequencing was performed. The other half of the leaves were used for measuring the leaf colour differences and determining the pigment and anthocyanin contents.
2.2 Measurement of the Leaf Colour Difference
The L (lightness), a* (redness) and b* values (yellowness) were measured using a CR2500 colour difference metre (MINOLTA, Japan). For each plantlet, 5 leaves were used for measuring these indexes. In each blade, 10 points were randomly selected, and the vein was carefully avoided. The leaf colour index was calculated using the following equations [19]:
where C* is the colour saturation and h° is the hue angle.
2.3 Measurement of the Photosynthetic Pigment Content
The photosynthetic pigment content was determined using the Fadeel method [20]. Approximately 0.10 g (accurate to 0.01 g) of the leaves was weighed after the veins were cut and centrifugation of the resulting sample with 10 mL of 90% acetone at 4000 rpm. The supernatant was used to measure the absorbances at 445, 644 and 662 nm. The complete protocol was repeated with five technical and three biological replicates. The following acronyms were used: chlorophyll a content (Ca), chlorophyll b content (Cb), total chlorophyll content (CT), and carotenoid content (CCar).
In these equations, A is the absorbance at a certain wavelength, C is the pigment concentration (mg · g−1), V is the volume of the extraction solution (mL), and W is the fresh weight of the sample (g).
Freehand sections of leaf cross sections were prepared and observed to determine the accumulation of anthocyanin pigments without staining. Images were captured using a microscope (CHB-213, Olympus, Tokyo, Japan) and camera (DCM900, Oplenic, Hangzhou, China) and were observed with a 40× objective lens.
2.5 Determination of the Anthocyanin Contents in Leaves
The anthocyanin content was determined using Rabino’s method with the following modifications [21]. Fresh leaves were washed with water and accurately weighed to 0.10 g (accurate to 0.01 g). Ten millilitres of 1% HCl methanol solution was then added to the leaves, and the vials were maintained at 32°C for 5 h in a shaking incubator. The 1% HCl methanol solution was diluted five times and used as a test solution. The absorbances at 530 and 657 nm were determined using 1% HCl methanol solution as the control. The same procedure was repeated five times, and the average from three absorbance values at the same wavelength was calculated. The carotenoid component was measured by high-performance liquid chromatography, and the total carotenoid and flavonoid contents were determined using a UV-1800 spectrophotometer. The obtained data were analysed using SPSS software (version 20.0; SPSS Inc., Chicago, IL, USA). Three biological replicates of each sample were evaluated.
2.6 RNA Extraction and cDNA Library Preparation
Total RNA was extracted using the TRIzol reagent (Invitrogen, USA) according to the manufacturer’s instructions. The RNA concentration and integrity were quantified using a Qubit 2.0 fluorometer (Life Technologies, CA, USA) and an Agilent Bioanalyser 2100 system (Agilent Technologies, CA, USA), respectively. Total RNA with sufficiently high concentration and integrity values was used for cDNA library construction and test analysis. Eukaryotic mRNA was enriched with Oligo magnetic beads (dT). Fragmentation buffer was used to break the mRNA into short fragments. Using mRNA as the template, the first cDNA strand was synthesized with random hexamers, and buffer, dNTPs, RNase H and DNA polymerase were then added to synthesize the second fragment. The cDNA strand was subjected to end repair after purification using a QIAquick PCR kit and elution with EB buffer. Poly(A) was added, and the sequencing linker was ligated. The fragment size was selected by agarose gel electrophoresis, and PCR amplification was performed. The constructed library was sequenced using the Illumina HiSeq™ 2000 system.
2.7 Illumina Deep Sequencing and Data Analysis
Two cDNAs from H1 and H5 were selected for transcriptome sequencing. The constructed cDNA library was sequenced using an Illumina HiSeqTM 2000 sequencing platform (Illumina, San Diego, CA, USA). The Illumina platform converted the sequenced image signal into a text signal through CASAVA base calling and stored it in ‘fastq’ format as raw data. The data from each sample were differentiated according to the index sequence for subsequent analysis. The fastx toolkit (v0.0.14) was used for sequencing-related quality assessment of the original sequencing data of each sample. Perl scripts were used to remove low-quality reads, such as adaptor sequences, and reads with less than 10% unknown nucleotides from the raw reads. Clean reads filtered from the original reads were mapped to the Eucommia reference genome (https://www.ncbi.nlm.nih.gov/bioproject/?term=PRJNA357336) using HISAT v2.0.4 software with the default parameters [22,23]. The read counts for each gene were calculated using HTSeq v0.6.1, and the gene expression level was estimated as the value of fragments per kilobase of transcript per million mapped reads (FPKM) [24,25]. The FPKM method was used to analyse the gene expression patterns in both types of libraries.
2.8 Identification and Functional Analysis of DEGs
To identify genes showing differential expression between the H1 and H5 cDNA libraries, the DESeq R package (version 1.18.0) was used in this study to identify DEGs from gene expression data using a model based on a negative binomial distribution [26]. To control the false discovery rate, the P-value obtained from DESeq was adjusted using the Benjamini method. Based on the control gene threshold value, a P-value < 0.05 was considered to indicate differential expression. The identified DEGs were used for Gene Ontology (GO) and Kyoto Encyclopedia of Genes and Genomes (KEGG) enrichment analyses. The GO enrichment analysis of DEGs was performed using the GOseq R package. The functions of DEGs were categorized according to the GO database using the Blast2GO software suite. GO terms with a correction value of P < 0.05 were considered to indicate significant enrichment of DEGs. To further elucidate the biological functions of DEGs, these genes were assigned to different pathways in the KEGG database. The statistical enrichment of DEGs in the KEGG pathways was then tested using KOBAS software [27,28]. The DEG annotations were retrieved from the Eucommia genome annotation project.
2.9 Quantitative Real Time PCR (qRT PCR) Validation
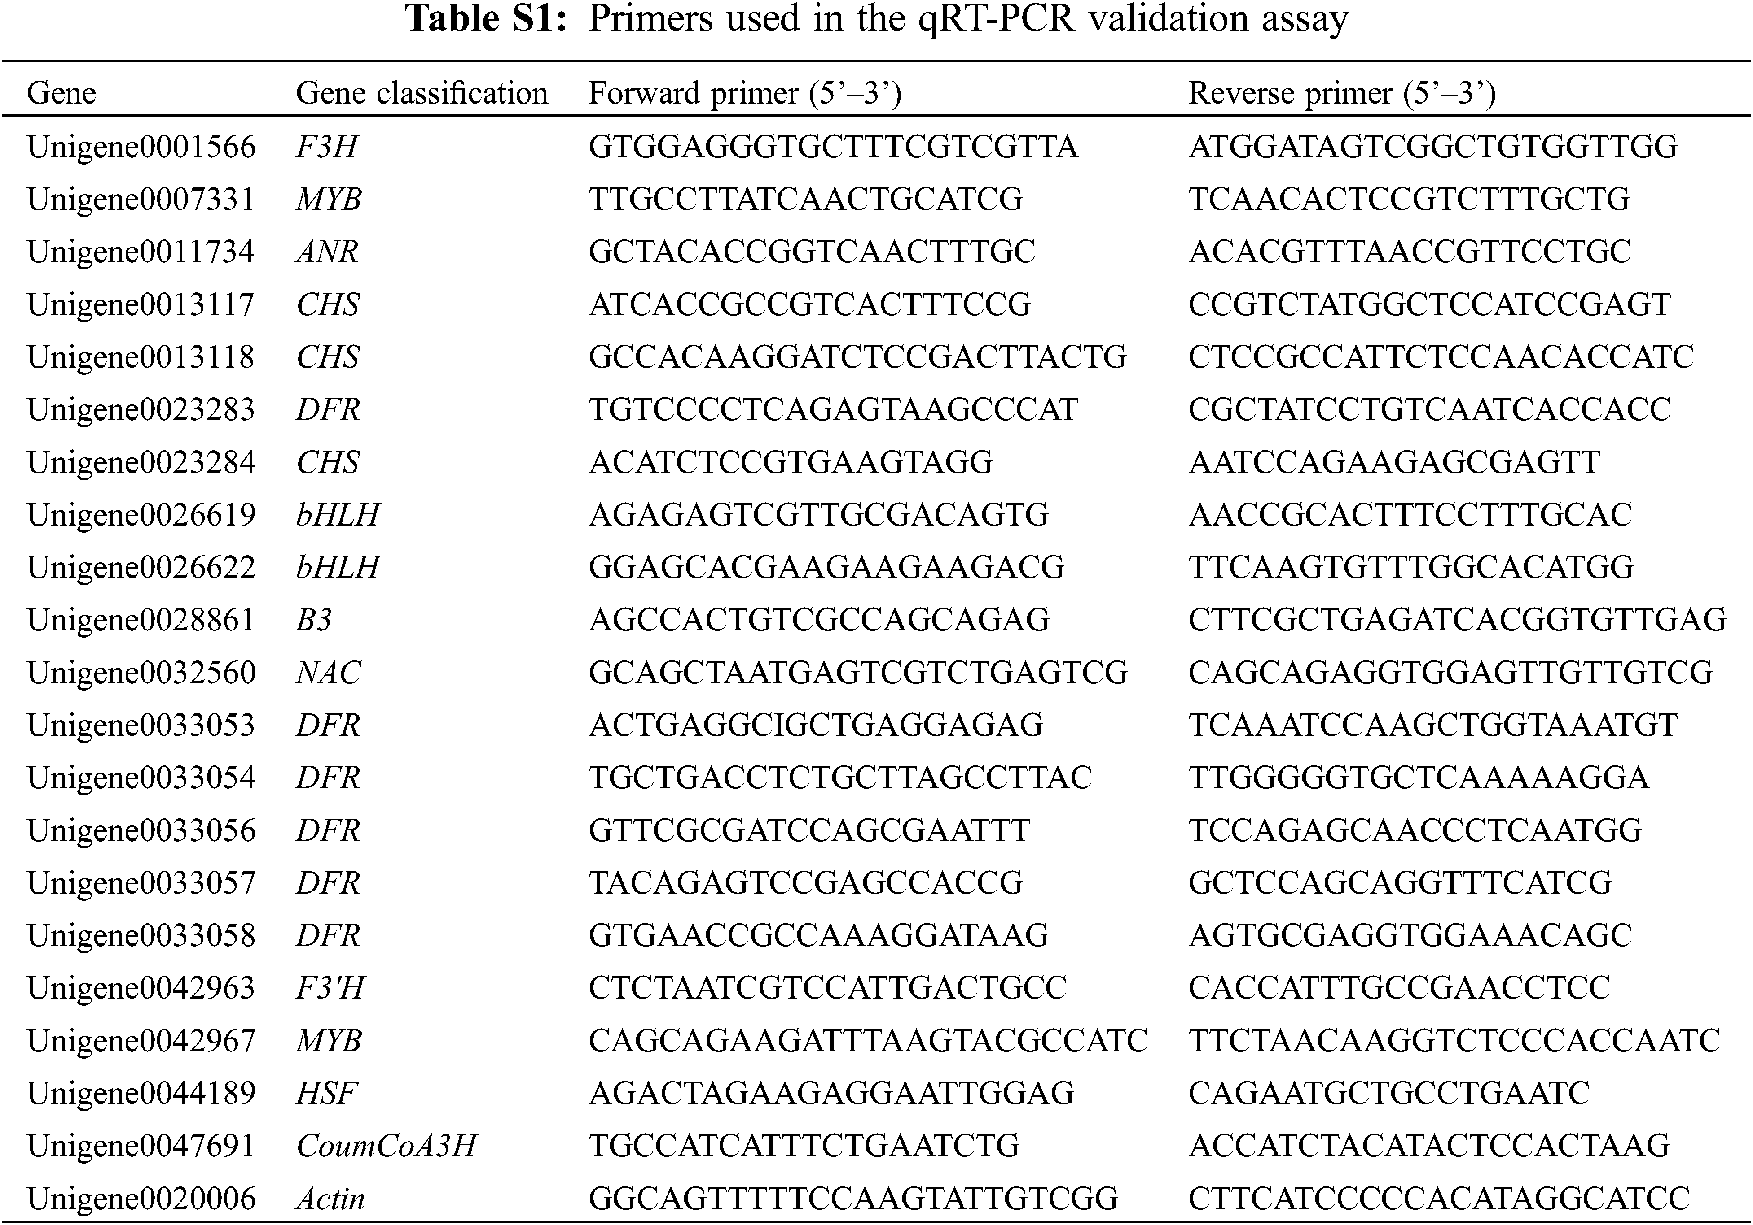
The expression levels of DEGs in different samples were verified by qRT-PCR. Online software was used for primer design, and the primer sequences are listed in Table S1. The actin (Unigene0020006) gene was used as an internal standard gene. qRT-PCR was performed using SYBR Green Master Mix and a CFX96 real-time system (Bio-Rad, USA) with the following conditions: denaturation at 95°C for 3 min and 40 amplification cycles (95°C for 30 s, 60°C for 30 s, and 72°C for 30 s). The above-described analysis was used as a negative control, and three technical repetitions of each sample were used. The 2−ΔΔCT method was used to calculate the relative expression level of DEGs.
3.1 Histological Observation of Leaves
The adaxial surface of E. ulmoides ‘Hongye’ leaves gradually turned dark red during growth, whereas the abaxial surface remained green. However, the leaves of E. ulmoides ‘Xiaoye’ were completely green, and the dorsal lamina was slightly darker than the ventral lamina. A microscopic analysis showed that both red and green cells were found on the dorsal surface of E. ulmoides ‘Hongye’ leaves during leaf growth, whereas red cells were only observed on the leaves of E. ulmoides ‘Hongye’. Hand slicing showed that the upper epidermis and veins of the two varieties were transparent. Moreover, the palisade tissue of E. ulmoides ‘Xiaoye’ remained green throughout its growing period. However, the E. ulmoides ‘Hongye’ palisade tissue gradually deepened and became red after approximately fourteen days of growth (Figs. 1A and 1B). No chlorophyll or anthocyanin was detected in the upper epidermis or veins of E. ulmoides ‘Hongye’ leaves.
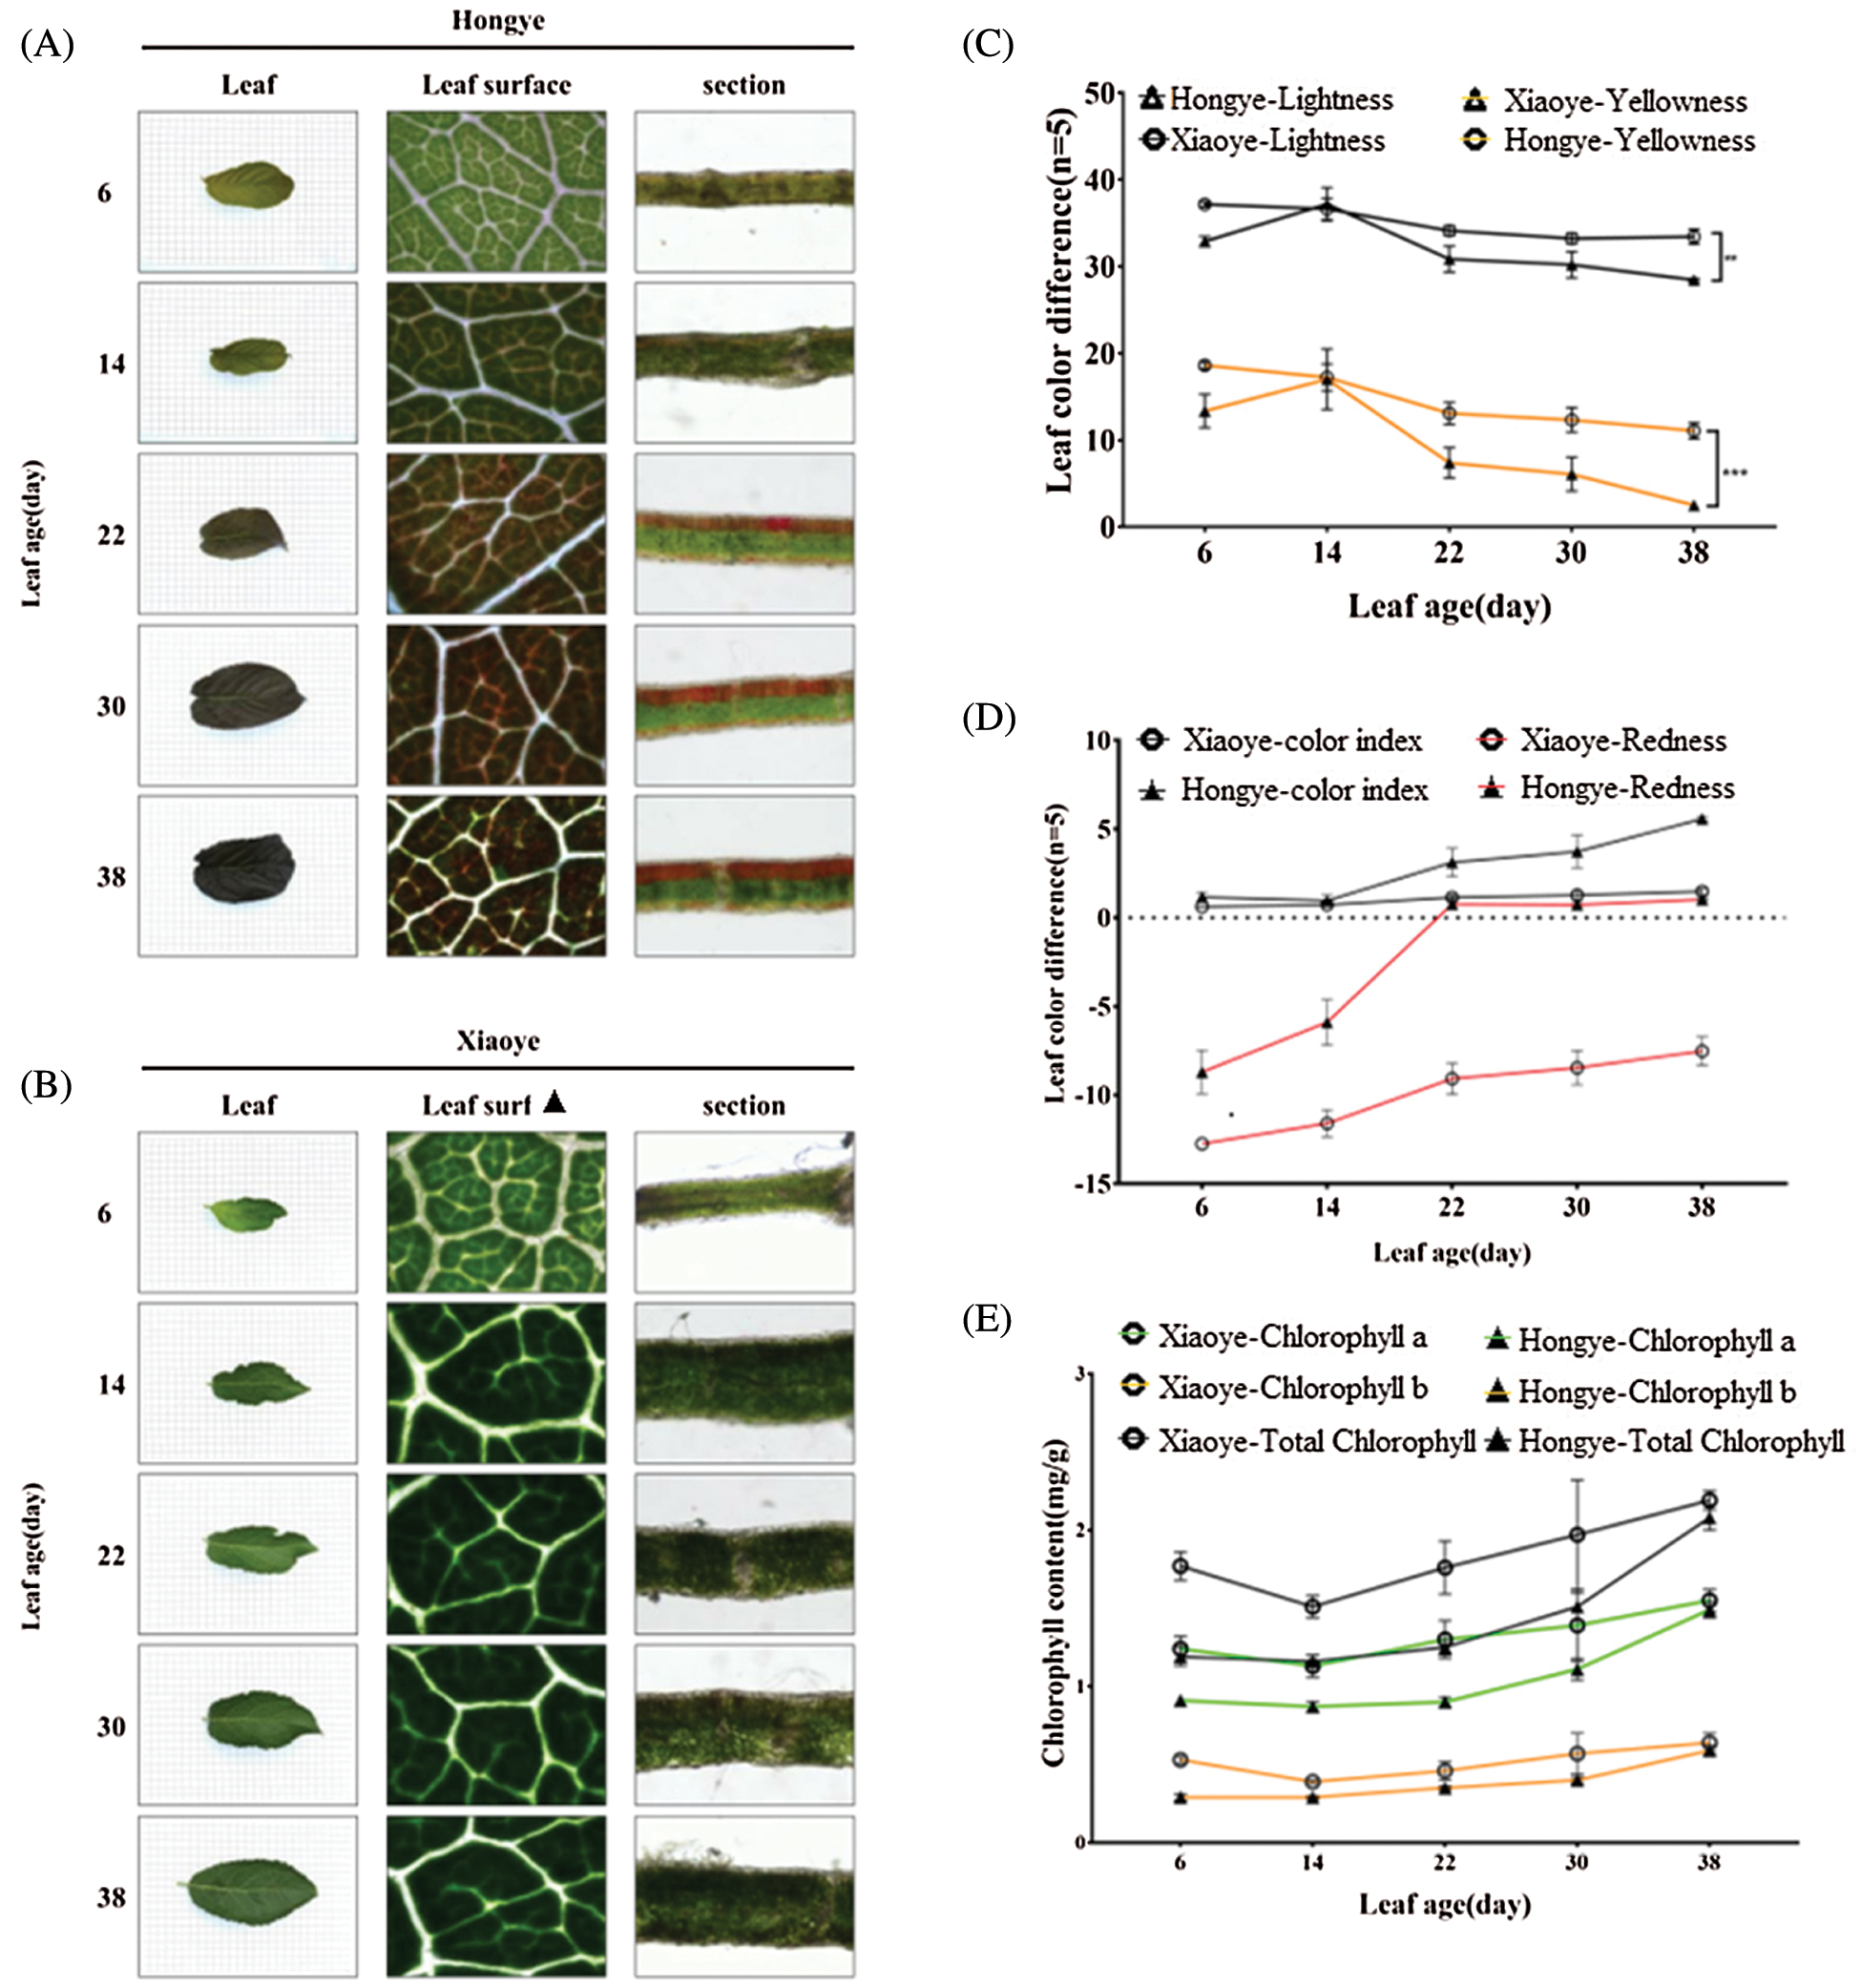

Figure 1: Physiological experiment results. (A) Colour change of Eucommia ulmoides leaves during growth and microscopic sections. (B) Colour change of Eucommia ulmoides leaves during growth and microscopic sections. (C) Changes in brightness and yellowing in the two varieties of Eucommia ulmoides. (D) Changes in the colour index and redness in the two varieties of Eucommia ulmoides. (E) Changes in the chlorophyll a, chlorophyll b and total chlorophyll contents in the two varieties of Eucommia ulmoides. (F) Changes in the anthocyanin and carotenoid contents in the two varieties of Eucommia ulmoides. (G) Changes in the flavonoid content in the two varieties of Eucommia ulmoides
3.2 Leaf Colour Difference and Pigment and Flavonoid Contents
E. ulmoides ‘Xiaoye’ and E. ulmoides ‘Hongye’ plants of the same age were used for comparison of the pigment contents. The brightness and yellowness of E. ulmoides ‘Hongye’ were significantly lower than those of E. ulmoides ‘Xiaoye’, whereas the redness degree and the colour index were significantly higher in the former. The colour index of the E. ulmoides ‘Xiaoye’ leaves on the 22nd day was higher than 0, whereas the redness was below 0 (Figs. 1C and 1D). Based on the red grape fruit colour indexing method [14], the colour indexes of E. ulmoides ‘Hongye’ and E. ulmoides ‘Xiaoye’ were 5.50 (deep-red level) and 1.35 (yellow-green level) on the 38th day, respectively.
During leaf growth and development, the chlorophyll and anthocyanin contents in both varieties increased gradually. The total chlorophyll (including Chlorophylls a and b) content of E. ulmoides ‘Hongye’ was lower than that of E. ulmoides ‘Xiaoye’ at H1 (6 days). From the initiation of the experiment to the 38th day, the chlorophyll content of E. ulmoides ‘Hongye’ increased by 73.72%, whereas that in E. ulmoides ‘Xiaoye’ increased by only 23.52%. Therefore, the total chlorophyll contents of E. ulmoides ‘Hongye’ and E. ulmoides ‘Xiaoye’ tended to be consistent at H5 (38 days) (Fig. 1E). At this time point, the anthocyanin content in E. ulmoides ‘Xiaoye’ and E. ulmoides ‘Hongye’ increased by 135.20% and 748.96%, respectively. The anthocyanin (flavonoid) content of E. ulmoides ‘Hongye’ after 38 days of growth was 2.1 (1.57)-fold higher than that of E. ulmoides ‘Xiaoye’ (Fig. 1G). Carotenoids did not differ significantly between the two varieties (Fig. 1F).
The results showed that the total chlorophyll and carotenoid contents did not differ significantly between E. ulmoides ‘Hongye’ and E. ulmoides ‘Xiaoye’, whereas the contents of anthocyanins and flavonoids in E. ulmoides ‘Hongye’ were significantly higher than those in E. ulmoides ‘Xiaoye’, which indicated that anthocyanins and flavonoids were two of the main factors involved in the formation of red leaves in E. ulmoides ‘Hongye’.
3.3 Transcriptomic Differences
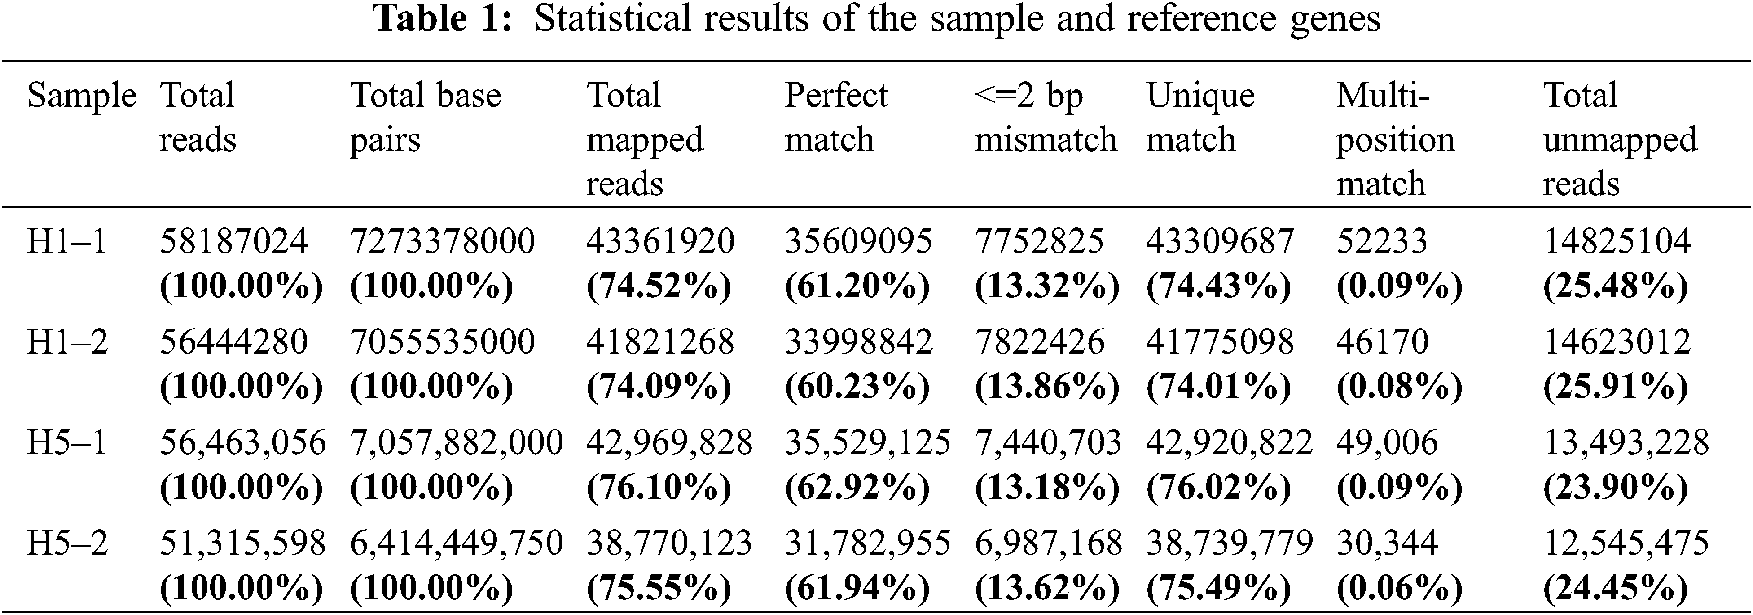
After rigorous quality checks and data cleaning, 51.3–58.2 million clean reads were obtained by sequencing the prepared cDNA library. Among these reads, a total of 38.7–43.4 million reads were mapped to the Eucommia genome database, and the matching rate ranged from 74.01% to 76.02% (Table 1).
After comparing the FPKM values between the libraries of the two types, 45121 and 45986 genes were identified in the cDNA library, and 3447 and 1598 of these genes were specifically expressed in Eucommia ‘Hongye’ and Eucommia ‘Xiaoye’ leaves, respectively. We detected 4240 DEGs (P-value < 0.01, |Fold Change| > 2), which included 1813 upregulated genes and 2427 upregulated genes (Figs. 2A and 2B). The categorization of DEG functions showed that the up- and downregulated DEGs were mainly enriched in the GO terms “metabolic process”, “catalytic activity” and “single biological process”. In addition, the DEGs were matched and assigned to 106 KEGG pathways, and the major enriched pathways were “flavonoid biosynthesis” and “biosynthesis of secondary metabolites”. In E. ulmoides ‘Hongye’, many downregulated DEGs were enriched in “biosynthesis of secondary metabolites”, whereas some upregulated DEGs were enriched in “flavonoid biosynthesis” (Fig. 2C).
All the raw data obtained in this study have been uploaded to the public database of the National Center for Biotechnology Information (SRR15100427; SRR15100428; SRR15100426; SRR15100425).

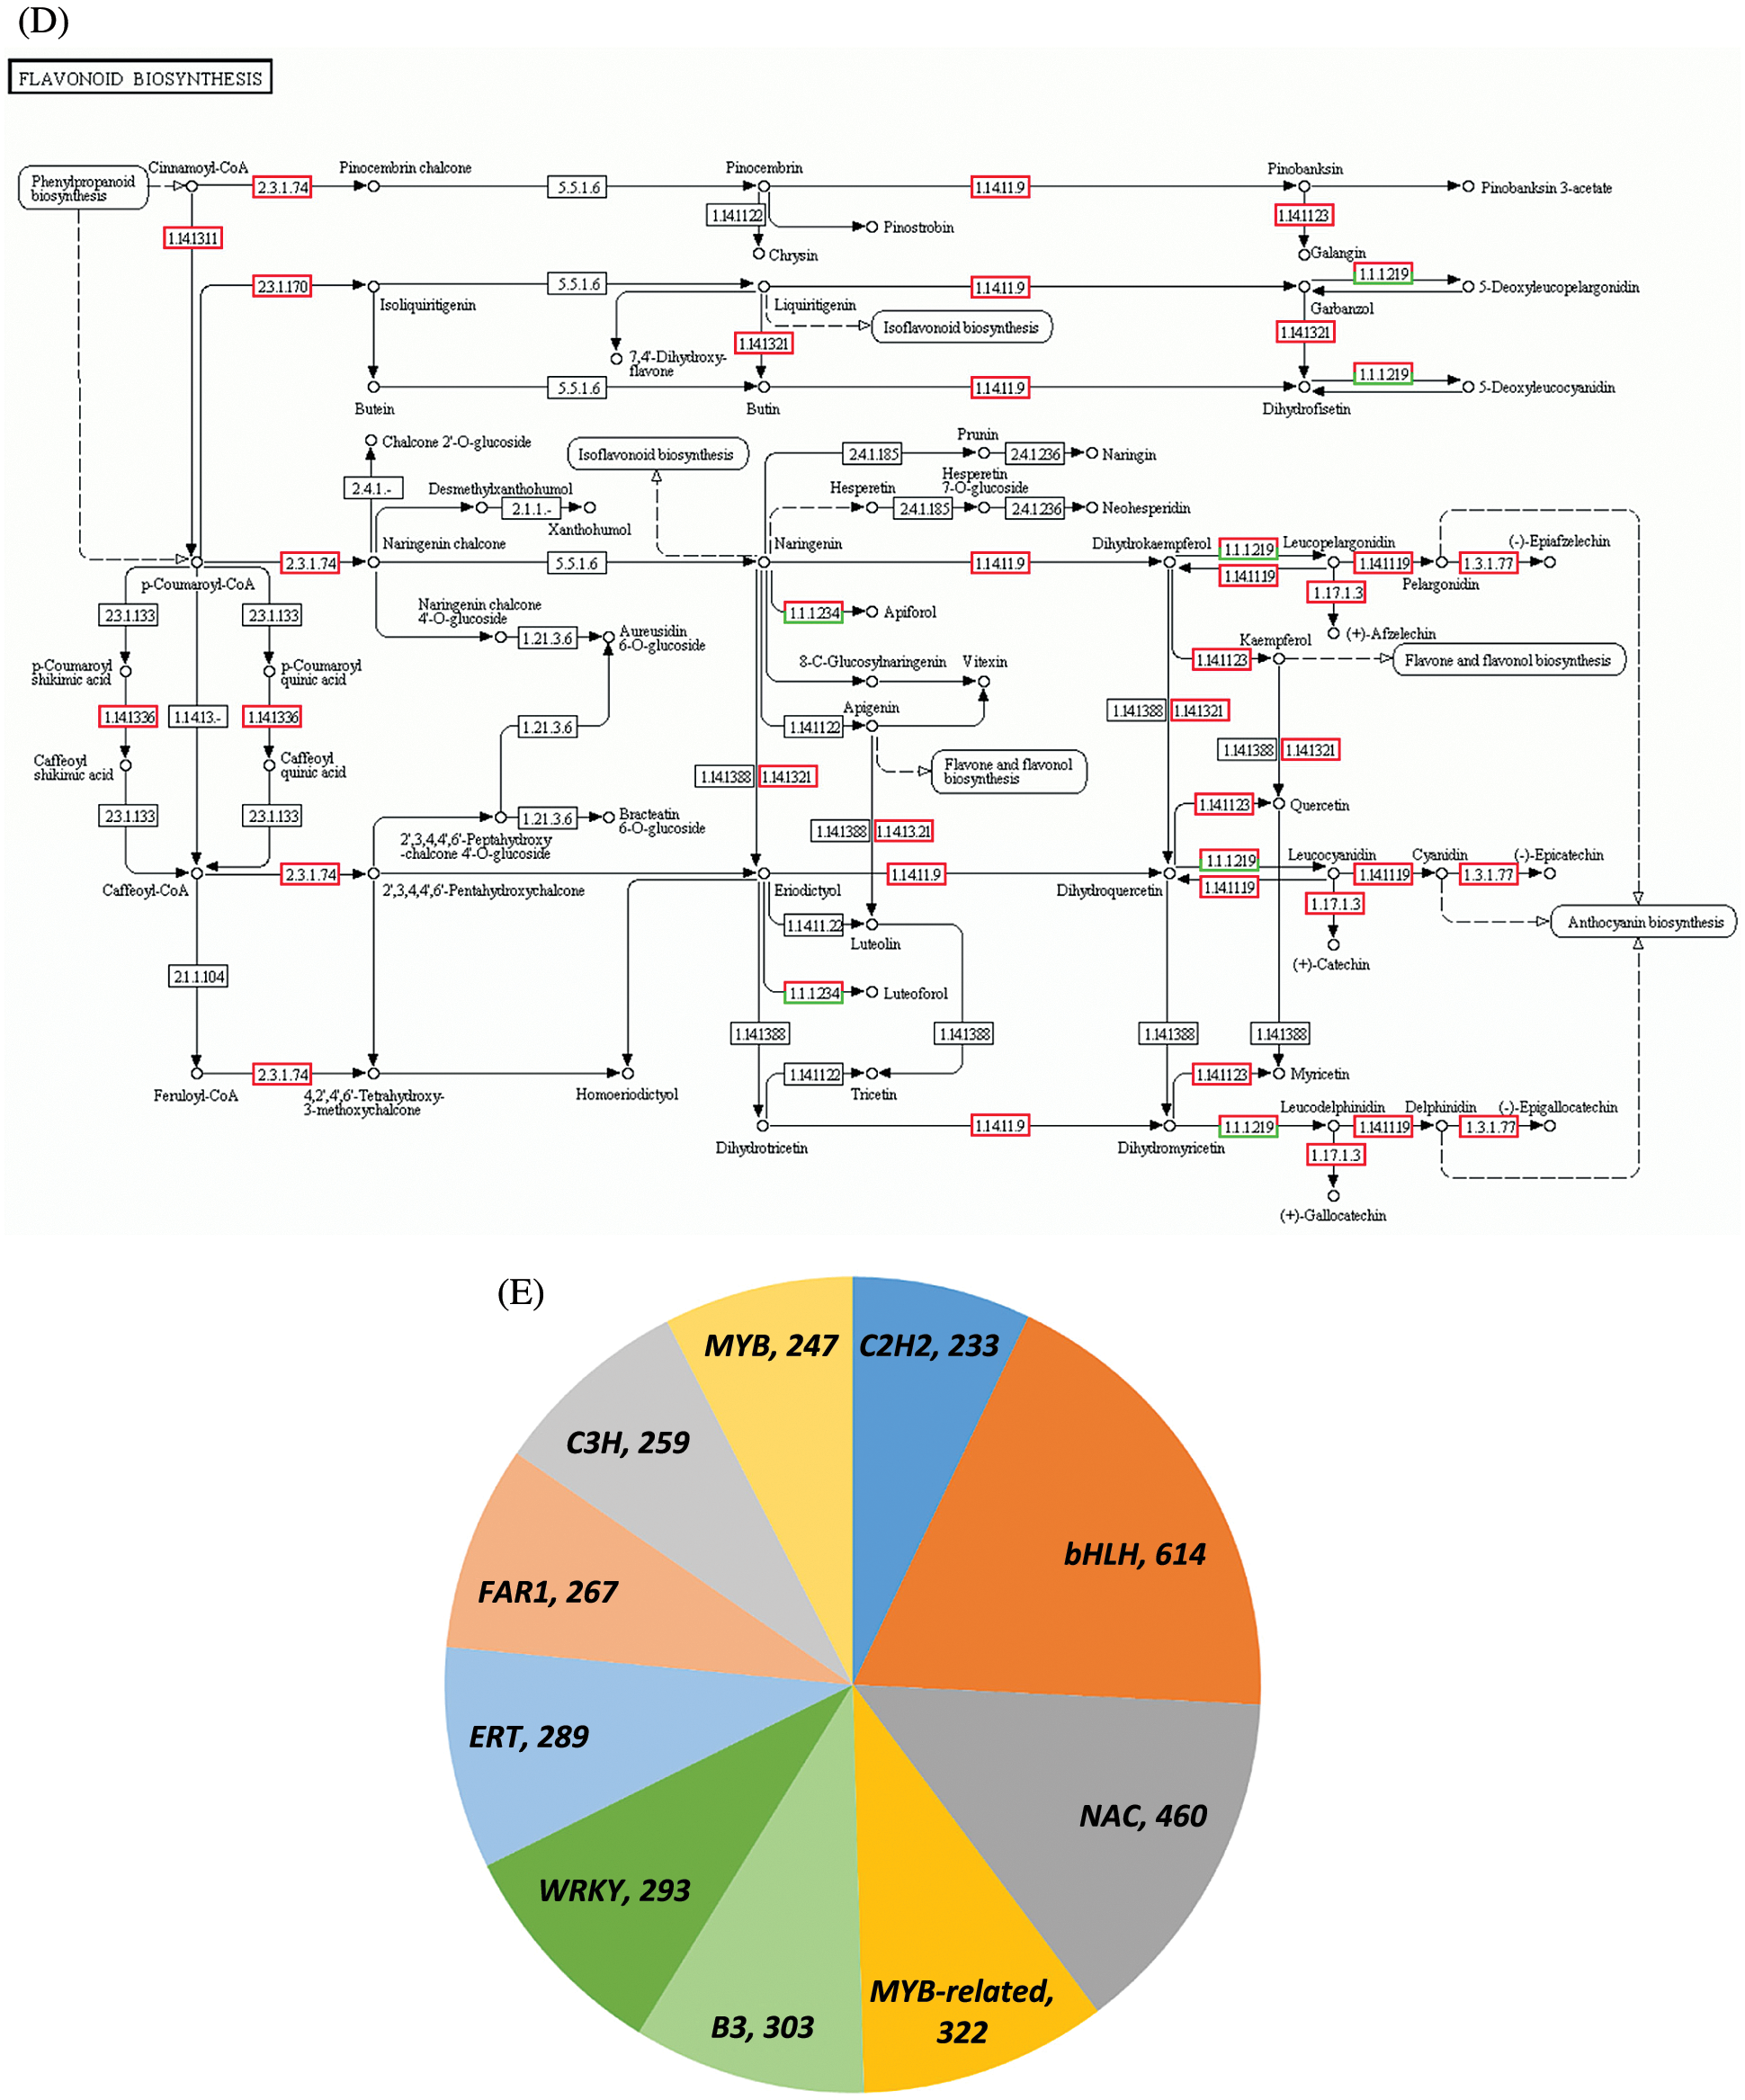
Figure 2: Transcriptome analysis results. (A) Screening of DEGs at two periods. (B) Scatterplot of differential gene expression levels at the H1 and H5 periods. (C) Functional annotation of DEGs in the GO database. (D) Schematic of flavonoid biosynthesis. (E) Type and quantity of TFs
3.4 Flavonoid Biosynthesis Genes Involved in Leaf Colouration
Based on the pathway analysis of DEGs, two types of DEGs closely related to the formation of red leaves in E. ulmoides ‘Hongye’ were summarized. One was a key enzyme gene that regulates the biosynthesis and accumulation of flavonoids (Fig. 2D), and the other was a differentially expressed TF associated with anthocyanin or flavonoid biosynthesis. The first category included 13 DEGs (Table 2). Compared with the results at H1, the analysis of H5 identified one downregulated gene and 12 upregulated genes, which included one coumaric acid-CoA hydroxylase (CoumCoA3H) gene, one flavanone 3-hydroxylase (F3H) gene, one flavonoid 3′ hydroxylase (F3′H) gene, three chalcone synthase (CHS) genes, six dihydroflavonol 4-reductase (DFR) genes, and one anthocyanidin reductase (ANR) gene.

Using the TF database, all DEGs were annotated to 5,854 TFs, including 614 (10.49%) bHLH, 322 MYB-related, 247 R2R3-MYB and 460 (7.86%) NAC TFs (Fig. 2E). Based on the annotation results obtained using the TF database, seven sequences related to anthocyanin synthesis were obtained (Table 3). Among these sequences, two MYB and two bHLH TFs were downregulated, and one B3 TF, one NAC TF and one HSF TF were upregulated.

RNA-seq data were screened for differences, and 20 important DEGs were found through functional annotation. The heat map shows the expression of these 20 genes (Fig. 3).
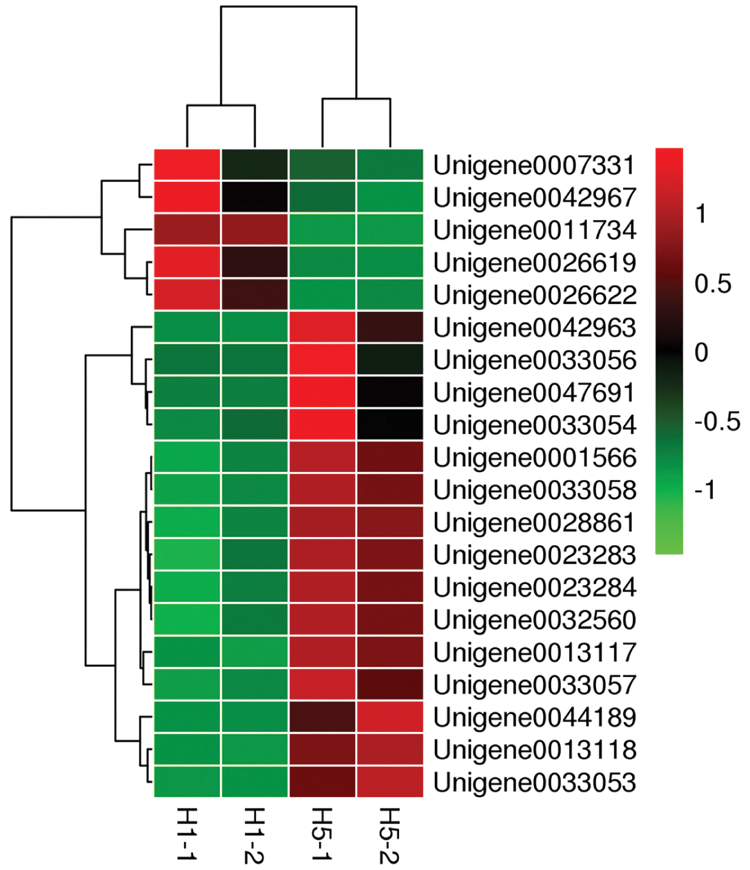
Figure 3: Heatmap of 20 selected genes showing the clustering results
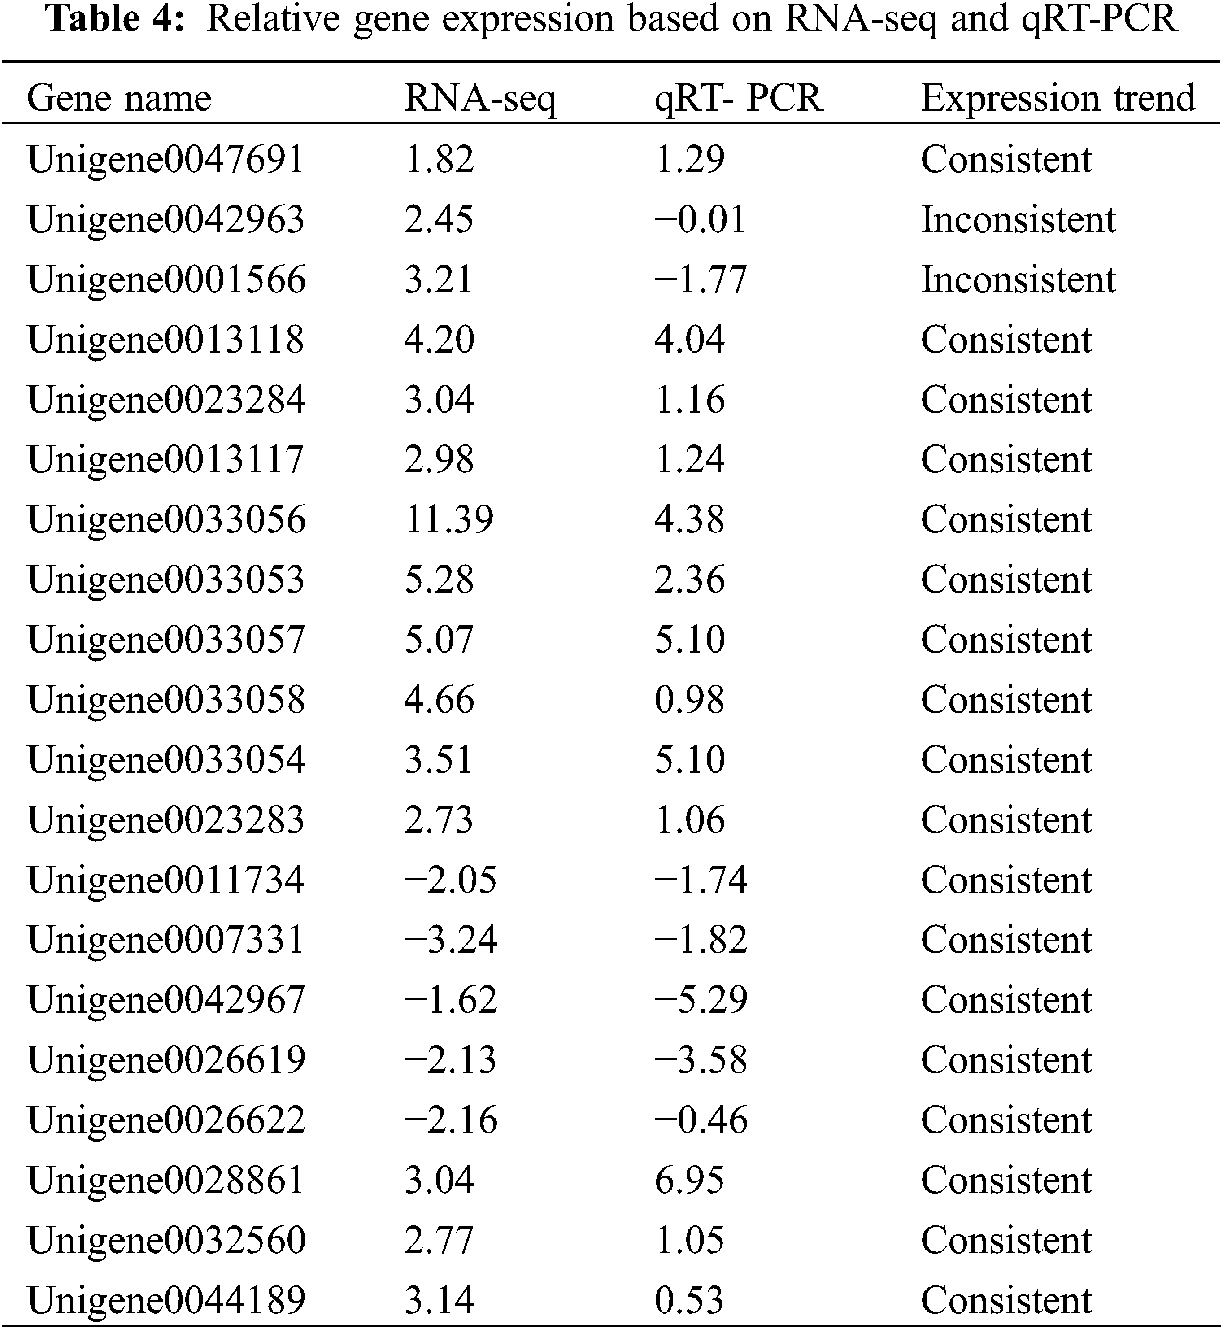
To verify the RNA-Seq results, we performed qPCR to identify the expression levels of these key DEGs (Fig. 4). As shown in Table 4, the upregulated and downregulated expression patterns in E. ulmoides leaves at H1 and H5 showed good consistency.
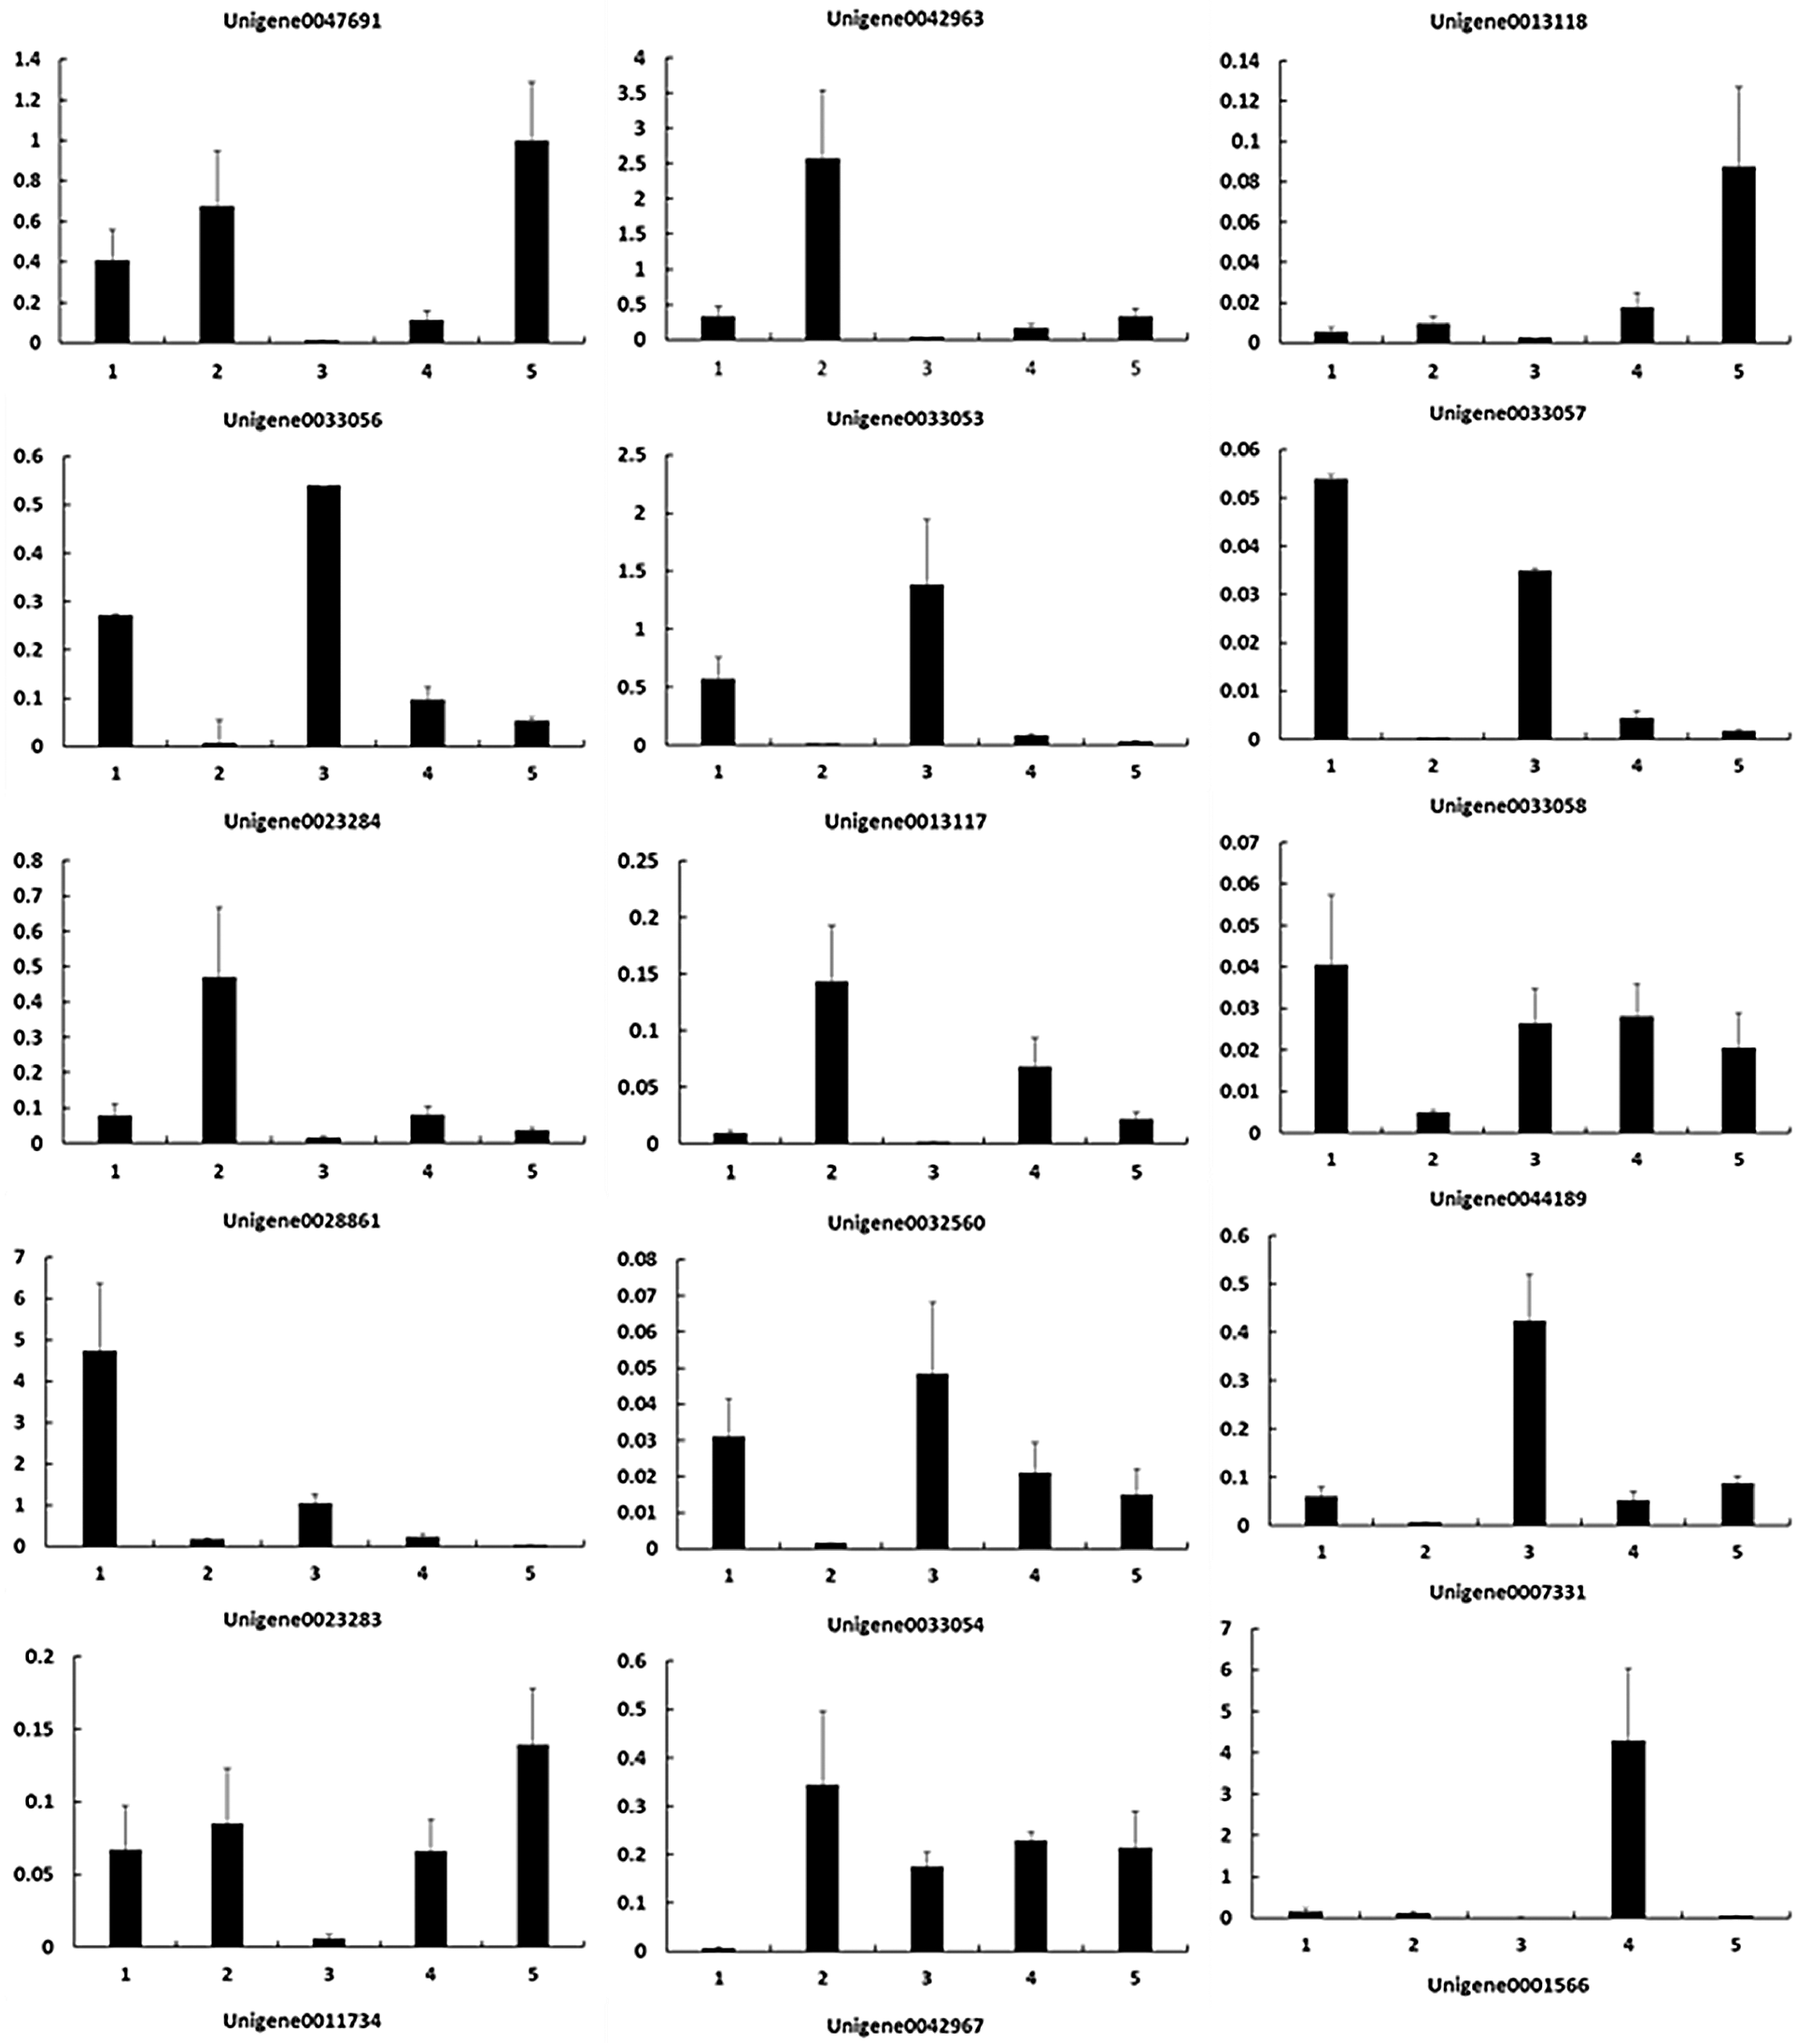
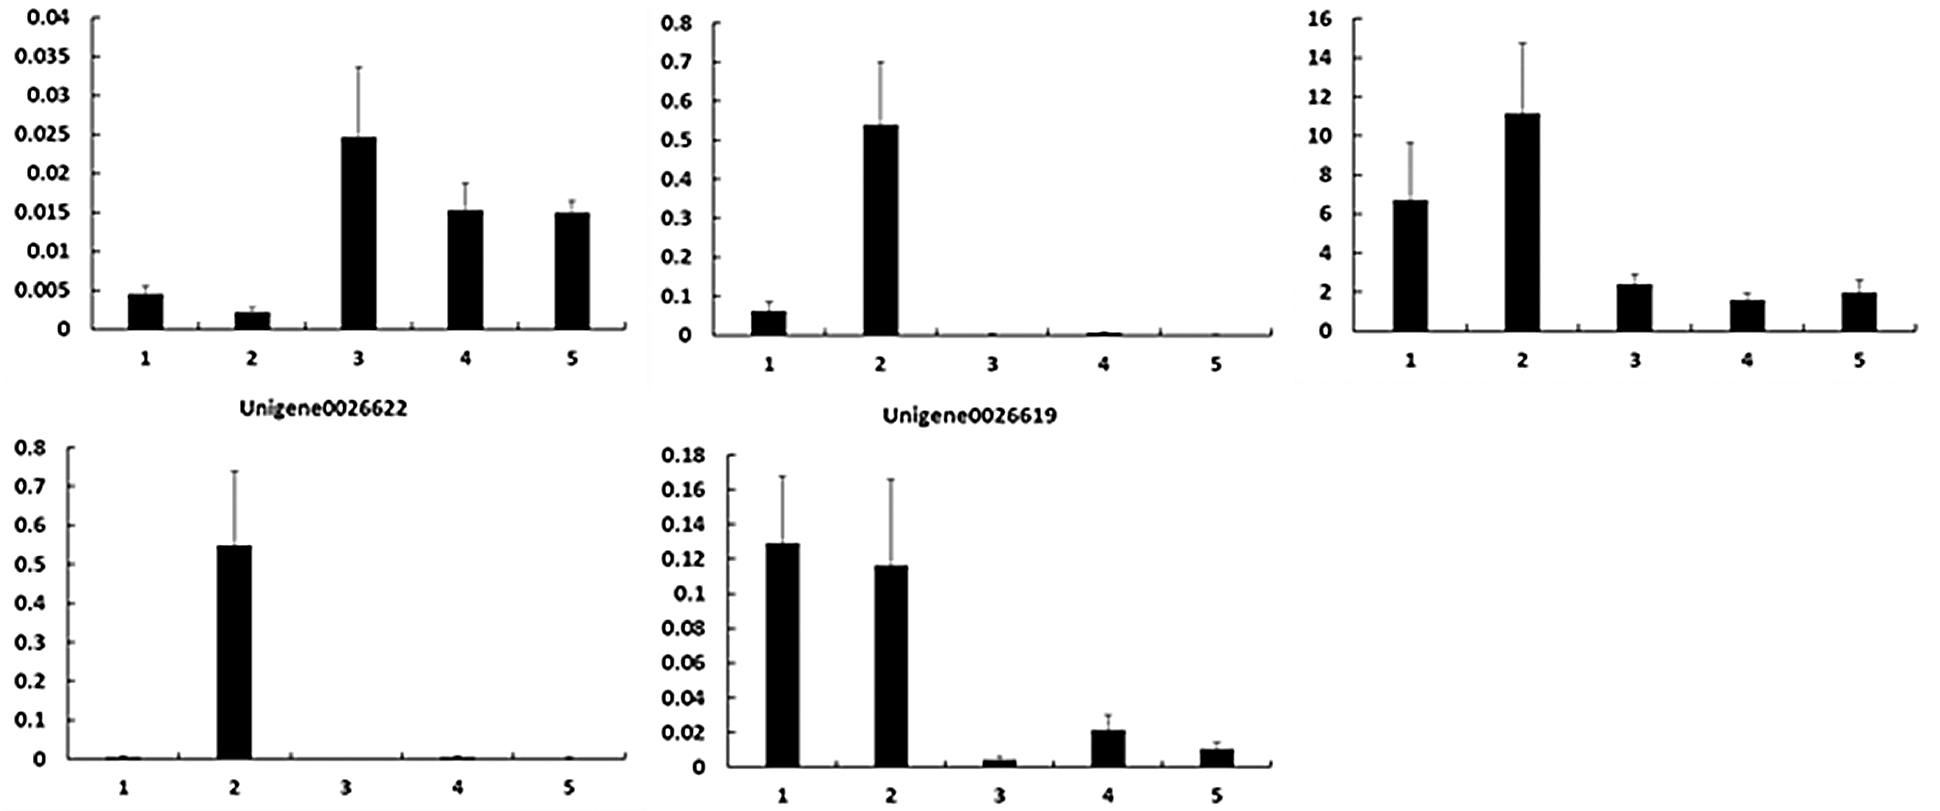
Figure 4: Gene expression patterns during the process of E. ulmoides ’Hongye’ leaf colour formation. The Y-axis and X-axis show the relative gene expression and sampling period, respectively
Differences in the range of anthocyanin distribution in different tissues of E. ulmoides ‘Hongye’ leaves were found, and these resulted in certain differences in the appearance of the leaves; specifically, the front of the leaves was dark red in colour, and the backs of the leaves were green. The difference in leaf colour is related to not only the type of pigment but also the distribution of pigments in the plant [29]. Anthocyanins are mainly distributed in the lower epidermis and sponge tissue, such as in the leaves of Prunus virginiana ‘Canada Red’, the backs of which are red. If anthocyanins are mainly distributed in the upper epidermis and palisade tissue, red colour appears on the front of the leaf, as observed in Albizia spp., Berberis thunbergii ‘Atropurpurea’, Photinia fraseri ‘Red Robin’ and E. ulmoides ‘Hongye’ [30]. In E. ulmoides ‘Hongye’ leaves, anthocyanins were found only in the fence tissue. The colour difference between the palisade tissue and the sponge tissue explained the differences in the appearance of the leaves.
The plant colour is divided into four categories according to the chemical structure of their metabolites: chlorophylls, carotenoids, betalains, and flavonoids. Flavonoid pigments include anthocyanins, aurones, and chalcones. Anthocyanins and chlorophylls are two of the main factors involved in the formation of red leaves in E. ulmoides ‘Hongye’. The final leaf colour depends on the ratio of the chlorophyll to the anthocyanin content [31]. Our study found that the chlorophyll and carotenoid contents did not differ significantly between E. ulmoides ‘Hongye’ and E. ulmoides ‘Xiaoye’, whereas the anthocyanin and flavonoid contents of E. ulmoides ‘Hongye’ were significantly higher than those of E. ulmoides ‘Xiaoye’. This finding indicates that the redness of E. ulmoides ‘Hongye’ is related to the synthesis of anthocyanins and flavonoids rather than chlorophyll. In addition, the relationship between anthocyanin and total chlorophyll in purple-leaved E. ulmoides includes an increase in the former and a decrease in the latter [32]. However, both the anthocyanin and chlorophyll contents of E. ulmoides increased gradually in our study. Therefore, the leaves of E. ulmoides ‘Hongye’ showed a gradual change in colour from green to red during its growth, which may be due to the high chlorophyll content at the early stage, whereas the increase in the chlorophyll content was less than the increase in the anthocyanin content.
The most important enzymes in E. ulmoides ‘Hongye’ were chalcone synthase (CHS), flavanone-3-hydroxylase (F3H), dihydroflavonol reductase (DFR), flavonoid-3-hydroxylase (F3′H), anthocyanin reductase (ANR), and coumaric acid-CoA hydroxylase (CoumCoA3H), and these findings are basically consistent with previous reports on the leaf composition of red- and purple-leaved plants [33,34]. The synthesis of anthocyanins begins with the phenylalanine pathway followed by the flavonoid pathway, and the reactions are catalysed by a series of enzymes [35–37]. Chalcone synthase (CHS) is condensed against coumaroyl coenzyme A to produce naringenin chalcone. The F3H gene forms a key substance, DHK, for subsequent anthocyanin synthesis. F3′H catalyses the formation of 2R from DHK 3R-dihydroquercetin. DFR catalyses the formation of colourless proanthocyanidins from dihydroflavonol and synthesizes the corresponding flavonoid products (catechins) [38,39]. ANR catalyses the reduction of anthocyanin glycosides to synthesize corresponding epicatechins and epigallocatechins. UFGT glycosylation makes anthocyanin more stable [13,40]. The literature reveals a competitive relationship between ANR and UFGT. The upregulation of ANR expression increases the procyanidin catechins and decreases the anthocyanin content [41,42]. This finding is consistent with our results that the CHS, F3H, F3′H, and DFR genes were significantly upregulated at H5 and that the ANR genes are significantly downregulated at H5, which can explain the increase in the anthocyanin content observed in leaves at H5.
Because this study focused on E. ulmoides ‘Hongye’ leaves at two developmental stages, the same genes were expressed in the leaves. The expression of genes at different stages shows spatial and temporal specificity and is regulated by a series of TFs. Therefore, the difference in leaf colour might be only due to a difference in gene expression regulation. In this study, the MYB and bHLH genes, which showed differential expression at the H5 and H1 phases, were selected, and the expression of TFs was downregulated at the H5 phase. The MYB and bHLH gene families are closely related to anthocyanin synthesis [43,44]. By transforming the MYB genes of different plants, the leaves or flowers of model plants can become red or purple [45,46]. For example, the activation of MYB182 inhibits the expression of structural and regulatory genes in the anthocyanin biosynthesis pathway and thereby reduces the accumulation of poplar anthocyanins [47]. The overexpression of the Ginkgo biloba transcription repressor GbMYBF2 in Arabidopsis significantly inhibits the synthesis of anthocyanin and the expression of most structural genes, such as CHS, F3H, FLS, and ANS [48].
Interestingly, the anthocyanin content increased during the H5 period in our study. Therefore, we speculated that ANR enzyme genes may be targeted by TFs. As mentioned previously, ANR genes can reversely regulate the content of anthocyanins in plant tissues, and the downregulation of ANR gene expression results in the accumulation of anthocyanins in plant tissues [49]. This method regulating anthocyanin accumulation is functionally similar to the negative regulation of the MYB gene. The ANR pathway is likely a newly identified pathway through which plants regulate anthocyanins, but the reason for the accumulation of anthocyanins only in Eucommia ulmoides ‘Hongye’ palisade tissue remains unclear.
In this study, pigment contents were compared between E. ulmoides ‘Hongye’ and E. ulmoides ‘Xiaoye’. The results from a physiological analysis indicated that the contents of flavonoids and anthocyanins in E. ulmoides ‘Hongye’ were significantly higher than those in E. ulmoides ‘Xiaoye’. Anthocyanins and flavonoids are two of the main factors in the formation of red leaves in E. ulmoides ‘Hongye’. The leaves of E. ulmoides ‘Hongye’ exhibited a gradual change in colour from green to red during its growth because the increase in the chlorophyll content was less than the increase in the anthocyanin content. This study explored the transcriptome information of the red traits of E. ulmoides ‘Hongye’ and compared the DEGs involved in pigment biosynthesis between H1 and H5. Some key genes, such as CHS, F3H, DFR, F3′H, ANR, CoumCoA3H, MYB, bHLH, B3, NAC and HSF, were discovered to be involved in the flavonoid and anthocyanin biosynthesis pathways. MYB likely participates in the leaf colouration mechanisms of E. ulmoides by regulating the expression of ANR. The results provide a reference for further study on the leaf colouration mechanism of E. ulmoides.
Acknowledgement: Funding from the Tree Genetics and Breeding (Chinese Academy of Forestry) Foundation is greatfully acknowledged.
Funding Statement: [Natural Science Foundation of Henan Province of China (202300410554); Key R&D and Promotion Project of Henan Province (Science and Technology Research) (192102110169, 202102110229)].
Conflicts of Interest: The authors declare that they have no conflicts of interest to report regarding the present study.
1. Hsu, C., Chen, Y., Tsai, W., Chen, W., Chen, H. (2015). Three R2R3-MYB transcription factors regulate distinct floral pigmentation patterning in phalaenopsis spp. Plant Physiology, 168(1), 175–191. DOI 10.1104/pp.114.254599. [Google Scholar] [CrossRef]
2. Xing, W. Z., Fei, Y. Y., Li, C., Yan, Q. H., Xue, L. Y. et al. (2016). Advances in leaf pigment composition, structure and photosynthetic characteristics of colored-leaf plants. Plant Physiology Communications, 52(1), 1–7. DOI 10.3969/j.issn.0517-6611.2018.24.027. [Google Scholar] [CrossRef]
3. Treutter, D. (2005). Significance of flavonoids in plant resistance and enhancement of their biosynthesis. Plant Biology, 7(6), 581–591. DOI 10.1055/s-2005–873009. [Google Scholar] [CrossRef]
4. Page, M., Sultana, N., Paszkiewicz, K., Florance, H., Smirnoff, N. (2012). The influence of ascorbate on anthocyanin accumulation during high light acclimation in Arabidopsis thaliana: Further evidence for redox control of anthocyanin synthesis. Plant, Cell & Environment, 35(2), 388–404. DOI 10.1111/j.1365-3040.2011.02369.x. [Google Scholar] [CrossRef]
5. Sun, Y., Li, H., Huang, J. R. (2012). Arabidopsis TT19 functions as a carrier to transport anthocyanin from the cytosol to tonoplasts. Molecular Plant, 5(2), 387–400. DOI 10.1093/mp/ssr110. [Google Scholar] [CrossRef]
6. Zhang, Y., Zhang, J., Song, T., Li, J., Tian, J. et al. (2014). Low medium pH value enhances anthocyanin accumulation in malus crabapple leaves. PLoS One, 9(6), e97904. DOI 10.1371/journal.pone.0097904. [Google Scholar] [CrossRef]
7. Xiang, Y., Liu, Y. B., Zhao, D. G., Li, Y. (2015). Improve drought tolerance via accumulating anthocyanidin under drought stress in TPS1 transgenic maize. Plant Physiology Journal, 51(11), 2054–2062. DOI 10.13592/j.cnki.ppj2015.0523. [Google Scholar] [CrossRef]
8. Lou, Q., Liu, Y., Qi, Y., Jiao, S., Tian, F. (2014). Transcriptome sequencing and metabolite analysis reveals the role of delphinidin metabolism in flower colour in grape hyacinth. Journal of Experimental Botany, 65(12), 3157–3164. DOI 10.1093/jxb/eru168. [Google Scholar] [CrossRef]
9. Shi, S., Gao, Y., Zhang, X., Sun, J., Zhao, L. et al. (2011). Progress on plant genes involved in biosynthetic pathway of anthocyanins. Bulletin of Botanical Research, 31(5), 633–640. DOI 10.7525/j.issn.1673-5102.2011.05.020. [Google Scholar] [CrossRef]
10. Lin, L., Mu, H., Jiang, J., Liu, G. (2013). Transcriptomic analysis of purple leaf determination in birch. Gene, 526(2), 251–258. DOI 10.1016/j.gene.2013.05.038. [Google Scholar] [CrossRef]
11. Boss, P. K., Davies, C., Robinson, S. P. (1996). Expression of anthocyanin biosynthesis pathway genes in red and white grapes. Plant Molecular Biology, 32(3), 565–569. DOI 10.1007/BF00019111. [Google Scholar] [CrossRef]
12. Holton, T. A., Cornish, E. C. (1995). Genetics and biochemistry of anthocyanin biosynthesis. Plant Cell, 7(7), 1071–1083. DOI 10.1105/tpc.7.7.1071. [Google Scholar] [CrossRef]
13. Su, F. Y., Yao, Y. X., Li, C. L. (2015). Transcription group and expression spectrum analysis of the accumulation of tomato chrysanthemum. Acta Horticulturae Sinica, 42(S1), 2629. DOI 10.16420/jis0513-353Xx,2015-2629.9. [Google Scholar] [CrossRef]
14. Cheng, G., Zhou, S. H., Zhang, J. H., Zhang, Y., Guan, J. et al. (2017). Analysis of anthocyanin composition and genes expression patterns of Vitis quinquangularis × V. vinifera ‘NW196’. Acta Horticulturae Sinica, 44(6), 1073–1084. DOI 10.16420/j.issn.0513-353x.2016-0693. [Google Scholar] [CrossRef]
15. Li, Y. K., Fang, J. B., Lin, M. M., Li, Z., Sun, S. H. et al. (2017). Effect of bagging on expression of crucial structural genes of anthocyanin biosynthesis in ‘Tianyuanhong’ kiwifruit based on RNA-seq. Journal of Fruit Science, 34(12), 1509–1519. DOI 10.13925/j.cnki.gsxb.20170127. [Google Scholar] [CrossRef]
16. Tian, P., Kang, B. S., Wei, W. D., Su, Y. L. (2011). Analysis of the transcription profiles of the flavonoid-related genes in the red skin of the different pear varieties. Acta Botanica Boreali-Occidentalia Sinica, 31(12), 2437–2442. [Google Scholar]
17. Chen, W. L., Zhao, C. L., Zhi, W. T., Liao, K. R., Wang, W. Y. et al. (2013). Progress of regulation of anthocyanin biosynthesis in higher plants. Chinese Agricultural Science Bulletin, 29(33), 271–276. DOI 10.3969/j.issn.1000-6850.2013.33.047. [Google Scholar] [CrossRef]
18. He, X., Zhao, X., Gao, L. P., Shi, X. X., Dai, X. L. et al. (2018). Isolation and characterization of key genes that promote flavonoid accumulation in purple-leaf tea (Camellia sinensis L.). Scientific Reports, 8, 130. DOI 10.1038/s41598-017–18133-z. [Google Scholar] [CrossRef]
19. Zhao, D. Q., Tao, J. (2015). Recent advances on the development and regulation of flower color in ornamental plants. Frontiers in Plant Science, 6, 261. DOI 10.3389/fpls.2015.00261. [Google Scholar] [CrossRef]
20. Zhu, Z. X., U., L., Q., Y. (2016). Plant color mutants and the anthocyanin pathway. Chinese Bulletin of Botany, 51(1), 107–119. DOI 10.11983/CBB15059. [Google Scholar] [CrossRef]
21. Liu, X. Y., Han, H. Q., Ge, H. Y., Jiang, M. M., Chen, H. Y. (2014). Cloning, expression and interaction of anthocyaninrelated transcription factors SmTTG1, SmGL3 and SmTT8 in eggplant. Acta Horticulturae Sinica, 41(11), 2241–2249. DOI 10.16420/j.issn.0513-353x.2014.11.011. [Google Scholar] [CrossRef]
22. Zhu, J., Li, F., Wang, B. (2014). Comparison of leaf pigment content among three ornamental Eucommia ulmoides varieties. Forest Research, 27(4), 562–564. DOI 10.3969/j.issn.0517-6611.2018.24.027. [Google Scholar] [CrossRef]
23. Wang, X. Y. (2016). The research on buds and callus induction and generation of different exophyte of Eucommia ulmoides ‘Hongye’ (M.D. Thesis). Central South University of Forestry and Technology, Changsha. [Google Scholar]
24. Fernández-López, J. A., Almela, L., Muñoz, J. A., Hidalgo, V., Carreño, J. (1998). Dependence between colour and individual anthocyanin content in ripening grapes. Food Research International, 31(9), 667–672. DOI 10.1016/S0963-9969(99)00043-5. [Google Scholar] [CrossRef]
25. Fadeel, A. A. (1962). Location and properties of chloroplasts and pigment determination in roots. Physiologia Plantarum, 15(1), 130–146. DOI 10.1111/j.1399-3054.1962.tb07994.x. [Google Scholar] [CrossRef]
26. Rabino, I., Mancinelli, A. L. (1986). Light, temperature, and anthocyanin production. Plant Physiology, 81(3), 922–924. DOI 10.1104/pp.81.3.922. [Google Scholar] [CrossRef]
27. Kim, D., Langmead, B., Salzberg, S. L. (2015). HISAT: A fast spliced aligner with low memory requirements. Nature Methods: Techniques for Life Scientists and Chemists, 12(4), 357–360. DOI 10.1038/nmeth.3317. [Google Scholar] [CrossRef]
28. Kim, D., Leek, J. T., Pertea, G. M., Salzberg, S. L., Pertea, M. (2016). Transcript-level expression analysis of RNA-seq experiments with HISAT, StringTie and Ballgown. Nature Protocols: Recipes for Researchers, 11(9), 1650–1667. DOI 10.1038/nprot.2016.095. [Google Scholar] [CrossRef]
29. Roberto, V. A., Sandor, P. L., Leonardo, M. R., David, L. (2019). TPM calculator: One-step software to quantify mRNA abundance of genomic features. Bioinformatics, 35(11), 1960–1962. DOI 10.1093/bioinformatics/bty896. [Google Scholar] [CrossRef]
30. Simon, A., Theodor, P. P., Wolfgang, H. (2015). HTSeq–A Python framework to work with high-throughput sequencing data. Bioinformatics, 31(2), 166–169. DOI 10.1093/bioinformatics/btu638. [Google Scholar] [CrossRef]
31. Anders, S., Huber, W. (2010). Differential expression analysis for sequence count data. Genome Biology, 11(21), 1344–1349. DOI 10.1186/gb-2010–11-10–r106. [Google Scholar] [CrossRef]
32. Wu, J., Mao, X., Cai, T., Luo, J., Wei, L. (2006). KOBAS server: A web-based platform for automated annotation and pathway identification. Nucleic Acids Research, 34(suppl_2), W720–W724. DOI 10.1093/nar/gkl167. [Google Scholar] [CrossRef]
33. Xie, C., Mao, X., Huang, J., Ding, Y., Wu, J. et al. (2011). KOBAS 2.0: A web server for annotation and identification of enriched pathways and diseases. Nucleic Acids Research, 39(suppl_2), W316–W322. DOI 10.1093/nar/gkr483. [Google Scholar] [CrossRef]
34. Du, Q., Qing, J., Zhu, J., Du, H., Du, L. (2017). Pigments and active ingredients in leaves of seven Eucommia ulmoides variation-types. Bulletin of Botanical Research, 37(3), 468–473. DOI 10.7525/j.issn.1673-5102.2017.03.019. [Google Scholar] [CrossRef]
35. Ma, S. X., Yang, Y., Jin, K. (2018). Investigation of the red leaf woody plants in zhengzhou and coloring tissue analysis. Journal of Anhui Agricultural Sciences, 46(24), 81–84. DOI 10.3969/j.issn.0517-6611.2018.24.027. [Google Scholar] [CrossRef]
36. Hughes, N. M. (2011). Winter leaf reddening in ‘evergreen’ species. New Phytologist, 190(3), 573–581. DOI 10.1111/j.1469-8137.2011.03662.x. [Google Scholar] [CrossRef]
37. Peng, S., Zhang, C., Ren, L., Li, C., Cheng, T. et al. (2013). Analysis on leaf color variation of Eucommia ulmoides. Journal of Zhejiang Forestry Science and Technology, 33(3), 61–66. DOI 10.3969/j.issn.1001-3776.2013.03.015. [Google Scholar] [CrossRef]
38. Petroni, K., Tonelli, C. (2011). Recent advances on the regulation of anthocyanin synthesis in reproductive organs. Plant Science, 181(3), 219–229. DOI 10.1016/j.plantsci.2011.05.009. [Google Scholar] [CrossRef]
39. Forkmann, G., Ruhnau, B. (1987). Distinct substrate specificity of dihydroflavonol 4-reductase from flowers of Petunia hybrida. Zeitschrift Für Naturforschung C, 42(9–10), 1146–1148. DOI 10.1515/znc-1987–9-1026. [Google Scholar] [CrossRef]
40. Castellarin, S. D., Gaspero, G. D., Marconi, R., Nonis, A., Peterlunger, E. et al. (2006). Colour variation in red grapevines (Vitis vinifera L.Genomic organisation, expression of flavonoid 3′–hydroxylase, flavonoid 3′,5′–hydroxylase genes and related metabolite profiling of red cyanidin–/blue delphinidin-based anthocyanins in berry skin. BMC Genomics, 7(1), 12. DOI 10.1186/1471-2164–7-12. [Google Scholar] [CrossRef]
41. Liu, Y., Shi, Z., Maximova, S., Payne, M. J., Guiltinan, M. J. (2013). Proanthocyanidin synthesis in Theobroma cacao: Genes encoding anthocyanidin synthase, anthocyanidin reductase, and leucoanthocyanidin reductase. BMC Plant Biology, 13(1), 202. DOI 10.1186/1471-2229-13-202. [Google Scholar] [CrossRef]
42. Xia, T., Gao, L. (2009). Advances in biosynthesis pathways and regulation of flavonoids and catechins. Scientia Agricultura Sinica, 42(8), 2899–2908. DOI 10.3864/j.issn.0578-1752.2009.08.031. [Google Scholar] [CrossRef]
43. Colanero, S., Tagliani, A., Perata, P., Gonzali, S. (2020). Alternative splicing in the anthocyanin fruit gene encoding an R2R3 MYB transcription factor affects anthocyanin biosynthesis in tomato fruits. Plant Communications, 1(1), 100006. DOI 10.1016/j.xplc.2019.100006. [Google Scholar] [CrossRef]
44. Xu, W., Dubos, C., Lepiniec, L. (2015). Transcriptional control of flavonoid biosynthesis by MYB-bHLH–WDR complexes. Trends in Plant Science, 20(3), 176–185. DOI 10.1016/j.tplants.2014.12.001. [Google Scholar] [CrossRef]
45. Kim, E. S., Chang, E. H., Hur, Y. Y., Kim, T. W., Jung, S. M. (2015). Anthocyanin contents and composition of VlmybA1-2 and VlmybA2 genes in Vitis labrusca hybrid grape cultivars and cross seedlings. Plant Omics, 8(5), 472–478. DOI 10.3316/informit.516994550945748. [Google Scholar] [CrossRef]
46. Shin, D. H., Cho, M., Choi, M. G., Das, P. K., Lee, S. K. et al. (2015). Identification of genes that may regulate the expression of the transcription factor production of anthocyanin pigment 1 (PAP1)/MYB75 involved in Arabidopsis anthocyanin biosynthesis. Plant Cell Reports, 34(5), 805–815. DOI 10.1007/s00299-015-1743-7. [Google Scholar] [CrossRef]
47. Kazuko, Y., Dawei, M., Peter, C. C. (2015). The MYB182 protein down-regulates proanthocyanidin and anthocyanin biosynthesis in poplar by repressing both structural and regulatory flavonoid genes. Plant Physiology, 167(3), 693. DOI 10.1104/pp.114.253674. [Google Scholar] [CrossRef]
48. Xu, F., Ning, Y., Zhang, W., Liao, Y., Li, L. et al. (2014). An R2R3-MYB transcription factor as a negative regulator of the flavonoid biosynthesis pathway in Ginkgo biloba. Functional & Integrative Genomics, 14(1), 177–189. DOI 10.1007/s10142-013-0352-1. [Google Scholar] [CrossRef]
49. Zhen, Y. (2017). Molecular mechanism on expression of red leaf color in Camellia japonica ‘Jinghua Meinu’ (Ph.D. Thesis). Chinese Academy of Forestry, Beijing. [Google Scholar]
 | This work is licensed under a Creative Commons Attribution 4.0 International License, which permits unrestricted use, distribution, and reproduction in any medium, provided the original work is properly cited. |