| Phyton-International Journal of Experimental Botany |
DOI: 10.32604/phyton.2022.018104
ARTICLE
Population Structure Analysis and Genome-Wide Association Study of Tea (Camellia sinensis (L.) Kuntze) Germplasm in Qiannan, China, Based on SLAF-Seq Technology
1The Key Laboratory of Plant Resources Conservation and Germplasm Innovation in Mountainous Region (Ministry of Education), Institute of Agro-Bioengineering and College of Life Sciences, Guizhou University, Guiyang, 550025, China
2College of Tea Sciences, Guizhou University, Guiyang, 550025, China
*Corresponding Author: Yan Li. Email: yli@gzu.edu.cn; Yichen Zhao. Email: yczhao@gzu.edu.cn
Received: 29 June 2021; Accepted: 14 September 2021
Abstract: Duyun Maojian tea is a famous tea in China. In this study, the specific-locus amplified fragment (SLAF) sequencing method was used to analyze the population structure and conduct a genome-wide association study (GWAS) of 2 leaf traits of 123 tea plants in Qiannan, China. A total of 462,019 SLAF tags and 11,362,041 single-nucleotide polymorphism (SNP) loci were obtained. The results of phylogenetic tree analysis, cluster analysis, and principal component analysis showed that 123 tea germplasms were clustered into three groups, and the heterozygosity rates for Groups I, II, and II were 0.206, 0.224, and 0.34, respectively. Generally, tea germplasms in a production area are clustered in a group, indicating that tea germplasms in different production areas have certain genetic diversity. The traditional Duyun Maojian tea core production areas, TS and DC-SJ, are clustered into Group I and Group II respectively, while the ZY production area is relatively independent in Group III. Furthermore, based on GWAS analysis, 11 candidate genes related to leaf apex and 7 candidate genes related to leaf shape were obtained. This study clarified the genetic relationship among eight Duyun Maojian tea production areas and obtained candidate genes related to leaf apex and leaf shape development. The results showed that population structure and candidate genes are an effective basis for the breeding of Duyun Maojian tea germplasm.
Keywords: Duyun maojian tea plant; SLAF-seq; SNP; genetic structure; leaf character; GWAS
Tea plant (Camellia sinensis (L.) Kuntze,2n = 30) is an important cash crop in the Camellia genus that is widely planted in many countries, including Kenya, Sri Lanka, India, and China [1]. Tea has a long history of cultivation in southwest China and there are a rich variety of tea plants [2]. Duyun Maojian tea is produced in Qiannan, Guizhou Province, Southwest China, and it is a geographical landmark agricultural product. However, due to the lack of resource identification and variety breeding, Duyun Maojian tea lacks distinguished high-quality tea varieties, which has become one of the factors restricting the development of Duyun Maojian tea.
Specific-locus amplified fragment sequencing (SLAF-seq) is a simplified genome sequencing technology that uses bioinformatics to analyze the reference genome and design a suitable enzymatic cleavage scheme. Then, SLAF libraries are constructed according to the digestion scheme, SLAF fragments of specific length are selected for sequencing, and the information obtained from sequencing is compared with the reference genome to develop a large number of single nucleotide polymorphic (SNP) loci with high stability and specificity [3]. SLAF-seq has the advantages of high throughput, high accuracy, short cycle time and low cost [4]. This technique has been widely used in genetic diversity analysis [5], high-density genetic map construction [6], and germplasm resources identification [7]. At present, it has been widely used to develop high-density molecular labels in plants that include tea plant [8,9], rice [10,11], maize [12,13], barley [14,15], bean [16,17], rape [18,19], peanut [20,21], potato [22], soybean [23,24] and other plants.
Genome-wide association studies (GWASs) use a large number of SNPs to conduct control analysis or association analysis at the genome-wide level, screen the genetic variation most likely to affect a trait according to the significance p value, and then mine the genes related to trait variation. At present, many studies have used the molecular markers developed by SLAF-seq for GWAS analysis, and screened many important functional genes in tea plant [8,9], rice [10,11], barley [14,15], rape [18,19] and soybean [23,24].
The leaf character of tea plant, which determines the quality of tea, is an important selection index of breeding. Therefore, in order to understand the genetic relationship between 8 production areas of Duyun Maojian tea in Qiannan of Guizhou Province and the related genes of tea leaf apex and leaf shape development, we conducted population structure analysis and genome-wide association analysis on 123 tea plants from 8 production areas, hoping to provide a reference for further resource identification and variety breeding of Duyun Maojian tea. In this study, a total of 462,019 SLAF tags were obtained by SLAF-seq and 11,362,041 high-quality SNPs were developed. The obtained SNPs were used for population structure analysis and genome-wide association analysis. The 123 tea plants were clustered into 3 groups, and 11 and 7 genes related to leaf apex and leaf shape were obtained, respectively.
2.1 Plant Material and Phenotypic Statistics
A total of123 tea plants naturally grow in eight Duyun Maojian tea production areas in Qiannan (26.27°N, 107.52°E), Guizhou Province, Southwest China. Three mature and healthy leaves were collected from each tea plant as experimental materials, and the tea leaves were put into a zipper plastic bag filled with silica gel and preserved. The tea plant producing areas and two leaf characters, leaf apex and leaf shape, were recorded for 125 tea plants. According to the morphological classification standard of tea leaves, the leaf apex can be divided into acuminate and obtuse. The leaf shape is determined according to the ratio of length to width of leaf R: if R < 2.47 the shape is an ellipse, if 2.47 < R < 2.96 the shape is a long ellipse, and if R > 2.98 the shape is lanceolate. N66 and D01 were used as external reference tea plants in this experiment. N66 was Qian tea 8 (produced in Meitan County, Guizhou Province), and D01 was Longjing-changye (produced in Qiannan, Guizhou). Experiments were conducted at the Crop Germplasm Resource Center, Institute of Agricultural Bioengineering, Guizhou University (Guizhou, China).
The genomic DNA, of 123 tea samples were extracted by CTAB [25], using the following procedure: 1) First, 0.5 g fresh tea leaves was placed into a 2-mL centrifuge tube, two sterilized steel balls were added, and the tea leaves was frozen with liquid nitrogen and ground with a ball mill. 2) One milliliter of CTAB extract preheated to 65°C and 2% mercaptoethanol were added, shaken, and mixed on a vortex oscillator to completely suspend the sample. 3) The sample was placed in a 65°C oven warm bath for 40–60 min, shaken well 2–3 times during the warm bath, and cooled to room temperature. The sample was centrifuged at 12000 rpm for 5 min, then 900 μL supernatant was added to a new 2-mL sterile centrifuge tube with an equal volume of chloroform/isoamyl alcohol (24:1), mixed upside down, and centrifuged at 12000 rpm for 20 min. 4) Seven hundred microliters of supernatant was collected into a new 2-mL sterile centrifuge tube, and an equal volume of chloroform isoamyl alcohol (24:1) was added, mixed upside down, and centrifuged at 12000 rpm for 20 min. Then, 450 μL of supernatant was collected in a new 1.5-mL sterile centrifuge tube, and 300 μL isopropanol and 45 μL of 3M sodium acetate, mix well, and place at −20°C for 1 h. 5) The tube was centrifuged at 12000 rpm for 10 min, the supernatant was discarded, the tube was centrifuged instantaneously, and the excess liquid at the gun head was removed and discarded. 6) One milliliter of 75% ethanol solution was added to the precipitation and flicked until the precipitation was suspended. It was then centrifuged at 12000 rpm for 5 min and the supernatant was discarded. 7) Instantaneous centrifugation was performed, the gun head absorbed and discarded the excess liquid, and the centrifuge tube was opened and dried at room temperature for 3–5 min until the DNA precipitation was translucent. 8) An appropriate amount of ultrapure water containing 10 ng/μL RNaseA was added to dissolve the DNA precipitation. 9) After DNA concentration and purity were detected by nanodrop spectrophotometer (Thermo Scientific, USA) [26], it was stored in a −20°C refrigerator for standby.
2.3 SLAF-Seq Library Construction and High-Throughput Sequencing
Through the tea plant reference genome (http://tpia.teaplant.org/download.html. Camellia sinensis var. assamica (cultivar yunkang#10)), the electronic restriction enzyme digestion scheme was predicted by restriction digest method, and the HaeIII + EcoRV-HF ®enzyme digestion was selected. The genomic DNA of the tea plants was digested with restriction endonuclease, and the sequences with lengths of 364–394 bp were defined as SLAF tags. The end of the enzyme slice was sequentially added with Poly (A), ligated with dual-index adapter, and polymerase chain reaction amplification, purification, sample mixing, and gel cutting were used to select the target fragments to construct the SLAF-seq library. Illumina HiSeq X Ten system was used for paired-end sequencing.
The reads obtained by sequencing were compared with the tea reference genome using the BWA-MEM-M method of the BWA software (ver.0.7.15) [27]. Using GATK software (ver.3.8) [28] and SAMTOOLS software [29] to develop SNPs, the SNPs intersection obtained by the two methods was used as the final reliable SNPs data set. Using SnpEff software (ver.4.3i) [30] to annotate the SNPs results.
2.5 Phylogenetic and Population Structure Analyses
Based on the SNPs obtained, the clustering of 123 samples was analyzed using the Admixture program (ver.1.22) [31]. The number of clusters (K) was predefined as 1–10, and the clustering results were cross-validated. According to the valley value of cross validation error rate, the optimal number of clusters was determined.
Using MEGA X software [32], based on the neighbor-joining method, the Kimura 2-parameter model was used, and bootstrap was repeated 1000 times to construct the phylogenetic tree. Principal component analysis (PCA) was carried out by EIGENSOFT software (ver.6.0) [33] to obtain the clustering of 123 tea plants.
2.6 Genome-Wide Association Analysis
The association analysis of leaf traits was carried out by using TASSEL software [34], the P value of each SNP locus was obtained, and the SNP loci with P-value < 10−6 were defined as significant associations. The mixed linear model formula of TASSEL software was as follows:
3.1 Statistics of Tea Leaf Characters
The leaf traits of 123 tea samples were statistically analyzed. There were five phenotypes in leaf apex and leaf shape (Fig. 1). The leaf apex is mainly acuminate (76%), and a small portion was obtuse (24%). The leaf shapes were mainly divided into ellipse (32.8%) and long ellipse (56%), and a small portion was lanceolate (11.2%) (Table S1).
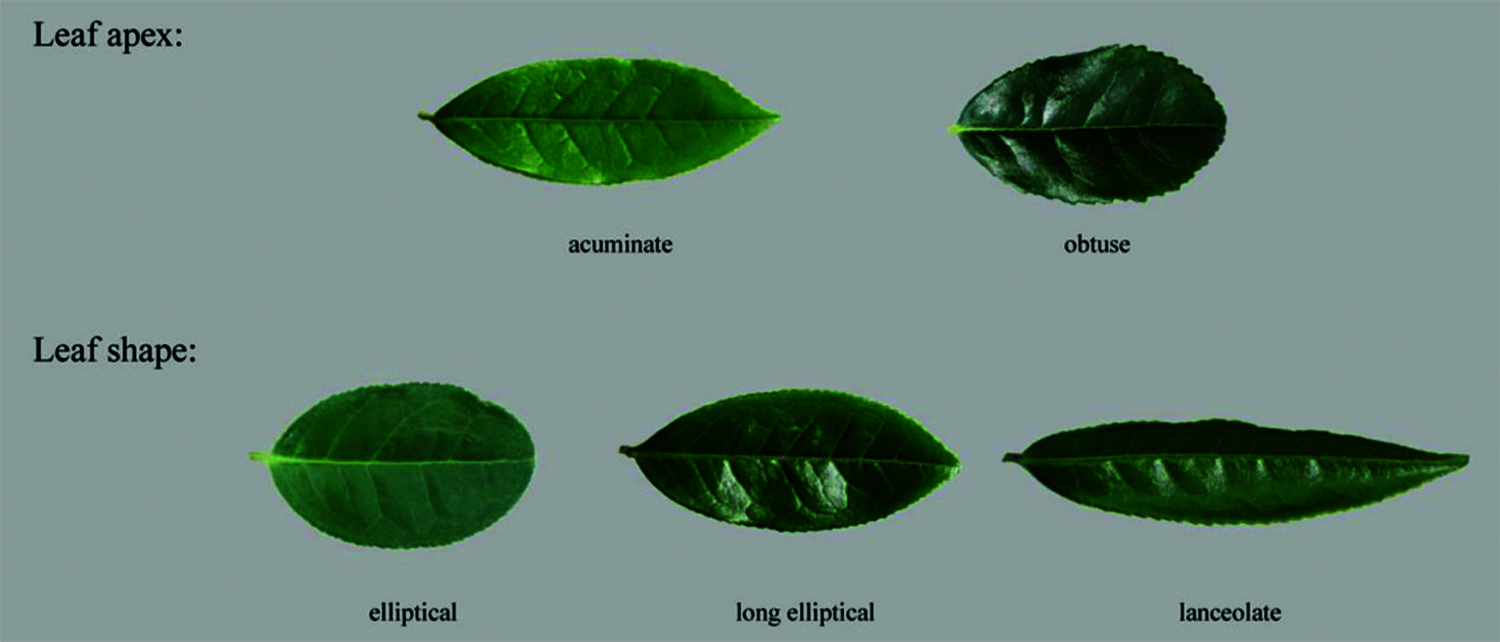
Figure 1: Leaf apex and leaf shape traits of tea plants. The leaf apex of 123 tea plants can be divided into acuminate and obtuse, and the leaf shape can be divided into ellipse, long ellipse and lanceolate
A total of 355.89 MB of reading data were obtained by sequencing; the base-calling accuracy (Q score > 30) was 95.82%, and the average GC content was 43.69%. After comparison, a total of 462,019 SLAF tags were obtained, of which 384,522 were polymorphic SLAF tags, with an average polymorphism rate of 83.23% and an average sequencing depth of 10.19x. The number of SLAF tags in each tea sample ranged from 140,798 to 247,884, The distribution map of SLAF tags on some scaffolds was drawn (Fig. 2), which revealed that the distribution of SLAF tags on scaffolds was uniform.
According to the sequence alignment between reads and the tea reference genome, a total of 11,362,041 SNPs were detected, with an average heterozygosity of 5.54%. The number of SNPs in each tea plant ranged from 3,150,503 to 5,122,941. The SNPs distribution map on part of the scaffold was drawn (Fig. 3), which showed that SNPs were uniformly distributed on the Scaffold.
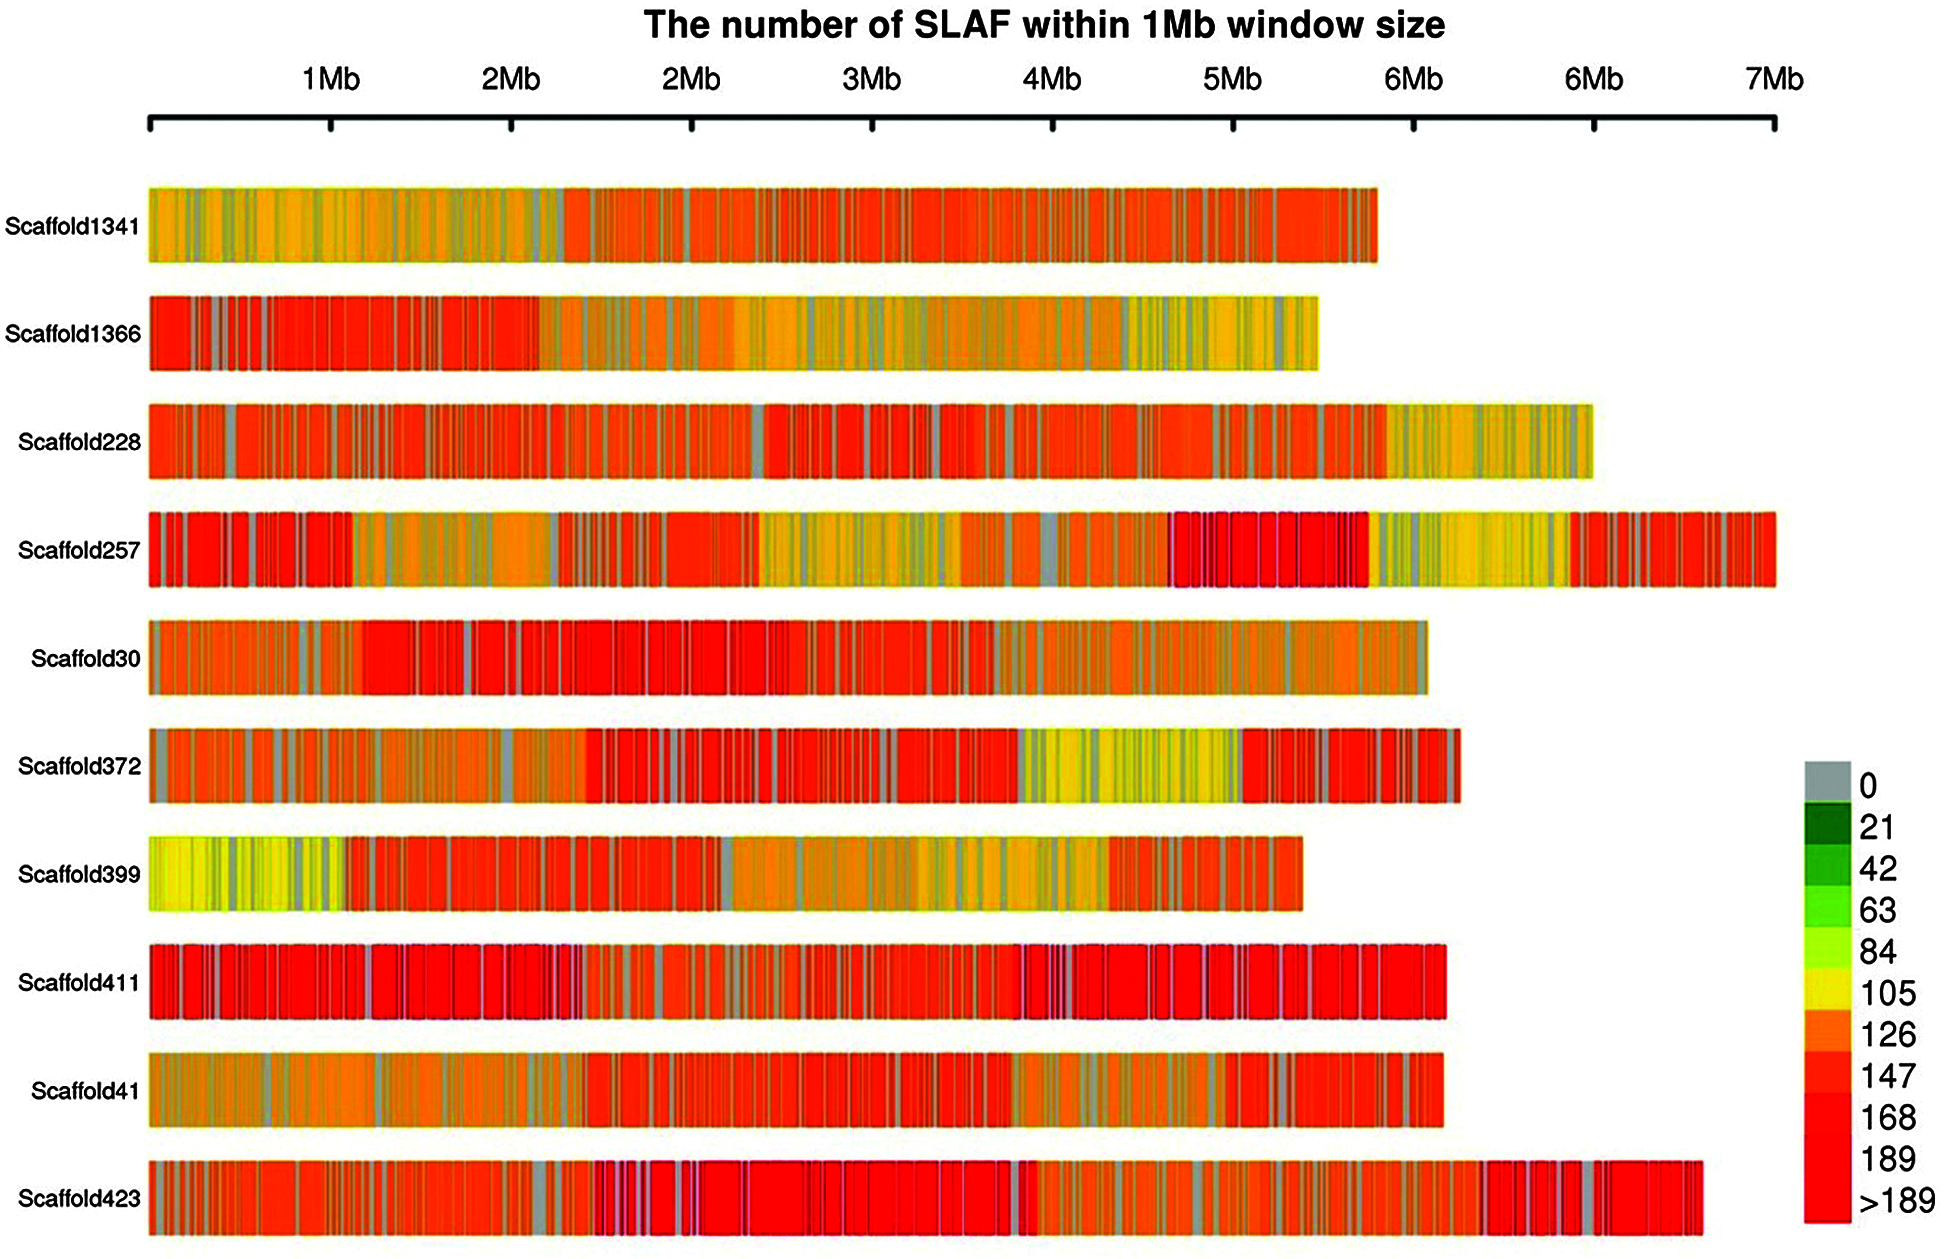
Figure 2: Distribution of SLAF tags on scaffold. The abscissa is the length of scaffold, and each band represents a scaffold. The genome is divided according to the size of 1 MB. The more SLAF tags in each window, the darker the color, the less the number of SLAF tags, and the lighter the color; The darker the area in the graph, the area where the SLAF tags are concentrated
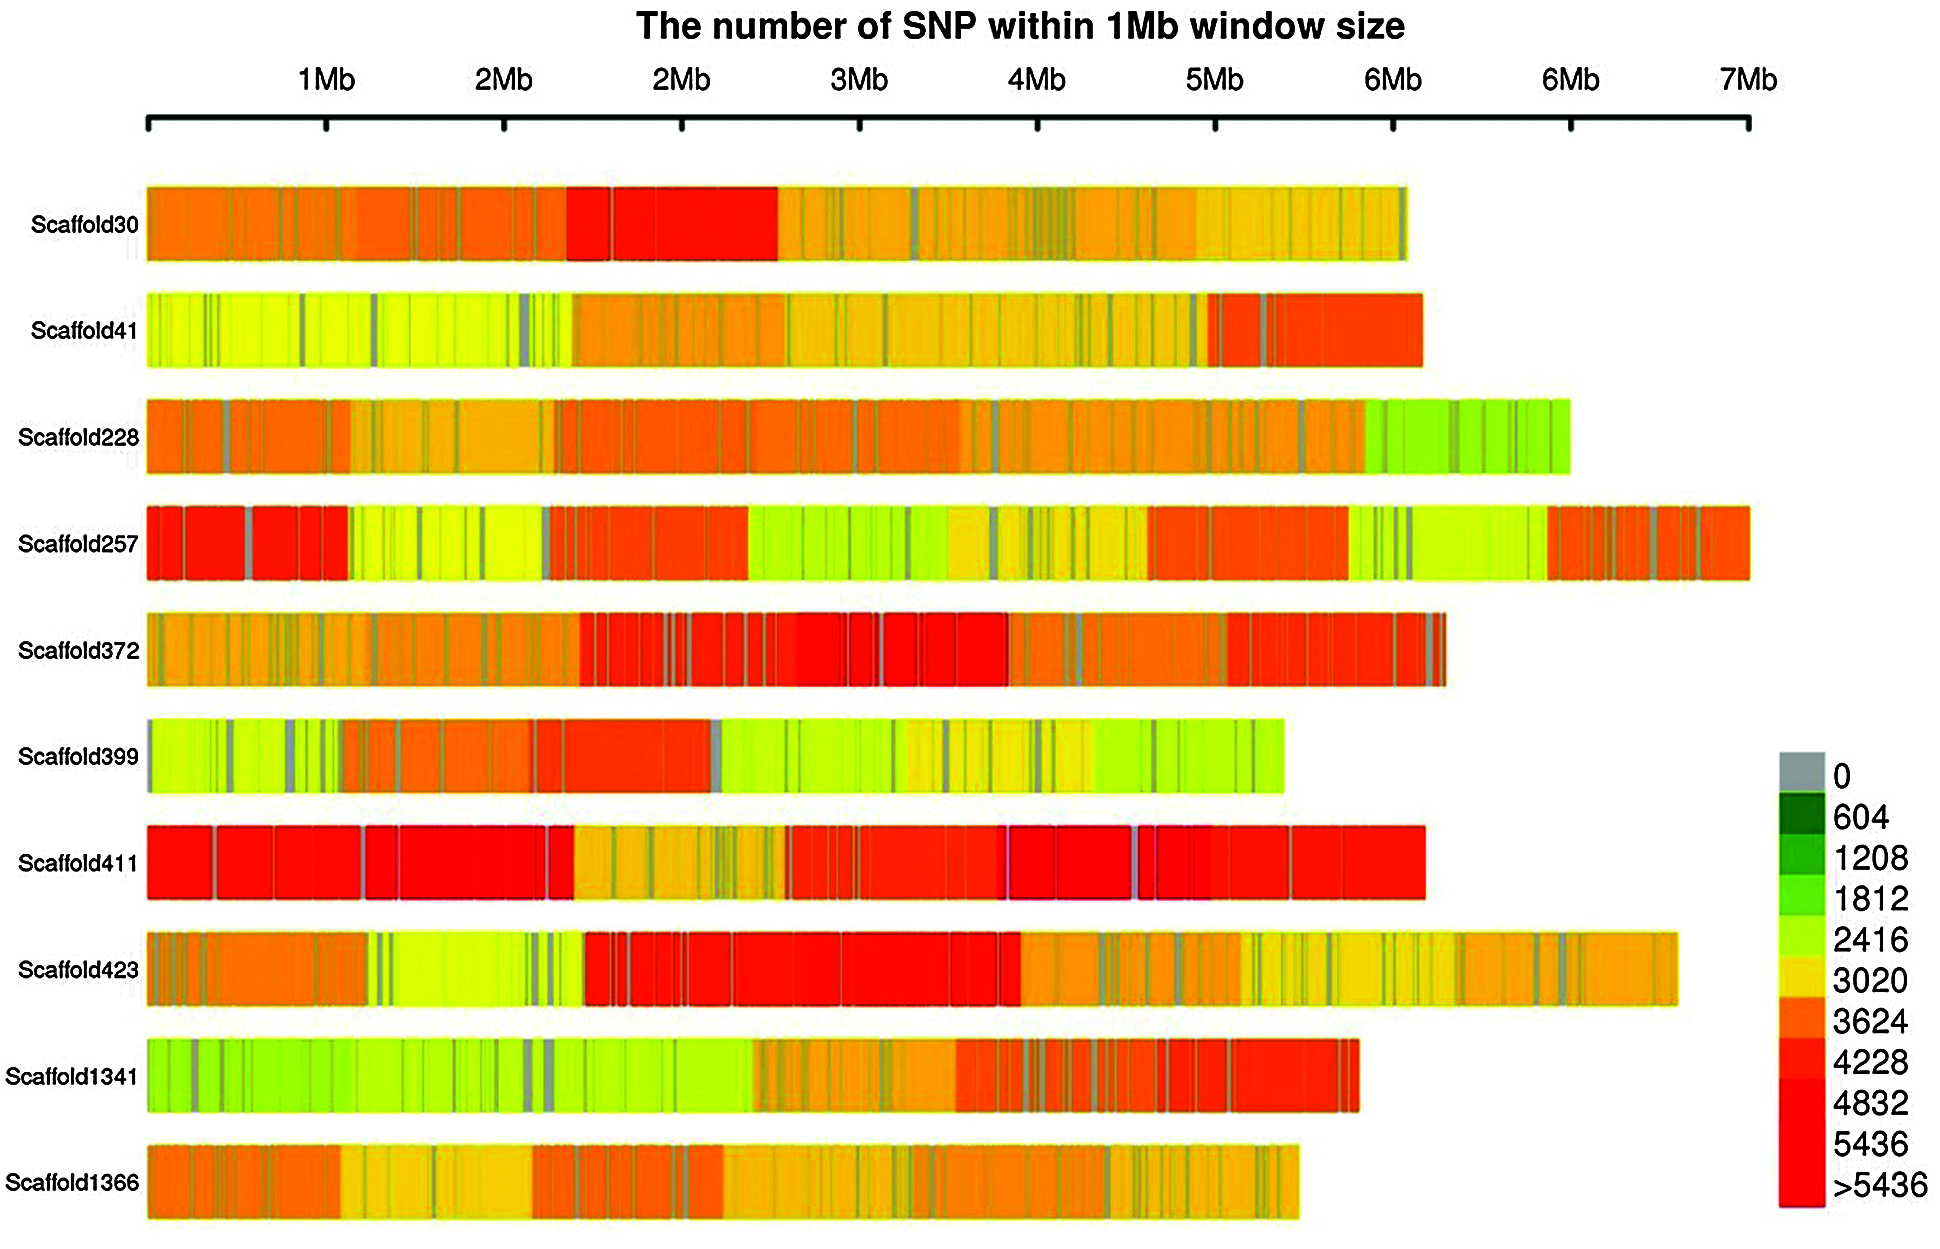
Figure 3: Distribution of SNPs on scaffold. The abscissa is the length of scaffold, and each band represents a scaffold. The genome is divided according to the size of 1 MB. The more SNPs in each window, the darker the color, the fewer SNPs, and the lighter the color; The darker the color is, the more SNPs are distributed
3.3 Population Structure Analyses
Total of 123 tea plants were analyzed by Population structure analysis, and the number of subgroups (k value) was set as 1–10 in advance (Fig. 4). The results show that when k = 3, CV is the lowest (Fig. 5), indicated that 123 tea plants should be divided into three groups. This finding was consistent with the results of phylogenetic tree analysis (Fig. 6a) and PCA analysis (Fig. 6b). The heterozygosity rates of Group I, Group II, and Group III were 0.206, 0.224, and 0.34, respectively. The heterozygosity rate of Group I (including 66 tea plants) was the lowest, similar to that of Group II (including 33 tea plants), indicating that the genetic diversity within the two groups was low. The heterozygosity of Group III (including 24 tea plants) was the highest, reaching 0.34. Phylogenetic tree analysis (Fig. 6a) showed that 55 tea plants from NiaoWang (NW), TuanShan (TS), LanDong (LD), and XinYang (XY) and one tea plant from YangMeng (YM) constituted Group I, and N66 was clustered into Group I. All 16 plants from DaCao-ShaoJiao (DC-SJ) and 17 tea plants from TieChang (TC) constituted Group II. Twenty-three tea plants from ZenYa (ZY) and one tea plant from YM formed Group III, and D01 was clustered into Group III. The results were consistent with the PCA results (Fig. 6b).
The analysis of eight Duyun Maojian tea production areas showed that the heterozygosity values of DC-SJ, TS, TC and NW were 0.2559, 0.2341, 0.2427 and 0.2341, respectively. These values were lower than those of LD, XY, YM and ZY, whose heterozygosity values were 0.3129, 0.2787, 0.3402 and 0.3428, respectively. The results showed that the heterozygosity was lower in the NW and TC producing areas, close to the two main producing areas, but higher in the XY, YM, LD, and ZY producing areas far away from the two main producing areas (Fig. 6c).
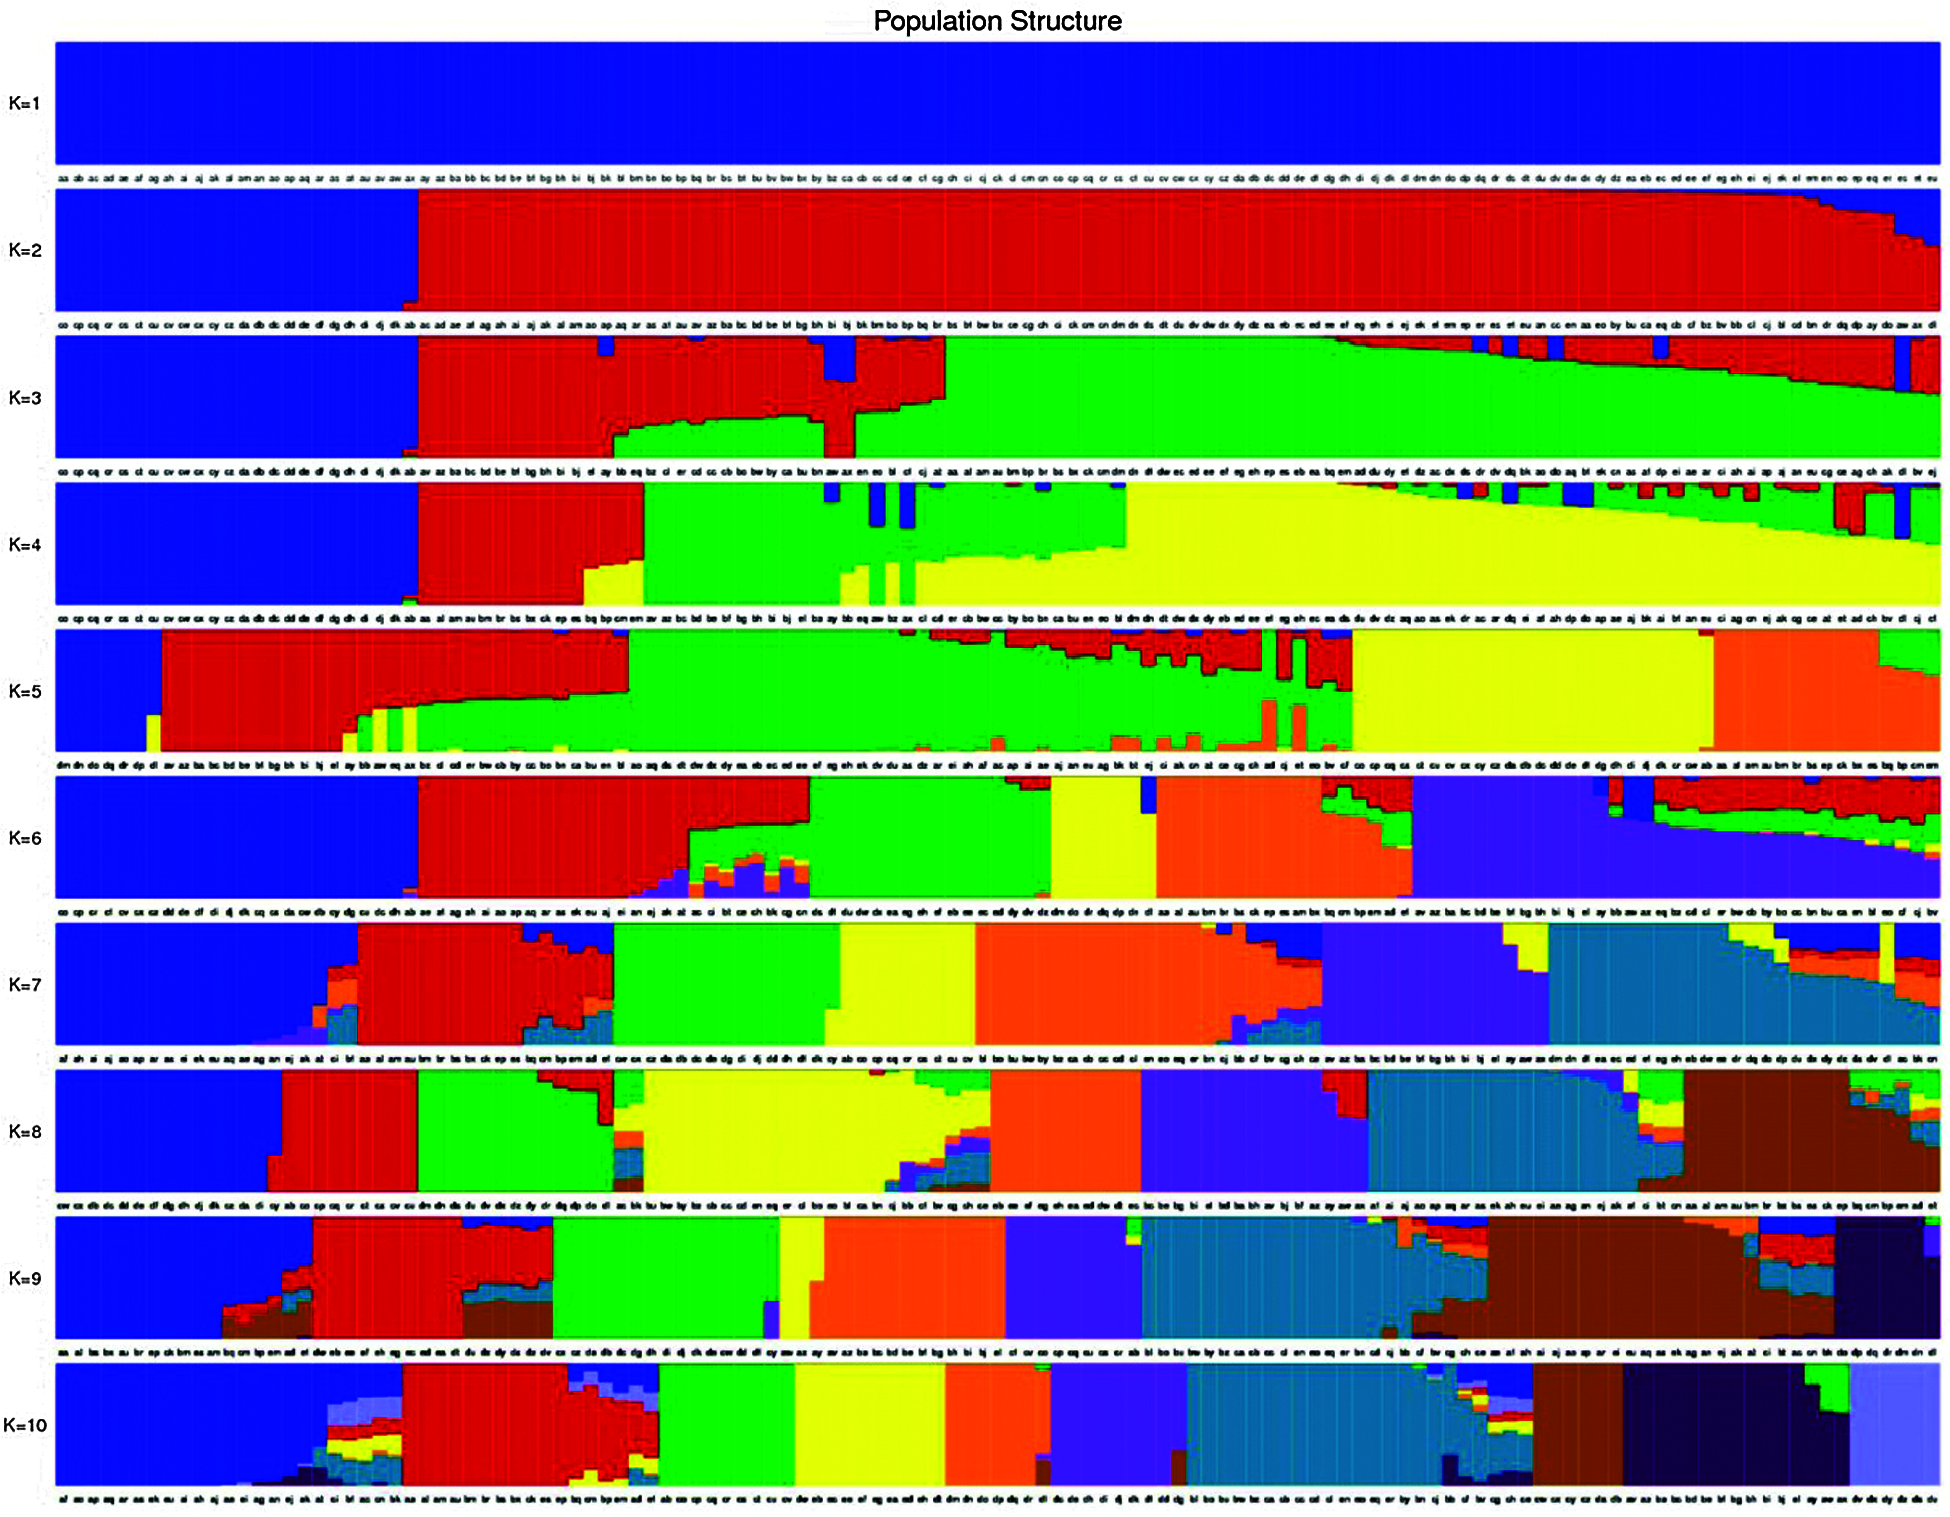
Figure 4: Population structure analysis of 123 tea samples. The horizontal coordinates represent the 123 tea samples in order, the vertical coordinates represent the number of subgroups K values (K = 1–10), and the color corresponding to each sample and the color proportion represent which subgroup this sample belongs to and what is the proportion of genetic material source
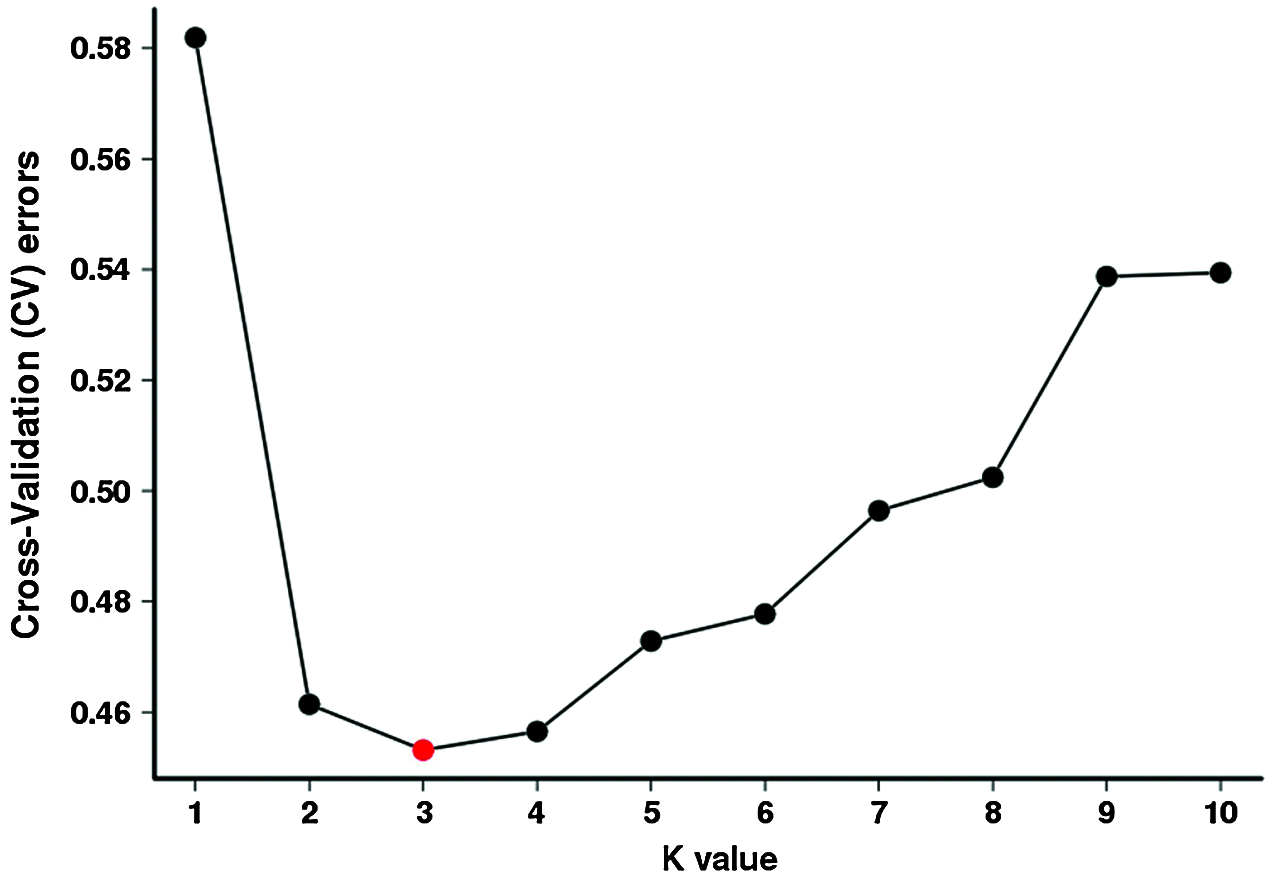
Figure 5: Analyses of cross-validation errors of clustering with a hypothetical k-value of 1–10. The x-axis presents the k-value (1–10), while the y-axis presents the cross-validation error values

Figure 6: Phylogenetic tree analysis of 123 tea plants, principal component analysis and 8 Duyun Maojian tea producing areas. (a) Phylogenetic tree analysis of 123 tea plants. Each branch represents a tea plant. A total of 123 tea plants were also presented in Table S1. (b) Principal component analysis of 123 tea plants. The PCA three-dimensional cluster diagram of 123 tea plants showed that PC1 represented the first principal component, PC2 represented the second principal component, and PC3 represented the third principal component. A dot represents a tea plant and a color represents a group. (c) Location of 8 Duyun Maojian tea producing areas. 123 tea plants were collected from 8 producing areas in Qiannan
3.4 Analysis of Leaf Trait Associations
The SNPs were used to analyze the whole genome association of two leaf traits. When −log10 (P) > 6, it is defined as a strong association between a gene and a trait. It was found that there were association signal sites related to leaf apex development on scaffold 206, 214, 1305, 1441, 1614, 1618, 2907, 3498, 3690, 4133, 4356, and 5112 (Fig. 7a indicated by the blue arrow). There were association signal sites related to leaf shape development on scaffold 206, 1441, 1614, 1618, 2564, 4319, 4356, and 6659 (Fig. 7b indicated by the blue arrow). Combined with the previous research results, we selected 17 signal sites significantly associated with leaf apex development (Table 1) and 13 signal sites significantly associated with leaf shape development (Table 2). Through the annotation of SwissProt database annotation, we obtained 11 candidate genes related to leaf apex development, namely, GRF1, MPK7, MMK2, PIN1, ARF19, IAA9, IAA16, IAMT1, ABP19A, ARF18 and YUC4 (Table 3), and 7 candidate genes related to leaf shape development, namely, GRF1, GRF8, MPK7, BAM3, ARF19, ARF18 and ABP19A (Table 4).

Figure 7: GWAS of leaf apex and leaf shape of 123 tea plants. (a) Manhattan plots of the GLN for leaf apex and quantile-quantile plot of the GLN. (b) Manhattan plots of the GLN for leaf shape and quantile-quantile plot of the GLN. The abscissa represents the scaffold position, the ordinate represents the p value (−log10 (P)), and the negative logarithm with the base of 10 is taken. The scattered points (or lines) on the graph represent the −log10 (P) corresponding to each SNP loci. The blue horizontal dashed line corresponds to −log10 (P) = 6, which is the genome-wide significance threshold. The red horizontal dashed line corresponds to −log10 (P) = 7, and the blue arrow shows the significant association signal peaks


Morphological characteristics, biochemical characteristics, and pedigree information are traditional methods for germplasm identification, but they are easily affected by environmental conditions and growth stages [36]. Molecular markers such as SNPs have higher reliability [37]. SNPs density is crucial for population evolution and GWAS analysis. One previous study obtained 571,521 SNPs in rice [11], a total of 31,561 high-quality SNPs were developed in maize [13], a total of 30,543 SNP markers were developed in barley [14], another study obtained 32,812 SNP markers in common bean [17], and a total of 139 SNPs were developed in rapeseed [18]. In tea, 30,282 SNPs were obtained in one study [9], and 9,436,394 high-quality SNPs were obtained in another [38]. In our study, 11,362,041 high-quality SNPs were obtained from 123 tea plants, which laid a reliable foundation for follow-up research.
The results showed that the tea plants in the NW, XY, YM, LD, and TC producing areas were clustered into Group I or Group II, which were closely related to the two main producing areas. This indicates that the tea plants in the NW, XY, YM, LD, and TC producing areas may also be important for Duyun Maojian tea. The ZY producing area is located at the boundary of Qiannan and is far away from the other seven producing areas. This was consistent with our results that the tea plants of the ZY producing area are clustered into Group III independently.
In the eight production areas, the heterozygosity of TS, DC-SJ, NW, and TC was low, indicating that the germplasm resources in these four producing areas were relatively simple. The higher heterozygosity of XY, YM, LD, and ZY indicates that the composition of tea resources in these four producing areas is more complex and the level of genetic diversity is higher, which provides a reference for the further selection of Duyun Maojian tea breeding materials. Moreover, the study found that the genetic diversity levels of the two production areas close to the two main production areas were low, while the genetic diversity levels of the four production areas far away from the two main production areas were high. It is speculated that there may be both artificial breeding and natural training in the process of Dunyun Maojian tea development.
The character of tea is related to the quality of tea. The tea leaves made of Duyun Maojian tea should be small and short, and the length should not exceed 2 cm. Research on the genes controlling leaf traits is of great significance to the cultivation of Duyun Maojian tea. When −log10 (P) > 6, we found 11 candidate genes related to leaf apex development and 7 candidate genes related to leaf shape development. Some of the associated signals found in this study were consistent with the genes reported in other studies. It has been reported that AtGRF1 is an important regulatory protein in leaf and cotyledon cell proliferation in Arabidopsis thaliana [39]. In addition, AtGRFs can regulate the cell division activity during the differentiation of adaxial and abaxial cells in A. thaliana leaves [40]. In this study, we also found that the GRF1 gene was related to leaf apex and leaf shape development in tea plants. In addition, we found that another member of the GRF family, GRF8, was related to leaf shape development. In A. thaliana, mutants of functional deletion alleles bam1, bam2 and bam3 showed leaf morphological defects, and bam3 mutations seemed to aggravate the severity of bam1 and bam2 mutation phenotypes [41]. We also screened BAM3 from the strong correlation signal sites of tea leaf shape development. PIN protein is an auxin efflux carrier that can participate in the transport of auxin between and within cells [42]. PIN usually acts synergistically with auxin and participates in the development of plant leaves. For example, PIN1 can mediate auxin transport to regulate the leaf shape of bryophyte gametophytes [43], regulate the sawtooth of Arabidopsis leaves [44], and participate in the formation of Arabidopsis leaf veins [45]. It was found that AtMKK2-AtMPK10 could regulate the complexity of leaf venation in A. thaliana. Leaves lacking AtMKK2 or AtMPK10 activity were smaller and venation was simplified [46]. ARF is the key protein to activate or inhibit transcription in auxin response. ARF is an important auxin response factor. In A. thaliana, AtARF3 and AtARF4 can indirectly control leaf dorsal ventral development by controlling auxin gradients [47]. In water ferns, CpARF4 is expressed in the abaxial region of leaf primordia at different developmental stages [48]. The activation of IAMT1 caused Arabidopsis plants to produce leaf roll phenotypes [49,50]. In addition, IATM1 can also encode indole-3-acetic acid (IAA) carboxy methyltransferase [51]. IAA in tea plants can change the growth and development of leaves to a certain extent [52]. Auxin binding protein (ABP) is a kind of auxin receptor [53]. Studies have shown that the decrease of ABP1 activity will lead to serious leaf growth retardation in A. thaliana [54]. And in Arabidopsis, the triple mutant yuc1 yuc4 Pin1 fails to form a leaf [55].
In this study, we identified strongly associated signal loci for leaf development that had not been reported. These regions have not reported genes related to leaf trait development, such as Scaffold206, Scaffold1618, Scaffold3498, Scaffold3690, and Scaffold5112 (Fig. 7a, indicated by the red arrow). Scaffold206, Scaffold1618, Scsfold2564, Scaffold4319 (Fig. 7b, indicated by the red arrow) this experiment provides more reliable candidate genes for further study of leaf development. We believe that these association results will contribute to the identification of genes related to tea leaf traits. However, further studies are needed to verify it.
This study explored the genetic relationship and genetic diversity of germplasm resources in eight Duyun Maojian tea production areas. It was found that the NW, XY, YM, LD, and TC production areas were closely related to the materials of the two main production areas. It is speculated that the tea plants in these five producing areas may also be important for making Duyun Maojian tea. The heterozygosity in the ZY production area is the highest and is independently clustered into a group, indicating that the tea plants in ZY region have rich genetic diversity. At the same time, 11 and 7 candidate genes related to leaf apex and leaf shape development, respectively, were screened by GWAS analysis. We believe that these correlation results will help to identify genes related to tea plant leaf traits. However, further gene cloning is needed to verify our results.
In this study, a total of 462,019 SLAF tags were obtained by SLAF-seq and 11,362,041 high-quality SNPs were developed. Further analysis found that 123 tea plants were clustered into 3 groups. NW, XY, LD, YM, and TC had closer genetic relationships with tea plants in the two main production areas. The genetic diversity level of tea plants in the ZY production area was the highest and the genotypes were more diverse. It is speculated that the tea plants in the NW, XY, LD, YM, and TC production areas may also be important for making Duyun Maojian tea. At the same time, 11 and 7 candidate genes related to leaf tip and leaf shape development, respectively, were obtained by GWAS analysis. The results provide a reference for further selection and genetic breeding of Duyun Maojian tea.
Acknowledgement: This work was supported by The Science and Technology Foundation of Guizhou Province [20181044], The Construction Program of Biology First-Class Disciplining Guizhou (GNYL [2017] 009) and The Young Scholars and Technology Talents Development Project of Guizhou Education Department KY(2018)124, Key Laboratory of Mountain Plant Resources Protection and Planting Innovation, Ministry of Education (Guizhou University), Open Project funded by Independent Project.
Author Contributions: Yan Li, Weili Tian and Fen Zhang designed the experiment and analyze the data; Fen Zhang, Weili Tian, Lu Cen, Litang Lv, Xiaofang Zeng, Yulu Chen, Yi Chen Zhao and Yan Li performed the experiments; Fen Zhang wrote the manuscript.
Funding Statement: This work was supported by the Science and Technology Foundation of Guizhou Province [20181044], the Construction Program of Biology First-Class Disciplining Guizhou (GNYL [2017] 009), the Young Scholars and Technology Talents Development Project of Guizhou Education Department KY(2018) 124, and the Independent Subject Grant Open Project of the Key Laboratory of Mountain Plant Resources Conservation and Plantation Innovation of the Ministry of Education (Guizhou University).
Conflicts of Interest: The authors declare that they have no conflicts of interest to report regarding the present study.
1. Gunathilaka, R. P. D., Tularam, G. (2016). The tea industry and a review of its price modelling in major tea producing countries. Journal of Management and Strategy, 7(1). DOI 10.5430/jms.v7n1p21. [Google Scholar] [CrossRef]
2. Zhang, J., Yang, R., Chen, R., Li, Y., Peng, Y. et al. (2018). Multielemental analysis associated with chemometric techniques for geographical origin discrimination of tea leaves (Camelia sinensis) in Guizhou Province, SW China. Molecules, 23(11), 3013. DOI 10.3390/molecules23113013. [Google Scholar] [CrossRef]
3. Sun, X., Liu, D., Zhang, X., Li, W., Liu, H. et al. (2013). SLAF-seq: An efficient method of large-scale de novo SNP discovery and genotyping using high-throughput sequencing. PLoS One, 8(3), e58700. DOI 10.1371/journal.pone.0058700. [Google Scholar] [CrossRef]
4. Zhang, Y., Wang, L., Xin, H., Li, D., Ma, C. et al. (2013). Construction of a high-density genetic map for sesame based on large scale marker development by specific length amplified fragment (SLAF) sequencing. BMC Plant Biology, 13(1), 141. DOI 10.1186/1471-2229-13-141. [Google Scholar] [CrossRef]
5. Degen, B., Yanbaev, Y. A., Ianbaev, R. Y., Bakhtina, S. Y., Gabitova, A. A. et al. (2021). Genetic diversity and differentiation of northern populations of pedunculate oak based on analysis of new SNP markers. Russian Journal of Genetics, 57(3), 374–378. DOI 10.1134/S1022795421030054. [Google Scholar] [CrossRef]
6. Jue, D., Liu, L., Sang, X., Shu, B., Wang, J. et al. (2021). SNP-based high-density genetic map construction and candidate gene identification for fruit quality traits of Dimocarpus longan lour. Scientia Horticulturae, 284. DOI 10.1016/J.SCIENTA.2021.110086. [Google Scholar] [CrossRef]
7. Liu, J., Li, X., Liu, Y., Xing, C., Xie, Y. et al. (2021). Evaluation of genetic diversity and development of core collections of industrial brewing yeast using ISSR markers. Archives of Microbiology, 203(3), 1001–1008. DOI 10.1007/S00203-020-02091-8. [Google Scholar] [CrossRef]
8. Lin, Y., Yu, W., Zhou, L., Fan, X., Wang, F. et al. (2020). Genetic diversity of oolong tea (Camellia sinensis) germplasms based on the nanofluidic array of single-nucleotide polymorphism (SNP) markers. Tree Genetics and Genomes, 16(1), 1–14. DOI 10.1007/s11295-019-1392-z. [Google Scholar] [CrossRef]
9. Niu, S., Koiwa, H., Song, Q., Qiao, D., Chen, J. et al. (2020). Development of core-collections for Guizhou tea genetic resources and GWAS of leaf size using SNP developed by genotyping-by-sequencing. PeerJ, 2020(8), e8572. DOI 10.7717/peerj.8572. [Google Scholar] [CrossRef]
10. Li, Y., Zeng, X., Li, G., Zhao, Y., Li, J. et al. (2021). Population structure analysis and genome-wide association study of rice landraces from Qiandongnan, China, using specific-locus amplified fragment sequencing. International Journal of Agriculture and Biology, 25(2), 388–396. DOI 10.17957/IJAB/15.1679. [Google Scholar] [CrossRef]
11. Li, Y., Zeng, X., Zhao, Y., Li, J., Zhao, D. et al. (2017). Identification of a new rice low-tiller mutant and association analyses based on the SLAF-Seq method. Plant Molecular Biology Reporter, 35(1), 72–82. DOI 10.1007/s11105-016-1002-2. [Google Scholar] [CrossRef]
12. Stanley, A., Menkir, A., Paterne, A., Ifie, B., Tongoona, P. et al. (2020). Genetic diversity and population structure of maize inbred lines with varying levels of resistance to striga hermonthica using agronomic trait-based and SNP markers. Plants, 9(9), 1–18. DOI 10.3390/plants9091223. [Google Scholar] [CrossRef]
13. Yang, L., Li, T., Tian, X., Yang, B., Lao, Y. et al. (2020). Genome-wide association study (GWAS) reveals genetic basis of ear-related traits in maize. Euphytica, 216(11), 946. DOI 10.1007/s10681-020-02707-6. [Google Scholar] [CrossRef]
14. Jia, Y., Westcott, S., He, T., McFawn, L. A., Angessa, T. et al. (2021). Genome-wide association studies reveal QTL hotspots for grain brightness and black point traits in barley. Crop Journal, 9(1), 154–167. DOI 10.1016/j.cj.2020.04.013. [Google Scholar] [CrossRef]
15. Thabet, S. G., Moursi, Y. S., Sallam, A., Karam, M. A., Alqudah, A. M. (2021). Genetic associations uncover candidate SNP markers and genes associated with salt tolerance during seedling developmental phase in barley. Environmental and Experimental Botany, 188(1), 104499. DOI 10.1016/j.envexpbot.2021.104499. [Google Scholar] [CrossRef]
16. Carvalho, M. S., de Oliveira Moulin Carias, C. M., Silva, M. A., da Silva Ferreira, M. F., de Souza, T. L. P. O. et al. (2020). Genetic diversity and structure of landrace accessions, elite lineages and cultivars of common bean estimated with SSR and SNP markers. Molecular Biology Reports, 47(9), 6705–6715. DOI 10.1007/s11033-020-05726-7. [Google Scholar] [CrossRef]
17. García-Fernández, C., Campa, A., Garzón, A. S., Miklas, P., Ferreira, J. J. (2021). GWAS of pod morphological and color characters in common bean. BMC Plant Biology, 21(1), 184. DOI 10.1186/S12870-021-02967-X. [Google Scholar] [CrossRef]
18. Shahzad, A., Qian, M., Sun, B., Mahmood, U., Li, S. et al. (2021). Genome-wide association study identifies novel loci and candidate genes for drought stress tolerance in rapeseed. Oil Crop Science, 6(1), 12–22. DOI 10.1016/J.OCSCI.2021.01.002. [Google Scholar] [CrossRef]
19. Wang, X., Long, Y., Wang, N., Zou, J., Ding, G. et al. (2017). Breeding histories and selection criteria for oilseed rape in Europe and China identified by genome wide pedigree dissection. Scientific Reports, 7(1), 1916. DOI 10.1007/s10681-020-02707-6. [Google Scholar] [CrossRef]
20. Zhang, S., Hu, X., Miao, H., Chu, Y., Cui, F. et al. (2019). QTL identification for seed weight and size based on a high-density SLAF-seq genetic map in peanut (Arachis hypogaea L.). BMC Plant Biology, 19(1), 221–233. DOI 10.1186/s12870-019-2164-5. [Google Scholar] [CrossRef]
21. Hu, X. H., Zhang, S., Miao, H., Cui, F., Shen, Y. et al. (2018). High-density genetic map construction and identification of QTLs controlling oleic and linoleic acid in peanut using SLAF-seq and SSRs. Scientific Reports, 8(3), 1426–1433. DOI 10.1038/s41598-018-23873-7. [Google Scholar] [CrossRef]
22. Yu, X., Zhang, M., Yu, Z., Yang, D., Li, J. et al. (2020). An SNP-based high-density genetic linkage map for tetraploid potato using specific length amplified fragment sequencing (SLAF-Seq) Technology. Agronomy, 10(1), 114. DOI 10.3390/agronomy10010114. [Google Scholar] [CrossRef]
23. Yang, Q. H., Jin, H., Yu, X., Fu, X., Zhi, H. et al. (2020). Rapid identification of soybean resistance genes to soybean mosaic virus by SLAF-seq bulked segregant analysis. Plant Molecular Biology Reporter, 38(4), 666–675. DOI 10.1007/s11105-020-01227-w. [Google Scholar] [CrossRef]
24. Ren, H., Han, J., Wang, X., Zhang, B., Yu, L. et al. (2020). QTL mapping of drought tolerance traits in soybean with SLAF sequencing. The Crop Journal, 8(6), 977–989. DOI 10.1016/j.cj.2020.04.004. [Google Scholar] [CrossRef]
25. Chen, S., Borza, T., Byun, B., Coffin, R., Coffin, J. et al. (2017). DNA markers for selection of late blight resistant potato breeding lines. American Journal of Plant Sciences, 8(6), 1197–1209. DOI 10.4236/ajps.2017.86079. [Google Scholar] [CrossRef]
26. Desjardins, P. R., Conklin, D. S. (2011). Microvolume quantitation of nucleic acids. Current Protocols in Molecular Biology, 93(1), A.3J.1–A.3J.16. DOI 10.1002/0471142727.mba03js93. [Google Scholar] [CrossRef]
27. Li, H., Durbin, R. (2009). Fast and accurate short read alignment with burrows-wheeler transform. Bioinformatics, 25(14), 1754–1760. DOI 10.1093/bioinformatics/btp324. [Google Scholar] [CrossRef]
28. McKenna, A., Hanna, M., Banks, E., Sivachenko, A., Cibulskis, K. et al. (2010). The genome analysis toolkit: A MapReduce framework for analyzing next-generation DNA sequencing data. Genome Research, 20(9), 1297–1303. DOI 10.1101/gr.107524.110. [Google Scholar] [CrossRef]
29. Li, H., Handsaker, B., Wysoker, A., Fennell, T., Ruan, J. et al. (2009). The sequence alignment/map format and SAMtools. Bioinformatics, 25(16), 2078–2079. DOI 10.1093/bioinformatics/btp352. [Google Scholar] [CrossRef]
30. Cingolani, P., Platts, A., Wang, L. L., Coon, M., Nguyen, T. et al. (2012). A program for annotating and predicting the effects of single nucleotide polymorphisms, SnpEff: SNPs in the genome of drosophila melanogaster strain w1118; iso-2; iso-3. Fly, 6(2), 80–92. DOI 10.4161/fly.19695. [Google Scholar] [CrossRef]
31. Alexander, D. H., Novembre, J., Lange, K. (2009). Fast model-based estimation of ancestry in unrelated individuals. Genome Research, 19(9), 1655–1664. DOI 10.1101/gr.094052.109. [Google Scholar] [CrossRef]
32. Kumar, S., Stecher, G., Li, M., Knyaz, C., Tamura, K. (2018). MEGA X: Molecular evolutionary genetics analysis across computing platforms. Molecular Biology and Evolution, 35(6), 1547–1549. DOI 10.1093/molbev/msy096. [Google Scholar] [CrossRef]
33. Price, A. L., Patterson, N. J., Plenge, R. M., Weinblatt, M. E., Shadick, N. A. (2006). Principal components analysis corrects for stratification in genome-wide association studies. Nature Genetics, 38(8), 904–909. DOI 10.1038/ng1847. [Google Scholar] [CrossRef]
34. Bradbury, P. J., Zhang, Z., Kroon, D. E., Casstevens, T. M., Ramdoss, Y. (2007). TASSEL: Software for association mapping of complex traits in diverse samples. Bioinformatics, 23(19), 2633–2635. DOI 10.1093/bioinformatics/btm308. [Google Scholar] [CrossRef]
35. Hardy, O. J., Vekemans, X. (2002). SPAGeDI: A versatile computer program to analyse spatial genetic structure at the individual or population levels. Molecular Ecology Notes, 2(4), 618–620. DOI 10.1046/j.1471-8286.2002.00305.x. [Google Scholar] [CrossRef]
36. Ahmad, R., Malik, W., Anjum, M. (2020). Molecular markers systems revealed high genetic similarity among fifty date palm (Phoenix dactylifera) genotypes. International Journal of Agriculture and Biology, 24(3), 563–574. DOI 10.17957/IJAB/15.1473. [Google Scholar] [CrossRef]
37. Wilson, B. L., Kitzmiller, J., Rolle, W., Hipkins, V. D. (2001). Isozyme variation and its environmental correlates in elymus glaucus from the California Floristic Province. Canadian Journal of Botany, 79(2), 139–153. DOI 10.1139/b00-150. [Google Scholar] [CrossRef]
38. Wang, R. J., Gao, X. F., Yang, J., Kong, X. R. (2019). Genome-wide association study to identify favorable SNP allelic variations and candidate genes that control the timing of spring bud flush of tea (Camellia sinensis) using SLAF-seq. Journal of Agricultural and Food Chemistry, 67(37), 10380–10391. DOI 10.1021/acs.jafc.9b03330. [Google Scholar] [CrossRef]
39. Kim, J. H., Choi, D., Kende, H. (2003). The AtGRF family of putative transcription factors is involved in leaf and cotyledon growth in Arabidopsis. Plant Journal, 36(1), 94–104. DOI 10.1046/j.1365-313X.2003.01862.x. [Google Scholar] [CrossRef]
40. Wang, L., Gu, X., Xu, D., Wang, W., Wang, H. et al. (2011). MiR396-targeted AtGRF transcription factors are required for coordination of cell division and differentiation during leaf development in Arabidopsis. Journal of Experimental Botany, 62(2), 761–773. DOI 10.1093/jxb/erq307. [Google Scholar] [CrossRef]
41. DeYoung, B. J., Bickle, K. L., Schrage, K. J., Muskett, P., Patel, K. et al. (2006). The CLAVATA1-related BAM1, BAM2 and BAM3 receptor kinase-like proteins are required for meristem function in Arabidopsis. Plant Journal, 45(1), 1–16. DOI 10.1111/j.1365-313X.2005.02592.x [Google Scholar] [CrossRef]
42. Zhou, J. J., Luo, J. (2018). The PIN-FORMED auxin efflux carriers in plants. International Journal of Molecular Sciences, 19(9), 2759. DOI 10.3390/ijms19092759. [Google Scholar] [CrossRef]
43. Bennett, T. A., Liu, M. M., Aoyama, T., Bierfreund, N. M., Braun, M. et al. (2014). Plasma membrane-targeted PIN proteins drive shoot development in a moss. Current Biology, 24(23), 2776–2785. DOI 10.1016/j.cub.2014.09.054. [Google Scholar] [CrossRef]
44. Tang, L. P., Yang, Y., Wang, H., Li, L., Liu, L. et al. (2021). AtNSF regulates leaf serration by modulating intracellular trafficking of PIN1 in Arabidopsis thaliana. Journal of Integrative Plant Biology, 63(4), 737–755. DOI 10.1111/JIPB.13043. [Google Scholar] [CrossRef]
45. Wenzel, C. L., Schuetz, M., Yu, Q., Mattsson, J. (2007). Dynamics of MONOPTEROS and PIN-FORMED1 expression during leaf vein pattern formation in Arabidopsis thaliana. Plant Journal, 49(3), 387–398. DOI 10.1111/j.1365-313X.2006.02977.x. [Google Scholar] [CrossRef]
46. Stanko, V., Giuliani, C., Retzer, K., Djamei, A., Wahl, V. et al. (2014). Timing is everything: Highly specific and transient expression of a map kinase determines auxin-induced leaf venation patterns in Arabidopsis. Molecular Plant, 7(11), 1637–1652. DOI 10.1093/mp/ssu080. [Google Scholar] [CrossRef]
47. Pekker, I., Alvarez, J. P., Eshed, Y. (2005). Auxin response factors mediate Arabidopsis organ asymmetry via modulation of KANADI activity. Plant Cell, 17(11), 2899–2910. DOI 10.1105/TPC.105.034876. [Google Scholar] [CrossRef]
48. Sun, J., Li, G. S. (2020). Leaf dorsoventrality candidate gene CpARF4 has conserved expression pattern but divergent tasiR-ARF regulation in the water fern Ceratopteris pteridoides. American Journal of Botany, 107(11), 1470–1480. DOI 10.1002/ajb2.1570. [Google Scholar] [CrossRef]
49. Han, W., Han, D., He, Z., Hu, H., Wu, Q. et al. (2018). The SWI/SNF subunit SWI3B regulates IAMT1 expression via chromatin remodeling in Arabidopsis leaf development. Plant Science, 271, 127–132. DOI 10.1016/j.plantsci.2018.03.021. [Google Scholar] [CrossRef]
50. Qin, G., Gu, H., Zhao, Y., Ma, Z., Shi, G. et al. (2005). An indole-3-acetic acid carboxyl methyltransferase regulates Arabidopsis leaf development. Plant Cell, 17(10), 2693–2704. DOI 10.1105/TPC.105.034959. [Google Scholar] [CrossRef]
51. Abbas, M., Hernández-García, J., Pollmann, S., Samodelov, S. L., Kolb, M. et al. (2018). Auxin methylation is required for differential growth in Arabidopsis. Proceedings of the National Academy of Sciences of the United States of America, 115(26), 6864–6869. DOI 10.1073/PNAS.1806565115. [Google Scholar] [CrossRef]
52. Wang, Y., Liu, H., Li, H., Teng, R., Zhuang, J. (2020). Genome-based identification and analysis of the genes involved in auxin biosynthesis and signal transduction during tea plant leaf development. Scientia Horticulturae, 261(61), 109030. DOI 10.1016/j.scienta.2019.109030. [Google Scholar] [CrossRef]
53. Napier, R. (2021). The Story of auxin-binding protein 1 (ABP1). Cold Spring Harbor Perspectives in Biology, 13(10). DOI 10.1101/cshperspect.a039909. [Google Scholar] [CrossRef]
54. Braun, N., Wyrzykowsk, J., Muller, P., David, K., Couch, D. et al. (2008). Conditional repression of auxin binding protein1 reveals that it coordinates cell division and cell expansion during postembryonic shoot development in Arabidopsis and tobacco. Plant Cell, 20(10), 2746–2762. DOI 10.1105/tpc.108.059048. [Google Scholar] [CrossRef]
55. Cheng, Y., Dai, X., Zhao, Y. (2006). Auxin biosynthesis by the YUCCA flavin monooxygenases controls the formation of floral organs and vascular tissues in Arabidopsis. Genes and Development, 20(13), 1790–1799. DOI 10.1101/gad.1415106. [Google Scholar] [CrossRef]
Appendix

Samples N66 and D01 were external reference tea plants, among which N66 was Qian tea 8 and D01 was Longjing-changye. 123 tea samples were collected from 8 areas in Qiannan Prefecture.
 | This work is licensed under a Creative Commons Attribution 4.0 International License, which permits unrestricted use, distribution, and reproduction in any medium, provided the original work is properly cited. |