| Phyton-International Journal of Experimental Botany |
DOI: 10.32604/phyton.2022.018571
ARTICLE
Dimension-Enhanced Ultra-High Performance Liquid Chromatography/Ion Mobility-Quadrupole Time-of-Flight Mass Spectrometry Combined with Intelligent Peak Annotation for the Rapid Characterization of the Multiple Components from Seeds of Descurainia sophia
1State Key Laboratory of Component-Based Chinese Medicine, Tianjin Key Laboratory of TCM Chemistry and Analysis, Tianjin University of Traditional Chinese Medicine, Tianjin, 301617, China
2Waters Technology Co., Ltd., Beijing, 101102, China
3School of Computing Science, University of Glasgow, Glasgow, G12 8RZ, UK
*Corresponding Author: Wenzhi Yang. Email: wzyang0504@tjutcm.edu.cn
#Simiao Wang & Xue Li contributed equally to this work
Received: 03 August 2021; Accepted: 08 September 2021
Abstract: The complex composition of herbal metabolites necessitates the development of powerful analytical techniques aimed to identify the bioactive components. The seeds of Descurainia sophia (SDS) are utilized in China as a cough and asthma relieving agent. Herein, a dimension-enhanced integral approach, by combining ultra-high performance liquid chromatography/ion mobility-quadrupole time-of-flight mass spectrometry (UHPLC/IM-QTOF-MS) and intelligent peak annotation, was developed to rapidly characterize the multicomponents from SDS. Good chromatographic separation was achieved within 38 min on a UPLC CSH C18 (2.1 × 100 mm, 1.7 μm) column which was eluted by 0.1% formic acid in water (water phase) and acetonitrile (organic phase). Collision-induced dissociation-MS2 data were acquired by the data-independent high-definition MSE (HDMSE) in both the negative and positive electrospray ionization modes. A major components knockout strategy was applied to improve the characterization of those minor ingredients by enhancing the injection volume. Moreover, a self-built chemistry library was established, which could be matched by the UNIFI software enabling automatic peak annotation of the obtained HDMSE data. As a result of applying the intelligent peak annotation workflows and further confirmation process, a total of 53 compounds were identified or tentatively characterized from the SDS, including 29 flavonoids, one uridine derivative, four glucosides, one lignin, one phenolic compound, and 17 others. Notably, four-dimensional information related to the structure (e.g., retention time, collision cross section, MS1 and MS2 data) was obtained for each component by the developed integral approach, and the results would greatly benefit the quality control of SDS.
Keywords: Descurainia sophia; multicomponent characterization; ultra-high performance liquid chromatography; ion mobility/quadrupole time-of-flight mass spectrometry; high-definition MSE; flavonoid
Traditional Chinese Medicine (TCM), mostly derived from plants, is attracting more attention from a global scope [1]. It has been included in the system of alternative therapy, and is particularly effective in treating some chronic and prevalent diseases, such as COVID-19 [2]. Systematic elucidation of the chemical substances of TCM is helpful to explore the therapeutic basis and elaborate the quality standards to promote its modernization and globalization [3]. However, there are some obstacles hindering the internationalization of TCM. As a distinctive feature, the multiple parts of plants, such as roots [4], leaves [5], flowers [6], and seeds [7], etc., can be used as a source for TCM. Generally, herbal medicines contain various chemical components, which are featured by the co-existance of primary and secondary metabolites with wide spans of acidity-base properties and molecular masses, different polarities, and sharply different contents, etc. [8]. Therefore, it is difficult to perform a quality investigation of TCM. Increasing demands on the sensitive characterization of the known components (targeted), and meanwhile, having the ability to probe into those unknown (untargeted) necessitate the elaboration of powerful analytical techniques, such as liquid chromatography/mass spectrometry (LC–MS) [9]. MS, by combining the negative and positive ionization modes or using different ionization patterns, can give good response to most of the natural components with ultra-high sensitivity. Moreover, the ability of MSn acquisition, by the alternate fragmentation mechanisms and flexible scan approaches, provides more options to facilitate the fit-for-purpose profiling and characterization of multiple components with significantly greater coverage on the components of interest [10]. Another milestone progress in herbal components analysis in recent years is the introduction of ion mobility mass spectrometry (IM-MS). It offers an additional dimension of separation based on the size, shape, and charge state of the gas-phase ions orthogonal of MS. Impressively, IM-MS coupled with LC, such as the ultra-high-performance liquid chromatography/ion mobility-quadrupole time-of-flight mass spectrometry (UHPLC/IM-QTOF-MS), is able to provide four-dimensional data (e.g., retention time, drift time, MS information and the response) of the components. IM-derived collision cross section (CCS) has the potential to discriminate among isomeric metabolites [11,12].
Descurainia sophia (L.) Webb ex Prantl., belonging to the Brassicaceae family, is a medicinal herb mainly distributed in Shandong, Hebei, Henan, Zhejiang, Inner Mongolia, and Gansu provinces of China [13,14]. The seeds of D. sophia (SDS) are used as the source for the TCM Descurainiae Semen (Ting-Li-Zi). The plants are harvested when the fruits are ripe in summer, dried, and the seeds are rubbed out with the impurities removed [15]. According to the basic theory of TCM, Descurainiae Semen has a pungent, bitter taste, and a severe cold property, which can relieve lung and asthma, and is also effective in relieving swelling [16–18]. To date, a number of studies have been reported on the phytochemistry of SDS, and a variety of compounds have been isolated [19–21]. These compounds include flavonoids, glucosinolates and isothiocyanates, phenylpropanoids, coumarins, cardiac glycosides, organic acids, and volatile oils, etc. Additionally, quality control on Descurainiae Semen has been conducted to identify and quantitatively assay the components contained. For instance, a UHPLC/Q-TOF-MS/MS method was established, by Meng et al. [14] which enabled the characterization of 14 constituents from SDS, including nine flavonoids, four fatty acids, and one cardiac glycoside. Li et al. [22] established an HPLC method to determine the content of quercetin-3-O-β-D-glucopyranosyl-7-O-β-D-gentiobioside in 28 batches of SDS samples, and suggested that its content is not less than 0.075%. However, according to the report of Wang et al. [23] this flavonoid compound in SDS was unstable in water at high temperature in a long-term extraction process.
In the current work, we reported a dimension-enhanced integral approach, by combining UHPLC/IM-QTOF-MS-based data-independent high-definition MSE (HDMSE) and UNIFITM-facilitated computational peak annotation to rapidly profile and characterize the multiple components from SDS, especially those minor ones. Fig. 1 illustrates the overall technical roadmap for this strategy. For this purpose, numerous efforts were made to achieve better performance in both the resolution and sensitivity: 1) the chromatography (e.g., stationary phase, column temperature, and gradient elution program) and key parameters of the VionTM IM-QTOF mass spectrometer (capillary voltage, cone voltage, and collision energy) were both carefully optimized; 2) a major components knockout strategy was utilized to boost the profiling and characterization of minor components by enhancing the injection volume; 3) a chemical library recording 232 known compounds was in-house established to guide the automatic peak annotation and components identification; and 4) streamlined workflows were created by applying UNIFITM to process the obtained high-resolution CID (collision-induced dissociation)-MS2 data. As a result of these efforts, we could identify or tentatively characterize 53 compounds from SDS, with four-dimensional information with respect to each component (e.g., tR, drift time/CCS, MS1 and MS2 data) conveniently provided.
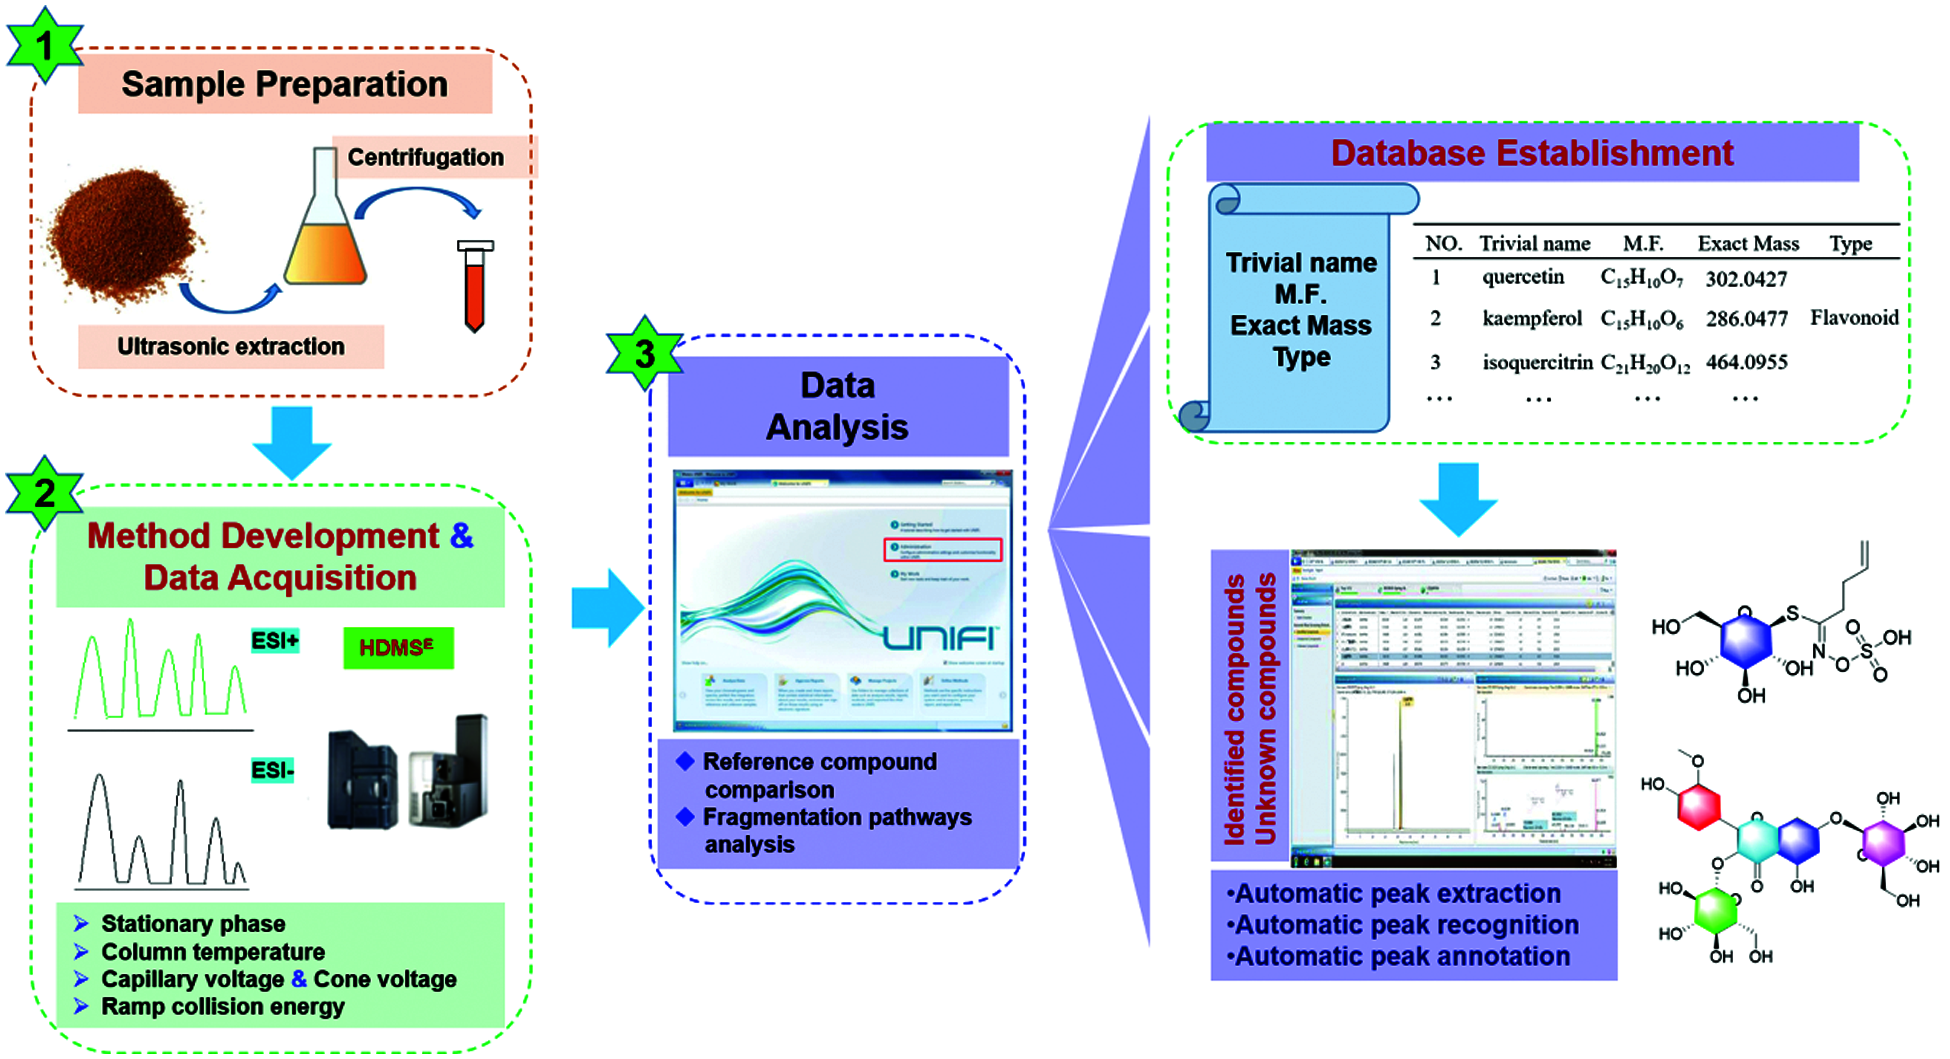
Figure 1: Schematic diagram for the rapid characterization of multiple components from the seeds of Descurainia sophia (SDS) by integrating dimension-enhanced UHPLC/IM-QTOF-MS and computational peak annotation because of the automatic MS information matching with the incorporated in-house library
Twenty compounds (Fig. 2) were used as reference compounds in this work. These compounds were isoquercitrin (1, C21H20O12), quercetin-7-O-β-D-glucopyranoside (2, C21H20O12), kaempferol-3-O-neohesperidoside (3, C27H30O15), kaempferol-3-O-rutinoside (4, C27H30O15), kaempferol (5, C15H10O6), luteolin (6, C15H10O6), quercetin (7, C15H10O7), apigenin (8, C15H10O5), isorhamnetin-3-O-glucoside (9, C22H22O12), kaempferol-7-O-glucoside (10, C21H20O11), kaempferol-3-O-β-D-glucuronide (11, C21H18O12), apigenin-7-O-β-D-glucuronide (12, C21H20O10), rutin (13, C27H30O16), eleutherodide A (14, C33H40O20), β-sitosterol (15, C35H60O6), glucosinalbin (16, C29H50O), scopolin (17, C14H19NO10S), psoralen (18, C16H18O9), sinapic acid (19, C11H6O3), and vanillic acid (20, C8H8O4). They were purchased from Chengdu Desite Biotechnology Co., Ltd. (Chengdu, China) or Shanghai Standard Biotech. Co., Ltd. (Shanghai, China),. The drug material for the seeds of D. sophia was collected from Hebei Province of China (Batch No. 190302). The specimens were deposited at the authors’ lab in Tianjin University of Traditional Chinese Medicine (Tianjin, China). HPLC-grade acetonitrile, methanol (Fisher, Fair Lawn, NJ, USA), formic acid (Sigma-Aldrich, MO, Switzerland), and ultra-pure water [in-house prepared using a Milli-Q Integral 5 water purification system (Millipore, Bedford, MA, USA)) were used.
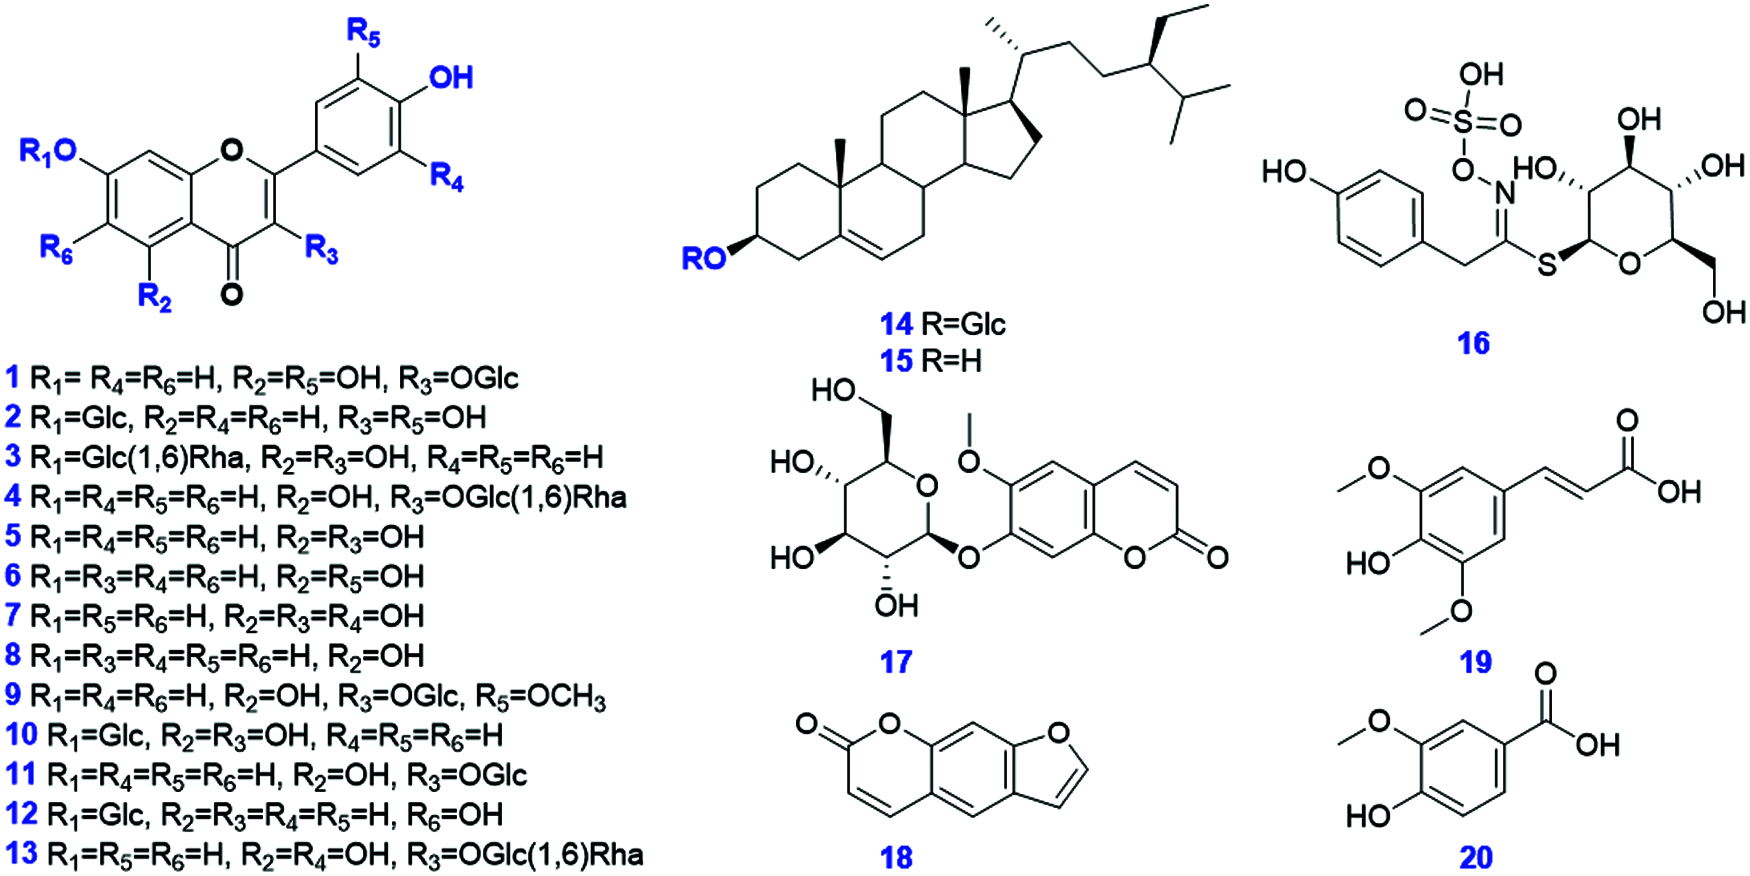
Figure 2: Chemical structures of 20 reference compounds used in the current work
An easy-to-implement ultrasonic extraction method was utilized for sample preparation from the SDS. In detail, 0.4 g of accurately weighed powder was soaked in a 15-mL centrifuge tube containing 5 mL of methanol. After being vortexed for 2 min, the sample was extracted on a water bath at 25°C with ultrasound assistance (power, 1130 W; frequency, 40 kHz) for 40 min. The extract was centrifuged for 10 min at 3,219 g (equal to 4,000 revolutions per min). The supernatant was further transferred into a 10-mL volumetric flask. The extraction process was repeated by using another 4 mL of methanol. The pooled supernatant was diluted to a constant volume (10 mL), and it was then well mixed. The solution was centrifuged at 11,481 g (14,000 revolutions per min) for 10 min, and diluted reaching a final concentration of drug material of 10 mg/mL.
Metabolites profiling of SDS was performed on the ACQUITY UPLC I-Class/VionTM IM-QTOF system (Waters Corporation, Milford, MA, USA). A Waters Acquity UPLC CSH C18 (2.1 × 100 mm, 1.7 µm) column hyphenated with a VanGuard Pre-column (2.1 × 50 mm, 1.7 μm) maintained at 30°C was used for the UHPLC separation. A binary mobile phase, composed by 0.1% formic acid in H2O (water phase: A) and CH3CN (organic phase: B), ran at 0.3 mL/min in consistency with an optimal gradient program: 0−3 min, 2% (B); 3−5 min, 2%−10% (B); 5−7 min, 10% (B); 7−10 min, 10%−13% (B); 10−15 min, 13% 21% (B); 15−21 min, 21% −28% (B); 21−24 min, 28%−40% (B); 24−26 min, 40%−65% (B); 26−31 min, 65%−85% (B); 31−35 min, 85%−100% (B); and 35−38 min, 100% (B). An aliquot of 3 μL of the test solution was injected onto the column for analysis.
High-accuracy MS data for structural elucidation were acquired on a VionTM IM-QTOF mass spectrometer in both the positive and negative electrospray ionization (ESI) modes by data-independent HDMSE (Waters). The LockSpray ion source was equipped adopting the following parameters: capillary voltage, 1.5 kV; cone voltage, 60 V; source offset, 80 V; source temperature, 120°C; desolvation gas temperature, 500°C; desolvation gas flow (N2), 800 L/h; and cone gas flow (N2), 50 L/h. Default parameters were defined for the travelling wave IM separation [24,25]. The QTOF analyzer scanned over a mass range of m/z 100−1500 at a low collision energy of 6 eV at 0.3 s per scan (MS1). Ramp collision energy (RCE) of 20−40 eV was set in high-energy channel for HDMSE. MS data calibration was conducted by constantly infusing the leucine enkephalin solution (Sigma-Aldrich; 200 ng/mL) at a flow rate of 10 µL/min. CCS calibration was conducted according to the Manufacture’s guidelines by using a mixture of calibrants [26].
Uncorrected HDMSE data in Continuum format were corrected and processed by using the UNIFITM 1.9.3.0 software (Waters). UNIFI could efficiently perform data correction, peak picking, and peak annotation [24,25]. Key parameters of UNIFI were set as follows. Find 4D Peaks (only set in HDMSE): High-energy intensity threshold, 1000.0 counts; low-energy intensity threshold, 500.0 counts. Target by mass: Target match tolerance, 10.0 ppm; screen on all isotopes in a candidate, generate predicted fragments from structure, and look for in-source fragments; fragment match tolerance, 10.0 ppm. Adducts: Positive adduct was +H. Lock Mass: Combine width, 3 scans; mass window, 0.5 m/z; reference mass, 556.2766; reference charge, +1. Adducts: Negative adduct was −H. Lock Mass: Combine width, 3 scans; mass window, 0.5 m/z; reference mass, 554.2620; reference charge, −1.
2.5 Creation of an in-House Library Incorporated into UNIFITM
Considering the restricted coverage of the commercial library on TCM components, we had the in-house library as a resource, which could guide the automatic annotation by UNIFI [24,25,27]. A systematic summary on the phytochemical reports of the seeds of D. sophia and Lepidium apetalum (two official plant sources for the TCM Ting-Li-Zi) was retrieved from multiple available databases (e.g., Web of Science, SciFinder, and CNKI, etc.). A chemical library was thus established recording the trivial name, molecular formula, and chemical structure for each compound. The collected structure information was input into an EXCEL file (.xls) in a format compatible with UNIFI, and each structure was drawn using ChemDraw Professional (Cambridge, USA), which was subsequently saved as a .mol file with the file name in consistency with the trivial name. The resulting EXCEL file and all structure files were incorporated into the UNIFI software, which can be utilized to efficiently annotate the obtained HDMSE data achieving structural elucidation for SDS.
We integrated the dimension-enhanced HDMSE and UNIFI-facilitated intelligent peak annotation workflows, based on the UHPLC/IM-QTOF-MS, to enable the rapid profiling and characterization of the multi-components from SDS. Meanwhile, considering the differentiated ionization rates for the different classes of SDS components, both the negative and positive ESI modes were utilized to acquire the CID-MS2 data.
As a result, good separation of the SDS components was accomplished by a reversed-phase UPLC CSH C18 column (column temperature: 30°C) within 38 min using CH3CN/0.1% FA-H2O as the mobile phase. Capillary voltage at 1.5 kV and cone voltage at 60 V in ESI− could give satisfactory ion response, but seldom induce the in-source fragmentation. RCE of 20−40 eV was able to acquire more balanced MS2 spectra than the setting of the fixed collision energy. The negative-mode CID-MS2 data were mainly used for structural elucidation, while the data obtained by ESI+ exerted complementarity. In the ESI− mode, one major peak was predominant, which thus hindered the characterization of the other relatively minor ones (Fig. 3). Thereby we applied the major components knockout strategy (the elutes at 7−8.8 min were automatically switched to the waste), by increasing the injection volume to 10 μL, which enabled the enrichment of a number of minor components. What’s more, an in-house library of Ting-Li-Zi was established to aid the intelligent peak annotation by UNIFI. A total of 47 related documents were found, which involved 232 known compounds (including two alkaloids, two benzoic acids, three cardiac glycosides, 66 flavonoids, 35 glucosides, 9 lignin, 10 organic acids, five phenolic compounds, three phenolic acids, two phenylacetamides, one phenylacetonitrile, 3 phenylethylamines, 12 phenylpropanoids, one steroid, eight tobacco flavor anhydrides, one triterpenoid, 10 uridine derivatives, and 59 others (Table S1).
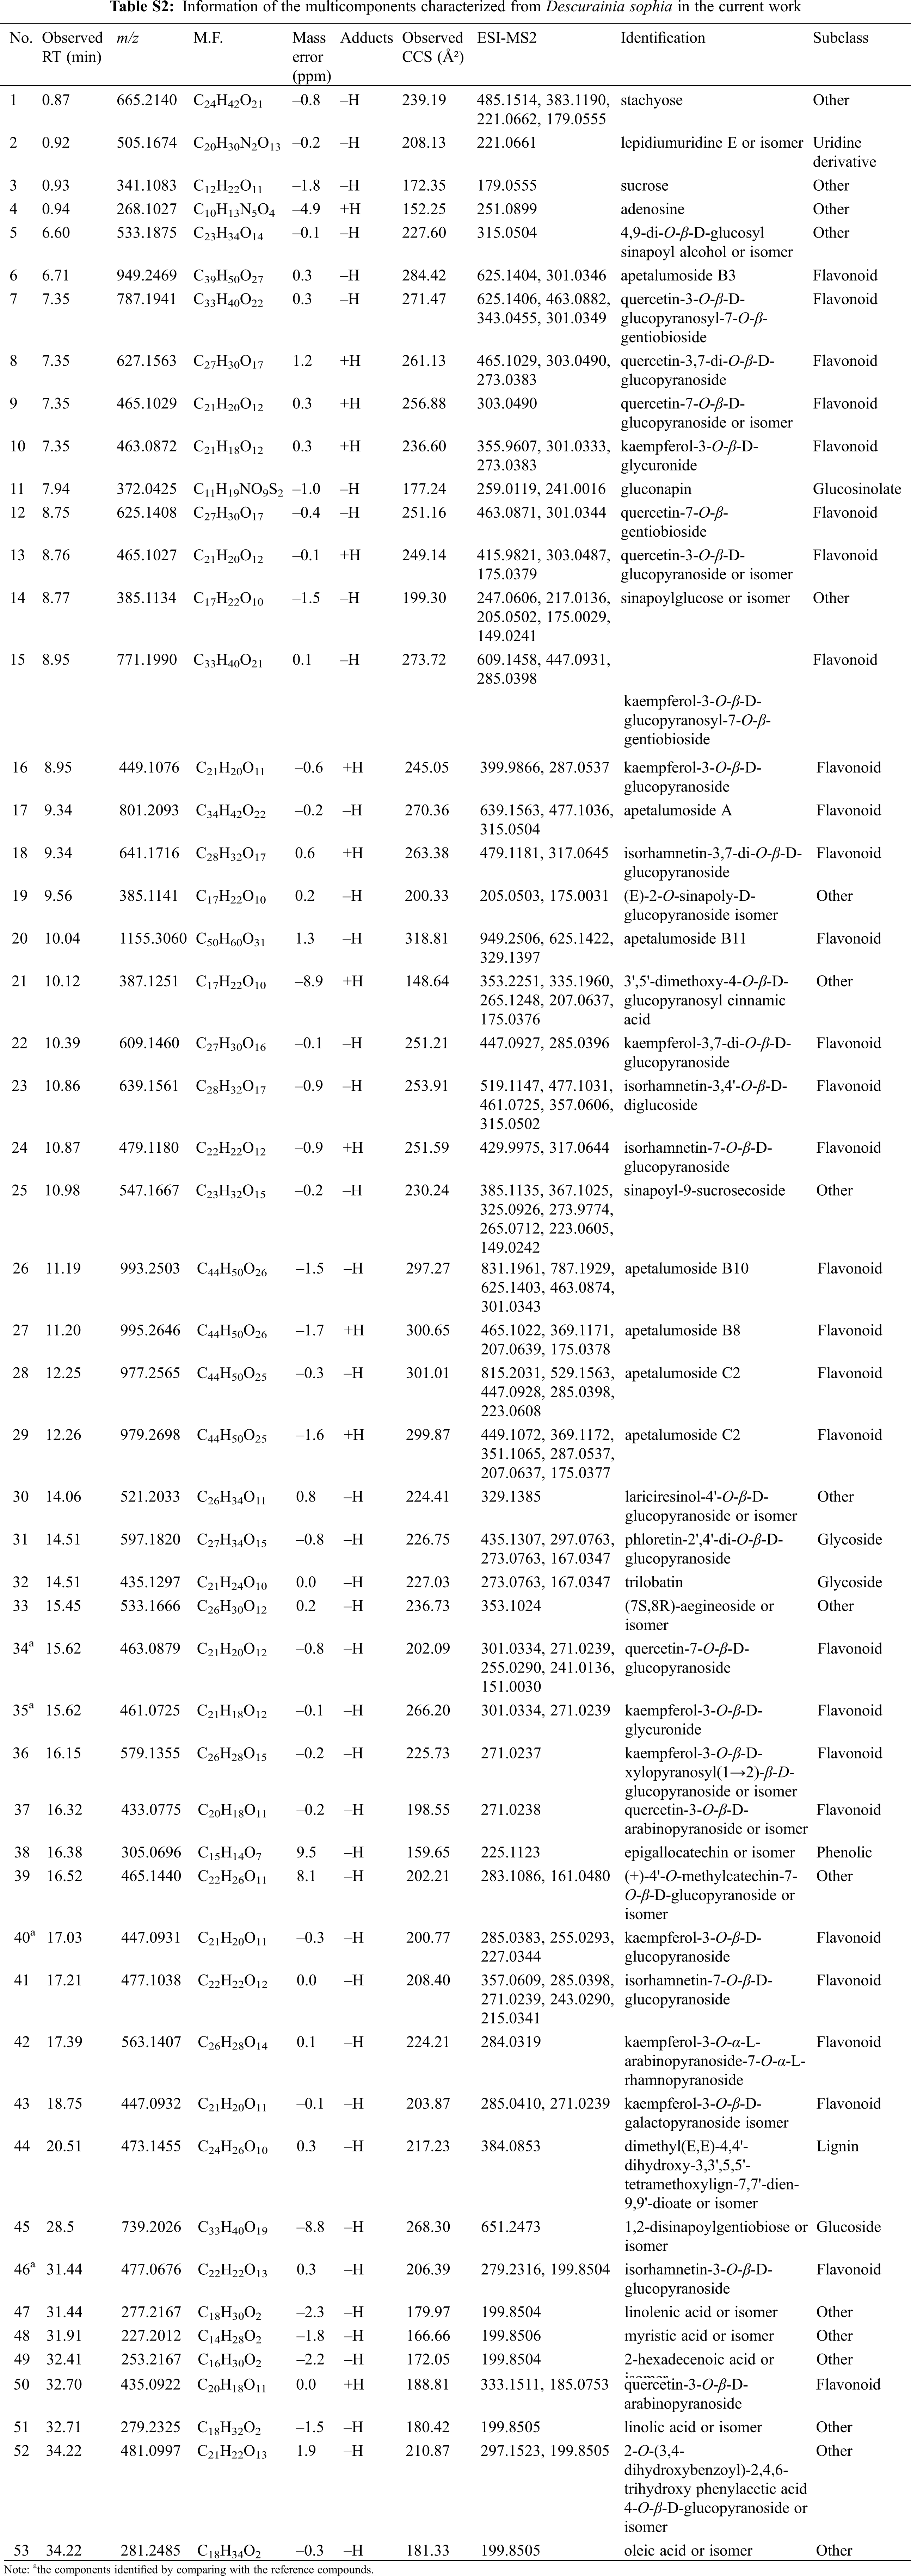
After the automatic matching between the determined CID-MS2 data with the predicted MS data (based on the in-house library) using UNIFI, combined with a subsequent confirmation step, a total of 53 compounds (Table S2 and Fig. 3) were identified or tentatively characterized from SDS by analyzing both the negative and positive CID-MS2 data. They included 29 flavonoids, one uridine derivative, four glucosides, one lignin, one phenolic compound, and 17 others. Notably, the CCS information for each characterized component is offered due to the enabling of the IM separation. The characterization of flavonoids and glucosinolates was illustrated in this work with representative compounds, and the others were outlined at the end of this section.
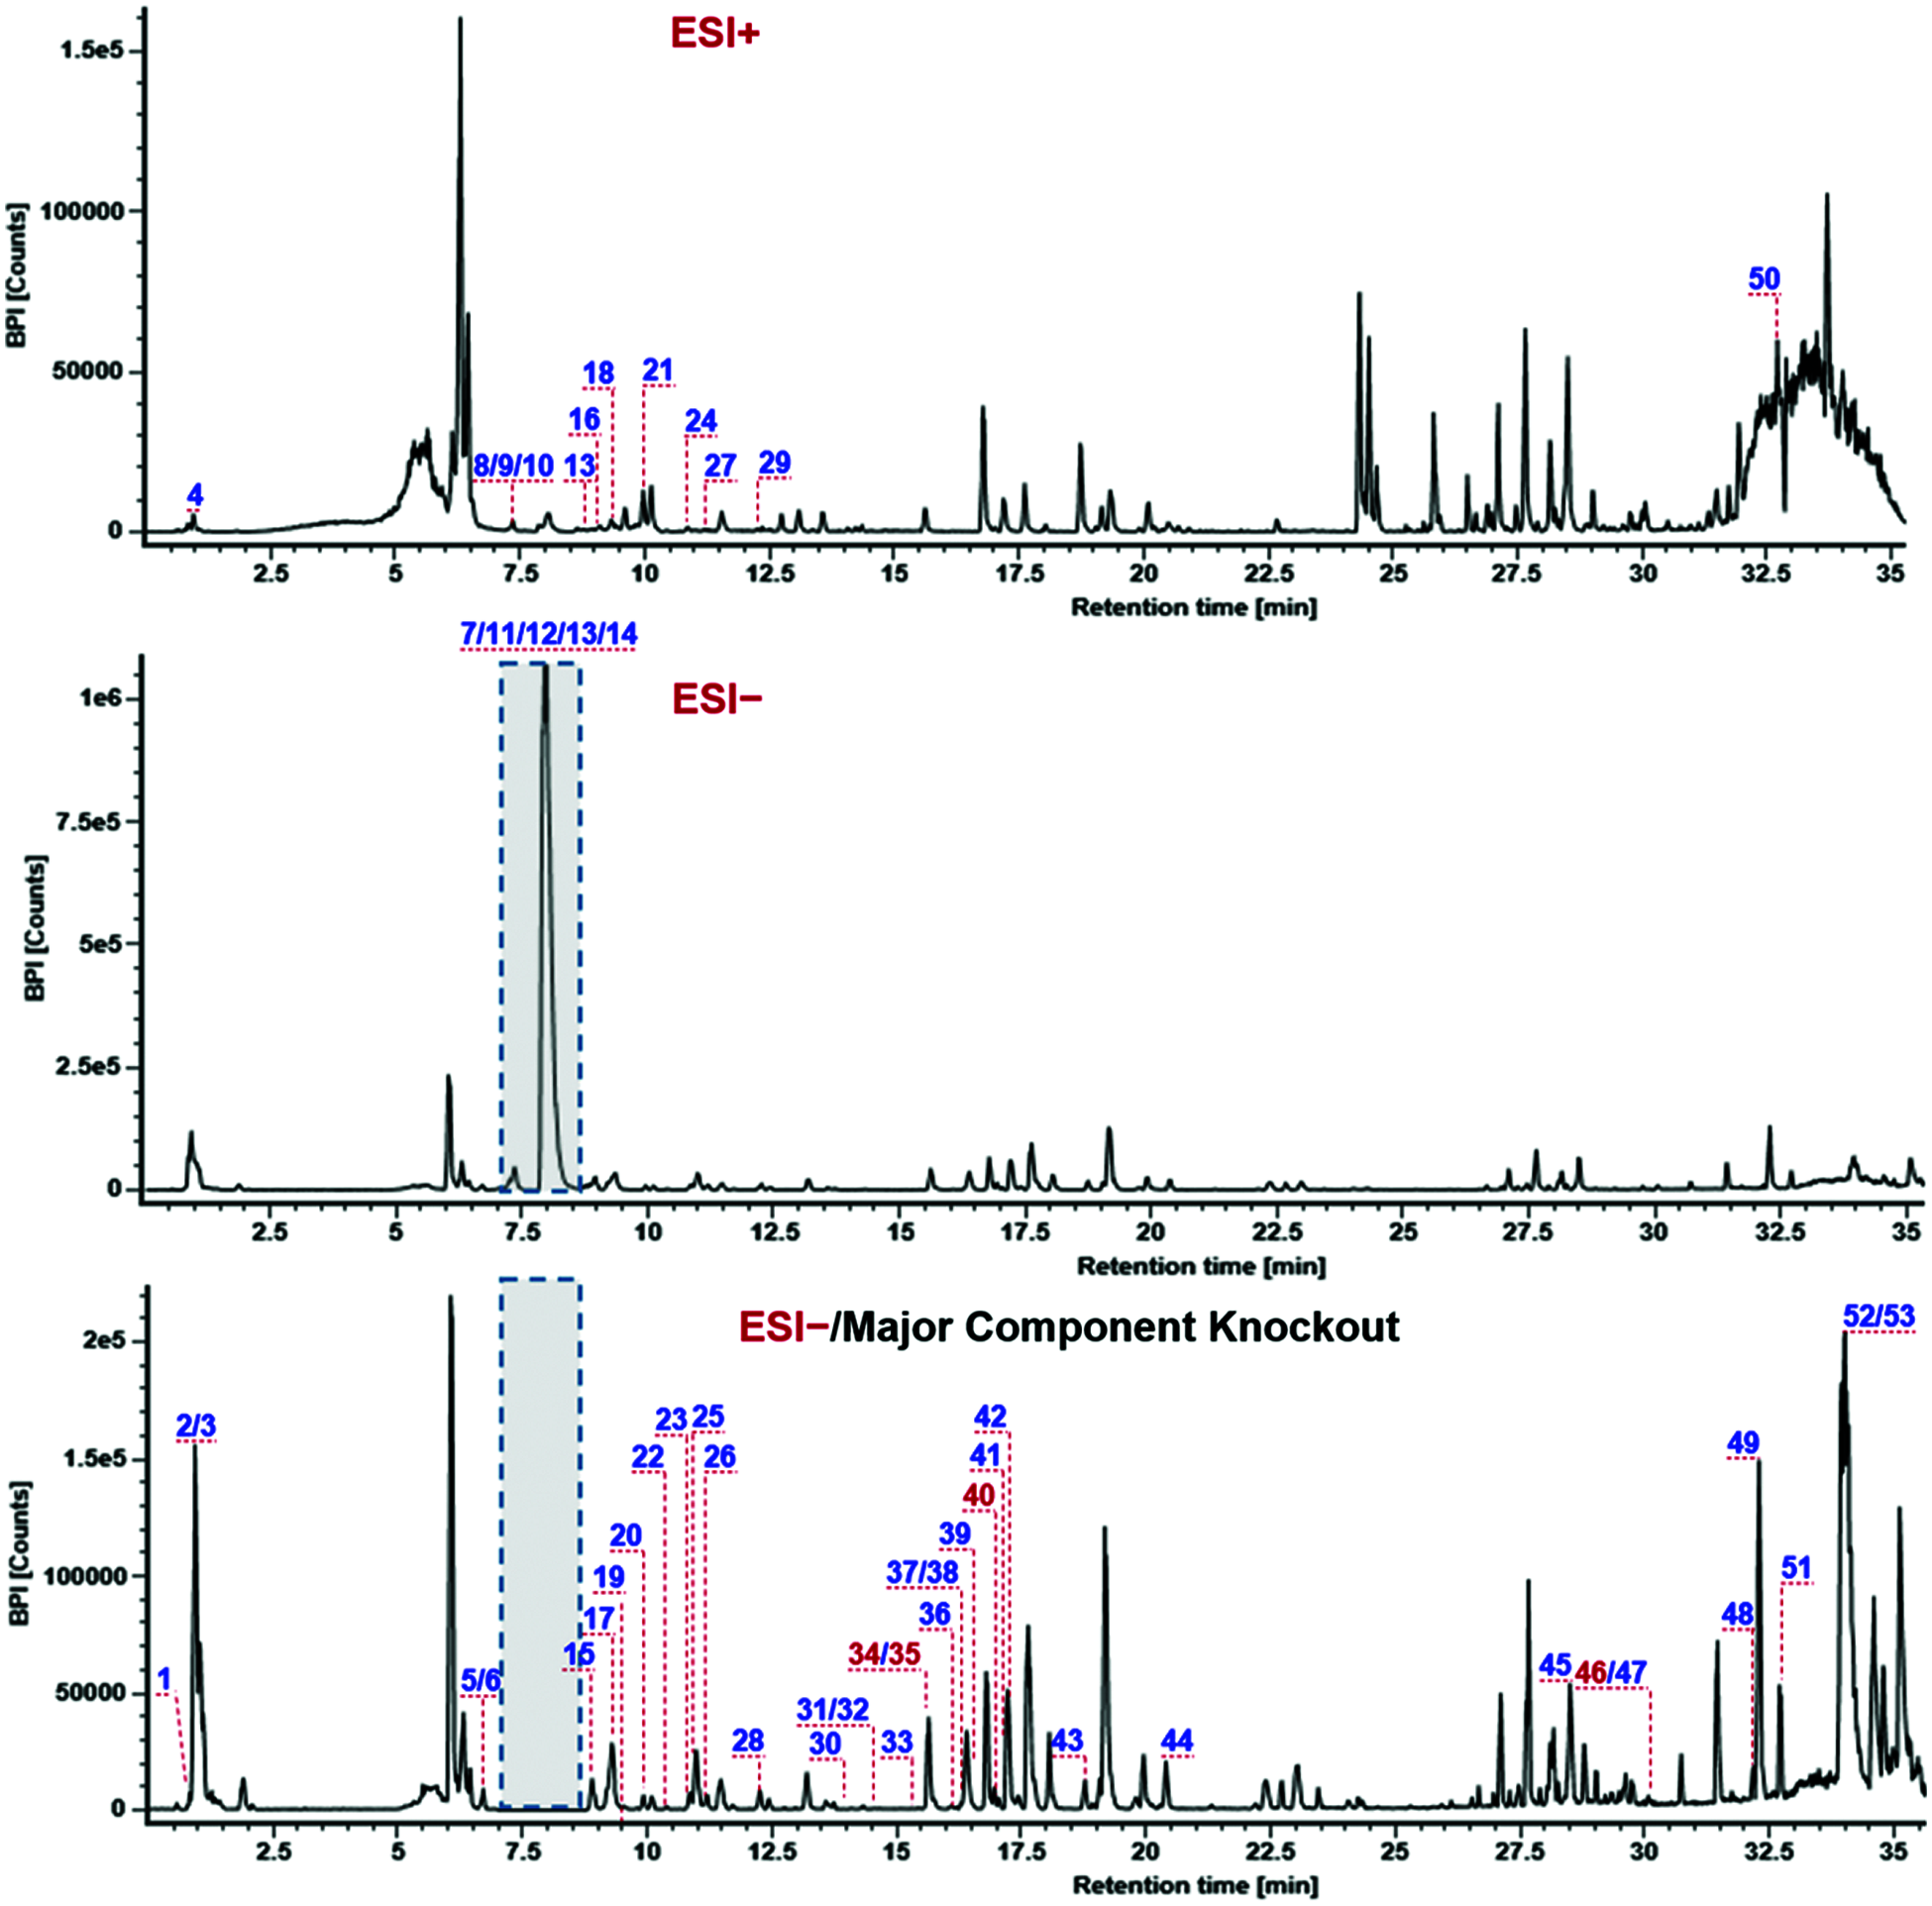
Figure 3: Base peak intensity chromatograms for the seeds of D. sophia obtained by HDMSE in the positive (ESI+) and negative (ESI−) modes with the peaks annotated with the numbering consistent with Table S2. A major components knockout strategy (eluates at 7−8.8 min switched to the waste) was utilized to enhance the characterization of minor components
3.1 Characterization of Flavonoids
Flavonoids are an important class of bioactive components in SDS, and we were able to characterize 29 flavonoids based on the CID-MS2 data in the current work. Interestingly, the sugars in these flavonoid O-glycosides are limited to glucose (Glc) and rhamnose (Rha), which could be characterized by the typical neutral losses of 162.05 Da and 146.06 Da, respectively. The structural differences are mainly embodied in the flavonoid aglycones, possibly as well as the glycosylation sites and the linkage patterns of multiple sugars which could not be exactly identified only by the MS information. The CID-MS/MS features of flavonoid O-glycosides were featured by the neutral loss of sugars and the production of deprotonated aglycone ions and their secondary fragments [28]. Here, the fragmentation pathways and characterization of compounds 18# (tR 9.34 min), 12# (tR 8.75 min) and 15# (tR 8.95 min) were illustrated (Fig. 4). The MS1 spectrum of compound 18# gave a rich protonated precursor ion ([M+H]+) at m/z 641.1716 in the positive ESI mode, based on which its molecular formula was characterized as C28H32O17. In the CID-MS2 spectrum, a fragment, due to the neutral loss of the Glc moiety, was observed at m/z 479.1181 ([M+H−Glc]+). In addition, the base peak ion at m/z 317.0645 should be the protonated aglycone after eliminating 2 × Glc ([M+H−2Glc]+), which could further lose the free radical −CH3 yielding a weak fragment at m/z 302.0414 (a homolytic fragmentation ion for the aglycone). The known flavonoid O-glycosides isolated from SDS only contain three flavonoid aglycones: isorhamnetin (C16H12O7), quercetin (C15H10O7), and kaempferol (C15H10O6), and accordingly the aglycone moiety in compound 18# should be isorhamnetin (C16H12O7). The observation of free radical fragmentation of −CH3 could also testify this aglycone structure. Ultimately, this compound was tentatively characterized as isorhamnetin-3,7-di-O-β-D-glucopyranoside or isomer [14]. The fragmentation pathways of compound 12# (tR 8.75 min) were analyzed based on the negative ESI-CID-MS2 data, which gave a rich deprotonated precursor ion ([M−H]−) at m/z 625.1408, based on which the molecular formula of C27H30O17 could be characterized. Two major product ions, at m/z 463.0871 ([M−H−Glc]−) and 301.0344 ([M−H−2Glc]−), were generated by successively losing two Glc residues. The aglycone could match the known quercetin (C15H10O7), and thus compound 12# was tentatively characterized as quercetin-7-O-β-D-gentiobioside or isomer by comparison with the literature [17]. Compound 15# (tR 8.95 min) was characterized as a tri-glycosidic flavonoid with a rich [M−H]− precursor ion observed at m/z 771.1990. Three major product ions were detected in the MS/MS spectrum at m/z 609.1458, 447.0931, and 285.0398, which could be assigned as [M−H−Glc]−, [M−H−2Glc]−, and [M−H−3Glc]−, respectively. The aglycone could match the known kaempferol (C15H10O6), and thus Compound 15# was identified as kaempferol-3-O-β-D-glucopyranosyl-7-O-β-gentiobioside or isomer [20]. To sum up, among these 29 flavonoids characterized from SDS, 12 compounds thereof (6#/7#/8#/9#/12#/13#/20#/26#/27#/34#/37#/50#) have the aglycone of quercetin, 11 (10#/15#/16#/22#/28#/29#/35#/36#/40#/42#/43#) with kaempferol, and 6 with isorhamnetin (/17#/18#/23#/24#/41#/46#).
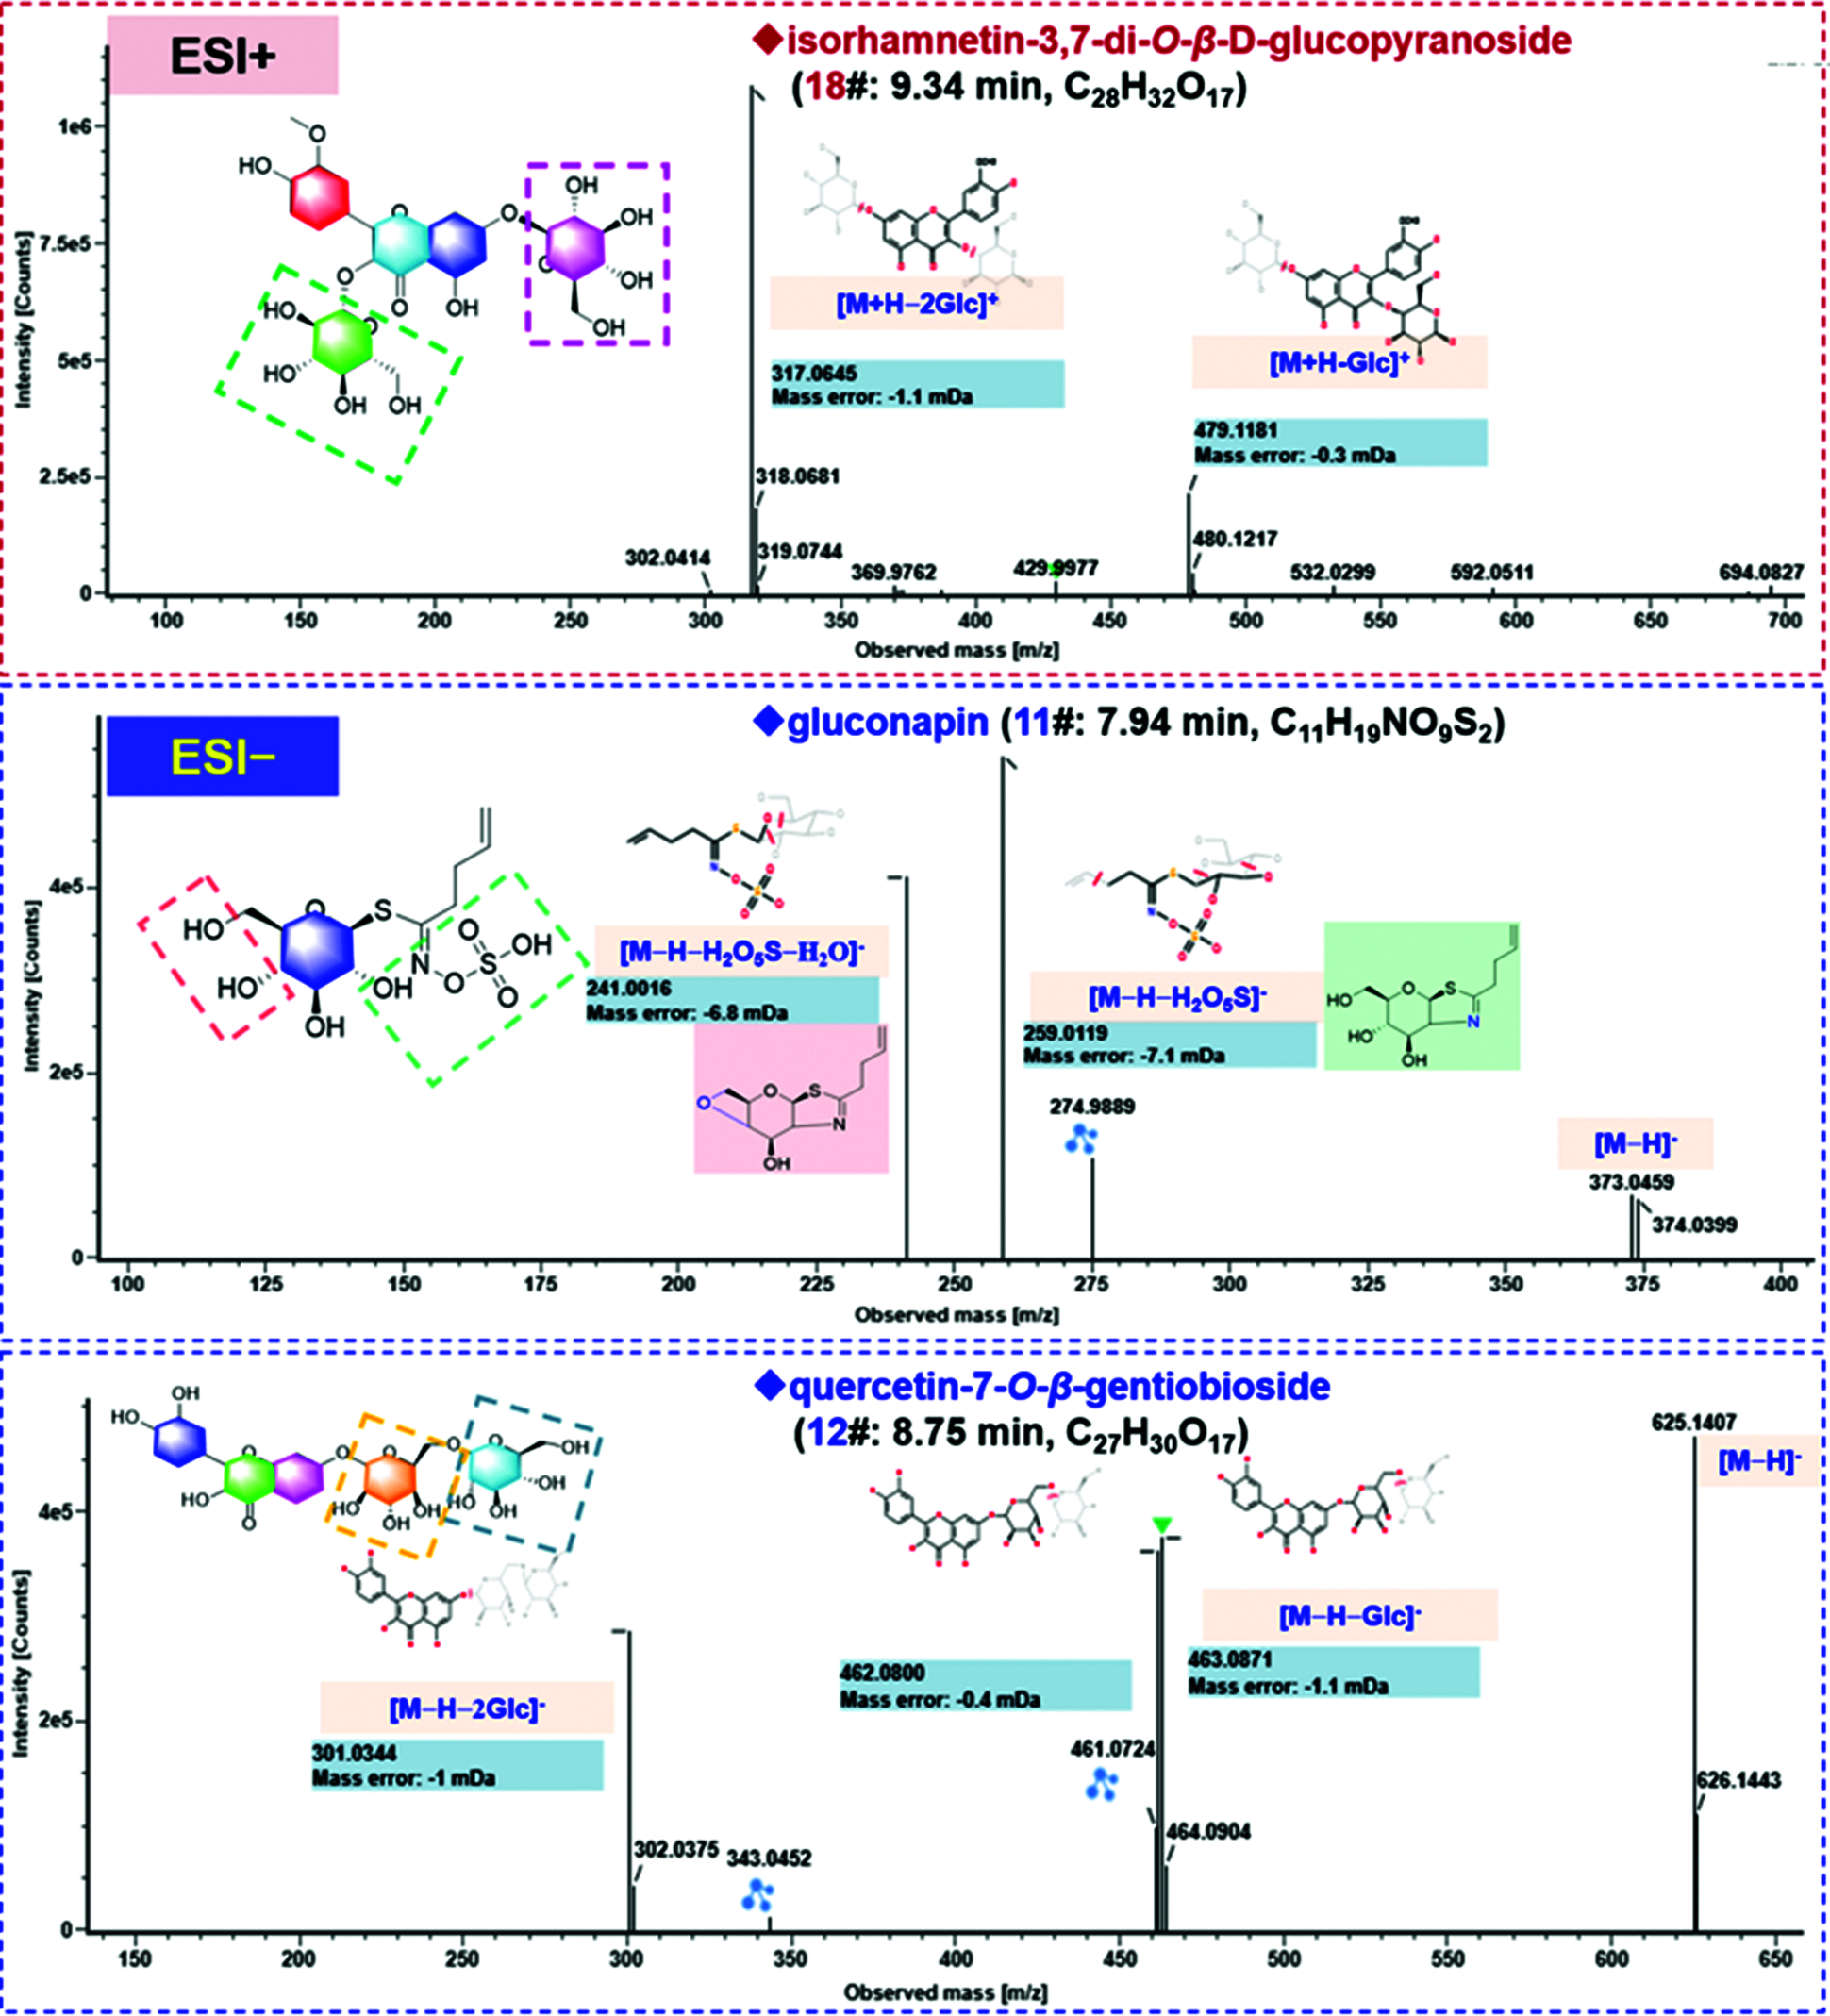
Figure 4: Annotation of the CID-MS2 spectra of the representative compounds for the flavonoids (compounds 18#, 12#, and 15#) and the glucosinolate (compound 11#), identified from the seeds of D. sophia based on both the positive and negative CID-MS2 data
3.2 Characterization of Glucosinolates
Isothiocyanates are the degradation products of glucosinolates ever isolated from SDS, including benzyl isothiocyanate, allyl isothiocyanate, 3-butenyl isothiocyanate, and 2-phenylethyl isothiocyanate, etc. [8]. Compound 11# (tR 7.94 min) was observed in the negative ESI mode, with a rich deprotonated precursor ion ([M−H]−) at m/z 372.0425. In its CID-MS2 spectrum, a fragment was observed at m/z 259.0119 ([M−H−H2O5S]−), together with its secondary fragment of m/z 241.0016 by losing a molecule of H2O ([M−H−H2O5S−H2O]−) (Fig. 4). By searching the literature, this compound was tentatively identified as gluconapin [29].
In addition to flavonoids and glucosinolates, one uridine derivative (2#), one lignin (44#), one phenolic compound (38#), and 17 others (1#/3#/4#/5#/14#/19#/21#/25#/30#/33#/39#/47#/48#/49#/51#/52#/53#), were also tentatively characterized from SDS by analyzing their high-resolution MS1 and MS2 data, and comparison with the literature as well. For example, the compound 3#, was observed in the negative ESI mode, with a rich deprotonated precursor ion ([M−H]−) at m/z 341.1083. In its CID-MS2 spectrum, a fragment, due to the neutral loss of Glc, was observed at m/z 179.0555 ([M−H−Glc]−). Accordingly, compound 3# was tentatively characterized as sucrose. Information for the other compounds characterized from SDS is detailed in Table S2.
4.1 Optimization of the Chromatography Condition
In order to separate and identify as many components as possible from SDS, the reversed-phase UHPLC conditions were optimized in terms of the stationary phase, column temperature, and elution gradient program. Effects of different stationary phases were evaluated, including four Waters sub-2 µm particles packed UHPLC columns, CSH C18 (2.1 × 100 mm, 1.7 μm), BEH Shield RP18 (2.1 × 100 mm, 1.7 μm), BEH C18 (2.1 × 100 mm, 1.7 μm), and HSS T3 (2.1 × 100 mm, 1.8 μm) (Fig. 5). Comparatively, most peaks could be separated on the CSH C18 column, and the peaks through the entire spectrum were more balanced than the other two columns. Therefore, we selected the CSH C18 column in this experiment. Moreover, the variations in column temperature (25−40°C) could influence the retention of SDS constituents, and most peaks were resolved under 30°C (Fig. S1). After further adjustment of the elution gradient, satisfactory separation of the SDS components was achieved.
Figure 5: Screening of the candidate chromatographic columns and optimization of two key ion source parameters (capillary voltage and cone voltage) of the VionTM IM-QTOF mass spectrometer for separating and characterizing the multicomponents from the seeds of D. sophia
4.2 Optimization of Key Parameters on the Vion TM IM-QTOF Mass Spectrometer
Key parameters that may affect the ion response (capillary voltage and cone voltage) and the fragmentation degree (RCE) of SDS components were optimized in the negative ESI mode. Capillary voltage (1.0/1.5/2.0/2.5/3.0 kV) and cone voltage (20/40/60/80/100 V) were measured to compare the difference in ion response, using the peak areas of seven components (isoquercitrin, isorhamnetin-3-O-glucoside, sinapoyl-9-sucrosecoside, apetalumoside C2, apetalumoside B10, apetalumoside A, and epigallocatechin) (Fig. 5). In general, the response of seven index compounds decreased with the increase of capillary voltage. To be specific, four (sinapoyl-9-sucrosecoside, apetalumoside C2, apetalumoside B10 and apetalumoside A) of the seven index compounds were best ionized at the capillary voltage of 1.5 kV, while the other three gave the highest ion response at 1.0 kV. Hence, we selected the capillary voltage of 1.5 kV as the most appropriate. The changes of cone voltage ranging from 20 to 100 V led to inconsistent variation trends for the index compounds. Except for apetalumoside A, the response of the other six compounds increased when cone voltage ascended from 20 to 60 V. When the cone voltage increased from 80 to100 V, the response tended to decline. The cone voltage at 60 V was finally selected in this experiment (Fig. 5). Advanced mass spectrometers can enable slope collision energy or mixed collision energy, which greatly enhanche the quality of the MS2 spectra producing more rich product ions [1,9]. RCE was optimized at four levels (e.g., 10−30 eV, 20−40 eV, 30−50 eV, and 40−60 eV) by observing the transitions of five compounds (quercetin 3-O-β-D-glucose-7-O-β-D-gentiobioside, isoquercitrin, isorhamnetin-3-O-D-glucoside, gluconapin, and sinapoyl-9-sucrosecoside) from the precursor to the product ions to sufficiently fragment different classes of chemical compounds in SDS (Fig. S2). Accordingly, RCE at 20−40 eV was selected, under which rich fragments were obtained for the SDS components.
In conclusion, the developed UHPLC/IM-QTOF-HDMSE approach combined with automatic peak annotation workflows of UNIFI enable the characterization of 53 compounds from the seeds of D. sophia, demonstrating a great improvement compared with the literature [14]. Computational data processing-based structural elucidation was very efficient giving reproducible characterization results independent of the professional knowledge in this field. Four dimensions of structure information could be generated by this integral approach, which could improve the reliability in identifying isomers if a CCS comparison is available. The results obtained would greatly benefit the quality control of this herbal medicine.
Acknowledgement: We thank the anonymous reviewers for their helpful comments.
Author Contribution: Simiao Wang, Xue Li, Boxue Chen, Shitong Li, and Jiali Wang performed the experiment and analyzed the experimental data. Jing Wang and Wenzhi Yang designed the research. Simiao Wang, Mingshuo Yang, and Wenzhi Yang drafted the manuscript. Xiaoyan Xu and Hongda Wang polished the manuscript.
Funding Statement: This work was financially supported by the National Key Research and Development Program of China (Grant No. 2018YFC1704500), Tianjin Committee of Science and Technology of China (Grant No. 21ZYJDJC00080), and National Natural Science Foundation of China (Grant No. 81872996).
Conflicts of Interest: The authors declare that they have no conflicts of interest to report regarding this present study.
1. Qian, Y. X., Li, W. W., Wang, H. M., Hu, W. D., Wang, H. D. et al. (2021). A four-dimensional separation approach by offline 2D-LC/IM-TOF-MS in combination with database-driven computational peak annotation facilitating the in-depth characterization of the multicomponents from Atractylodis Macrocephalae Rhizoma (Atractylodes macrocephala). Arabian Journal of Chemistry, 14(2), 102957. DOI 10.1016/j.arabjc.2020.102957. [Google Scholar] [CrossRef]
2. Luo, L., Jiang, J. W., Wang, C., Fitzgerald, M., Hu, W. F. et al. (2020). Analysis on herbal medicines utilized for treatment of COVID‐19. Acta Pharmaceutica Sinica B, 10(7), 1192–1204. DOI 10.1016/j.apsb.2020.05.007. [Google Scholar] [CrossRef]
3. Yang, W. Z., Zhang, Y. B., Wu, W. Y., Huang, L. Q., Guo, D. A. et al. (2017). Approaches to establish Q-markers for the quality standards of traditional Chinese medicines. Acta Pharmaceutica Sinica B, 7(4), 439–446. DOI 10.1016/j.apsb.2017.04.012. [Google Scholar] [CrossRef]
4. Wang, S. M., Qian, Y. X., Sun, M. X., Jia, L., Hu, Y. et al. (2020). Holistic quality evaluation of Saposhnikoviae Radix (Saposhnikovia divaricata) by reversed-phase ultra-high performance liquid chromatography and hydrophilic interaction chromatography coupled with ion mobility quadrupole time-of-flight mass spectrometry-based untargeted metabolomics. Arabian Journal of Chemistry, 13(12), 8835–8847. DOI 10.1016/j.arabjc.2020.10.013. [Google Scholar] [CrossRef]
5. Qiu, S., Yang, W. Z., Shi, X. J., Yao, C. L., Yang, M. et al. (2015). A green protocol for efficient discovery of novel natural compounds: Characterization of new ginsenosides from the stems and leaves of Panax ginseng as a case study. Analytica Chimica Acta, 893, 65–76. DOI 10.1016/j.aca.2015.08.048. [Google Scholar] [CrossRef]
6. Turgumbayeva, A., Ustenova, G., Datkhayev, U., Rahimov, K., Stankevicius, E. (2019). Safflower (Carthamus tinctorius L.) a potential source of drugs against cryptococcal infections, malaria and leishmaniasis. Phyton-International Journal of Experimental Botany, 88(3), 137–146. DOI 10.32604/phyton.2020.07665. [Google Scholar] [CrossRef]
7. Yang, W. Z., Ye, G., Meng, A. H., Sabir, G., Qiao, X. et al. (2013). Rapid characterisation of flavonoids from Sophora alopecuroides L. by HPLC/DAD/ESI-MSn. Natural Product Research, 27(4–5), 323–330. DOI 10.1080/14786419.2012.688052. [Google Scholar] [CrossRef]
8. Yang, W. Z., Shi, X. J., Yao, C. L., Huang, Y., Hou, J. J. et al. (2020). A novel neutral loss/product ion scan-incorporated integral approach for the untargeted characterization and comparison of the carboxyl-free ginsenosides from Panax ginseng, Panax quinquefolius, and Panax notoginseng. Journal of Pharmaceutical and Biomedical Analysis, 177, 112813. DOI 10.1016/j.jpba.2019.112813. [Google Scholar] [CrossRef]
9. Fu, L. L., Ding, H., Han, L. F., Jia, L., Yang, W. Z. et al. (2019). Simultaneously targeted and untargeted multicomponent characterization of Erzhi Pill by offline two-dimensional liquid chromatography/quadrupole-Orbitrap mass spectrometry. Journal of Chromatography A, 1584, 87–96. DOI 10.1016/j.chroma.2018.11.024. [Google Scholar] [CrossRef]
10. Feng, K. Y., Wang, S. M., Han, L. F., Qian, Y. X., Li, H. F. et al. (2021). Configuration of the ion exchange chromatography, hydrophilic interaction chromatography, and reversed-phase chromatography as off-line three-dimensional chromatography coupled with high-resolution quadrupole-orbitrap mass spectrometry for the multicomponent characterization of Uncaria sessilifructus. Journal of Chromatography A, 1649, 462237. DOI 10.1016/j.chroma.2021.462237. [Google Scholar] [CrossRef]
11. Tu, J., Zhou, Z. W., Li, T. Z., Zhu, Z. J. (2019). The emerging role of ion mobility-mass spectrometry in lipidomics to facilitate lipid separation and identification. TrAC Trends in Analytical Chemistry, 116(Suppl. 50), 332–339. DOI 10.1016/j.trac.2019.03.017. [Google Scholar] [CrossRef]
12. Zhou, Z. W., Tu, J., Xiong, X., Shen, X. T., Zhu, Z. J. (2017). LipidCCS: Prediction of collision cross-section values for lipids with high precision to support ion mobility-mass spectrometry-based lipidomics. Analytical Chemistry, 89(17), 9559–9566. DOI 10.1021/acs.analchem.7b02625. [Google Scholar] [CrossRef]
13. Shi, P. P., Chao, L. P., Wang, T. X., Liu, E. W., Han, L. F. et al. (2015). New bioactive flavonoid glycosides isolated from the seeds of Lepidium apetalum Willd. Fitoterapia, 103, 197–205. DOI 10.1016/j.fitote.2015.04.007. [Google Scholar] [CrossRef]
14. Meng, Z. H., Qiao, L., Wang, Z. Q., Ma, Z. S., Jia, J. M. et al. (2015). Analysis of the constituents in Semen descurainiae by UPLC/Q-TOF-MS/MS. Journal of Chinese Pharmaceutical Sciences, 24(5), 303–309. DOI 10.5246/jcps.2015.05.039. [Google Scholar] [CrossRef]
15. Committee of National Pharmacopoeia (2020). China pharmacopoeia (Part 1). Beijing: Chemical Industry Press. [Google Scholar]
16. Li, M., Zeng, M. N., Zhang, Z. G., Zhang, J. K., Zhang, X. K. et al. (2019). Chemical constituents from the seeds of Lepidium apetalum. Chinese Traditional Patent Medicine, 41(1), 115–110. DOI 10.3969/j.issn.1001-1528.2019.01.022. [Google Scholar] [CrossRef]
17. Sun, K., Li, X. (2002). Progress in studies on chemical constituents and pharmacological effect of Semen lepidii and Semen descurainiae. Chinese Traditional and Herbal Drugs, 33(7), 100–102. DOI 10.7501/j.issn.0253-2670.2002.7.341. [Google Scholar] [CrossRef]
18. Guo, W. T., Xing, S. H., Chen, Y., Yi, J. H., Zhang, Y. N. et al. (2018). Research progress of Semen lepidii and its herbal compound on ascites. Chinese Medicine Modern Distance Education of China, 16(6), 157–159. DOI 10.3969/j.issn.1672-2779.2018.06.064. [Google Scholar] [CrossRef]
19. Sun, K., Li, X., Liu, J. M., Wang, J. H., Li, W. et al. (2005). A novel sulphur glycoside from the seeds of Descurainia sophia (L.). Journal of Asian Natural Products Research, 7(6), 853–856. DOI 10.1080/1028602042000204072. [Google Scholar] [CrossRef]
20. Wang, A. Q., Wang, X. K., Li, J. L., Cui, X. Y. (2004). Isolation and structure identification of chemical constituents from the seeds of Descurainia sophia L. Webb ex Prantl. Acta Pharmaceutica Sinica, 39(1), 46–51. DOI 10.16438/j.0513-4870.2004.01.011. [Google Scholar] [CrossRef]
21. Chen, D., Liu, X., Yang, X. H., Sun, K. (2010). Study on chemical constituents of Descurainia sophia (L.) Webb ex Prantl. Special Wild Economic Animal and Plant Research, 32(2), 62–63. DOI 10.16720/j.cnki.tcyj.2010.02.022. [Google Scholar] [CrossRef]
22. Li, J. R., Huang, W. H., Guo, B. L., Chen, A. J. (2010). Research on chemical content standard of Semen descurainiae. Chinese Journal of Pharmaceutical Analysis, 30(5), 950–953. DOI 10.16155/j.0254-1793.2010.05.009. [Google Scholar] [CrossRef]
23. Wang, W. P., Wu, H. M., Liu, M. T., Xu, Y. C., Yin, X. B. et al. (2020). Stability study of quercetin-3-O-β-D-glucose-7-O-β-D-diglycoside in Descurainia sophia seeds. China Journal of Traditional Chinese Medicine and Pharmacy, 35(11), 5739–5742. [Google Scholar]
24. Zhang, C. X., Zuo, T. T., Wang, X. Y., Wang, H. D., Hu, Y. et al. (2019). Integration of data-dependent acquisition (DDA) and data-independent high-definition MSE (HDMSE) for the comprehensive profiling and characterization of multicomponents from Panax japonicus by UHPLC/IM-QTOF-MS. Molecules, 24(15), 2708. DOI 10.3390/molecules24152708. [Google Scholar] [CrossRef]
25. Zuo, T. T., Qian, Y. X., Zhang, C. X., Wei, Y. X., Wang, X. Y. et al. (2019). Data-dependent acquisition and database-driven efficient peak annotation for the comprehensive profiling and characterization of the multicomponents from compound Xueshuantong capsule by UHPLC/IM-QTOF-MS. Molecules, 24(19), 3431. DOI 10.3390/molecules24193431. [Google Scholar] [CrossRef]
26. Paglia, G., Angel, P., Williams, J. P., Richardson, K., Olivos, H. J. et al. (2015). Ion mobility-derived collision cross section as an additional measure for lipid fingerprinting and identification. Analytical Chemistry, 87(2), 1137–1144. DOI 10.1021/ac503715v. [Google Scholar] [CrossRef]
27. Jia, L., Zuo, T. T., Zhang, C. X., Li, W. W., Wang, H. D. et al. (2019). Simultaneous profiling and holistic comparison of the metabolomes among the flower buds of Panax ginseng, Panax quinquefolius, and Panax notoginseng by UHPLC/IM-QTOF-HDMSE-based metabolomics analysis. Molecules, 24(11), 2188. DOI 10.3390/molecules24112188. [Google Scholar] [CrossRef]
28. Yang, W. Z., Qiao, X., Bo, T., Wang, Q., Guo, D. A. et al. (2014). Low energy induced homolytic fragmentation of flavonol 3-O-glycoside by negative electrospray ionization tandem mass spectrometry. Rapid Communications in Mass Spectrometry, 28(4), 385–395. DOI 10.1002/rcm.6794. [Google Scholar] [CrossRef]
29. Chen, J. M., Guan, R. Z. (2006). Extraction and identification of several glucosinolates in Descurainia sophia seeds. Acta Botanica Boreali-Occidentalia Sinica, 4(6), 1231–1235. DOI 10.3321/j.issn:1000-4025.2006.06.023. [Google Scholar] [CrossRef]
Supporting Information

Figure S1: Comparison of column temperature (CSH C18 column) in ESI–mode for separating the multicomponents from the seeds of Descurainia sophia (SDS)
Figure S2: Optimization of the ramp collision energy (RCE) for HDMSE using five representative compounds
 | This work is licensed under a Creative Commons Attribution 4.0 International License, which permits unrestricted use, distribution, and reproduction in any medium, provided the original work is properly cited. |