| Phyton-International Journal of Experimental Botany |
DOI: 10.32604/phyton.2022.017359
ARTICLE
Integrated Nutrient Management Improves Productivity and Quality of Sugarcane (Saccharum Officinarum L.)
1Physiology and Sugar Chemistry Division, Bangladesh Sugarcrop Research Institute, Ishurdi, 6620, Bangladesh
2On-Farm Research Division, Bangladesh Agricultural Research Institute, Pabna, 6600, Bangladesh
3Department of Agricultural Chemistry, Bangladesh Agricultural University, Mymensingh, 2202, Bangladesh
4Department of Food Technology and Rural Industries, Bangladesh Agricultural University, Mymensingh, 2202, Bangladesh
5Department of Biology, College of Science, Taif University, Taif, 21944, Saudi Arabia
6Nature Conservation Sector, Egyptian Environmental Affairs Agency, Cairo, 11728, Egypt
7Regional Research Station, Panjab Agricultural University, Kapurthala, 144601, India
8Bangladesh Wheat and Maize Research Institute, Dinajpur, 5200, Bangladesh
*Corresponding Authors: Akbar Hossain. Email: akbarhossainwrc@gmail.com; Mohamed M. Hassan. Email: m.khyate@tu.edu.sa
Received: 05 May 2021; Accepted: 14 July 2021
Abstract: Sugarcane is one of the major important sugar yielding crops in Bangladesh. As an exhaustive crop, sugarcane removes a huge amount of plant nutrients from the soil. However, the combined use of organic and inorganic fertilizers can be a good approach to deal with nutrient depletion and promote sustainable crop production as well as improve soil health. Therefore, an attempt was made to identify the most fruitful and profitable integrated nutrient management on the aspects of growth, yield and quality of sugarcane in two consecutive growing seasons. Seven treatments: T1 = Control, T2 = 165:55:120:30:10:2.5:4 kg N:P:K:S:Mg:Zn:B ha−1, T3 = Poultry Litter (PL) at 5 t ha−1 + 95:51:87:9:10:2.5:4 kg N:P:K:S:Mg:Zn:B ha−1, T4 = Cow Dung (CD) at 15 t ha−1 + 36:52:60:17:10:2.5:4 kg N:P:K:S:Mg:Zn:B ha−1, T5 = Press Mud (PM) at 15 t ha−1 + 10:50:43:0:10:2.5:4 kg N:P:K:S:Mg:Zn:B ha−1, T6 = Mustard Oil Cake (MOC) at 0.5 t ha−1 + 140:54:115:25:10:2.5:4 kg N:P:K:S:Mg:Zn:B ha−1 and T7 = GM (Green Manure) at 5 t ha−1 + 140:53:100:28:10:2.5:4 kg N:P:K:S:Mg:Zn:B ha−1 were used in this experiment. Two years data showed that treatment T3 produced the maximum amount of tillers, total dry matter yield, millable sugarcane, cane yield and sugar yield, followed by the T4 treatment. The highest stalk heights were recorded in the T3 treatment, which was statistically similar to all other treatments except T1 and T2. The juice quality parameters viz., brix and pol in cane were found significant in treatment T3 while the highest purity was obtained in the T7 treatment. All the data of Jaggery (goor) quality parameters, the highest sucrose content, color transmittance, Jaggery (goor) recovery and the lowest ash content of Jaggery (goor) were observed in the T3 treatment, which was statistically similar to the T4 treatment in both seasons. The highest cost of production was obtained from the T6 treatment while the highest gross return, net return and BCR were recorded in the T3 treatment. No significant changes were found in one cycle of sugarcane in initial and post-harvest soil characteristics viz., pH, organic carbon, total N, and available P, K and S contents due to integrated use of different fertilizer packages. From the experimental findings, it was concluded that treatment T3 followed by T4 treatment would be the better productive and profitable integrated nutrient management technology for ensuring higher yields and quality of sugarcane without soil fertility degradation in the High Ganges River Floodplain soils.
Keywords: Nutrient; fertilizer; growth; physiology; yield; quality; sugarcane
Sugarcane is one of the most important sugar and Jaggery (goor) producing crop in Bangladesh. It provides a rich source of sucrose, alcohol and organic matter waste which is utilized as fertilizer. Around 70% of the total world’s sugar is produced from sugarcane [1]. In Bangladesh, on an average, 4.5 million metric tons of sugarcane are produced annually from 0.11 million hectares of land. Every year, it occupies an average of 1.39% of the country’s total cultivable land [2]. Presently average cane yield in Bangladesh is around 50.0 t ha−1, which is quite low in comparison with many other sugarcane-growing countries. The crop is grown mainly under rain-fed upland conditions. Most soils in this country are low in organic matter (OM) generally containing less than 1.5% while 2.5–3.0% OM is necessary for a sustainable crop production [3]. An 85 ton cane crop absorbs 122 kg N, 24 kg P, 142 kg K and 48 kg S per hectare from soil [4]. Due to the heavy depletion of soil nutrients, sugarcane soils become less fertile and fail to produce higher yields. Henceforth, nutrient replenishment through the addition of organic manures and inorganic fertilizers in the soil is indispensable for achieving higher cane yields. The use of chemical fertilizers does not necessarily lead to better farming than the use of organic fertilizers in agriculture. Due to the continuous application of only chemical fertilizers and plant protection chemicals in agriculture, soils have been badly degraded. It has destroyed the stable traditional ecosystem of the soil [5]. There is a need to encourage a more productive, cost-efficient and eco-friendly farming system [6]. The concept of integrated soil and nutrient management implies practices such as appropriate crop rotations, cover crops, use of manure, crop residues and fertilizers, conservation and no-tillage, moisture management, etc. [7]. The integrated nutrient management (INM) approach improves and sustains soil fertility and provides a sound basis for crop production systems to meet the changing needs through optimization of the benefits from all possible sources of plant nutrients in an integrated manner [8].
Plant nutrients are very essential for crop growth and development. They must be applied at the required quantity, right time and the right place to improve growth and yield of crops [9]. The use of organic fertilizer has been the need for improving the sustainable productivity of soil. Dutta et al. [10] stated that the use of organic fertilizers together with chemical fertilizers, compared to the addition of organic fertilizers alone, had a higher positive effect on microbial biomass and hence soil health. The application of organic fertilizers in combination with chemical fertilizers has been reported to increase absorption of N, P and K in sugarcane leaf tissues in plant and ratoon crop, as compared to chemical fertilizers alone [11]. The application of OM from such resources as animal manure, crop residues and green manuring has been shown to replenish soil organic C and improve soil fertility [12]. The objectives of this study were: (1) to study the effect of organic and chemical fertilizers with their combinations on growth, yield and yield attributes of sugarcane, (2) to observe the influence of organic and chemical fertilizers on the nutrient status of the initial and post-harvest soils, and (3) to find out the economics of different nutrient management practices.
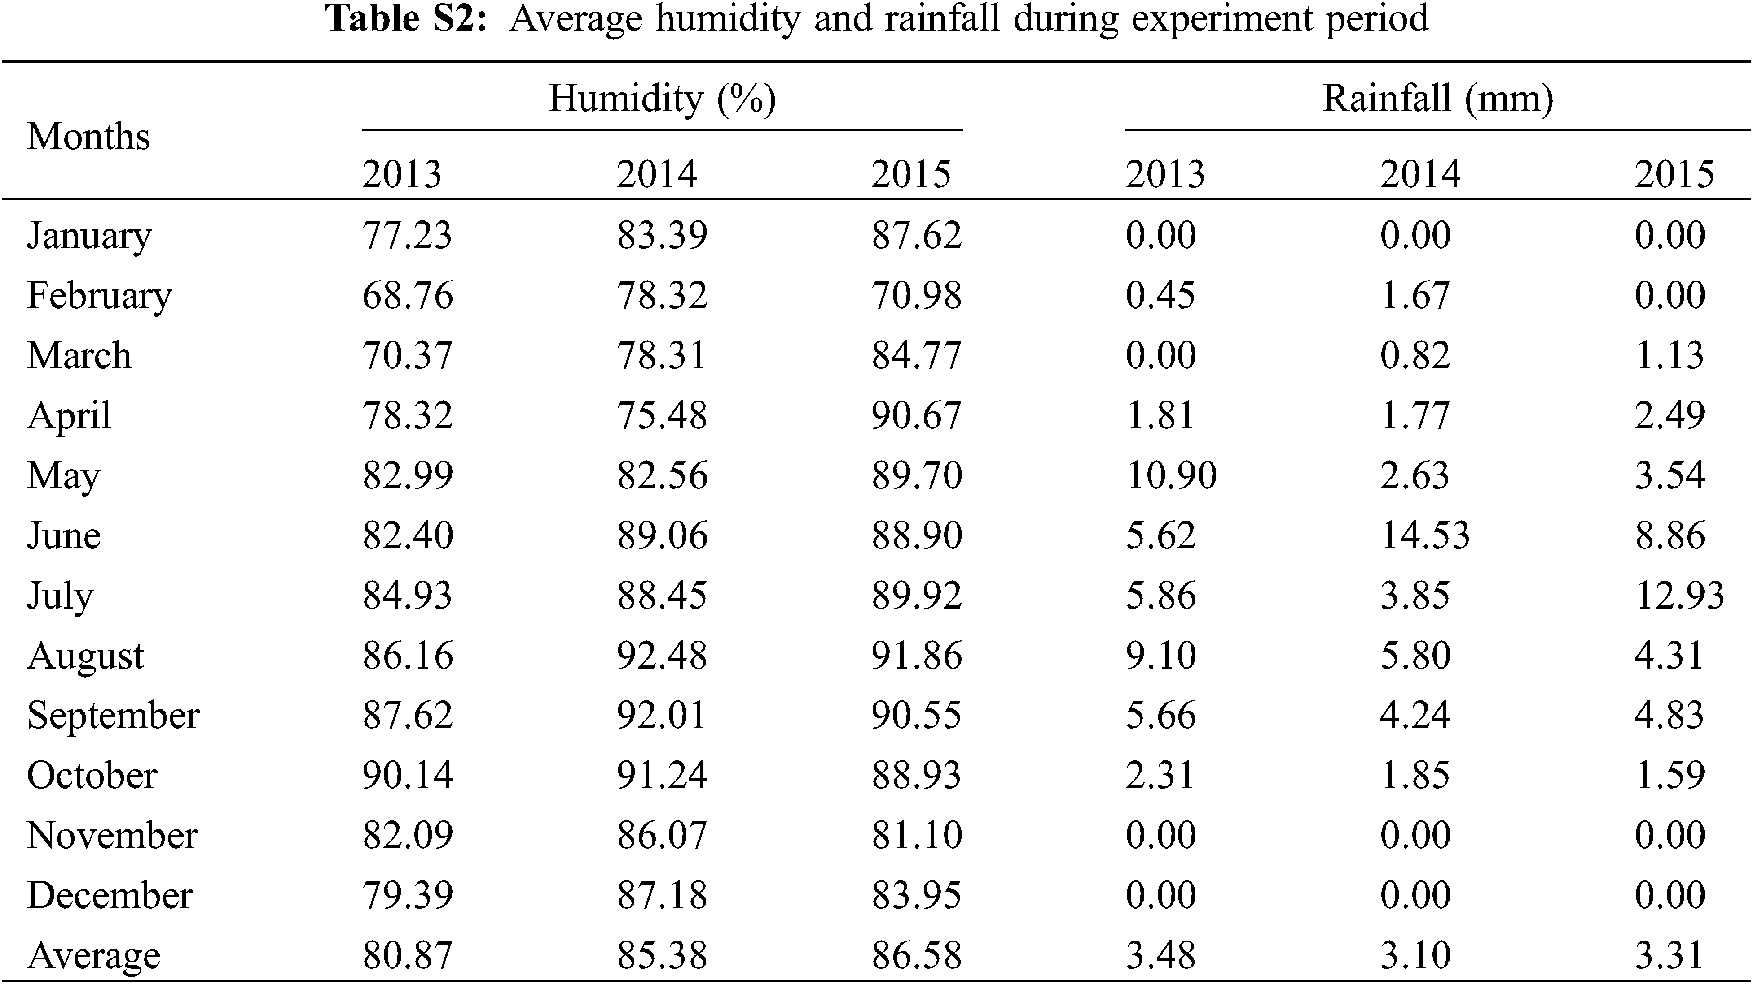
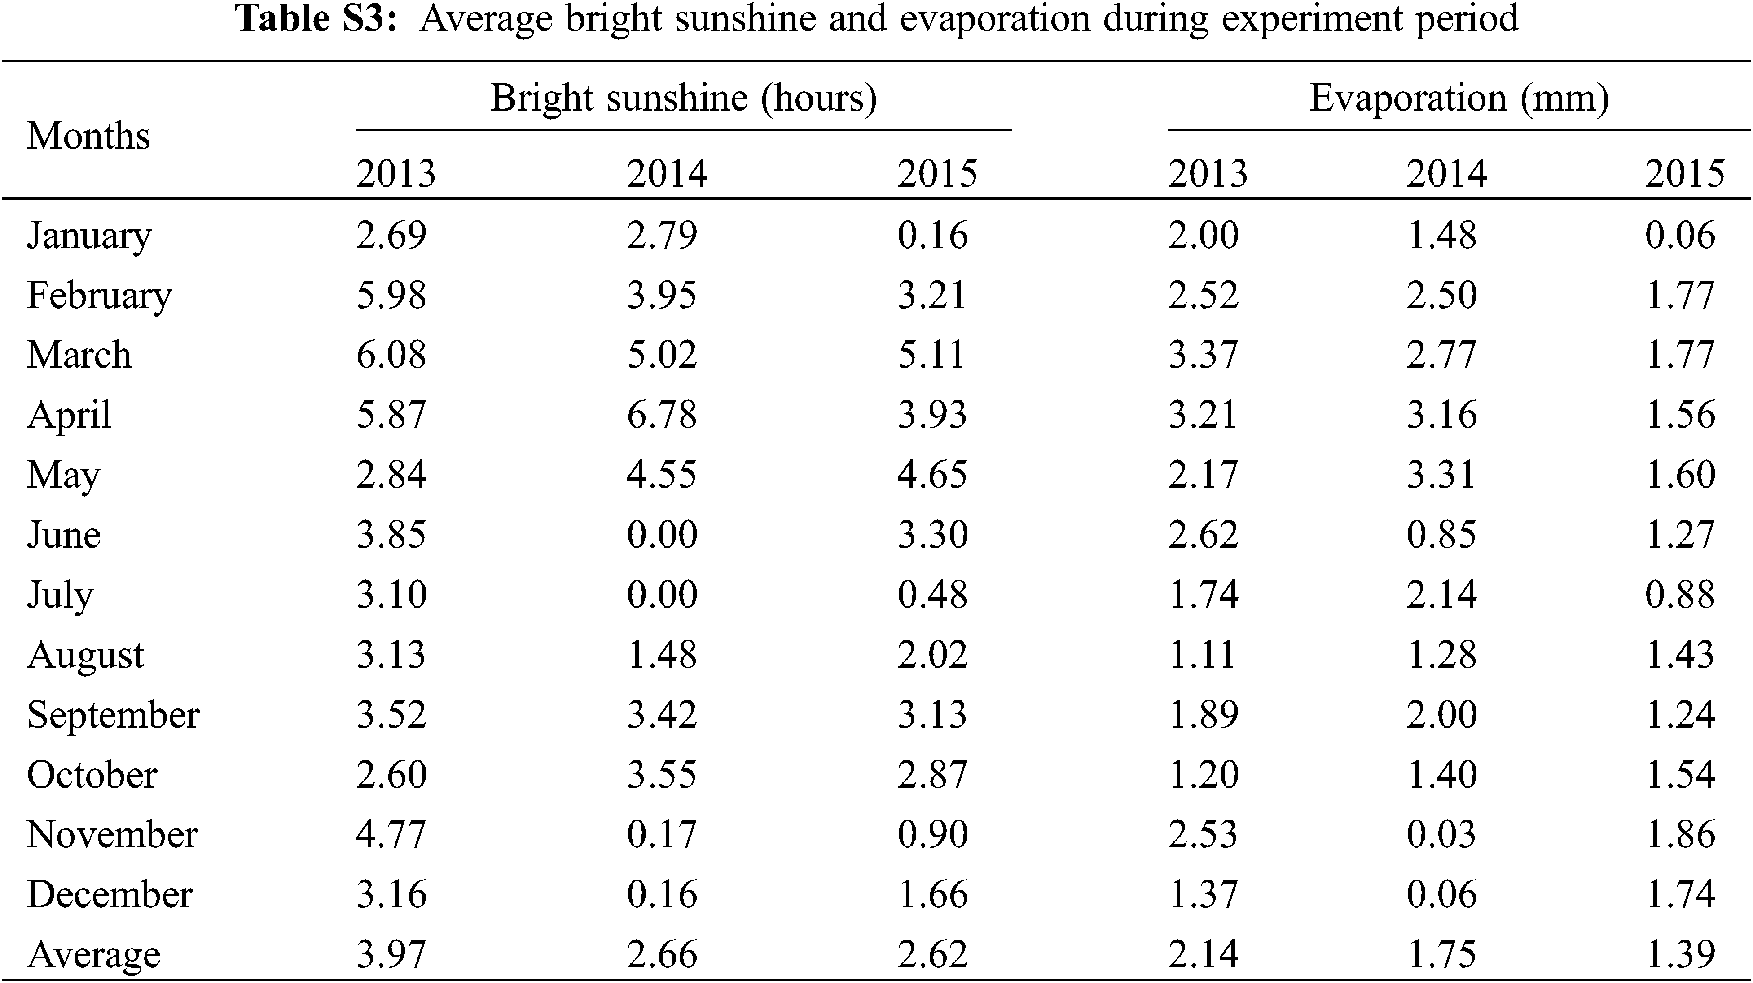
The field experiment was carried out at the research field of Bangladesh Sugar crop Research Institute (BSRI), Ishwardi, Pabna, Bangladesh. The station is situated between 24°06′56.6″N latitude and 89°05′17.0″E longitude, and situated about 15.5 m a.s.l.. The temperature was moderately high from April to September and moderately low with scant rainfall from October to March. The mean temperature ranges from 13.02 to 27.20°C (Tab. S1). The rainfall was heavy from April to September, and moderately low from October to March (Tab. S2). The total rainfall occurred within eight months with mean monthly values in the range of 1.13–12.93 mm. The average sunshine hour at the experimental site varied from 0.16 to 5.11 h (Tab. S3). The site of the experiment belongs to the Sara soil series under the High Ganges River Flood Plain Tract belonging to Agro-Ecological Zone 11 (AEZ 11). The size of the unit plots were 8 m × 6 m. The polybag seedlings were planting maintaining a row spacing of 1 m, and a plant to plant distance of 0.45 m of sugarcane. The soil of the experimental site was calcareous alluvial soil with low organic carbon (0.72%). The soil type of the site was silty loam. The experimental field was a medium high land soil with well internal drainage conditions.
The sugarcane variety ‘Isd 39’ is largely cultivated by farmers of Bangladesh and responds very well to organic sources of nutrients. This variety was selected in addition to the recently released high sugar concentration. As a high tillering variety, it is tolerant to water logging, flood and drought situations and is the most ideal for sugar production and Jaggery (goor) making.
2.3 Treatments and Experimental Design
The experiment comprising of the combinations with seven treatments was used in this study. The field experiment was laid out in Randomized Complete Block Design (RCBD) with three replications (Tab. 1).

The experimental plot was set as per treatments and design. The settlings of the polybag were planted following a spaced transplanting (STP) method. The raised polybag seedlings were transplanted in trenches at 45 cm distance. The rates of chemical fertilizers for the different treatments were calculated based on the recommended fertilizer doses (RFD) for high yield goals (HYG) and an integrated plant nutrition system (IPNS). It was based on the composition of each organic waste material and its major nutrient concentrations. Chemical fertilizers were used at the rates of 165 kg N, 55 kg P, 120 kg K, 30 kg S, 10 kg Mg, 2.5 kg Zn and 4 kg B ha−1 in the form of urea, TSP, MoP, gypsum, magnesium sulfate, zinc sulfate and borax, respectively, as the recommended doses for sugarcane. Poultry litter (PL), Cow dung (CD), press mud (PM), mustard oil cake (MOC) and green manure (Dhaincha) were applied as per treatments. All the sources of organics and a full dose of P, S, Mg, Zn and B fertilizers were applied in trenches and mixed with soil prior to transplanting of the seedlings. The basal dose of N fertilizer (1/3rd) was applied as side-dressing at 30 days after transplanting (DAT). The remaining amounts of N and K fertilizers were applied as top dressing in two equal splits at 120 and 180 DAT. In the case of green manuring treatments, dhaincha seeds were sown in between two rows of sugarcane at a rate of 25 kg ha−1 in April.
After 45 days, dhaincha was cut into small pieces and mixed into the soil. Irrigation was applied in trenches just after transplanting of the seedlings in the plots under STP method to ensure quick and maximum establishment. Supplementary irrigation was also applied after 15, 60, 90 and 120 DAT, when the moisture reached to 60% depletion of the field capacity. The soil in trenches was loosened twice at 30 and 60 days after transplanting to prevent the seedlings from suffering from soil compaction. All the plots were kept weed-free up to 140 DAT, as the period is considered to be the critical period for crop-weed competition at any sugarcane field. The cultural, mechanical and chemical control measures were done for insect pests and disease management as and when required. Earthing-up was done three times on 120, 150 and 180 DAT. This operation converted the ridges into furrows and the furrows into ridges. Tying was done at two times, first in July and then in September to keep the clump straight, protecting the cane stalks from lodging against the possibility of strong wind. The dried leaves were removed from the plants, and the green leaves on plants were tied together by taking all the canes in one bundle. Cross tying was done by binding two clumps of adjacent rows together. The crop was harvested manually at its physiological maturity stage.
The number of tiller populations was estimated at 120, 150, 180 and 210 DAT by counting the total number of shoots from each plot expressed as thousand per hectare.
2.5.1.2 The Number of Millable Canes
The number of millable sugarcane stalks was recorded at the time of harvest. Well matured canes fit for milling were counted from net plot area, and expressed as thousands per hectare.
Twenty randomly selected sugarcane stalks from each plot were tagged. Shoot length between the soil surface and growing point of the shoot was measured at the harvesting time, and the values were expressed as meters (m).
Cane stalk height was measured from 20 randomly selected cane stalks of each plot at the harvesting time. Stalks were cut at the ground level and the top was removed at the sixth leaf joint from the spindle leaf to measure the actual height, and the values were expressed as meters (m).
Cane stalk diameter was determined at the time of harvesting from the same 20 randomly selected cane stalks of each plot. The mean value of top, middle and bottom diameters was considered as the actual diameter of the cane stalk, and the value was expressed as millimeter (mm).
2.5.1.6 Number of Internodes per Stalk
Total number of internodes of a stalk was determined by counting from the 20 randomly selected stalks and thereafter, their average was taken.
The weight of a single millable sugarcane stalk was calculated by the ratio of cane yield to the number of millable sugarcanes per unit area.
The yield of sugarcane stalks was determined and recorded at harvesting time from the whole area of each plot. The weight of clean cane stalks was taken for yield data. The yield data of sugarcane stalk was expressed in ton per hectare (t ha−1).
2.5.2 Physiological Observations
2.5.2.1 Dry Matter Production (DM)
Dry matter production was estimated from a sample of five canes selected at random from the net plot area at 240 DAT following a destructive harvesting. The collected samples (including the leaf, sheath and stalk) were cut into small pieces and oven-dried at 80°C for 7 days up to constant weight. Total dry weights of leaf, sheath and stem were computed to a hectare basis based on the total plant population per hectare at the time of the respective growth stages to obtain the production of dry matter (kg ha−1).
Leaf area was measured by the leaf product method i.e., maximum length × maximum width × K where K is equal to 0.75. Leaf area of five cane samples was selected from the net plot area at 240 DAT computed on a hectare basis on the plant population at the respective growth stages. The values of leaf area index were calculated by the ratio of leaf area to land area.
2.5.2.3 SPAD Chlorophyll Reading
A SPAD chlorophyll meter was utilized for taking chlorophyll readings at various stages of crop growth, which were directly correlated to the overall crop condition. The 2nd, 3rd and 4th leaves were selected randomly in the net plot for this purpose. The lower, middle and upper leaf surface within the leaf were selected for recording the chlorophyll readings.
2.5.2.4 Nutrient Concentrations of Sugarcane Leaves
Total-N concentration of the plant samples was determined by the semi-micro Kjeldahl method [13]. The concentration of P in the plant extract was determined colorimetrically by developing blue color with the stannous chloride (SnCl2 · 2H2O) reduction of phosphomolybdate blue color complex. It was measured using a UV-VIS spectrophotometer (Model: Jasco V-630, Germany) at 660 nm wavelength [14]. The potassium concentration of the plant extracts was determined with the help of a flame photometer (Model: Jenway PFP7, UK) using 768 nm wavelength [15]. The sulphur concentration was determined turbidimetrically from the plant extracts with the help of a UV-VIS spectrophotometer (Model: Jasco V-630, Germany) using barium chloride (BaCl2 · 2H2O) as a turbidimetric agent [13].
2.5.3 Nutrient Concentrations of Soil and the Organic Source
The soil water suspension, maintained at a 1:2.5 ratio, was prepared for determination of soil pH using pH meter [16]. Soil organic carbon concentration was determined by the wet oxidation method. The organic matter concentration was calculated by multiplying organic carbon (%) with the van Bemmelen factor 1.724 [15]. The total N concentration of the soil was determined by the micro-Kjeldhal method [17]. The soil sample was extracted with 0.05 M NaHCO3 at pH = 8.5, and available P concentration in the soil extract was determined by the spectrophotometric method [18]. The soil sample was extracted with 1 N NH4OAc at pH = 7.0, and exchangeable K concentration in the soil extracts was analysed by the flame photometric method [15]. The soil sample was also extracted with 0.15% CaCl2, and the available S concentration in the soil extracts was determined by the turbidimetric method [13].
Total production cost was calculated as the sum of all variable costs. The variable costs were used in the analysis including the costs of land preparation, prices of all variable inputs including seed cane, fertilizers, pesticides, irrigation, etc. and labor costs at the current rates. These costs were considered based on the information provided by local farmers and local market prices of Ishwardi, Pabna. Gross return, gross margin and benefit-cost ratio (BCR) were calculated to determine the economic suitability of the experimental treatments. For calculating gross return, gross margin and BCR, the market price of cane at the time of harvesting was considered. Prices of inputs and outputs were determined in Bangladeshi Taka (BDT) based on prices in the local (Ishwardi, Pabna) market in 2019. For better comparisons, all the economics data (cost of production, gross return and net returns) were converted from BDT to US$ using an exchange rate (BDT/US$) of 1US$ = 84.8 BDT (according to the currency conversion rate on 12 December 2019). Gross margin was calculated as the difference between gross return and total variable cost for each treatment. Net return was calculated as the difference between the gross return and the total cost for each treatment. The BCR for each treatment was calculated from the gross return divided by the total cost.
The experimental data were statistically analyzed by ANOVA using “Statistix 10” computer-based software to assess the differences between treatments. The means were separated using the least significant difference (LSD) at the 5% level of significance (p ≤ 0.05) [19].
3.1 Effects of INM on Physiological Characteristics of Sugarcane
The treatment T3 produced significantly the highest amount of chlorophyll (40.46 SPAD unit) in 2013–14, while the corresponding highest value of 41.12 SPAD unit was recorded in treatment T3 in the 2014–15 cropping season (Tab. 2). The lowest values of chlorophyll (33.46 and 37.52 SPAD units) were recorded in the control treatment (T1) in the 2013–14 and 2014–15 cropping seasons.

In both seasons, the leaf area index of sugarcane at 240 DAT varied significantly due to different integrated fertilizer management treatments in both years. It ranged from 4.28 to 7.57 in 2013–14 and 4.46 to 7.40 in 2014–15 (Tab. 2). The highest leaf area index (7.57 and 7.40) of sugarcane was obtained on treatment T4 while treatment T1 showed the lowest leaf area index value (4.28 and 4.46) in both years. Treatment T4 gave the highest leaf area index (7.57) followed by the T3 treatment (6.98) in 2013–14, and 7.40 in the 2014–15 cropping season.
The maximum dry matter yield was recorded in T3 with 3.81 kg m−2 in 2013–14, and 3.49 kg m−2 in 2014–15 (Tab. 2). The lowest dry matter yields (2.59 and 2.54 kg m−2) were obtained in treatment T1 in 2013–14 and 2014–15, respectively.
3.2 Effects of INM on Growth Rate of Sugarcane
3.2.1 Growth Rate at 30 Days after Stem Formation
Growth rate varied from 1.48 to 1.66 cm d−1 in 2013–14, and 1.77 to 2.08 cm d−1 in the 2014–15 cropping season (Tab. 3). In both years, the maximum growth rates, 1.66 cm d−1 and 1.72 cm d−1, respectively, were found in treatment T6. The lowest growth rates were recorded on T1 in those days after stem formation in both seasons.

3.2.2 Growth Rate at 60 Days after Stem Formation
In the 2013–14 cropping year, the highest growth rate (2.08 cm d−1) was noticed in the T3 treatment (Tab. 3). At the same time, treatment T1 showed the lowest growth rate (1.48 cm d−1). The maximum growth rate (1.84 cm d−1) was recorded in treatment T3 over the rest of the treatments in the 2014–15 cropping season, and the T1 treatment noticed the lowest growth rate (1.61 cm d−1) of sugarcane.
3.2.3 Growth Rate at 90 Days after Stem Formation
In the cropping year 2013–14, it was found that the treatment T7 recorded the highest growth rate (1.75 cm d−1); the lowest growth rates (1.56 cm d−1) were observed on treatment T1 (Tab. 3). During the 2014–15 cropping season, the highest significant growth rate (1.61 cm d−1) was found in T7 among all the treatments. At the same time, treatment T1 produced the lowest growth rate (1.42 cm d−1).
3.3 Effects of INM on Tiller Populations of Sugarcane
3.3.1 Tiller Population at 120 Days after Transplanting
In the 2013–14 cropping year, the number of sugarcane tillers at 120 days after transplanting (DAT) varied from 102.4 × 10³ to 167.6 × 10³ per hectare (Tab. 4). Treatment T6 produced the highest number of tillers (167.6 × 10³ ha−1), and the lowest value of tillers (102.4 × 10³ ha−1) was recorded in the control treatment T1. Similarly, the tiller number ranged from 132.6 × 10³ to 219.2 × 10³ per hectare in the 2014–15 cropping season. The highest value of tiller number (219.2 × 10³ ha−1) was recorded in treatments T6 followed by treatments T3 and T4, and the lowest number of tillers was noted in T1 (control) treatment.

3.3.2 Tiller Population at 150 Days after Transplanting
The sugarcane tiller numbers varied from 151.4 × 10³ to 211.8 × 10³ per hectare in the 2013–14 cropping season, and 156.1 × 10³ to 225.40 × 10³ per hectare in the 2014–15 cropping season (Tab. 4). In the 2013–14 cropping season, the highest number of tillers (211.8 × 10³ ha−1) was obtained in the T6 treatment which was statistically non-significant to the T3 and T4 treatments with values of 197.2 × 10³ and 190.3 × 10³ ha−1, respectively. The lowest number of tillers (151.4 × 10³ ha−1) were produced by the T1 (control) treatment which was statistically similar to the T2 treatment. The treatment T6 noted the highest number of tillers with a value of 225.4 × 10³ ha−1 which was statistically similar to the T3, T4 and T7 treatments. The lowest number of tillers was recorded in the control treatment T1.
3.3.3 Tiller Population at 180 Days after Transplanting
The highest number of the tiller population (192.9 × 10³ ha−1) was significantly obtained in treatment T3 at 180 DAT in the 2013–14 cropping season (Tab. 4). Treatment T1 (control) was significantly produced the lowest number of the tiller population (136.3 × 10³) per hectare. In the 2014–15 cropping year, the number of the tiller population varied from 124.8 × 10³ to 192.0 × 10³ per hectare at 180 DAT. The treatments T3, T4, T6 and T7 with values of 192.0 × 10³, 177.6 × 10³, 168.1 × 10³ and 164.8 × 10³ ha−1, respectively, exerted statistically a similar effect on the number of tillers. The treatment T1 (control) gave the lowest number of the tiller population (124.8 × 10³ ha−1) which was statistically similar to the T2 treatment.
3.3.4 Tiller Population at 210 Days after Transplanting
In the 2013–14 cropping season, a variation of sugarcane tillers from 96.4 × 10³ to 145.1 × 10³ was found at 210 DAT due to different treatments (Tab. 4). Treatment T3 produced the highest number of tillers (145.1 × 10³) which was statistically similar to that of T4 (138.5 × 10³) and T6 (128.5 × 10³) but superior to all other treatments. The control treatment T1 recorded the lowest value of the sugarcane tiller population (96.4 × 10³ ha−1). At 210 DAT, the highest number of tillers (157.4 × 10³ ha−1) was noted in treatment T3, and it was statistically similar to all other treatments except T1 and T2 in the 2014–15 cropping year. The lower number of tillers (119.5 × 10³ ha−1), produced by the treatment T2, compared to all other treatments The lowest value (119.5 × 10³ ha−1) was recorded in treatment T1 (control).
The internode length of sugarcane was significantly influenced by the different treatments at the harvesting stage, and ranged from 14.3 to 17.2 cm in the 2013–14 cropping season (Tab. 5). The treatment T7 produced the highest internode length (17.2 cm), and the lowest internode length (14.3 cm) of sugarcane was obtained on treatment T1 (control), which was statistically similar to the T2 treatment in the 2013–14 cropping season. Treatment T3 showed the second-highest internode length (16.2 cm). In the 2014–15 cropping season, the treatment T7 noticed the highest internode length (17.0 cm), and the second-highest internode length (17.0 cm) was produced on treatment T3, which was statistically similar to the T7 and T4 treatments. The lowest value of internode length (14.5 cm) was observed in treatment T1 (control).

The highest number of internodes (22.7) was obtained on treatment T3 in the 2013–14 cropping season. On the contrary, the lowest number of internodes (19.3) was obtained on the T1 (control) treatment (Tab. 5). Similarly, treatment T4 produced the second-highest internode number, which was statistically identical to the T6 and T7 treatments. In the 2014–15 cropping season, the highest internode numbers (23.3) was noted on both T3 and T7 treatments. Treatment T1 (control) produced the lowest internode number (20.0). Furthermore, the second highest internode number (23.0) was found on treatment T4, which was statistically similar to T6 treatment.
Plant height due to different treatments ranged from 3.9 to 4.4 m in the 2013–14 cropping year (Tab. 6). Treatment T4 produced the tallest plant height (4.38 m) followed by treatments T3 (4.2 m) and T6 (4.1 m), respectively. Treatment T1 gave the smallest plant height (3.9 m). In the 2014–15 cropping season, the highest significant plant height (4.6 m) was showed on treatment T4 over the T1 and T2 treatments, which were similar to the rest of the combinations. All treatments but T4 showed a similar plant height.

In the 2013–14 cropping year, treatment T3 noticed the highest stalk height (2.9 m). The lowest value of stalk height (2.4 m) was observed in treatment T1 (Tab. 6). The values of 2.6, 2.7, 2.9, 2.9, 2.6, 2.8 and 2.78 m, respectively, were obtained from treatments T1, T2, T3, T4, T5, T6 and T7. In the 2014–15 cropping year, the highest stalk height sugarcane (2.9 m) was observed in treatments T3 and T4. The lowest stalk height of 2.6 m was recorded in T1 treatment (control).
Data of stalk diameter varied from 20.1 to 23.6 mm in the 2013–14, and 18.3 to 21.0 mm in the 2014–15 cropping seasons (Tab. 6). The control treatment (T1) recorded the lowest stalk diameter of sugarcane in both seasons. The maximum stalk girth (23.6 mm) was found in treatment T5 Treatment T1 gave the minimum stalk girth (20.14 mm) in the 2013–14 cropping year. In the 2014–15 cropping year, the maximum stalk diameter (21.0 mm) was found on treatment T5. Treatment T1 having neither manures nor fertilizers produced significantly the lowest stalk girth (18.3 mm).
The number of millable canes ranged from 72.3 × 10³ ha−1 to 126.2 × 10³ ha−1 in the 2013–14, and 71.3 × 10³ to 127.5 × 10³ ha−1 in the 2014–15 cropping years (Figs. 1a and 1b). Treatment T3 produced the maximum number of millable canes (126.2 × 10³ ha−1), and it was statistically similar to those stated on treatments T4, T6 and T7, having the values of 119.0 × 10³, 112.1 × 10³ and 105.3 × 10³ ha−1, respectively. The minimum number of millable canes (72.3 × 10³ ha−1) was produced on the T1 treatment, but it was similar to that on the T2 treatment. In 2014–15 cropping season, the highest number of millable canes (127.5 × 10³ ha−1) was obtained on treatment T3 The T1 treatment produced the minimum number of millable canes (71.3 × 10³ ha−1).

Figure 1: Effects of integrated nutrient management on millable cane of sugarcane in 2013–14 (a) and 2014–15 (b). Treatment abbreviations are as in Tab. 2. Bar are mean ± SE of three replications. Different letters on bars are significantly different at p ≤ 0.05
Treatment T3 achieved the maximum unit cane weight (1.1 kg) but it was comparable to T4 (Figs. 2a and 2b). The minimum value of unit cane weight (0.8 kg) was found in treatment T1 in the 2013–14 cropping year. During 2014–15 cropping season, treatment T3 produced the highest unit cane weight (1.0 kg), and it was statistically similar to treatments T4, T5, T6 and T7 with values of 1.0, 0.9, 0.9 and 1.0 kg, respectively. Treatment T1 produced the lowest cane weight (0. 8 kg).

Figure 2: Effects of integrated nutrient management on unit cane weight in 2013–14 (a) and 2014–15 (b) of sugarcane. Treatment abbreviations are as in Tab. 2. Values on bars are means ± SE of three replications. Different letters on bars are significantly different at p ≤ 0.05
The application of fertilizers caused significant influences on cane yield in both seasons and it ranged from 54.88 to 144.0 t ha−1 in 2013–14, and 54.7 to 129.4 t ha−1 in 2014–15 (Figs. 3a and 3b). Organic fertilizers treated plots, recorded higher cane yields over the control plot. The T1 treatment produced the lowest values in both seasons. Treatment T3 produced the highest cane yield (144.0 t ha−1) in the 2013–14 cropping year. In the 2014–15 cropping year, the highest cane yield (129.4 t ha−1) was noticed on treatment T3, and it was similar to treatment T4 (115.9 t ha−1).

Figure 3: Effects of integrated nutrient management on sugarcane cane yield in 2013–14 (a) and 2014–15 (b). Treatment abbreviations are as in Tab. 2. Values on bars are means ± SE of three replications. Different letters on bars are significantly different at p ≤ 0.05
3.12 Effects of INM on Juice Quality of Sugarcane
3.12.1 Total Soluble Solids (TSS) or Brix (%)
The total soluble solids or brix (%) were not significantly different due to the different nutrient managements in both 2013–14 and 2014–15 (Figs. 4a and 4b).

Figure 4: Effects of integrated nutrient management on brix (%) in 2013–14 (a) and 2014–15 (b). Treatment abbreviations are as in Tab. 2. Values on bars are means ± SE of three replications. Different letters on bars are significantly different at p ≤ 0.05
The pol in juice (%) was not significantly different due to the different nutrient managements in both 2013–14 and 2014–15 (Figs. 5a and 5b).

Figure 5: Effects of integrated nutrient management on pol in juice in 2013–14 (a) and 2014–15 (b). Treatment details are available in Tab. 1. Bars indicate means ± SE (n = 3)
Purity (%) was not significantly different due to the different nutrient managements in both 2013–14 and 2014–15 (Figs. 6a and 6b).

Figure 6: Effects of INM on purity (%) in 2013–14 (a) and 2014–15 (b). Treatment abbreviations are as in Tab. 2. Values on bars are means ± SE of three replications. Different letters on bars are significantly different at p ≤ 0.05
Pol in cane of sugarcane ranged from 14.6% to 15.3% in the 2013–14 and 14.5 to 14. 9% in the 2014–15 cropping seasons (Tab. 7). An increasing trend of pol in cane of 15.3% was noticed in treatment T3 as compared to the other treatments during the 2013–14 cropping season. Treatment T3 contained the highest pol in cane (15.3%), and it was statistically similar to all other treatments. However, the lowest pol in cane (14.6%) was found in treatment T1. In the 2014–15 cropping year, the significantly highest pol in cane (14.9%) was recorded on treatment T3. The T1 treatment produced the lowest pol in cane (14.5%).

The T4 treatment gave the maximum phosphate concentration (334.3 mg L−1) followed by T3 (331.7 mg L−1) and T6 (329.7 mg L−1) (Tab. 7). Treatments T3, T6 and T7 showed values of 331.7, 329.7 and 327.3 mg L−1, respectively; these treatments had a similar effect on the phosphate concentration of sugarcane juice. Treatment T1 (control) produced the lowest phosphate concentration (319.3 mg L−1) in sugarcane juice. In the cropping year 2014–15, the highest phosphate concentration (327.0 mg L−1) was observed in treatment T4, which was statistically similar to treatment T3. Treatment T1 (control) produced the lowest phosphate concentration (319.7 mg L−1).
Reducing sugars in sugarcane juice ranged from 0.20% to 0.30% in 2013–14% and 0.19% to 0.26% in 2014–15 (Tab. 7). In the 2013–14 cropping year, treatment T3 produced the lowest reducing sugars concentration (0.20%) and it was statistically similar to treatment T4. The highest significant reducing sugars concentration (0.30%) was recorded in T1 treatment. The highest reducing sugars concentration (0.26%) was observed on the T1 treatment, which was statistically similar to the T2, T5 and T7 treatments in 2014–15. Treatment T3 gave the lowest reducing sugars concentration (0.19%), and it was statistically similar to treatments T4 and T6.
Among the fertilizer management treatments, T1 (control) gave the highest concentration of fibre (16.6%), which was statistically similar toT2 and T5 in the 2013–14 cropping year (Tab. 8). Furthermore, the lowest fibre concentration (16.1%) was recorded on the T7 treatment followed by the T3 treatment (16.1%). In the cropping year 2014–15, treatment T7 produced the lowest significant fibre concentration of sugarcane (15.5%) among all treatments, although it was statistically similar to treatments T3 and T4. Treatment T1 produced the highest concentration of fibre (16.8%).
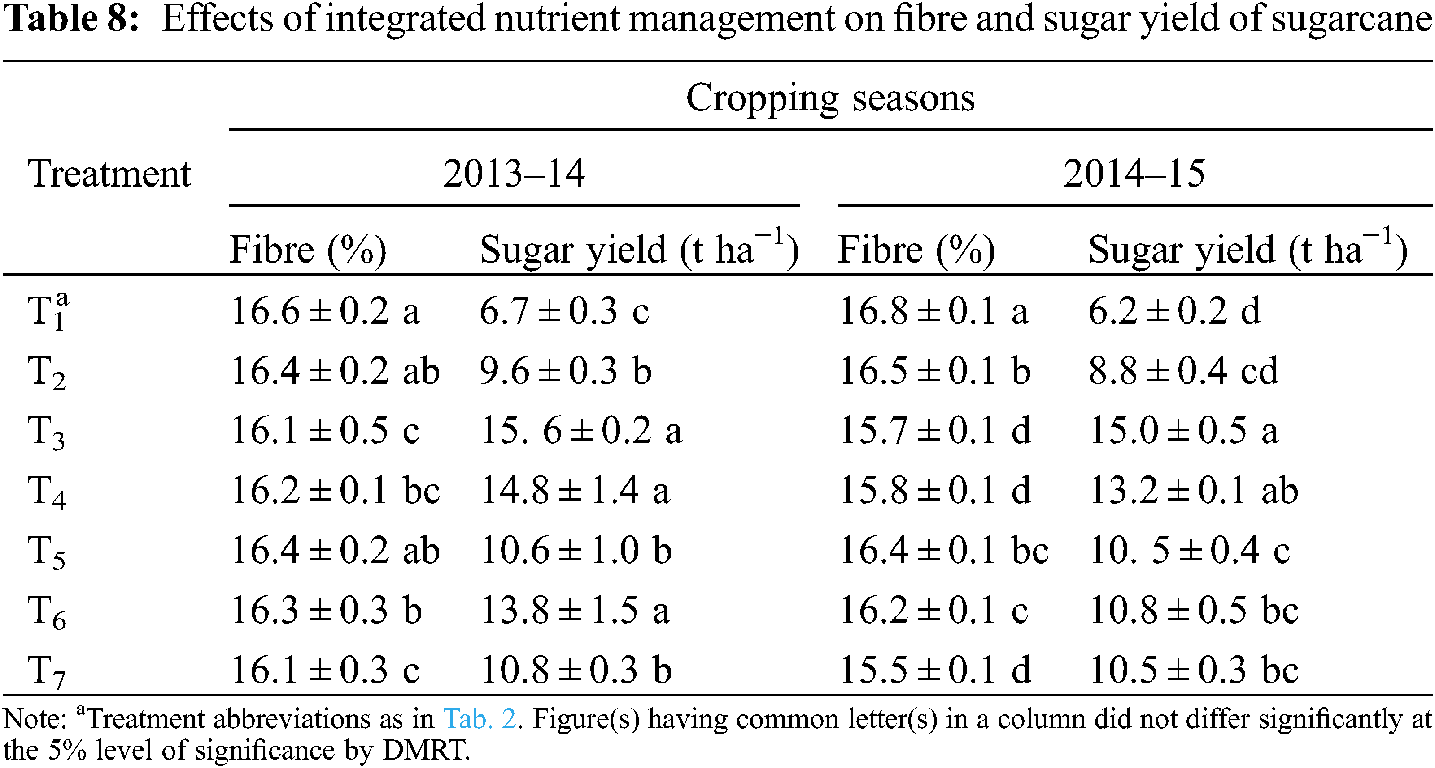
Sugar yield was significantly influenced by the application of the different fertilizers treatments in both seasons, and ranged from 6.7 to 15. 6 t ha−1 in 2013–14 and 6.2 to 15.0 t ha−1 in 2014–15 (Tab. 8). Higher sugar yield was produced by fertilizer-treated plots than the control plot (T1) in both seasons. In the 2013–14 cropping year, the highest sugar yield (15. 6 t ha−1) was recorded in treatment T3. The sugar yield in T3, T4 and T6, with values of 15. 6, 14.8 and 13.8 t ha−1, respectively, were statistically similar. Sugar yield (6.7 t ha−1) on treatment T1 was significantly lower than that on the other fertilizer treatments. Treatment T3 produced the maximum sugar yield of sugarcane (15.0 t ha−1), and it was statistically similar to treatment T4 (13.22 t ha−1) in the 2014–15 cropping year. The sugar yield recorded in treatment T1 (6.2 t ha−1) was lower compared to all other treatments, and it was similar to the T2 treatment.
3.14 Effects of Integrated Nutrient Management on Quality Parameters of Jaggery (Goor)
3.14.1 Physical Properties of Jaggery (Goor)
The physical properties of Jaggery (goor) presented in Tab. 9 were significantly influenced by the application of different fertilizers treatments in both seasons. In the case of texture of Jaggery (goor), the treatments T2, T3, T4, T5, T6 and T7 were hard, and T1 showed the moderately soft texture of Jaggery (goor) in the 2013–14 and 2014–15 cropping years. The treatments T2, T3, T4, T5 and T6 produced good crystalline nature of Jaggery (goor) in both cropping seasons. Treatments T1 and T7 recorded non-crystal and moderately crystal in nature, respectively, in both seasons. The color of Jaggery (goor) was golden in T2, T3, T4, T5, T6 and T7 treatments. T1 showed a brown color of Jaggery (goor) in solid-state. On the contrary, a sweet taste of Jaggery (goor) was obtained on treatments T2, T3, T4, T5, T6 and T7. The T1 treatment showed a slightly salty taste of Jaggery (goor) in the 2013–14 and 2014–15 cropping seasons.

3.14.2 Chemical Properties of Jaggery (Goor)
Sucrose concentration of Jaggery (goor) was significantly influenced by the different integrated nutrient management practices in the 2013–14 and 2014–15 cropping years (Tab. 10). The highest sucrose concentration of Jaggery (goor) (76.3%) was noticed in treatment T3, and it was statistically similar to treatment T4 (75.6%) in the 2013–14 cropping year. Treatment T1 (control) showed the lowest sucrose concentration of Jaggery (goor) (68.0%). In the 2014–15 cropping year, treatment T3 produced the highest significant sucrose concentration (80.1%) of Jaggery (goor), and it was statistically similar to treatment T4 (79. 7%). Treatment T1 (control) gave the lowest sucrose concentration (75.8%) of Jaggery (goor).

Tab. 10 showed that the reducing sugars of the Jaggery (goor) were significantly influenced by the application of different fertilizers in the 2013–14 and 2014–15 cropping years. The T3 treatment gave the minimum reducing sugars (5.4%) in Jaggery (goor), and it was statistically similar to treatments T4, T6 and T7. On the other hand, treatment T1 produced the maximum reducing sugars (5.9%) in Jaggery (goor), which was similar to the treatments T2, T4, T6 and T7. During 2014–15, the highest reducing sugars concentration (6.8%) of Jaggery (goor) was obtained in the T2 treatment, and it was statistically similar to all treatments except T3 and T4. The treatment T3 gave the minimum reducing sugars concentration (6.6%) of Jaggery (goor), and it was statistically similar to theT4 treatment.
The color transmittance of Jaggery (goor) significantly differed by the application of different fertilizers treatments in both seasons, and ranged from 46.1% to 54.8% in 2013–14% and 45.8% to 57.8% in 2014–15 (Tab. 10). In the 2013–14 cropping year, color transmittance of Jaggery (goor) was highest in treatment T3 (54.8%), and it was statistically similar to treatment T4. The lowest color transmittance of Jaggery (goor) (46.1%) was found in treatment T1 (control). During the 2014–15 cropping year, the highest color transmittance of Jaggery (goor) (57.8%) was noticed in treatment T3, which was similar to all other treatments except T1. Treatment T1 (control) produced the lowest color transmittance of Jaggery (goor) (45.8%), but it was statistically similar to treatments T2 and T5.
The pH of Jaggery (goor) was significantly influenced by the different integrated nutrient management treatments in the 2013–14 and 2014–15 cropping seasons (Tab. 11). In the cropping year of 2013–14, the maximum pH value (5.6) of Jaggery (goor) was observed on treatments T4 and T6, which was statistically similar to all the other treatments except T1. The minimum pH value (5.4) of Jaggery (goor) was obtained on treatment T1. In 2014–15, treatment T6 gave the highest pH of Jaggery (goor) (5.8) and it was statistically similar to all the other treatments except T1. The treatment T1 gave the lowest pH of Jaggery (goor) (5.6).

The ash concentration ranged from 2.85% to 3.75% in the 2013–14 cropping year (Tab. 11). Treatment T1 recorded significantly the highest ash concentration (3.8%), and it was statistically similar to the T2, T5 and T7 treatments. The lowest ash concentration (2.9%) was observed in the T3 treatment. In the cropping year of 2014–15, treatment T1 produced significantly the highest ash concentration (3.8%), but it was statistically similar to all treatments except T3. On the other hand, treatment T3 produced significantly the lowest ash concentration (3.0%).
The results were significantly influenced by the practice of integrated nutrient management treatments in the 2013–14 and 2014–15 cropping seasons (Tab. 11). Treatment T3 produced significantly the highest Jaggery (goor) recovery (11.2%) which was statistically similar to treatment T4 (10.7%) in the 2013–14 cropping year. Treatment T1 gave significantly the lowest Jaggery (goor) recovery (10.0%). In the cropping year 2014–15, treatment T3 showed significantly the highest Jaggery (goor) recovery (11.2%), which was statistically similar to that on treatments T4, T6 and T7. The lowest significant Jaggery (goor) recovery (10.1%) was obtained on theT1 treatment.
3.14.3 Effects of INM on Jaggery (Goor) Grading
In the cropping years 2013–2014 and 2014–15, the NR values differ statistically among treatments. Based on the NRV, Jaggery (goor) was classified into different classes such as A1 to A5 (Tab. 12). Treatment T3 produced significantly the highest net rendament (NR) value of Jaggery (goor) (57.8) in the 2013–14 cropping season. The second and third highest NR values were observed on treatments T4 (57.1) and T6 (56.9). Treatment T1 gave the lowest value (52.2) of NR. In the cropping season of 2014–15, the first, second and third highest NR (61.1, 61.0 and 60.9) values of Jaggery (goor) were obtained in the treatments T3, T4 and T6. Furthermore, treatment T1 gave the lowest value of NR (58. 7) of Jaggery (goor) (Tab. 12).
3.14.4 Effects of INM on Leaf Nutrient Concentrations
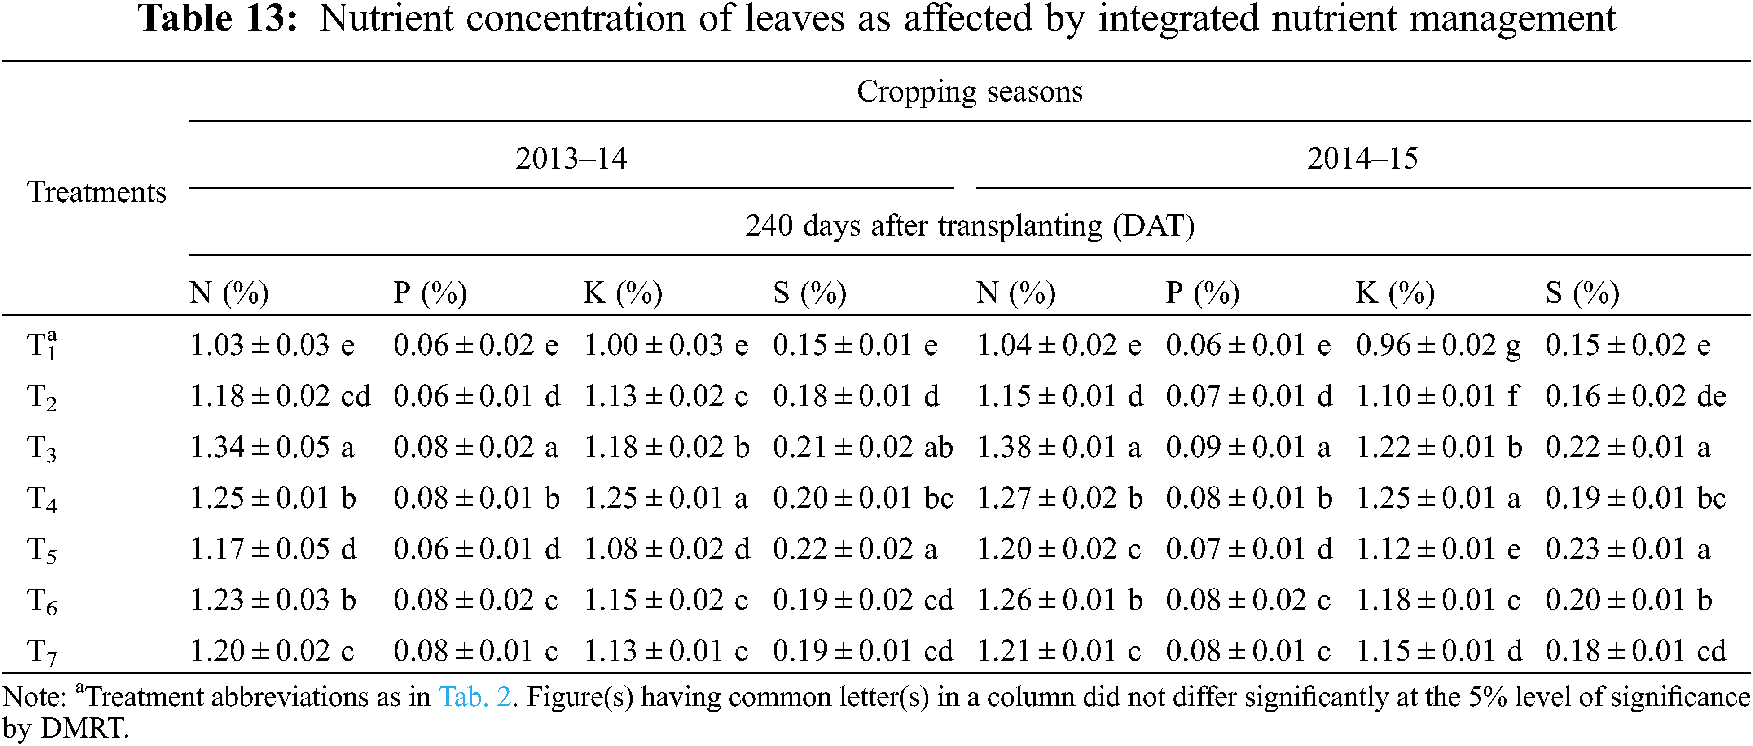
In the 2013–14 cropping season, treatment T3 showed the highest N concentration (1.34%). The second highest N concentration (1.25%) was found on T4 followed by the T6 treatment (1.23%) (Tab. 13). The T3 treatment showed the highest P concentration (0.08%). The treatment T1 gave the lowest value of P (0.06%). The T4 treatment recorded the highest K concentration (1.25%), and the lowest K concentration (1.00%) was found on the T1 treatment. Treatment T5 showed the highest S concentration (0.22%) followed by T3 (0.21%). During the 2014–15 cropping year, the highest value of N concentration (1.38%) was obtained on treatment T3, and the lowest N concentration was observed on treatment T1 (1.04%). The treatment T3 recorded the highest P concentration (0.09%), and treatment T1 showed the lowest P value (0.06%). The T4 treatment recorded the highest K concentration (1.25%), and the T1 treatment recorded the lowest one (0.96%). Treatment T5 recorded the highest S concentration (0.23%) followed by the T3 (0.22%) treatment. T1 showed the lowest S concentration (0.15%) (Tab. 13).
3.15 Relationships Between Leaf Nutrient Concentrations
N and P concentrations in sugarcane leaves showed a significant positive correlation with each other at the 5% level of probability in both the 2013–14 and 2014–15 cropping seasons (Figs. 7a and 7b). The values of the coefficients of determination (r2) were 0.610** in the 2013–14 and 0.769** in the 2014–15 cropping seasons, with the regression lines y = 0.059 × in 2013–14, and y = 0.074 × in 2014–15.

Figure 7: Relationship between N and P concentrations: 2013–14 (a) and 2014–15 (b), N and K concentrations in 2013–14 (c) and 2014–15 (d), N and S concentrations in 2013–14 (e) and 2014–15 (f)
In both the 2013–14 and 2014–15 cropping seasons, there was a direct significant and positive relationship between N and K concentrations in sugarcane leaves having the determination coefficients of r2 = 0.454** in 2013–14 and r2 = 0.832** in 2014–15 (Figs. 7c and 7d). The relationships were evident by the equations y = 0.941 x in 2013–14, and y = 0.827 x in 2014–15.
The concentrations of N and S in sugarcane leaves indicated a significant positive correlation with each other at the 5% level of probability (Figs. 7e and 7f). The values of the determination coefficients (r) were r2 = 0.238** and r2 = 0.419** in both the 2013–14 and 2014–15 cropping seasons, respectively, with the regression lines y = 0.161 x and y = 0.254x.
P and K concentrations in sugarcane leaves indicated a significantly positive correlation with each other at the 5% level of probability (Figs. 8a and 8b). The values of the determination coefficients were r2 = 0.063** with the regression line y = 15.78 x in 2013–14, andr2 = 0.794** with the regression line y = 9.559 x in 2014–15.

Figure 8: Relationship between P and K concentrations in 2013–14 (a) and 2014–15 (b), P and S concentrations in 2013–14 (c) and 2014–15 (d), and K and S concentrations in 2013–14 (e) and 2014–15 (f)
P and S concentrations in sugarcane leaves indicated a significant positive correlation with each other at the 5% level of probability (Figs. 8c and 8d). The values of the determination coefficients were r2 = 0.231** with the regression line y = 2.705x in 2013–14, and r2 = 0.289** with the regression line y = 2.498x in 2014–15.
The concentrations of K and S in sugarcane leaves indicated a significant positive correlation with each other at the 5% level of probability (Figs. 8e and 8f). In both years, the value of the determination coefficient was r2 = 0.245** with the regression line y = 0.171 x in 2013–14, and r2 = 0.355** with the regression line y = 0.257x in 2014–15.
3.16 Effects of Integrated Nutrient Management on Post-Harvest Soils
In the 2013–14 cropping season, the pH value of the initial soil was 7.6 and that of the postharvest soil varied from 7.5 to 7.6 in the different treatments (Tab. 14). The pH of the initial soil was 7.6 and that of the postharvest soil was 7.6 in the cropping season of 2014–15. Due to the different treatments, the organic carbon concentration of the postharvest soils ranged from 0.72% to 0.73% in 2013–14, and it was 0.71% in 2014–15. The total N concentration of the postharvest soils was 0.06 in 2013–14, and 0.07 in 2014–15 because of the different fertilizer treatment combinations. Available P concentrations of postharvest soils varied from 12.9 to 13.0 mg kg−1 in 2013–14, and 9.9 to 10.0 mg kg−1 in 2014–15. In the 2013–14 cropping season, the exchangeable K concentrations of the postharvest soils were not significantly different. The exchangeable K concentration of the initial soil was 0.28 cmol kg−1, and that of the postharvest soil varied from 0.27 to 0.28 cmol kg−1 in the 2014–15 cropping season. The available S concentrations of the initial soils were 30.0 mg kg−1 in 2013–14, and 25.0 mg kg−1 in 2014–15. The available S values of the postharvest soils due to the different treatment combinations varied from 29.9 to 30.0 mg kg−1 in 2013–14, and 24.9 to 25.0 mg kg−1 in 2014–15.


3.17 Economic Analyses of Integrated Nutrient Management in Sugarcane Production
The total production cost of sugarcane was assessed for the different treatment combinations (Tab. 15). The total production cost of sugarcane varied from Tk. 65,000.00 to 97,480.00 in 2013–14, and Tk. 65,000.00 to 97,810.00 in 2014–15. Treatment T6 needed the highest production cost with the amount of Tk. 97,480.00 and Tk. 97,810.00 in both the 2013–2014 and 2014–15 cropping seasons, respectively. In both seasons, treatment T1 required the lowest production cost. The highest gross margin was observed in treatment T3 in 2013–14 and 2014–15 with the values of Tk. 3,60,050.00 and Tk 3,23,525.00 ha−1, respectively. The lowest gross margins of Tk. 1,37,200.00 and Tk. 1,36,725.00 ha−1 were recorded in treatment T1 in 2013–14 and 2014–15, respectively. Treatment T3 obtained the highest net return with the amount of Tk. 2,71,354.00 ha−1 in 2013–14, and Tk. 2,35,455.00 ha−1 in 2014–15. The lowest net returns of Tk. 72,200.00 ha−1 in 2013–14 and Tk. 71,725.00 ha−1 in 2014–15 were noted on treatment T1. A maximum benefit cost ratio (BCR) of 4.06 was obtained from treatment T3 in 2013–14; this ratio was 3.67 also in T3 in 2014–15. The second highest BCRs, of 3.47 and 3.20, were observed in treatment T4 in the 2013–14 and 2014–15 cropping seasons, respectively.

Almost all the traits determined in these experiments were influenced significantly by the treatments of integrated nutrient management with respect to growth and yield attributes of sugarcane, juice and Jaggery (goor) quality of sugarcane, nutrient status of post-harvest soil and economic analyses at the Bangladesh Sugarcane Research Institute, Ishurdi, Pabna. Physiological characters of sugarcane viz., chlorophyll, leaf area index (LAI), and total dry matter (TDM) yield were also statistically significantly different among the integrated nutrient management treatments. Chlorophyll, LAI, and TDM were found higher in treatment T3, but it was statistically similar toT4 in both years. It might be attributed to the ability of poultry litter or cow dung in improving soil structure and aeration thereby reducing leaching of inorganic fertilizer and leading to the increase in sugarcane growth. Leaf area index might have increased due to this treated sugarcane plant which had more capability to obtain more light and air as well as chlorophyll resulting in an increased in leaf area and TDM yield. Nawaz et al. [20] observed that LAI and TDM yield increased more with compost + inorganic 100% RFD. Bokhtiar et al. [21] and Gana [22] also supported these findings. Roksana [23] also showed that total chlorophyll concentration, LAI and DM yield were found maximum with 100% recommended fertilizer with enriched press mud either of Trichoderma harzianum or T. viride. In both 2013–14 and 2014–15 cropping seasons, the growth rate of sugarcane increased at 30 and 60 days after stem formation, and thereafter it decreased at 90 days after stem formation in the case of all treatments of integrated nutrient management. In the study, treatments receiving both organic and chemical fertilizers increased growth rate over the control. The increased growth rate might be due to a better utilization of chemical nutrients in combination with organic sources than chemical sources alone. These findings were in agreement with the results obtained by Bokhtiar et al. [24] and Sharma et al. [25]. The number of tiller production showed an increasing trend until 150 DAT and thereafter, it gradually decreased until210 DAT in both seasons and all treatments. Rahman [26] and Rahman et al. [27] also reported the highest number of tiller population at 150 DAT and then, it decreased at 180 DAT. Tiller population increase in treatment T3 followed by T4. This might be due to the treatments containing a huge source of macro- and micro-nutrients, which enhanced soil fertility, supplying more nutrients to the plant root zone and showed more growth of the plants. Babu et al. [28] and Darandale et al. [29] also supported our findings. A better utilization of chemical nutrients in combination with organic sources increased tillering more than chemical sources alone. These findings were in agreement with the results of Bokhtiar et al. [24]) and Umesh et al. [30]. In the present study, tiller mortality rate was lower during the growing period because crop used organic and chemical fertilizers combindly. Yield attributes like number of millable cane, stalk height, stalk diameter and cane yield increased in T3, which was statistically similar to T4 in both seasons, except stalk diameter that was the highest in the T5 treatment in 2013–14. This might be due to the treatments, which most likely were highly efficient to enhance soil physico-chemical properties, making nutrients more readily available for sugarcane growth. Soomro et al. [31] supported these results. The results showed that the organic along with inorganic fertilizers had a more significant influence on the growth and yield attributes of sugarcane. The integrated use of the organic along with the inorganic fertilizer had significant effects on the growth and yield attributes of the plant sugarcane crop as stated by Nawaz et al. [32]. The application of 75% recommended NPK through inorganic + 25% through organic fertilizer (FYM) + biofertilizer + trash mulching in alternate rows + biopesticide produced significantly the highest number of tillers in plant sugarcane; cane length, cane yield, sugar yield and other yield attributes were observed the highest in the same treatment further mentioned by them. In this study, the highest yields of cane and sugar were recorded in the T3 treatment. This might be attributed to the amelioration of soils as evidenced by the improvement in the crop growth parameters (i.e., tillering, millable sugarcane number and stalk height). The findings of several others researchers were consistent with our results. Application of 100% RFD + press mud at 20 t ha−1 for sugarcane crop proved to be more promising as observed by Soomro et al. [31]. Similar observations to the present findings were also reported by Bokhtiar et al. [21]. These authors also found that enriched press mud with 100% inorganic fertilizer was more effective for obtaining more yields by enhancing the yield attributes. Babu [33] further reported that among different organic sources, FYM, press mud and poultry litter proved to be superior in terms of cane yield, whereas press mud followed by poultry litter also increased sugar yield. Enriched press mud was more effective than raw press mud in increasing sugarcane yields. In comparison to the chemical fertilizer alone, NKS concentrations of leaf tissues were slightly increased.
The application of integrated nutrient management also increased sugarcane cane juice quality, especially T3. The better juice quality was found in FYM + RFD on the plant crop reported by Lakshmi et al. [34]. The application of 25% less than RFD of NPK with compost (15 t ha−1) for crop increased growth and yield of sugarcane without deteriorating soil fertility, which ultimately increased the juice quality of sugarcane [11]; these observations were in line with the present study. These authors found that without deterioration of soil fertility, the application of 25% less than RFD of NPK with compost (15 t ha−1) for crop increased growth and yield of sugarcane improved juice quality. Sarwar et al. [35] mentioned that the combination of press mud with inorganic fertilizer enhanced juice quality of plant sugarcane. A similar result was also reported by Babu [33]. Among different organic sources, FYM, press mud and poultry litter were superior in terms of juice quality. The results of the present study agrees with those of Singh et al. [36]. These authors observed that the integrated use of organic with chemical fertilizers had the capacity to sustain sugar production. The application of PMC at 2 t ha−1 + 140 kg N ha−1 and PMC at 4 t ha−1 + 100 kg N ha−1 increased sugar yield over 180 kg N ha−1 and gave an economy of 40–80 kg N ha−1. The same result was reported by Bokhtiar et al. [37], who observed that the application of FYM, ground nut cake and inorganic nitrogen in the ratio of 1:1:1 proved better with regard to cane yield, but without alteration in juice quality. The application of FYM, ground nut cake and inorganic nitrogen in the ratio of 1:1:1 increased cane yield but without alteration in juice quality as reported by Vedprakash et al. [38]. In this study, treatment T3 produced the best cane juice quality; T4 was also beneficial for obtaining an improved quality of cane juice as compared to remaining treatments. Soomro et al. [39] also found similar results and reported that the residual organic fertilizers with inorganic NPK fertilizers had a greater effect on yield and quality of sugarcane. The highest significant brix and other qualities were obtained in 25% less of RFD + FYM at 15 t ha−1 in ratoon crops of sugarcane reported by Rahman [26].
The combinations of organic and inorganic nutrient management did not affect soil properties. This might be attributed to the short-term application of those nutrients to the soil. Generally, at least 3–4 years are necessary to see changes of soil properties after application of any soil amendments. However, the duration of the current experiment was only 2 years, which is too short to expect changes of soil properties after imposing the soil amendment treatments. However, the application of organic and inorganic combinations slightly improved soil physico-chemical properties in the current study. Treatment T3, T4 or T7 improved soil structure of the sugarcane experimental field at the Pabna region. This was due to the integrated use of organic and inorganic fertilizers having a direct role in supplying macro- and micro-nutrients, which might be improved soil fertility status in comparison to that of the chemical fertilizers alone. Singh et al. [40] confirmed this result. These authors applied organic fertilizer combined with inorganic fertilizer to increase soil physical and chemical properties at any region. Srivastava et al. [12] reported that the application of organic matter from animal manure, crop residues and green manuring replenished soil organic C and improved soil fertility. Besides, soil OC, total N, available P, exchangeable K and available S were increased in organic press mud over other treatments as reported by Roksana [23]. Bokhtiar et al. [21] also observed that soil OC, total N, P, K and S concentrations were superior with press mud and 100% RFD in High Ganges River Floodplain soils. This result agrees with findings obtained by Gana [22], who used cow dung combined with inorganic fertilizer, which increased organic carbon and cation exchange capacity in soils. Similar results were obtained by Darandale [29]. This author reported that the integrated use of manures with fertilizers was extremely important for nutrient uptake of sugarcane when nitrogen was supplied from 50% press mud and 50% through urea. Srivastava et al. [41] obtained similar results with the application of PM at 10 t ha−1 and FYM at 10 t ha−1 along with inorganic fertilizer. The same results were obtained by Boktiar et al. [42]. These authors mentioned that organic C, available N, P, K, and S concentrations were higher in postharvest soils that received inorganic fertilizer in combination with organic manure than the control and inorganic fertilizer treated soil. Ramos et al. [43] also supported these results. These authors stated that there was an increase in the soil P levels by fertilizing with poultry litter and organo-mineral fertilizers. Levels of soil K, Ca and Mg concentrations, acidity and soil organic matter, and levels of macronutrients in sugarcane did not change by the application of poultry litter and organo-mineral fertilizers compared with mineral fertilizer. Aulakh et al. [44] found the same result and mentioned that the integration of chemical fertilizers and FYM improved soil health. Shukla et al. [45] also found the same result and stated that the application of 100% N through organic fertilizer improved soil OC, N use efficiency and soil respiration rate. Therefore, the findings of this research indicated that organic along with chemical fertilizers improved soil fertility. The physical and chemical properties of post-harvest soils at the Pabna region were also determined and observed an identical variation in almost all the characters among the integrated nutrient management practice treatments. However, all the treatments proved to enhance their initial concentration. Results also revealed that most of the soil nutrient concentrations were highly influenced by the integrated nutrient management. The result in the current study suggested that the incorporation of the organic and inorganic nutrients was more efficient for enhancing soil nutrients at the Pabna region. This might be due to that the organic fertilizer had a higher ability to supply macro- and micro-nutrients to the soil alone while it was supplemented with inorganic fertilizer it increases more nutrient to the soil as well as the soil becomes more fertile and achieve a higher ability to contribute to a greater production of plant sugarcane. Finally, these results suggested that the soil fertility was highly influenced by the integration of PL at 5 t ha−1 + N95P51K87S9Mg10Zn2.5B4 kg ha−1 or CD at 15 t ha−1 + N36P52K60S17Mg10Zn2.5B4 kg ha−1 at the Pabna region. Venkatakrishnan et al. [46] also agreed with these results and reported that seasoned press mud at 25 t ha−1 along with 100% RFD increased the post-harvest N, P and K soil status in a plant sugarcane field when it was intercropped with legume crops. They also stated that the increase of macro- and micro-nutrients with manure in combination with inorganic fertilizers was in conformity with the results of Shukla et al. [47]; Rahman [26]; Bokhtiar et al. [42] and several other scientists in a plant sugarcane intercropping system with legume crops.
More gross and net return with maximum BCR at the High Ganges River Floodplain soils were obtained in the T3 treatment. This might be due to the higher growth of plants. It included a greater effect on yield attributes as well as more sugarcane yield attained under this treatment. Nawaz et al. [20] also reported similar results than those obtained in with the present findings in a recent year. They also reported that the combined application of compost and inorganic fertilizers showed the highest benefit of cost ratio due to the higher yield of plant sugarcane. The application of 25% N through FYM + 25% N through poultry litter + 50% N through inorganic fertilizers produced net returns and B:C ratios close to those obtained with a 100% recommended fertilizer alone, and improved soil health in terms of a positive nutrient balance [48]. These results were also supported by the findings of Keshavaiah et al. [49] and Keshavaiah [50], who reported the highest gross and net returns along with the highest BCR in the organic and inorganic fertilizer combinations.
To obtain more yield from sugarcane, organic fertilization in combination with chemical fertilizers can be a good agronomic management practice. Considering the present experimental findings, integrated applications of Poultry litter (Treatment 3) followed by Cow dung (Treatment 4) proved to be the most effective and profitable combination for improving growth, yield and quality of sugarcane. Treatments 3 and 4 showed the better productive and profitable integrated nutrient management technology for sugarcane cultivation without soil fertility degradation in the High Ganges River Floodplain soils.
Author Contributions: Conceptualization, M.S.A., M.M.R., M.A.A., and M.A.I.; methodology, M.S.A. and M.M.R.; software, M.A.I. and A.H.; validation, M.S.A., M.M.R., M.A.A. and A.H.; formal analysis, M.A.I. and A.H.; investigation, M.S.A., M.M.R., and M.A.A.; resources, M.M.R., M.A.I., and A.H.; data curation, M.A.I. and A.H.; writing—original draft preparation, M.S.A., M.A.I., M.M.R., and M.A.A.; writing—review and editing, A.B., A.O.A., and M.M.H.; visualization, M.S.A., M.M.R., and M.A.A.; supervision, M.M.R., M.A.I., M.A.A., and A.H.; project administration, M.M.R., M.E.S., M.F.K.S, M.M.H., and A.H.; funding acquisition, M.E.S., M.F.K.S, M.M.H., and A.H.
Acknowledgement: We are thankful to the Bangladesh Sugar crop Research Institute (BSRI), Ishwardi, Pabna, Bangladesh for giving all facilities during the study. We are also grateful to the Taif University Researchers Supporting Project No. TURSP-2020/142, Taif University, Taif, Saudi Arabia for providing financial support to do this research.
Ethical Statement: No living organism (human or animal) was involved in conducting the present experiments.
Funding Statement: This research was funded by the Bangladesh Sugar crop Research Institute (BSRI), Ishwardi, Pabna, Bangladesh and the Taif University Researchers Supporting Project No. TURSP-2020/142, Taif University, Taif, Saudi Arabia.
Conflicts of Interest: The authors declare no conflict of interest.
1. Hossain, M. M., Abdulla, F. (2015). Forecasting the sugarcane production in Bangladesh by ARIMA model. Journal of Applied Probability and Statistics, 4(2), 297–303. DOI 10.12785/jsap/040214r. [Google Scholar] [CrossRef]
2. BER (2015). Bangladesh Economic Review. Department of Finance, Ministry of Finance, Government Republic of Bangladesh, Dhaka, Bangladesh. https://mof.gov.bd/site/page/44e399b3-d378-41aa-86ff-8c4277eb0990/Bangladesh-Economic-Review [Google Scholar]
3. Bhander, P. K., Bhuiya, M. S. U., Salam, M. A. (1998). Effect of sesbania rostrata biomass and nitrogen fertilizer on the yield and yield attributes of transplant aman rice. Progressive Agriculture, 9, 89–93. [Google Scholar]
4. Bokhtiar, S. M., Paul, G. C., Rashid, M. A., Rahman, A. B. M. M. (2001). Effect of press mud and inorganic nitrogen on soil fertility and yield of sugarcane grown in high Ganges River floodplain soils of Bangladesh. Indian Sugar, 51, 235–241. [Google Scholar]
5. Palaniappan, S. P., Annadurai, K. (1999). Organic farming: Theory and practice. Scientific Publishers, Jodhapur, India. [Google Scholar]
6. Bhattacharya, P., Gehlot, D. (2003). Current status of organic forming at international and national level. Agrobios News Letter, 4, 7–9. [Google Scholar]
7. Gopalasundaram, P., Bhaskaran, A., Rakkyappan, P. (2012). Integrated nutrient management in sugarcane. Sugar Tech, 14(1), 3–20. DOI 10.1007/s12355-011-0097-x. [Google Scholar] [CrossRef]
8. Food and Agriculture Organization (FAO) (2011). Report of the 3rd Research Coordinator Meeting: FAO/IAEA Coordinated Research Project on Management of Nutrients in Rain fed Arid and Semi-Arid Areas for Increasing Crop Production. Vienna, Austrias. [Google Scholar]
9. Senthilnathan, R., Stalin, P. (2016). Effect of integrated plant nutrient supply system on growth of sugarcane. Advances in Life Sciences, 5(10), 4201–4204. [Google Scholar]
10. Dutta, S., Pal, R., Chakeraborty, A., Chakeraborty, K. (2003). Influence of integrated plant nutrient supply system on soil quality restoration in a red and laterite soil. Archives of Agronomy and Soil Science, 49, 631–637. DOI 10.1080/03650340310001599722. [Google Scholar] [CrossRef]
11. Bokhtiar, S. M., Sakurai, K. (2005). Effect of application of inorganic and organic fertilizers on growth, yield and quality of sugarcane. Sugar Tech, 7(1), 33–37. DOI 10.1007/BF02942415. [Google Scholar] [CrossRef]
12. Srivastava, T. K., Lal, M., Singh, K. P., Suman, A., Kumar, P. (2009). Enhancing soil health and sugarcane productivity in a plant-ratoon system through organic nutrition modules in subtropics. Indian Journal of Agricultural Sciences, 79(5), 346–350. [Google Scholar]
13. Tandon, H. L. S. (ed.). (2013). Methods of Analysis of Soils, Plants, Water, Fertilizers and Organic Manures, 2nd edition Fertiliser Development and Consultation Organisation, 204-204A Bhanot Corner, 1-2 Pamposh Enclave, New Delhi–110048 (India). http://www.gbv.de/dms/tib-ub-hannover/777236389.pdf [Google Scholar]
14. Jackson, M. L. (1973). Soil chemical analysis. Prentice Hall of India Pvt., Ltd., New Delhi, India. [Google Scholar]
15. Gupta, I. C., Yaduranshi, N. P. S., Gupta, S. K. (2012). Standard methods for analysis of soil, plant and water. Scientific Publishers, Jodhpur, India. [Google Scholar]
16. Gupta, P. K. (2013). Soil, Plant, water and fertilizer analysis, 2nd edition Jodhpur, India, Agrobios. [Google Scholar]
17. Page, A. L. (1982). Methods of soil analysis. American Society of Agronomy and Soil Science of America, Madison, WI. [Google Scholar]
18. Sparks, D. L., Page, A. L., Helmke, P. A., Loeppert, R. H. (1996). Methods of soil analysis. Part 3. Chemical methods. Soil Science Society of America Inc., Madison, USA. https://www.waterboards.ca.gov/waterrights/water_issues/programs/bay_delta/california_waterfix/exhibits/docs/Islands/II_41.pdf [Google Scholar]
19. Gomez, K. A., Gomez, A. A. (1984). Statistical procedures for agricultural research, 2nd edition New York, USA, A Wiley-Inter Science Publication. [Google Scholar]
20. Nawaz, M., Chatta, M. U., Chatta, M. B., Ahmad, R., Munir, H. et al. (2017). Assessment of compost as nutrient supplement for spring planted sugarcane (Saccharum officinarum L.). Journal of Animal and Plant Sciences, 27, 283–293. [Google Scholar]
21. Bokhtiar, S. M., Roksana, S., Mosleuddin, A. Z. M. (2015). Soil fertility and productivity of sugarcane influenced by enriched press mud compost with chemical fertilizers. SAARC Journal of Agriculture, 13, 183–197. DOI 10.3329/sja.v13i2.26579. [Google Scholar] [CrossRef]
22. Gana, A. K. (2011). Cowdung: Soil amendment agent for the sandy upland sugarcane ecology in Nigeria. Journal of Agricultural Technology, 7, 497–505. [Google Scholar]
23. Roksana, S. (2012). Effect of fertilizers and trichoderma treated press mud on the growth and yield of sugarcane (Master Thesis). Mymensingh, Bangladesh, Department of Soil Science, Bangladesh Agricultural University. [Google Scholar]
24. Bokhtiar, S. M., Sakurai, K. (2007). Integrated use of organic manures and chemical fertilizers on growth, yield and quality of sugarcane in high Ganges River floodplain soils of Bangladesh. Communications in Soil Science and Plant Analysis, 36(13–14), 1823–1837. DOI 10.1081/CSS-200062460. [Google Scholar] [CrossRef]
25. Sharma, B. L., Mishra, A. K., Srivastava, P. N., Singh, D. N., Singh, S. B. (2009). Enriched press mud cake with phosphorus, potassium and biofertilizers on sugarcane. Journal of Cooperative Sugar, 40(5), 43–47. [Google Scholar]
26. Rahman, M. S. (2012). Growth, yield and quality of plant and ratoon crops of sugarcane as affected by plant material and management practices (Ph.D. Dissertation). Rajshahi, Bangladesh, Department of Agronomy and Agricultural Extension, University of Rajshahi. [Google Scholar]
27. Rahman, H. M., Islam, M. R., Rahman, M. S., Islam, M. S., Sohel, M. A. T. (2012). Effects of integrated nutrient management on growth, yield and juice quality of sugarcane. Eco-Toxicology and Agricultural Technology, 2, 1–12. [Google Scholar]
28. Babu, M. V. S., Reddy, C. M., Subramanyam, A., Balaguravaiah, D. (2007). Effect of integrated use of organic and inorganic fertilizers on soil properties and yield of sugarcane. Journal of Indian Society of Soil Science, 55(2), 161–166. [Google Scholar]
29. Darandale, V. E. (2015). Influence of integrated nutrient management on the growth, yield and nutrient uptake of sugarcane. Journal of Basic Science. Special Issue on Bio IPPF, 111–114. [Google Scholar]
30. Umesh, U. N., Kumar, V., Alam, M., Sinha, S. K., Verma, K. (2007). Integrated effect of organic and inorganic fertilizers on yield, quality parameter and nutrient availability of sugarcane in calcareous soil. Bangladesh Journal of Agricultural Research, 32(2), 291–299. [Google Scholar]
31. Soomro, A. F., Panhwar, R. N. (2015). Sugarcane (Saccharum Officinarum L.) Response to Integrated Application Inorganic and Organic Fertilizers for Yield and Quality Attributes. 9th Convention of Pakistan Society of Sugar Technologists, B −1 2nd floor, Royal Avenue Block 13-C Gulshan -e- Iqbal, Opposite: Urdu Science University Karachi, Pakistan. [Google Scholar]
32. Nawaz, M., Chattha, M. U., Chattha, M. B., Munir, H., Ahmad, R. (2016). Sugarcane processing by-product compost supplemented with inorganic fertilizer improve the growth, yield quality of spring planted sugarcane (Saccharum officinarum L.). Journal of Agricultural Research, 54, 631–645. [Google Scholar]
33. Babu, P. R. (2009). Effect of azotobacter and phosphobacteria on NPK content and uptake by sugarcane. Indian Sugar, 58, 39–47. [Google Scholar]
34. Lakshmi, S. R., Sreelatha, T., Rani, T. U., Rao, S. R. K., Naidu, N. V. (2011). Effect of organic manures on soil fertility and productivity of sugarcane in north coastal zone of Andhra Pradesh. Indian Journal of Agricultural Research, 45, 307–313. [Google Scholar]
35. Sarwar, M. A., Ibrahim, M., Tahir, M., Ahmad, K., Khan, Z. I. et al. (2010). Appraisal of press mud and inorganic fertilizers on soil properties, yield and sugarcane quality. Pakistan Journal of Botany, 42, 1361–1367. [Google Scholar]
36. Singh, A. K., Singh, K. M., Rao, A. K. (2013). Effect of integrated nitrogen management on sugar and sugarcane productivity. The Journal of Rural and Agricultural Research, 13, 65–68. [Google Scholar]
37. Bokhtiar, S. M., Sakurai, K. (2005). Effects of organic manure and chemical fertilizer on soil fertility and productivity of plant and ratoon crops of sugarcane. Archives of Agronomy and Soil science, 51(3325–334. [Google Scholar]
38. Ved, P., Mangey, R., Lal, K., (2009). Effect of continuous application of organic manure and inorganic fertilizers on yield and quality attributes of sugarcane. Co-Operative Sugar, 40, 65–67. [Google Scholar]
39. Soomro, A. F., Tunio, S., Oad, F. C., Rajper, I., Khuhro, M. I. et al. (2012). Effect of supplemental inorganic NPK and residual organic nutrients on sugarcane ratoon crop. International Journal of Scientific and Engineering Research, 3, 1060–1070. [Google Scholar]
40. Singh, K., Choudhary, O. P., Singh, K., Singh, H., Singh, S. et al. (2015). Identification of integrated nutrient management for sustaining soil health and sugarcane yield in south western Punjab. Journal of Environmental Biology, 36, 551–555. [Google Scholar]
41. Srivastava, T. K., Singh, K. P., Archanasuman, M., Kumar, P. (2008). Productivity and profitability of sugarcane (Saccharum spp. complex hybrid) in relation to organic nutrition under different cropping systems. Indian Journal of Agronomy, 53(4), 310–330. [Google Scholar]
42. Bokhtiar, S. M., Paul, G. C., Alam, K. M. (2008). Effects of organic and inorganic fertilizers on growth, yield, juice quality and residual effects on ratoon crops of sugarcane. Journal of Plant Nutrition, 31, 1832–1843. DOI 10.1080/01904160802325545. [Google Scholar] [CrossRef]
43. Ramos, L. A., Lana, R. M. Q., Korndörfer, G. H., Silva, A. A. (2017). Effect of organo-mineral fertilizer and poultry litter waste on sugarcane yield and some plant and soil chemical properties. African Journal of Agricultural Research, 12, 20–27. DOI 10.5897/AJAR. [Google Scholar] [CrossRef]
44. Aulakh, C. S., Walia, S. S., Gill, R. S., Kaur, R. (2014). Growth and yield of sugarcane (Saccharum officinarum L.). with integrated nutrient management. Current Advances in Agricultural Sciences, 6, 190–192. [Google Scholar]
45. Shukla, S. K., Singh, P. N., Chauhan, R. S., Solomon, S. (2015). Soil physical, chemical and biological changes and long-term sustainability in subtropical India through integration of organic and inorganic nutrient sources in sugarcane. Sugar Tech, 17, 138–149. DOI 10.1007/s12355-013-0300-3. [Google Scholar] [CrossRef]
46. Venkatakrishnan, D., Ravichandran, M. (2012). Effect of integrated nutrient management on sugarcane yield and soil fertility on an UlticHaplustalf. Journal of the Indian Society of Soil Science, 60, 74–78. [Google Scholar]
47. Shukla, S. K., Awasthi, S. K., Singh, R., Nigam, M., Gaur, A. et al. (2013). Integrated nutrient management in sugarcane-based production systems. Current Advances in Agricultural Sciences, 5, 1–7. [Google Scholar]
48. Patel, V. S., Raj, V. C., Patel, D. D. (2010). Effect of different sources and levels of organics on sugarcane (Saccharum officinarum). Indian Journal of Agronomy, 55, 152–156. [Google Scholar]
49. Keshavaiah, K. V., Palled, Y. B., Shankaraiah, C. K., Jagadeesh, S., Channal, H. T. et al. (2013). Studies on performance of sugarcane under different nutrient management practices. Karnataka Journal of Agricultural Science, 26, 506–510. [Google Scholar]
50. Keshavaiah, K. V. (2011). Effect of organic and integrated nutrient management on growth, yield and quality of sugarcane and jaggery in cauvery command area (Ph.D. Thesis), pp. 1–168. Department of Agronomy, College of Agriculture, Dharwad University of Agricultural Science, Dharwad. [Google Scholar]

 | This work is licensed under a Creative Commons Attribution 4.0 International License, which permits unrestricted use, distribution, and reproduction in any medium, provided the original work is properly cited. |