
 Submit a Paper
 Propose a Special lssue
 Open Access
ARTICLE
Diagnosis and Recommendation Integrated System Assessment of the Nutrients Limiting and Nutritional Status of Tomato
1
Institute of Soil and Environmental Sciences, Pir Mehr Ali Shah Arid Agriculture University Rawalpindi, Rawalpindi, 46300,
Pakistan
2
Department of Biosystems Engineering & Soil Science, University of Tennessee, Knoxville, 37996, USA
3
Department of Agronomy, Ghazi University, Dera Ghazi Khan, 32200, Pakistan
4
Department of Soil, Water, and Climate, University of Minnesota, Sant Paul, 55108, USA
5
Department of Horticultural Sciences, The Islamia University of Bahawalpur, Bahawalpur, 63100, Pakistan
6
Department of Nutrition and Food Science, Faculty of Home Economics, University of Tabuk, Tabuk, 71491, Saudi Arabia
7
Department of Biology, Faculty of Science, University of Tabuk, Tabuk, 71491, Saudi Arabia
8
Department of Food and Nutrition, Faculty of Human Sciences and Design, King Abdul Aziz University, Jeddah, 21551, Saudi Arabia
9
Clinical Nutrition Department, College of Applied Medical Sciences, King Saud bin Abdulaziz University for Health Sciences,
Jeddah, 211423, Saudi Arabia
10 Department of Clinical Laboratories Sciences, The Faculty of Applied Medical Sciences, Taif University, Taif, 21944, Saudi Arabia
11 Centre of Biomedical Sciences Research (CBSR), Deanship of Scientific Research, Taif University, Taif, 21944, Saudi Arabia
12 Mountain Research Centre for Field Crops, Sher-e-Kashmir University of Agricultural Sciences and Technology, Srinagar, 190025,
India
13 College of Food Science and Biotechnology, Key Laboratory of Fruits and Vegetables, Zhejiang Gongshang University, Hangzhou,
310018, China
14 Department of Agronomy, Faculty of Agriculture, Kafrelsheikh University, Kafrelsheikh, 33156, Egypt
* Corresponding Authors: Rabia Manzoor. Email: ; Ayman El Sabagh. Email:
(This article belongs to the Special Issue: The Effect of Soil Quality Degradation on the Plant Growth, Quality and Food Safety in Subtropical Agroforestry Ecosystems)
Phyton-International Journal of Experimental Botany 2022, 91(12), 2759-2774. https://doi.org/10.32604/phyton.2022.022988
Received 03 April 2022; Accepted 30 May 2022; Issue published 29 August 2022
 View Full Text
 Download PDF
Abstract
Tomato is an important field crop, and nutritional imbalances frequently reduce its yield. Diagnosis and Recommendation Integrated System (DRIS), uses ratios for nutrient deficiency diagnosis instead of absolute concentration in plant tests. In this study, local DRIS norms for the field tomatoes were established and the nutrient(s) limiting tomatoes yield were determined. Tomato leaves were analyzed for nutrients, to identify nutritional status using the DRIS approach. One hundred tomatoes fields were selected from Chatter Plain Khyber Pakhtunkhwa and the Sheikupura Punjab Pakistan. The first fully matured leaf was sampled, rinsed, dried and ground for analyzing P, K, Ca, Mg, Cu, Fe, Mn and Zn using an Inductively Coupled Plasma Atomic Emission Spectrophotometer (ICP AES). Plant tissue N and S were measured by the combustion method. The tomatoes yields were recorded at each location. The data were divided into high-yielding (≥3.79 kg/10 plant) and low-yielding (<3.79 kg/10 plant) populations and norms were computed using standard DRIS procedures. High-yielding plant population had a statistically greater mean S and Fe than the low-yielding population. The average balance index, the sum of functions, for S and Fe were −11.04 and −5.17 which reflected deficiency of S and Fe. Plant nutrients norms established may optimize plant nutrition in field tomatoes for high yield.Keywords
Tomato (Lycopersicon esculentum Mill.) is an economically attractive crop that requires a high soil fertility level [1]. Yield and quality of tomatoes are highly variable due to various agroecological conditions, including availability of nutrients, and environmental conditions [2]. Nutrient imbalances can cause poor vegetative growth leading to yield reduction and deterioration of fruit quality [3–5]. Nutrient deficiencies, especially N, K, B and Zn deficiencies can hamper the yield and quality of crop [6–9]. Nutrient imbalance affects nutrient uptake and ultimately leads to poor plant health [10]. Crop yield is highly correlated with nutritional status of plant and the method used to determine this status, which is mainly through tissue analysis [11]. Plant nutrient status diagnosis helps in increasing crop yield by designing efficient nutrient management practices. Nutrient diagnosis to evaluate nutritional status using leaf samples on the basis of chemical analysis has served to evaluate the nutritional status of plants based on chemical analysis is highly sensitive to soil nutrient status [12]. Diagnosis of the yield-limiting nutrients and corrective measures are essential to obtain optimum growth performance and consequently higher yield and quality production [13–16]. Different test methods for soil and plant nutrient are available [17–19]. Soil testing for the plant available nutrients is the traditional method to determine mineral status including deficiency in plant tissues [20]. However, the test values are often less well correlated with the field crops yields. Since plant analysis measures the uptake of nutrients, a more direct method for deficiency diagnosis [21,22]. Plant analysis is done by sampling of a well distinct part of plant. The tissue analysis are very sensitive to the climate, phenological state of plant, nutrient interactions and the part of the plant sampled for the determination of nutrient sufficiency ranges [23–26]. The nutritional status of a crop can be determined by sufficiency ranges and DRIS norms [27,28]. The studies’ conclusions are based on individual nutrient concentration in plants and soil, while growth is a function of the well-balanced concentration of several nutrients. Diagnosis and recommendation integrated system (DRIS) technique-based plant analysis involves nutrient ratios that diagnose deficiencies or excess with accuracy [29].
Beaufils [30] established the DRIS approach, and later several advances were made [31]. DRIS norms, nutrient ratios for a local high-yielding population [28]. DRIS has several benefits over the traditional assessment methods [31]. A DRIS analysis identifies the deficient nutrient, gives the order of the nutrients from the most deficient to most excessive, and shows the contribution of the specific nutrient to yield reduction. It is a reliable way of relating leaf nutrient concentrations to crop yield [32]. The DRIS approach provides a useful analytical tool independent of plant aging, cultivar grown, local conditions, tissue sampling method or the time of sampling [33]. The DRIS approach assesses nutrient status in plants better than by using critical values, or ranges. This approach makes multiple two-way ratio comparisons between the leaf nutrient concentrations and sums these comparisons into a series of nutrient indices [34].
The DRIS approach has been used effectively as a diagnostic tool, and norms have been established for numerous ornamental and field crops internationally such as maize, potato, cauliflower, sugarcane, rice, lettuce, soybean, tomato, onion, banana, and cucumber [12]. In Pakistan, DRIS norms have been reported for wheat [35] and sugarcane [36]. The DRIS norms have not been found for the tomato crop in Pakistan. Thus, the study was planned to establish local DRIS norms for tomato and determine the nutrients limiting the tomato crop production.
The index tissue was sampled from 100 farmers’ fields from the Sheikhupura and Chatter Plain districts of Pakistan. The Chattar Plain lies between latitude 34°36’57.86″N and longitude 73°7’4.8″E with its warm and temperate climate where the mean annual temperature is 15.2°C and mean annual precipitation is 1144 mm. The sampling site of Sheikhupura lies at latitude 31°42’59.98″N and longitude 73°59’6.09″E, has extreme variations in temperature and mean annual precipitation is 635 mm.
The index tissue was the first early mature leave just before flowering (i.e., 25–35 days after planting). The index tissue was collected from several tomato plants and composited. The plant tissue was rinsed with distilled water, oven-dried at 70 ± 1°C for 2 days, and passed through a 60-mesh stainless steel strainer in a Wiley Mill. Tomato yield data per 10 plants was recorded during harvest from all one hundred farmers’ fields.
Phosphorus, K, Ca, Mg, B, Zn, Cu, Fe, Mn in first mature leaves of plants were determined by dry ashing. By taking 0.5 g leaf sample in a crucible, combusted at 485°C for 10 to 12 h until complete ashing and 5 mL of 20% HCl was added to the crucibles. Five mL of deionized water was mixed after 30 min and thoroughly swirled and allowed to stand for 180 min. The nutrients released were measured by an ICP-AES analyzer model ICap 7600 Duo ICP-OES [37,38]. The total nitrogen (N) and sulfur (S) in the plant samples were determined by combustion method on an Elemetar Vario EL iii-combustion analyzer in CNS mode. Dry and ground plant samples (15 mg) were combusted with the tungsten oxide catalyst. The resulting gases passed through various heat and chemical traps. The separated gases were then passed through an optical detector to measure fractional quantities [39,40].
The ratios of nutrient pairs were calculated from nutrient concentrations. The mean, and coefficient of variation were calculated for low and high yielders segregated based on the principles given by Walworth et al. [41]. The DRIS index was calculated by firstly, calculating the function of nutrient pair and secondly, by adding all the functions:
where, f (A/B) through f (N/M) are functions of all the nutrient pairs. Function calculations depended upon whether A/B was greater than a/b, was equal to a/b, or was lower than a/b, where A/B was the nutrient ratio of low yielders and a/b was nutrient ratio of high yielders.
The coefficient of variation CV in the above equation was from norms. The index values were used for interpretation or diagnosis by the DRIS.
Further, the nutrient pairs, both indirect and reverse orders were added in the indices. The sum of nutrient indices (IA+IB+IC+ID+… = 0) is zero. Nutritional balance index (NBI), all the absolute values irrespective of their sign of nutrient indices of particular nutrient were added up.
The Average Nutritional Balance Index (NBIa) was calculated from NBI
NBIa = NBI/Z where Z was number of nutrients
The relationship of nutrient index with NBIa was used for the interpretation of nutrient status.
A nutrient was classified as deficient, adequate and excess when:
Adequate = |IA| ≤ NBIa
Deficient = IA < 0 and |IA| > NBIa
Excess = IA > 0 and |IA| > NBIa
3.1 Nutrient Status of First Mature Tomato Leaf
On the basis of the plant nutrients’ reference concentration for tomatoes as suggested by Ulukapi et al. [42], the frequency of plant tissue analysis is categorized into the deficient, sufficient and an excess level of respective nutrients given in Table 1.
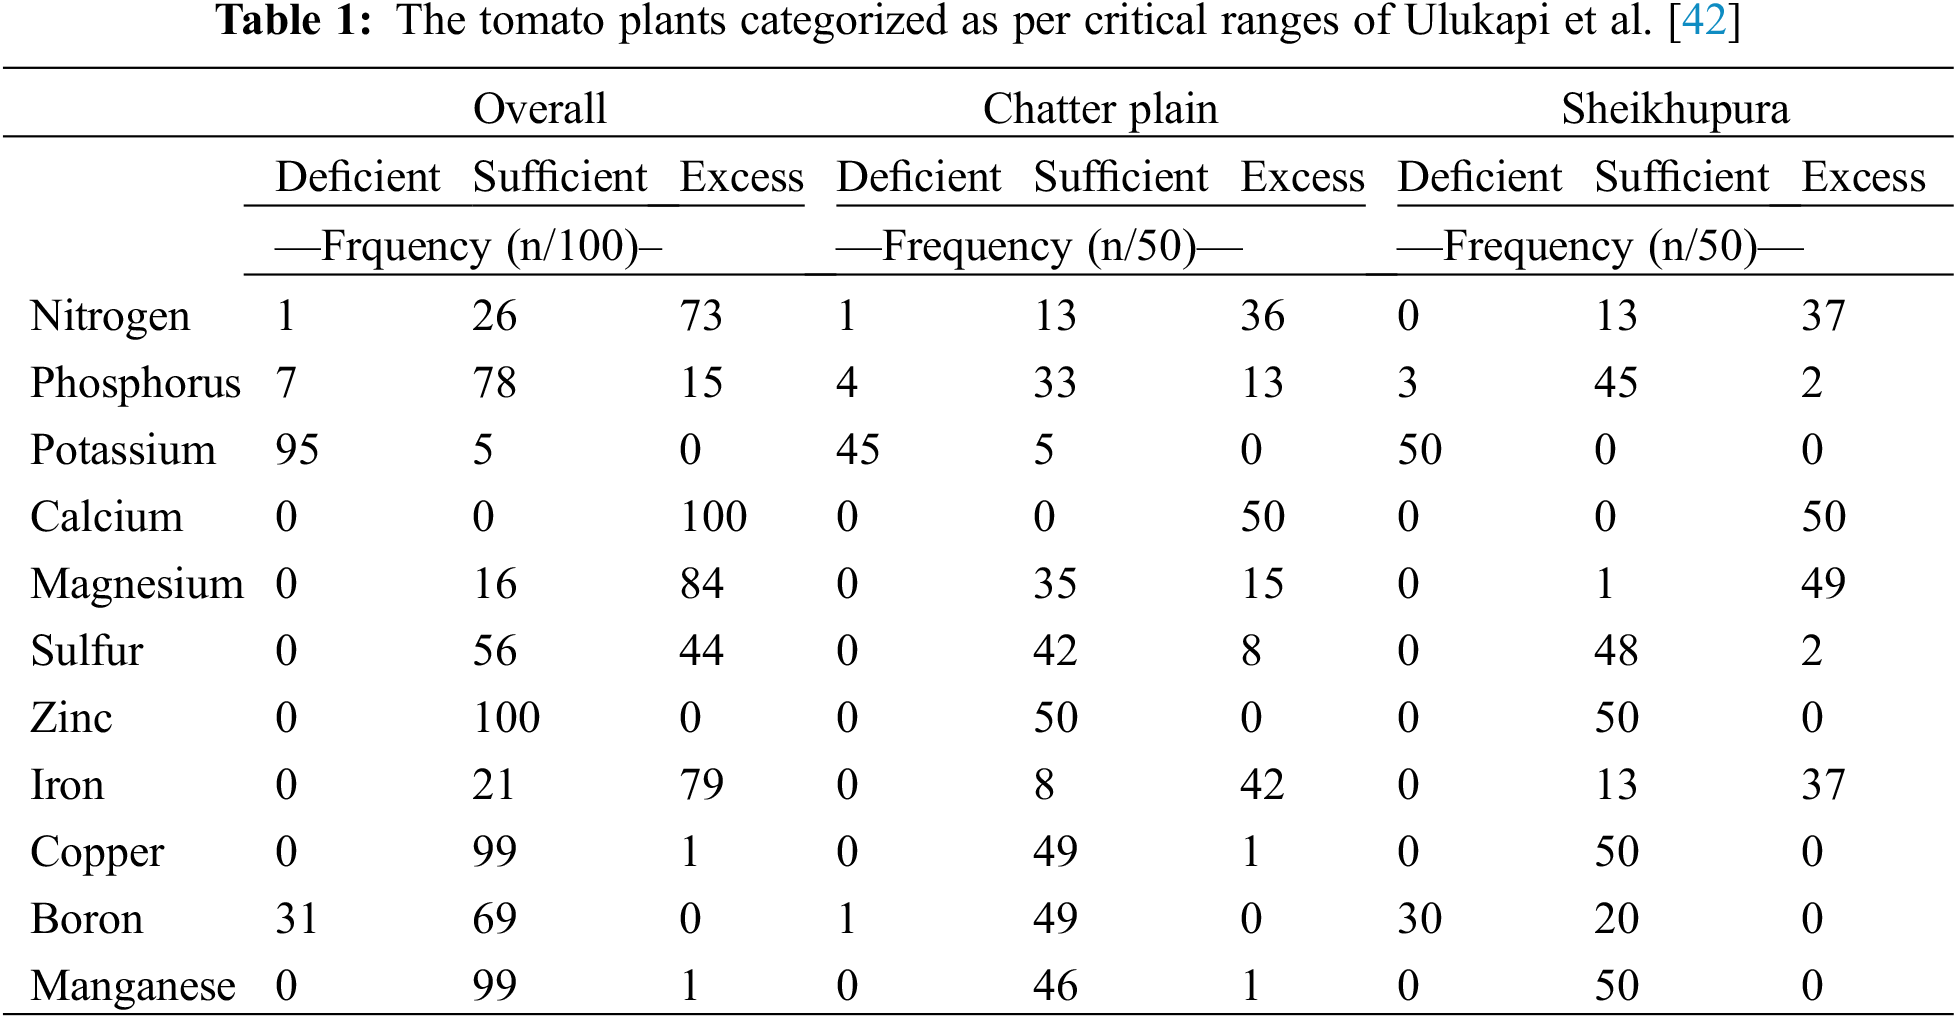
Nitrogen was in the sufficient range in 26 tissue samples, and a vast number had N content in excess. Plant N in the index tissue ranged from 20.0 to 87.0 g kg−1. Phosphorus content in most plant tissues was in the sufficient range, and a few had P in excess (>6.5 g kg−1). Phosphorus in leaves ranged from 3 g kg−1 to 9 g kg−1. Potassium in the tomato index tissue was mostly in the low range (<35 g kg−1). Calcium and Mg were in excess in most of the plant tissue. Magnesium was in excess in many numbers of samples from Sheikhupura, while samples from Chatter plain had Mg in the sufficiency range. Sulfur was in excess (>2 g kg−1) and equally had S in the sufficiency range of 2 to 8 g kg−1. In Chatter plain, S was largely in sufficient range while in Sheikhupura both sufficient and excess levels were observed. Overall plant boron was in the deficient range, <30 mg kg−1 in almost one-third plants and a majority had boron in the sufficient range of 30 to 75 mg kg−1. Copper in tomato index tissue was mostly in sufficient range (5–30 mg kg−1) except for one sample. In the majority of samples iron was in excess (>300 mg kg−1), however, few samples had iron in the sufficient range within 45–300 mg kg−1. Overall, plant Mn was sufficient in the range from 30 to 300 mg kg−1. Zinc was also in the sufficient range from 18–75 mg kg−1 in plant tissue of Sheikhupura and Chatter plain.
3.2 Nutrient Ratios of High and Low-Yielding Population
The ratios of each nutrient with all nutrients were calculated. Mean, range and C.V of the nutrient pairs were calculated for both the high and low-yielding populations of tomatoes presented in Table 2.
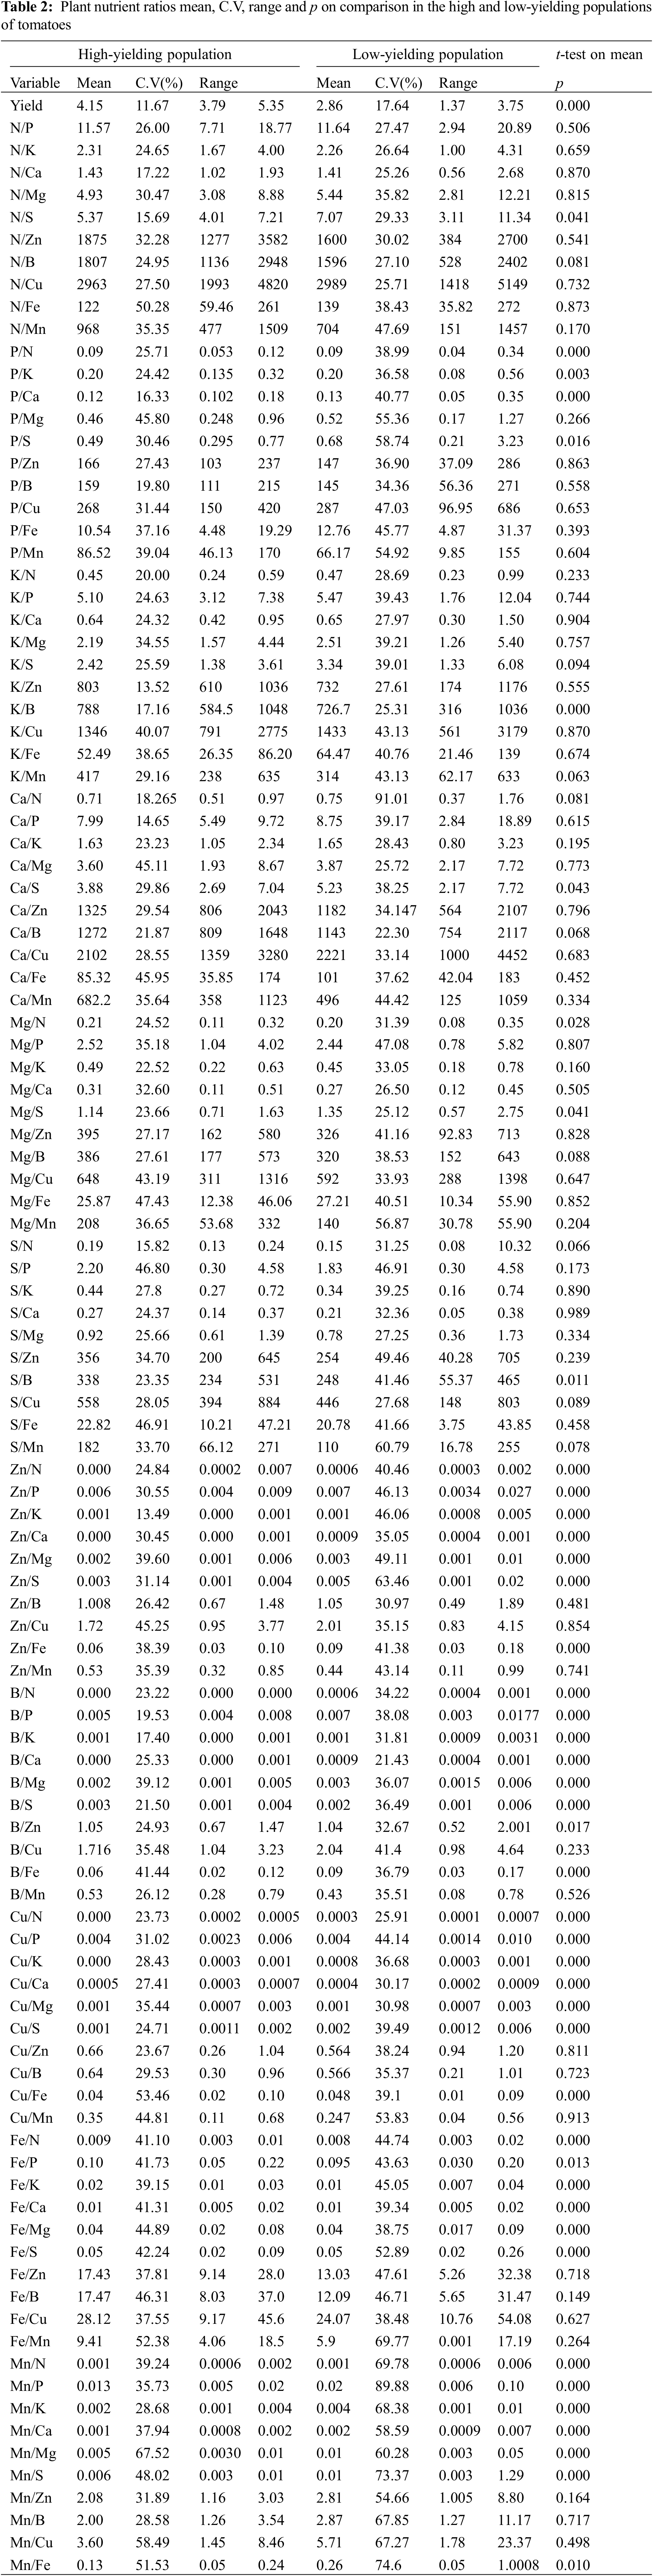
Nitrogen, P, K, Ca, Mg and S ratios with other nutrients were statistically similar in both populations except P/Ca ratio which was wider in the low-yielding population than the high-yielding population and K/B which was wider in the high-yielding population than the low-yielding population. Zinc, B and Mn ratios with other nutrients were statistically wider in the low-yielding population than the high-yielding population except for the micronutrients which were similar in both the populations. Copper and iron ratios with other nutrients were wider in the high-yielding population than the low-yielding population except for micronutrients which were similar in both the populations.
DRIS functions were calculated to estimate sufficiency or deficiency of a specific nutrient against other nutrients individually given in Table 3.
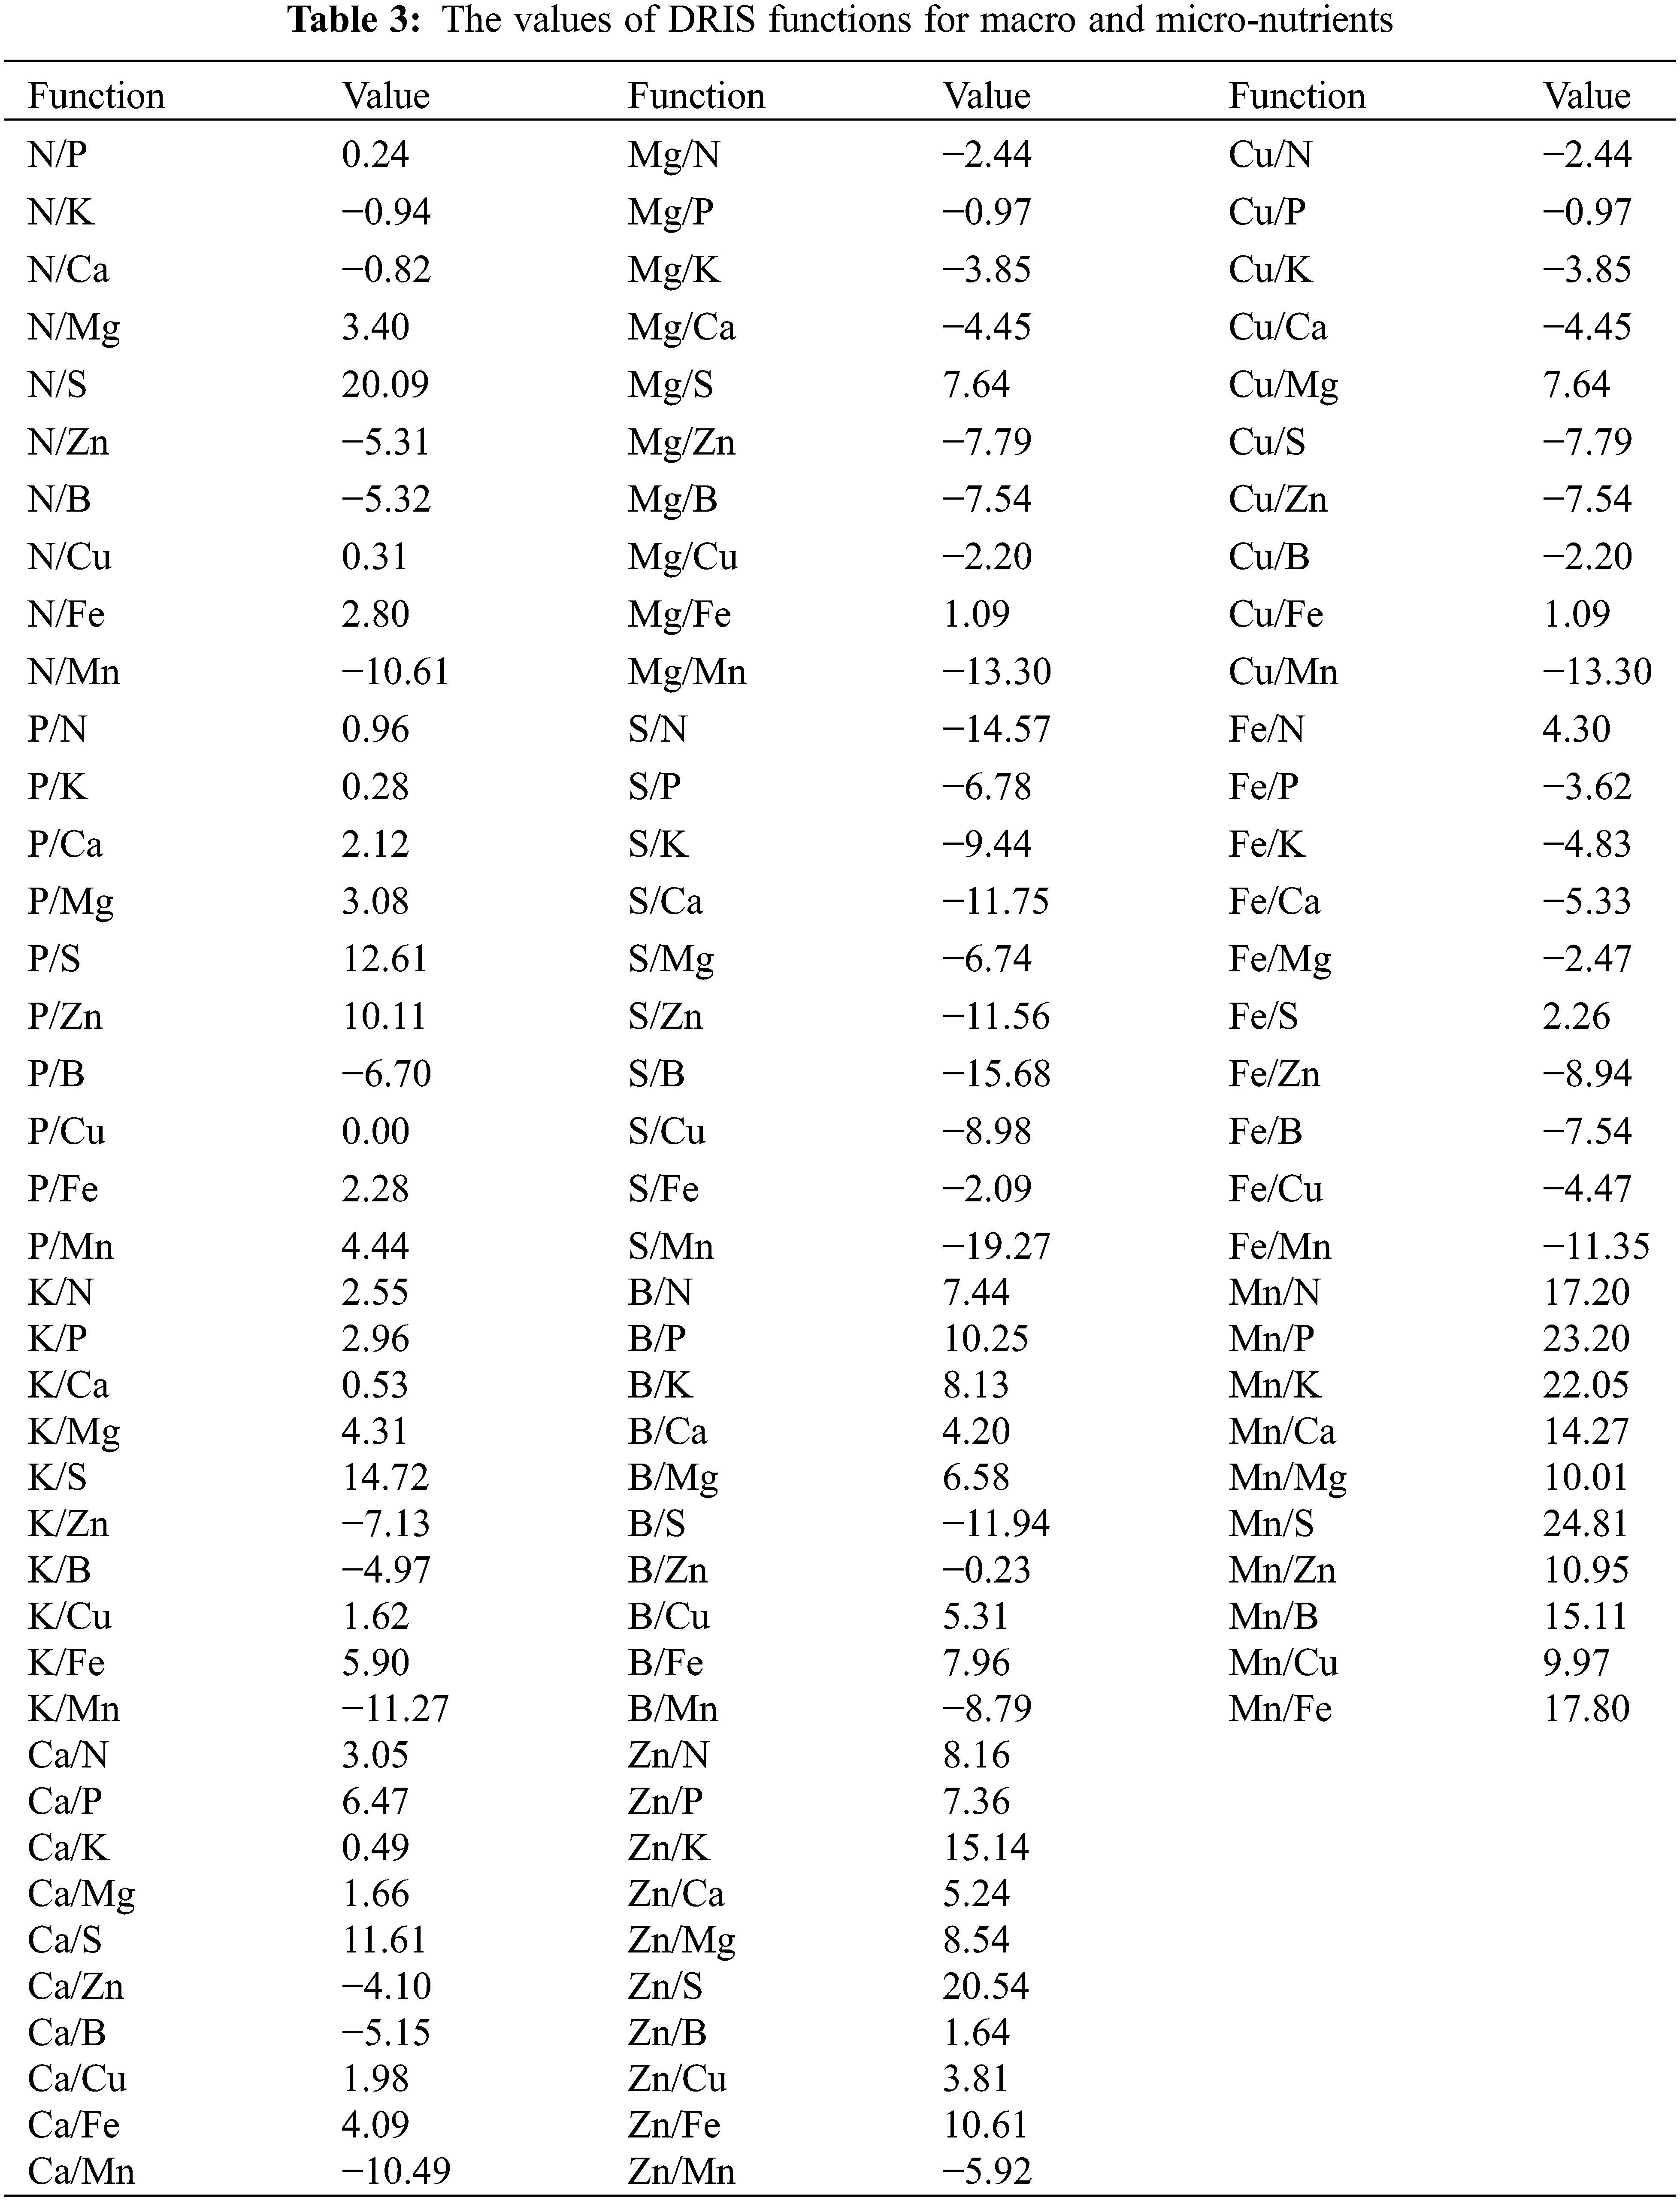
The nutrient’s functions involving S were highly positive and with Mn highly negative.
3.4 Nutrient Balance Index (NBI)
The nutrient balance indices were calculated and presented in Table 4.
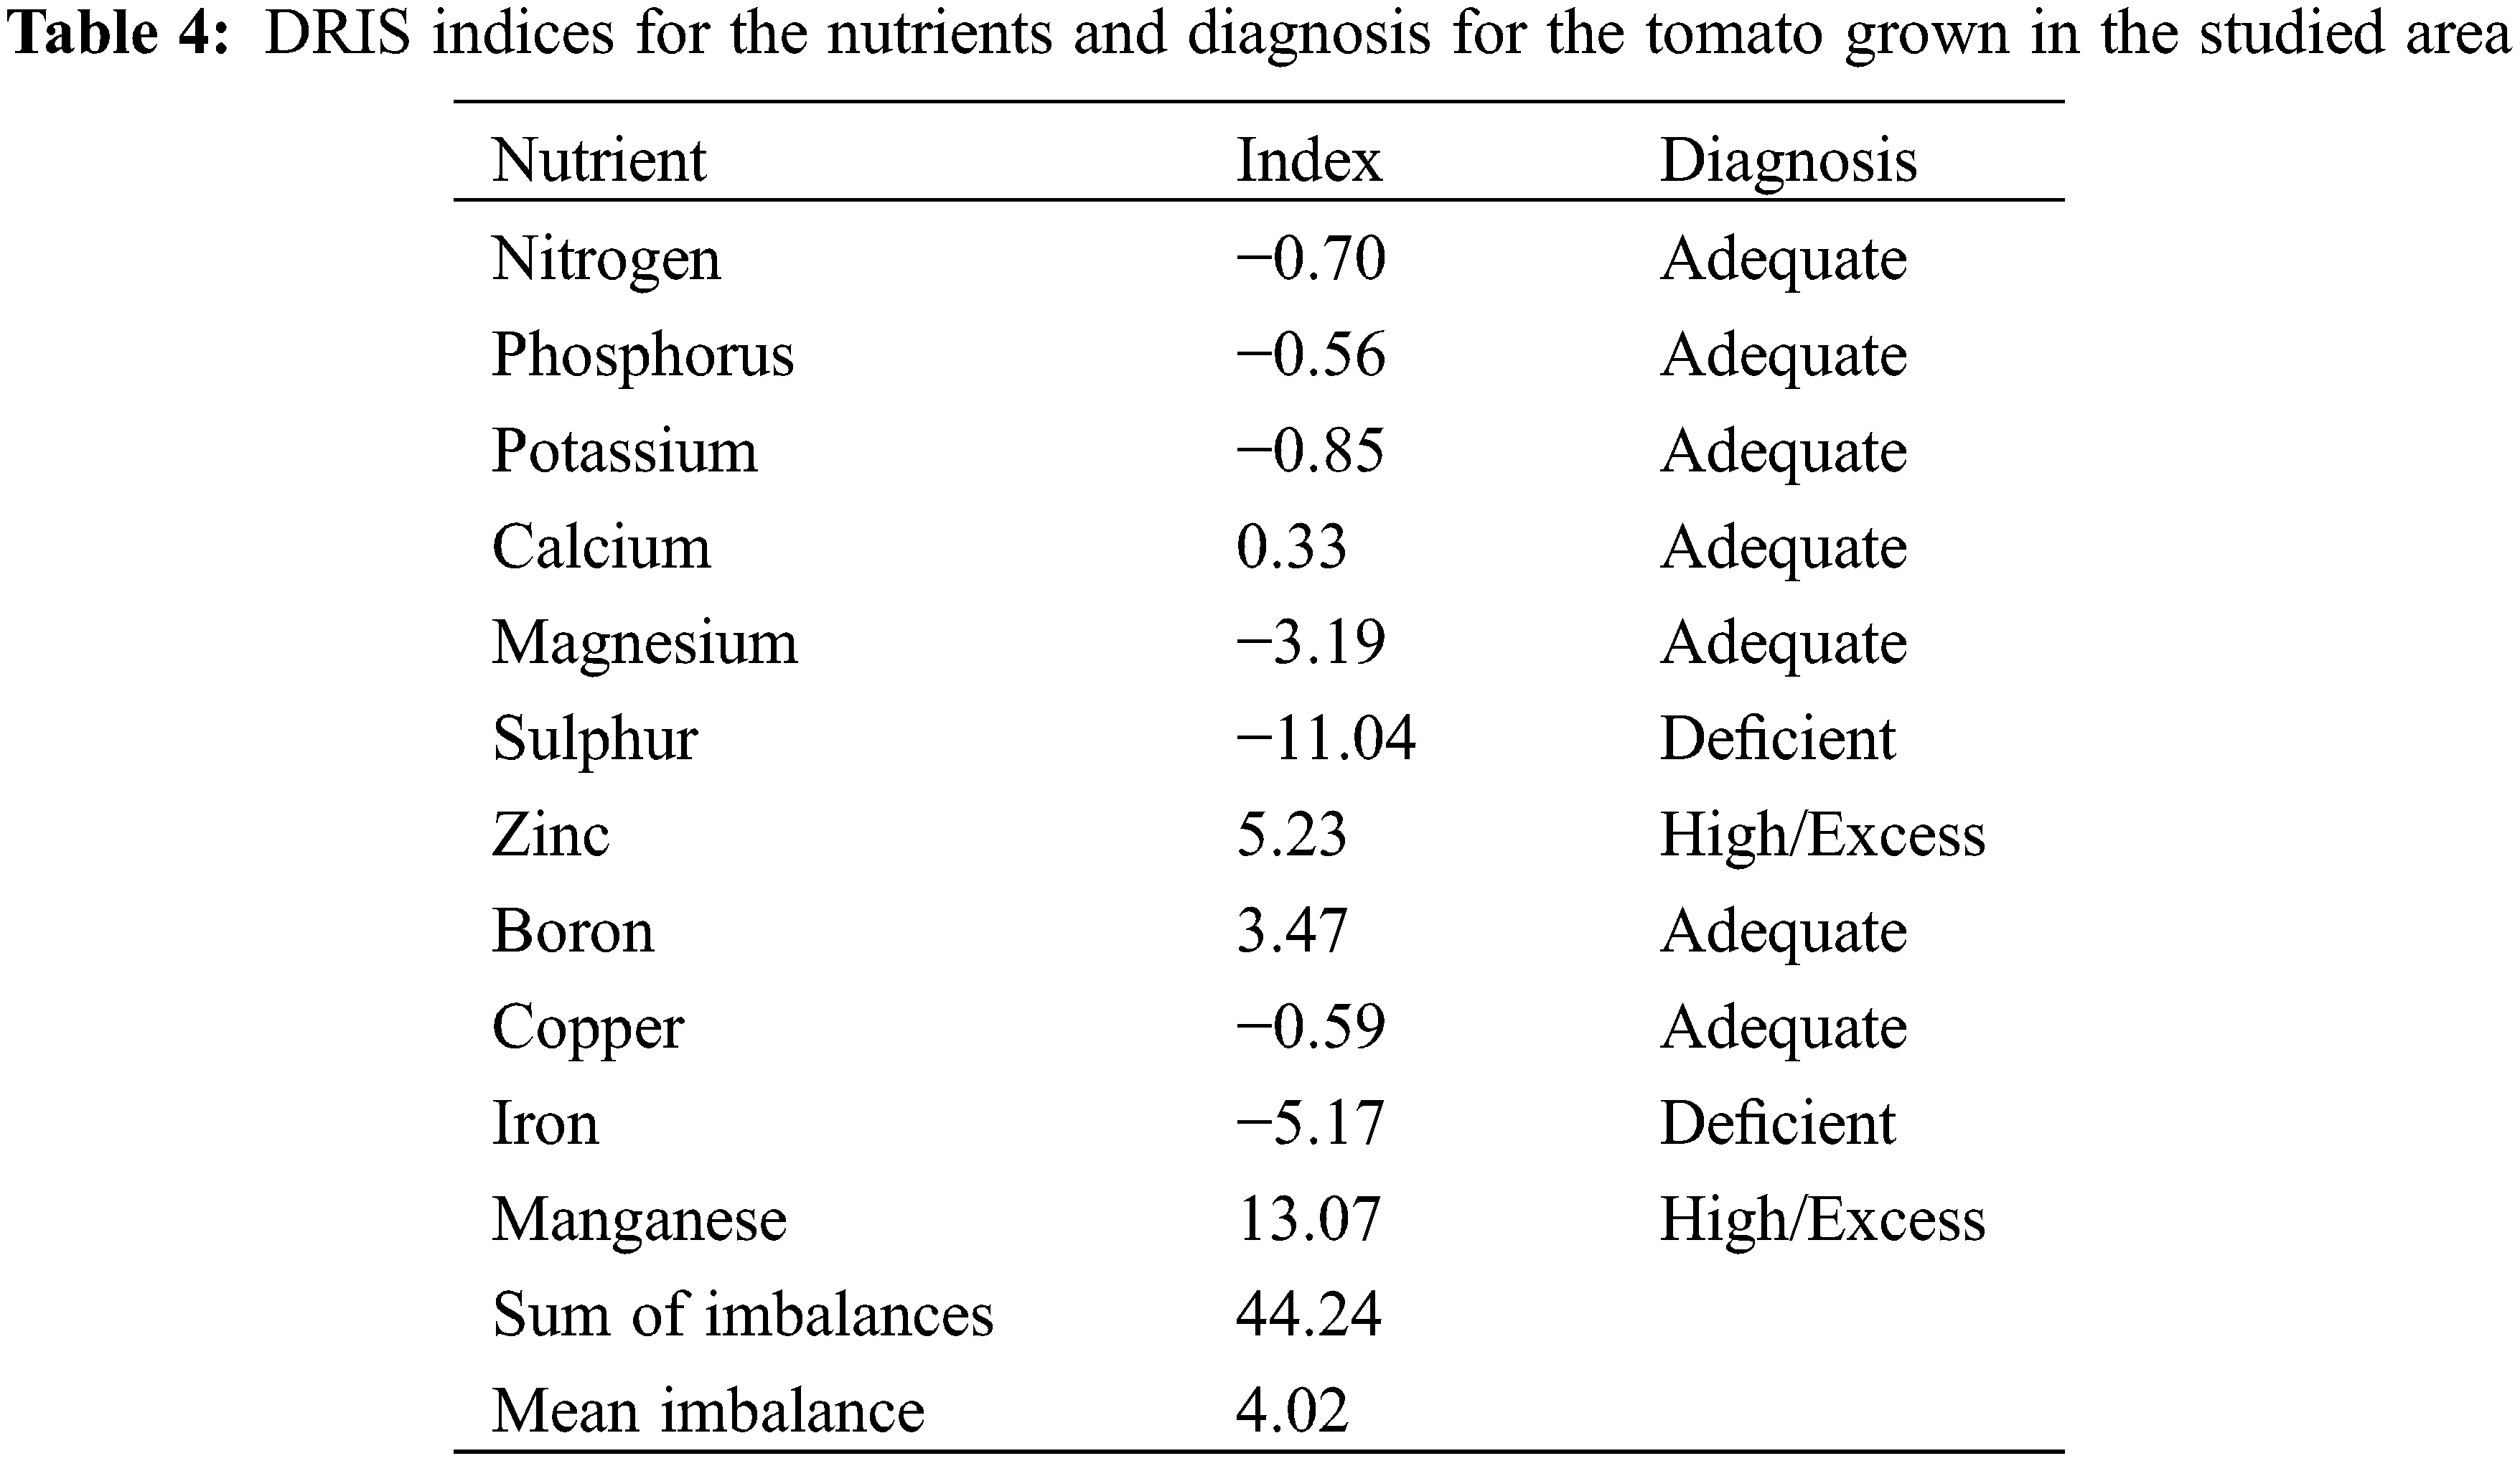
Nitrogen balance index was −0.7 while P balance index was −0.562. The K balance index was −0.856 while its ratios with macronutrients (N, P, Ca, Mg, S) and micronutrients (Fe, Cu) were almost similar in the high and low-yielding population. The Ca balance index was 0.338 and the Mg balance index was −3.193. Tissue Mg concentration was higher than the critical value; with 34% in the sufficiency range and 66% in the excessive range. The S balance index was −11.043 and the iron balance index of −5.176% and 79% plants had an excess of iron and the remaining in the sufficiency level. The copper balance index of −0.595. The boron index was 3.47. The DRIS index for zinc and the Mn index was 13.074.
The reference nutrient concentrations for tomatoes, following suggested by Ulukapi et al. [42], are presented in Table 1. Nitrogen was in excess in more than 70% of plant tissue samples. No apparent N deficiency existed when the two tomato growing areas were sampled. The index tissue had N content in the range of 20.0 to 87.0 g kg−1 on dry weight basis Overall, this range of N matches with the N concentration reported for tomato leaf is from 20 to 50 g kg−1 [43]. An optimal N range is around 30 g kg−1 [44]. Phosphorus content in most plant tissues was in the sufficient range, and a few had P in excess and ranged from 3 to 9 g kg−1. Phosphorus concentration in the plant tissues varies from 1 to 10 g kg−1 in young plants, and from 4.2 to 7.1 g kg−1 in tomato leaves [43,45]. Therefore, phosphorus in the tomato index tissue was within this range. Potassium was mostly deficient in the tomato index tissue. Plant K in the tomato index tissue is reported as 20 to 30 g kg−1 [46]. Overall K in the tomato index tissue was within this range. Tissue samples collected from fields of Sheikupura district, Punjab had K content below the critical range. The concentration of K in the index tissue is initially high and then decreases with age [43,47]. Calcium was in excess (>20 g kg−1) in the index tissue mainly due to the fact that the soils are calcareous [48]. Plant tissue Mg content was also in excess (>30 g kg−1), and only a few had Mg in the sufficiency range (30–80 g kg−1). Magnesium concentration in plants ranges from 2 to 10 g kg−1 based on dry matter [43,47]. Therefore, the range found in this study is within the published values. About half of the plant tissue samples had sufficient S and other half had in excess. Sulfur concentration in leaves ranging from 6 to 13.5 g kg−1 was reported [49], however, in the present study S content varied from 2.1–15 g kg−1.
Boron concentration in plant generally remains within sufficient range, except, one-third plants, showing deficiency. Reported range of boron is 10–39 mg kg−1 in the tomato index tissue [50]. Therefore, boron in the index tissue was within the published range. Boron in tomato plant tissue was sufficient in almost all samples from Chatter plain. In Sheikupura, more than half of the samples had B below the critical range and the remaining had boron in excess. Copper in tomato index tissue was mostly in sufficient range (5–30 mg kg−1) except for one sample. Plant copper found in these samples matched with copper in tomato index tissue ranging from 10 to 27 mg kg−1 reported [50]. Plant copper was in the sufficient range almost equally in both the tomato growing areas. Higher concentration of Cu in the soil solution, relative to Zn, can reduce the availability of Zn to a plant (and vice versa) due to competition for the same sites for absorption into the plant root. Majority of plant index tissue samples had excess iron [51]. Plant iron range matched with the iron in tomato index tissue 320–1180 mg kg−1 reported [50]. Overall, plant Mn was sufficient in the range from 30 to 300 mg kg−1. Plant Mn ranging from 40 to 86 mg kg−1 and zinc ranged from 18–75 mg kg−1 in tomato index tissue from both sides. Plant zinc concentration ranges from 13–191 mg kg−1 in the tomato index tissue [50]. Therefore, the micronutrient concentrations were mostly within the critical sufficiency range for tomatoes [42].
Tomato yields were subdivided into two groups, a high-yielding population of ≥3.79 kg/10 plants and a low-yielding population of <3.79 kg/10 plants. The P/Ca ratio was wider in the low-yielding population than the high-yielding population and K/B was wider in the high-yielding population than the low-yielding population. Nitrogen balance index was −0.7, indicated the adequate N was present in plants of the low-yielding population. Nitrogen index that showed slight deficiency of nitrogen in tomato crop was reported [52]. The diagnosis through the index tissue nitrogen concentrations that had indicated the excess N in more than 70% plant tissues. Nitrogen index was also supported by a comparison of nutrient ratio of low and high-yielding populations. The high yielders had almost similar nitrogen in comparison to the respective nutrients than in non-reference population may signify a balanced nitrogen requirement.
However, the nitrogen index value −0.7 suggested that N may become deficient when other more deficient nutrients are applied. The P balance index was −0.562 that also showed nearly adequate level of P in the low-yielding population. Reported P index IP was −37 and −9 for tomatoes grown on different media showing severe deficiency of P [52]. Though several crop land surveys concluded widespread deficiency of P; Vegetable producing soils appeared to be an exception where application of chemical fertilizer is high tomato plant tissue analyses based on the critical level showed that 72% plant tissue had P sufficiency, and only 7% plant tissue samples were below the critical level.
Phosphorus ratios with macronutrients except for K and S and micronutrients (Zn and Mn) were almost similar in the high and low-yielding populations. Again, we concluded that P may become deficient once additional nutrients are applied. Minor deficiency of K in the low-yielding population was indicated by NBI for K, −0.856. Potassium balance index (IK) of −20 [52] and designated K as the limiting nutrient for tomato yield. Similarly, plant analysis when based on the critical scale approach specified for tomatoes showed that K was low in 95% of the plants. The NBI value −0.856 for K may suggest that it may become deficient when other nutrients are applied. An adequate level of Ca in the low-yielding population was indicated by NBI for Ca, 0.338. Index for Ca was 12 and 6 for tomatoes grown on different media which had shown sufficiency of Ca [53]. About 79% of the plant tissues had excess of Ca. Calcium was high than the critical value and indicated a luxury uptake of Ca by the tomato. Calcium deficiency occur in soil with pH < 4.5 [53]. All the soils in study area had pH ranged from 6.5 to 7.5. Calcium ratios with macronutrients (N, P, K) and with micronutrients (Zn and Mn) were similar in the high and low-yielding populations. The Mg balance index was −3.193 and suggested a deficiency of Mg in the low-yielding population. Tissue Mg concentration was higher than the critical value; with 34% in the sufficiency range and 66% in the excessive range. Magnesium ratios with both the macro and micro nutrients except with N and S were similar in the low and high-yielding populations. Sulfur was deficient in low-yielding population as indicated by NBI of S, −11.043. Sulfur availability in soil is directly related to the loam levels, oxides and organic matter and pH is also important [54]. In soils with low organic matter contents (mostly < 1%) and no recycling of crop residues [55], the quantity of S mineralized from organic sources may not be low [56]. Sulfur ratios with boron were greater in the high-yielding populations than low-yielding population. The shortage in S supplied to the crop lowers the use of other nutrients, particularly N [57]. The strong evidence of the influence of organic amendments on microbial activity, S fractions, and their re-distribution in soil was reported [58]. The organic amendments depending upon their quality and composition significantly influenced S fractions and their availability in soil.
The iron balance index of −5.176 indicated Fe deficiency in the low-yielding population and 79% plants had an excess of iron, while remaining plants had sufficient level. Iron deficiency was also reported in peanut and chickpea [59]. Greater iron ratios were found with macronutrients (N, P, K, S) in high-yielding plant than the low-yielders. Iron, after zinc, is the most deficient micronutrients for crop production in Punjab [60]. The copper balance index of −0.595, suggested an adequate level of copper in the low-yielding population. The diagnosis through the index also matched with the plant tissue copper concentrations that indicated a sufficient or optimum level of copper in the plant tissues. Copper ratios with macronutrients (N, P, K and S) and micronutrients (Fe) were statistically different (p < 0.01) in the high and low-yielding population. Higher copper containing chemical foliar application is probably responsible for high copper concentration in tomato index tissue [61]. The boron index was 3.47 indicating an adequate level of this nutrient in the low-yielding population. Overall, the tomato plants had sufficient boron. In Punjab, a widespread boron deficiency was reported in peanut, chickpea and potatoes [58,61]. Boron deficiency can also occur readily in tomatoes grown in areas with sandy soils with acidic pH, and having heavy rainfall [62]. Boron ratios were statistically different (p < 0.01) in high and the low-yielding population except with Cu and Mn. The DRIS index for zinc indicated an excess of zinc (5.232) in the low-yielding population. Solubility of Zn is largely dependent on pH and decreased as pH levels increase [63]. Zinc was found to be in the sufficiency range for all tomato tissue samples tested. Zinc ratios with macronutrients (N, P, K, Ca, Mg) were statistically different (p < 0.01) in the low and high-yielding population. The Mn index was 13.074 and suggests an excess of Mn in the low-yielding population. In case of Mn, 92% of the samples were in the sufficiency range. Manganese ratios with Zn, B and Cu were almost similar in the low and high-yielding population. The order of nutrient deficiency based on DRIS for tomatoes sampled in this study is as follows: S −11.04 > Fe −5.17 > Mg −3.19 > K −0.85 > N −0.70 > Cu −0.59 > P −0.56 > Ca 0.338 > B 3.47 > Zn 5.23 > Mn 13.07.
The DRIS index for zinc and manganese were 5.23 and 13.07, showed greater quantity of respective nutrients in tomato index tissue. This may be due to more response to fertilizer application. DRIS indices identified sulfur −11.04 as the most deficient nutrient in the tomato crop in this study. However, N, P, and K may also deficient when sulfur is applied. Commercial growers may consult the established norms on plant nutrients to optimize plant nutrition in field crop for high yield.
Acknowledgement: The authors extend their appreciation to Taif University for supporting current work by Taif University Researchers Supporting Project No. (TURSP–2020/288), Taif University, Taif, Saudi Arabia.
Data Availability Statement: The data presented in this study are available on request from the corresponding author.
Authorship: The authors confirm contribution to the paper as follows: study conception and design: R. M.; M. S. A.; K. S. K., T. R.; data collection: R. M.; analysis and interpretation of results: R. M., M. S. A., K. S. K., M. I. A. R., C. R., A. E. S; draft manuscript preparation: R. M., T. R; M. I. A. R; M. K. R; N. Z., F. M. A; Review, editing: M. I. A. R., N. M. A.; N. A. K.; M. A., A. S. A., J. A. L.; M. A. R., A. E. S. All authors reviewed the results and approved the final version of the manuscript. All authors reviewed the results and approved the final version of the manuscript.
Funding Statement: TURSP–(2020/288), Taif University, Taif, Saudi Arabia.
Conflicts of Interest: The authors declare that they have no conflicts of interest to report regarding the present study.
References
1. Vats, S., Bansal, R., Rana, N., Kumawat, S., Bhatt, V. et al. (2022). Unexplored nutritive potential of tomato to combat global malnutrition. Critical Reviews in Food Science and Nutrition, 62(4), 1003–1034. [Google Scholar]
2. Vélez-Terreros, P. Y., Romero-Estévez, D., Yánez-Jácome, G. S., Simbaña-Farinango, K., Navarrete, H. (2021). Comparison of major nutrients and minerals between organic and conventional tomatoes. A review. Journal of Food Composition and Analysis, 100, 103922. [Google Scholar]
3. Souri, M. K., Dehnavard, S. (2018). Tomato plant growth, leaf nutrient concentrations and fruit quality under nitrogen foliar applications. Advances in Horticultural Science, 32(1), 41–47. [Google Scholar]
4. Dehnavard, S., Souri, M. K., Mardanlu, S. (2017). Tomato growth responses to foliar application of ammonium sulfate in hydroponic culture. Journal of Plant Nutrition, 40(3), 315–323. [Google Scholar]
5. Ramzan, H., Tahir, M., Abbas, A., Mehmood, G. (2020). Potassium nutrient management in wheat through 4R nutrient stewardship. Journal of Environmental and Agricultural Science, 22, 10–16. [Google Scholar]
6. Gallardo, M., Elia, A., Thompson, R. B. (2020). Decision support systems and models for aiding irrigation and nutrient management of vegetable crops. Agricultural Water Management, 240, 106209. [Google Scholar]
7. Ali, M. F., Ammar, A., Bilal, S., Ali, U., Huma, N. et al. (2021). Mitigating zinc deficiency in plants and soils through agronomic techniques: A review. Journal of Environmental and Agricultural Science, 23(1&2), 1–10. [Google Scholar]
8. Majeed, Y., Ziaf, K., Ghani, M. A., Ahmad, I., Ahmad, M. A. et al. (2020). Effect of different combinations of organic and synthetic sources of nutrients on growth, yield and quality parameters of turmeric under Faisalabad conditions. Journal of Environmental and Agricultural Science, 22, 1–7. [Google Scholar]
9. Maillard, A., Diquélou, S., Billard, V., Laîné, P., Garnica, M. (2015). Leaf mineral nutrient remobilization during leaf senescence and modulation by nutrient deficiency. Frontiers in Plant Science, 6, 317. [Google Scholar]
10. Vitousek, P. M., Naylor, R., Crews, T., David, M. B., Drinkwater, L. et al. (2009). Nutrient imbalances in agricultural development. Science, 324(5934), 1519–1520. [Google Scholar]
11. Römheld, V. (2012). Chapter 11–diagnosis of deficiency and toxicity of nutrients. In: Marschner, P. (Ed.Marschner’s mineral nutrition of higher plants (Third Editionpp. 299–312. San Diego: Academic Press. [Google Scholar]
12. Bangroo, S., Bhat, M., Ali, T., Aziz, M., Bhat, M. et al. (2010). Diagnosis and recommendation integrated system (DRIS) A review. International Journal of Current Research, 10, 84–97. [Google Scholar]
13. Mohammadipour, N., Souri, M. K. (2019). Effects of different levels of glycine in the nutrient solution on the growth, nutrient composition and antioxidant activity of coriander (Coriandrum sativum L.). Acta Agrobotanica, 72(1), 1759. DOI 10.5586/aa.1759. [Google Scholar] [CrossRef]
14. Souri, M. K., Naiji, M., Aslani, M. (2018). Effect of Fe-glycine aminochelate on Pod quality and iron concentrations of bean (Phaseolus vulgaris L.) under lime soil conditions. Communication in Soil Science and Plant Analysis, 49(2), 215–224. DOI 10.1080/00103624.2017.1421655. [Google Scholar] [CrossRef]
15. Naz, T., Iqbal, M. M., Tahir, M., Hassan, M. M., Rehmani, M. I. A. et al. (2021). Foliar application of potassium mitigates salinity stress conditions in spinach (Spinacia oleracea L.) through reducing NaCl toxicity and enhancing the activity of antioxidant enzymes. Horticulturae, 7(12), 566. [Google Scholar]
16. Plabon, M. E. A., Mondal, S. C., Rashid, M. M., Chowdhury, M. K., Saeid, A. et al. (2021). Chemical composition and anti-microbial activity of hog plum (Spondias mombin L.) peel oil extracted from different regions of tropical climates. Horticulturae, 7(11), 428. [Google Scholar]
17. Asghar, N., Aziz, A., Azhar M. F., Irfan, U. I., Rafiq, H. et al. (2022). Assessment of phytochemical analysis, nutritional composition and antimicrobial activity of Moringa oleifera. Phyton-International Journal of Experimental Botany, 91(8), 1817–1829. DOI 10.32604/phyton.2022.020790. [Google Scholar] [CrossRef]
18. Dar, J. S., Cheema, M. A., Rehmani, M. I. A., Khuhro, S., Rajput, S. et al. (2021). Potassium fertilization improves growth, yield and seed quality of sunflower (Helianthus annuus L.) under drought stress at different growth stages. PLoS One, 16, e0256075. DOI 10.1371/journal.pone.0256075. [Google Scholar] [CrossRef]
19. Ata-Ul-Karim, S. T., Zhu, Y., Cao, Q., Rehmani, M. I. A., Cao, W. et al. (2017). In-season assessment of grain protein and amylose content in rice using critical nitrogen dilution curve. European Journal Agronomy, 90, 139–151. DOI 10.1016/j.eja.2017.08.001. [Google Scholar] [CrossRef]
20. Ahmad, N., Virk, A. L., Hussain, S., Hafeez, M. B., Haider, F. et al. (2022). Integrated application of plant bioregulator and micronutrients improves crop physiology, productivity and grain biofortification of delayed sown wheat. Environmental Science and Pollution Research. DOI 10.1007/s11356-022-19476-5. [Google Scholar] [CrossRef]
21. Barbedo, J. G. A. (2019). Detection of nutrition deficiencies in plants using proximal images and machine learning: A review. Computer and Electronics in Agriculture, 162, 482–492. DOI 10.1016/j.compag.2019.04.035. [Google Scholar] [CrossRef]
22. Dar, J. S., Pushpa, M. I. A. R., Abbassi, Z. A., Magsi, A. G. (2016). Effect of starter nitrogen on yield and yield components of chickpea (Cicer arietinum L.) at Dokri, Larkana. Pure Applied Biology, 5, 1296–1303. DOI 10.19045/bspab. [Google Scholar] [CrossRef]
23. Ata-Ul-Karim, S. T., Cao, Q., Zhu, Y., Tang, L., Rehmani, M. I. A. et al. (2016). Non-destructive assessment of plant nitrogen parameters using leaf chlorophyll measurements in rice. Frontiers in Plant Science, 7, 1829. DOI 10.3389/fpls.2016.01829. [Google Scholar] [CrossRef]
24. Llanderal, A., Lao, M. T., Contreras, J. I., Segura, M. L. (2018). Diagnosis and recommendation integrated system norms and suffi-ciency ranges for tomato greenhouse in Mediterranean climate. Hort Science, 53(4), 479–482. [Google Scholar]
25. Abbas, Z. G., Abbas, J., Hussain, T., Mehmood, M., Amer, S. et al. (2021). Foliar application of phosphorous, zinc, and boron enhances cotton production. Journal of Environmental and Agricultural Science, 23(3&4), 1–7. [Google Scholar]
26. Sattar, B., Ahmad, S., Daur, I., Hussain, M. B., Ali, M. et al. (2021). Bioactive-sulfur coated diammonium phosphate improves nitrogen and phosphorus use efficiency and maize (Zea mays L.) yield. Journal of Environmental and Agricultural Science, 23(3&4), 23–29. [Google Scholar]
27. Bethlenfalvay, G. J., Franson, R. L., Brown, M. S. (1990). Nutrition of mycorrhizal soybean evaluatedby the diagnosis and recommendation system (DRIS). Agronomy Journal, 82(2), 302–304 DOI 10.2134/agronj1990.00021962008200020025x. [Google Scholar] [CrossRef]
28. Villaseñor, D., Prado, R. M., Pereira da Silva, G., Carrillo, M., Durango, W. (2020). DRIS norms and limiting nutrients in banana cultivation in the south of Ecuador. Journal of Plant Nutrition, 43, 2785–2796. DOI 10.1080/01904167.2020.1793183. [Google Scholar] [CrossRef]
29. Savita, S., Krishnappa, R., Ngangom, B., Devi, M. T., Mishra, G. et al. (2016). Diagnosis and recommendation integrated system (DRIS) approach on nutritional diagnosis in fruit crops—A review. Journal of Applied Natural Science, 8(4), 2337–2345. DOI 10.31018/jans.v8i4.1134. [Google Scholar] [CrossRef]
30. Beaufils, E. (1971). Physiological diagnosis-a guide for improving maize production based on principles developed for rubber trees. Journal of Fertilizer Society of South Africa, 1, 1–30. [Google Scholar]
31. Li, J. C., Li, X. X., Peng, J. C., Zhang, G. Q. (1999). Effect of five mineral elements on nutritional state of naval orange tree. Journal of Hunan Agricultural University, 25(1), 36–39. [Google Scholar]
32. Ramakrishna, A., Bailey, J., Kirchhof, G. (2009). A preliminary diagnosis and recommendation integrated system (DRIS) model for diagnosing the nutrient status of sweet potato (Ipomoea batatas). Plant and Soil, 316, 107–116. DOI 10.1007/s11104-008-9763-5. [Google Scholar] [CrossRef]
33. Moreno, J., Lucena, J., Carpena, O. (1996). Effect of the iron supply on the nutrition of different citrus variety/rootstock combinations using DRIS. Journal of Plant Nutrition, 19(5), 689–704. DOI 10.1080/01904169609365153. [Google Scholar] [CrossRef]
34. El-Rheem, K. M. A., Khaled, S. M., Zaghoul, S. M. (2012). Preliminary DRIS norms for evaluating the nutritional statue of sweet pepper crop. Australian Journal of Basic and Applied Sciences, 6(8), 661–664. [Google Scholar]
35. Talpur, N. (2015). Evaluating the DRIS norms for wheat belt of district hyderabad. Pakistan Journal of Agricultural Science, 52(3), 767–774. [Google Scholar]
36. Arain, M., Memon, K., Akhtar, M., Memon, M. (2017). Soil and plant nutrient status and spatial variability for sugarcane in lower sindh (Pakistan). Pakistan Journal of Botany, 49(2), 531–540. [Google Scholar]
37. Munter, R. C., Grande, R. A. (1981). Plant tissue and soil extract analysis by ICP-atomic emission spectrometry. In: Byrnes, R. M. (Ed.Developments in atomic plasma spectrochemical analysis, pp. 653–672. London, UK: Heyden. [Google Scholar]
38. Fassel, V. A., Kniseley, R. N., (1974). Inductively coupled plasma. optical emission spectroscopy. Analytical Chemistry, 46, 1110a–1120a. [Google Scholar]
39. Simonne, E. H., Mills, H. A., Jones Jr, J. B., Smittle, D. A., Hussey, C. G. (1994). A comparison of analytical methods for nitrogen analysis in plant tissues. Communication in Soil Science and Plant Analysis, 25(7–8), 943–954. DOI 10.1080/00103629409369090. [Google Scholar] [CrossRef]
40. Matejovic, I. (1995). Total nitrogen in plant material determinated by means of dry combustion: A possible alternative to determination by kjeldahl digestion. Communication in Soil Science and Plant Analysis, 26(13–14), 2217–2229. DOI 10.1080/00103629509369441. [Google Scholar] [CrossRef]
41. Walworth, J., Sumner, M. (1987). The diagnosis and recommendation integrated system (DRIS). In: Stewart, B. A., Advances in soil science, pp. 149–188. New York: Springer. [Google Scholar]
42. Ulukapi, K., Sener, S. (2016). Effect of organic fertilizer containing mint and thyme oil extract on tomato seedling growing. International Journal of Engineering Research and Applications, 6(12), 43–49. [Google Scholar]
43. Jones, Jr, J. B. (2005). Hydroponics: A practical guide for the soilless grower, 2nd Ed., FL, USA: CRC Press Boca Raton. [Google Scholar]
44. Bryson, G. M., Barker, A. V. (2007). Effect of nitrogen fertilizers on zinc accumulation in fescue. Communication in Soil Science and Plant Analysis, 38(1–2), 217–228. DOI 10.1080/00103620601094171. [Google Scholar] [CrossRef]
45. Sanchez, C. (2007). Phosphorus. In: Barker, A. V., Pilbeam, D. J. (Eds.Handbook of plant nutrition, pp. 51–90. Boca Raton, USA: CRC Press. [Google Scholar]
46. Juárez-Maldonado, A., De-Alba-Romenus, K., Morales-Díaz, A. B., Benavides-Mendoza, A. J. (2017). Macro-nutrient uptake dynamics in greenhouse tomato crop. Journal of Plant Nutrition, 40(13), 1908–1919. DOI 10.1080/01904167.2016.1270310. [Google Scholar] [CrossRef]
47. Barker, A. V., Pilbeam, D. J. (2015). Handbook of plant nutrition, pp. 98–101. Boca Raton, USA: CRC press. [Google Scholar]
48. Pilbeam, D. J., Barker, A. V. (2007). Handbook of plant nutrition, pp. 41–49. Boca Raton, USA: CRC Press. [Google Scholar]
49. Quesada-Roldán, G., Bertsch-Hernández, F. (2013). Obtaining of the absorption curve for the FB-17 tomato hybrid. Terra Latinoam, 31(1), 1–7. [Google Scholar]
50. Memon, M., Jamro, G. M., Memon, N. U. N., Memon, K. S., Akhtar, M. S. (2012). Micronutrient availability assessment of tomato grown in taluka badin, sindh. Pakistan Journal of Botany, 44(2), 649–654. [Google Scholar]
51. Mousavi, S. R., Galavi, M., Rezaei, M. (2012). The interaction of zinc with other elements in plants: A review. International of Agriculture and Crop Science, 4, 1881–1884. [Google Scholar]
52. Mayfield, J. L., Simonne, E. H., Mitchell, C. C., Sibley, J. L., Boozer, R. T. et al. (2002). Effect of current fertilization prac-tices on nutritional status of double-cropped tomato and cucumber produced with plasticulture. Journal of Plant Nutrition, 25(1), 1–15. DOI 10.1081/PLN-100108776. [Google Scholar] [CrossRef]
53. de Rouin, N., Caron, J., Parent, L. E. (1988). Influence of some artificial substrates on productivity and DRIS diagnosis of greenhouse tomatoes (Lycopersicon esculentum L. Mill., cv “Vedettos”). Acta Horticulturae, 221, 45–52. [Google Scholar]
54. Chao, T. T., Harward, M., Fang, S. (1962). Soil constituents and properties in the adsorption of sulfate ions. Soil Science Society of America, 94, 276–283. DOI 10.1097/00010694-196211000-00002. [Google Scholar] [CrossRef]
55. Khan, N., Mobin, M. (2005). The influence of gibberellic acid and sulfur fertilization rate on growth and S-use efficiency of mustard (Brassica juncea). Plant and Soil, 270, 269–274. DOI 10.1007/s11104-004-1606-4. [Google Scholar] [CrossRef]
56. Ahmad, N., Saleem, M., Rashid, M., Jalil, A. (1994). Sulfur status and crop response in Pakistan soils. In: Planning and development division, Islamabad, pp. 1–5. Pakistan: National Fertilizer Development Centre. [Google Scholar]
57. Malik, K. M., Khan, K. S., Akhtar, M. S. (2020). Sulfur distribution and availability in alkaline subtropical soils affected by organic amendments. Journal of Soil Science and Plant Nutrition, 20, 2253–2266. DOI 10.1007/s42729-020-00292-0. [Google Scholar] [CrossRef]
58. Rashid, A., Din, J. (1992). Differential susceptibility of chickpea cultivars to iron chlorosis grown on calcareous soils of Pakistan. Journal of the Indian Society of Soil Science, 40, 488–492. [Google Scholar]
59. Rashid, A. (1996). Soils: Basic concepts and principles. Islamabad, Pakistan: National Book Foundation. [Google Scholar]
60. Kaplan, M. J. (1999). Accumulation of copper in soils and leaves of tomato plants in greenhouses in Turkey. Journal of Plant Nutrition, 2(22), 237–244. DOI 10.1080/01904169909365622. [Google Scholar] [CrossRef]
61. Rafique, E., Rashid, A., Hassan, M. (2012). Value of soil zinc balances in predicting fertilizer zinc requirement for cotton-wheat cropping system in irrigated aridisols. Plant and Soil, 361(1), 43–55. DOI 10.1007/s11104-012-1434-x. [Google Scholar] [CrossRef]
62. Adams, P. (1986). Mineral Nutrition. In: Atherton, J. G., Rudich, J. (EdsThe tomato crop, pp. 281–334. New York: Springer. [Google Scholar]
63. Shaheen, A., Shafiq, M., Naeem, M. A., Jilani, G. J. (2008). Soil characteristics and plant nutrient status in the eroded lands of Fatehjang in the Pothwar plateau of Pakistan. Soil and Environment, 27(2), 208–214. [Google Scholar]
Cite This Article
 Copyright © 2022 The Author(s). Published by Tech Science Press.
This work is licensed under a Creative Commons Attribution 4.0 International License , which permits unrestricted use, distribution, and reproduction in any medium, provided the original work is properly cited.
 Downloads
 Citation Tools