
 Submit a Paper
 Propose a Special lssue
 Open Access
ARTICLE
Breeding Enrichment of Genetic Variation of Grain Yield and Its Attributes in Bread Wheat under Drought Stress and Well Irrigation
1 Wheat Research Department, Agricultural Research Center, Giza, 12619, Egypt
2 Agronomy Department, Faculty of Agriculture, Zagazig University, Zagazig, 44519, Egypt
* Corresponding Authors: Mohammed Ali. Email: ,
(This article belongs to the Special Issue: Integrating Agronomy and Plant Physiology for Improving Crop Production)
Phyton-International Journal of Experimental Botany 2022, 91(12), 2699-2717. https://doi.org/10.32604/phyton.2022.022651
Received 18 March 2022; Accepted 19 April 2022; Issue published 29 August 2022
 View Full Text
 Download PDF
Abstract
Drought stress (DS) is one of the most critical environmental abiotic stresses for wheat production in the arid environments. Selection of high-yielding genotypes tolerant to DS can play a significant role in mitigation the negative impacts associated with DS. In the present study, generation means analysis (GMA) was used to study the performance of two crosses under well irrigation (WI) and deficit irrigation [cross I (Line 44 × Shandweel-1) and cross II (Line 20 × Sakha 93)]. Significant differences were observed for days to heading (DH), days to maturity (DM), plant height (PH), spike length (SL), number of spikes per plant (NS/P), number of grains per spike (NG/S), thousand-grain weight (TGW), grain yield per plant (GY/P), and proline content (PC) in the six populations of the two crosses within each irrigation level. Cross II had early maturity and the highest PC, NS/P, TGW, and GY/P regardless of the irrigation level. Cross I showed positive significant relative heterosis and heterobeltiosis for GY/P under the two irrigation levels. The inheritance of characters of cross I revealed additive, dominant, and epistatic effects, which varied with trait and stress. Additive genetic effects predominated in DH, SL, and PC, while non- additive were found in DM, NS/P, NG/S, and GY/P. Narrow-sense heritability estimates (h2n) were high for DH and PC, moderate to high for PH and SL, moderate for DM, NG/S, NS/P, and TGW, and low for GY/P. Based on different drought indices the populations BC1, BC2, F1, and P1 of cross II and BC1 of cross I were more tolerant to drought stress. Therefore, PC, TGW and DH can be used as selection indicators to improve wheat for drought tolerance in early generations and other yield components traits in late generations. The second cross (Line 20 × Sakha 93) shows promise and is of interest to a drought tolerance breeding program, where wheat breeders can use recombinant breeding strategies to construct desirable drought stress genes. Correlation and path coefficient revealed that TGW and PC were the main contributor in grain yield in both environments.Keywords
Supplementary Material
Supplementary Material FileBread wheat (Triticum aestivum L.) is the main cultivated cereal crop in the Mediterranean region, which is the major source of carbohydrate, protein, and amino acids to most peoples. The strategic crop is planted over large areas with global production of about 766 million tonnes per annum [1]. About 20%–25% of areas planted to wheat globally are exposed to drought [2]. Moreover, in the developing world drought reduces yields of wheat by 50%–90% of their optimal irrigated depending on the growth stage [3]. In the semiarid and arid regions, drought stress is the main challenge limiting the productivity of wheat [4,5]. Wheat is drought-sensitive crop, such that limits the potential of its production in water scarce environments with detrimental impacts on grain yield quantity and quality [6]. Thus, producing high yielding and drought tolerant varieties escalates as a topic of interest for plant breeders and agronomists particularly in the arid environments. Ali et al. [7] had produced superior performance wheat genotypes for grain yield under drought-stressed conditions.
Drought is the highest devastating abiotic stress worldwide [8–10]. Where drought is mainly effect on development and all plant growth phases include the final grain yield [11,12]. Water deficit at post-anthesis showed negative effect on filling rates and development of wheat grains, it negatively affected leaf senescence and grain yield [13]. Drought at earlier anthesis exhibited negative effects on the kernel setting and drought can lead to a decrease in the TGW [7].
For genetic improvement, understanding the gene action types controlling various plant traits (physiological, morphological, and agronomic-targeted characters) are the main principle for planning a suitable wheat breeding program [14,15]. Quantitative characters inheritance was affected by the multiple genes action with small distinct effects, it is defined as a moving goal because these characters had genotype × environment interaction and between genes [16]. The biometrical statistical model of genetics was developed to explore the inheritance of such types. Generation means analysis (GMA) is an advantageous model to estimate gene effects, variance components, and heritability in usual traits [17], and it is a relatively simple and statistically dependable tool suitable for the major estimation of different genetic impacts [18]. The GMA assistance to identify the performance of selected wheat parents and the potential of the inducing population to employ heterosis exploitation or pedigree selection [19]. Subsequently, knowing the quantitative traits inheritance and gene action information are necessary for increasing effective breeding strategies. In addition, the GMA is a simple and useful model to estimate additive (d) and dominance (h) and digenic interactions (d × d, d × h, and h × h). Thus, the GMA method helps plant breeders to select the best relative breeding strategy to improve plant characters [18,20].
The present investigation aimed to select the high-yielding wheat genotypes under drought stress (DS) and well irrigation (WI). Investigate the types of gene action, heritability, mean performance, and heterosis for DH, MD, PH, SL, NS/P, NG/S, TGW, GY/P, and PC by using the GMA model, as to examine the related changes under WI and DS conditions by drought indices.
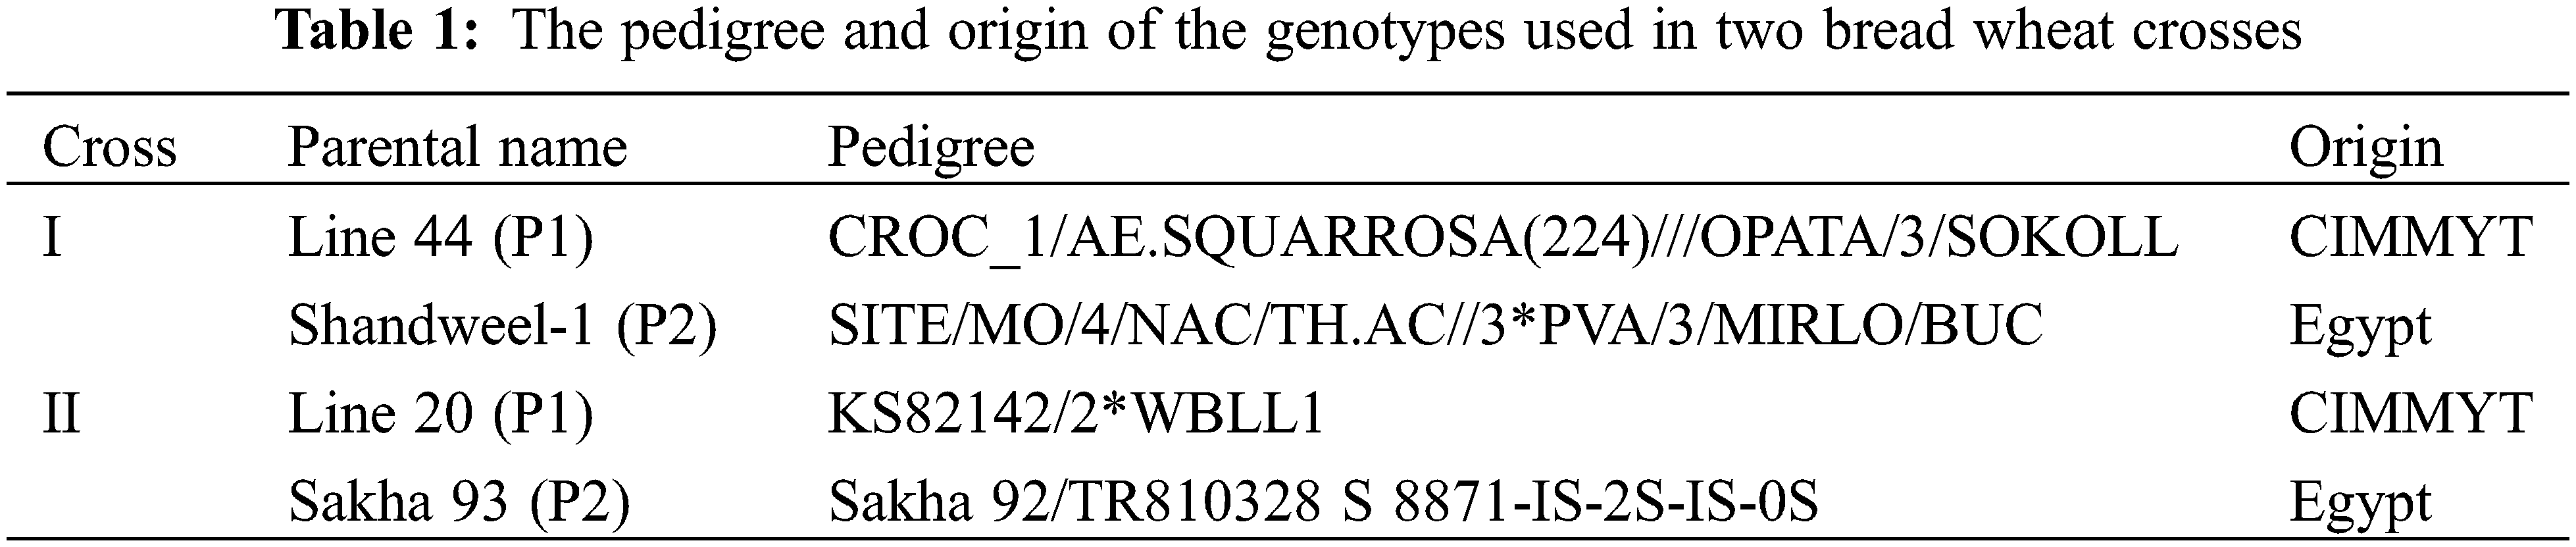
Two bread wheat crosses (Line 44 × Shandweel-1) and (Line 20 × Sakha 93) were selected in season 2015/2016 from 15 F1 crosses for maturity and grain yield traits under full irrigation and deficit irrigation. These crosses were derived from four diverse parental genotypes, i.e., two exotic genotypes and two commercially adopted cultivars (Table 1).
2.2 Experimental Site and Experimental Design
This research was carried out at the farm of Kafer El-Hamam Agriculture Station (30°37′02.9″N, 31°30′46.1″E), ARC, Egypt, during two growing seasons. In the first season (2017/2018), the two wheat crosses and their parents were sown under well irrigation (WI) and drought stress (DS) environments in three replicates to get sufficient kernels for evaluation in the next year. Each plot had ten rows (4 rows for each of P1 and P2 and two rows for F1). The length of rows was 2 m, with 30 cm apart between rows and 10 cm between plants within row. Self-pollination was made for F1 plants of each cross to obtain on F2 and backcrossed to their parents to obtain BC1 and BC2 populations. At the same time, pair F1 crosses were made to produce more seeds.
In the second season (2018/2019), the six wheat populations (P1, P2, F1, F2, BC1, and BC2) of the two wheat crosses were sown in a strip-plot design in three replicates. The wheat genotypes were distributed randomly in the vertical plots, while irrigation treatments were assigned in the horizontal plots. The area of the plot was 19.8 m2, where the six populations of each wheat cross were planted in 22 rows (2 for each of P1, and P2, 3 for F1, 4 for each of BC1 and BC2, and 7 for F2). The row length was 3 m, with 30 cm between rows and 10 cm from plant to plant in the same row.
Rice was the preceding crop and surface irrigation was used in the two seasons. Under full irrigation treatment 4405 m3 ha−1 of water were applied, experimental plots were irrigated immediately after seeds sowing, followed by four irrigation events at the main growth stages (tillering, jointing, flowering, and grain filling). Whereas, under drought stress (DS) treatment 1976 m3 ha−1 of water were applied, only one irrigation was done at tillering stage and the irrigation was skipped after tillering to maturity stage. There was 6-m alley between full irrigation and deficit irrigation plots as a buffer zone. The N and P fertilizers were applied at the recommended rates in the study region (180 Kg N and 75 Kg P2 O5 ha−1). Nitrogen fertilizer was added in two doses, one-third dose of nitrogen (60 Kg N ha−1) worked into the soil during seedbed preparation, whereas the second dose of N was 120 kg N ha−1 and applied before tillering by using Ammonium Nitrate (33.5% N). Phosphorous fertilizer was applied in full dose into the soil as calcium superphosphate (15.5% P2O5) during seedbed preparation. Potassium fertilizer was not added because the experimental soil had adequate amounts of this mineral. All other cultural practices of wheat were applied as recommended. The chemical analyses and soil mechanical of the experimental site are given in Table S1. The monthly weather data during field trial seasons are shown in Table S2.
2.4 Selected Plants and Measured Traits
In each replicate ten competitive and guarded wheat plants for the P1, P2, and F1 (non-segregating populations), twenty plants for the BC1 and BC2 (backcrosses), and thirty plants for the F2 (segregating population) were selected of two crosses under both water treatments. The measured characters were days to heading (DH), days to maturity (DM), plant height (PH), spike length (SL), number of spikes per plant (NS/P), number of grains per spike (NG/S), 1000-grain weight (TGW), and grain yield per plant (GY/P) and proline content (PC). Free proline content was determined in the flag leaves at the grain filling stage following the method of Bates et al. [21].
The analysis of the data was performed in two steps, the first one was the ordinary analysis of mean square for testing the null hypothesis that there are no genotypic differences between the populations of F2, backcrosses, F1, and parents. When wheat genotypes showed significant differences in the first step, the second step was further performed to analyze the genetic assessment as described the following section.
The A, B, C, and D scaling tests were involved to test the presence/absence of non-allelic interactions according to Mather et al. [17]. In the absence of epistasis (non-allelic interactions), the simple genetic model mean (m), additive (d), and dominance (h) were estimated, whereas in the presence of non-allelic interaction, the six-parameter genetic model (m, d, h, d × d, d × h, and h × h) was performed to compute the interaction types as outlined by Jinks et al. [22]. In this analysis, estimates variances of phenotypic (VP), environmental (VE), genotypic (VG), additive (VD), and dominance (VH) from generation variances were calculated according to Wright [23], and degree of dominance and heritability in the narrow sense “h2n” was applied according to Hallauer [24]. The expected genetic gain from selection was estimated by the formula adopted by Allard [25]. Heterosis effects were computed based on the mid-parental and the better-parent according to Bhatt [26].
The following indices of drought susceptibility/tolerance were calculated for each generation: Stress susceptibility index (SSI) =
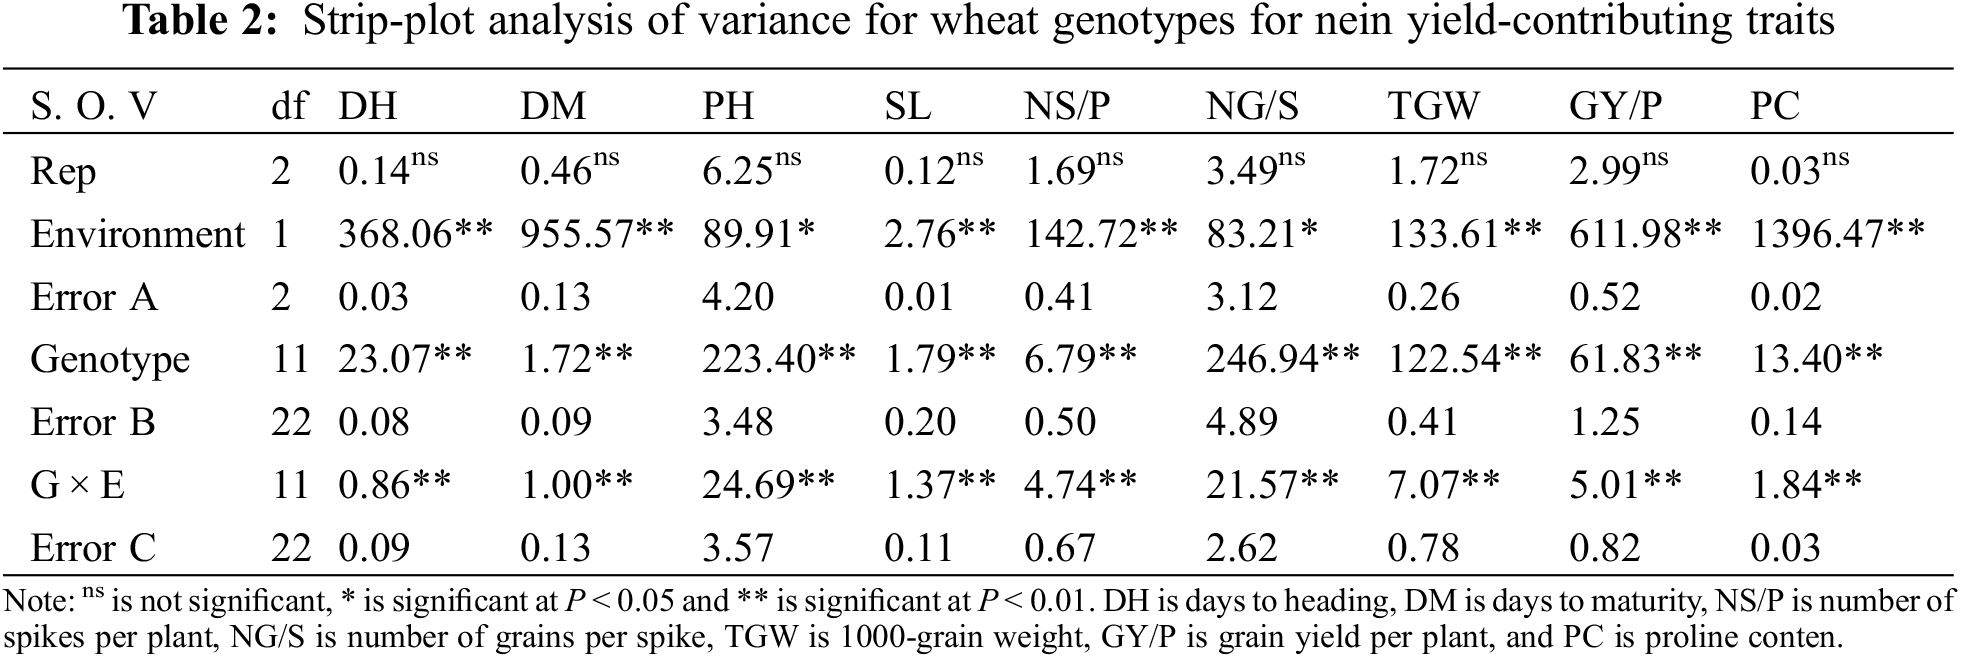
Analysis of variance revealed that mean squares due to wheat genotypes were highly significant among six populations (P1, P2, F1, F2, BC1, and BC2) in two wheat crosses for all studied traits (DH, DM, PH, SL, NS/P, NG/S, TGW, GY/P, and PC) under WI and DS environments (Table 2). The strip-plot analysis showed that the G × E interactions were highly significant for all traits, indicating substantial differences in the wheat population’s responses across water treatments. The differences among blocks were insignificant for all traits.
Days to heading and days to maturity decreased with water-stressed, thus reduction percentages were 5.6% and 4.4% for DH, and 4.58% and 4.63% in crosses I and II respectively compared with adequate water supply (Figs. 1 and S1). Means data indicated that the F1 means were earlier than both the parents for both earliness characters in the cross I under WI. While F1 was intermediate to their parents for DH and DM in cross II under WI and all crosses under DS. The segregating population (F2) means were more than the F1 means for DH and equal for DM in the two crosses under WI and DS. The means of segregating population (BC1) were equal or earlier than P1 in two crosses under WI and DS for DH and DM. While the means of segregating population (BC2) were equal or earlier than P2 in all crosses for two traits. Moreover, the means of BC2 were slightly earlier than the means of F1 for DH and DM in cross II under both WI and DS.
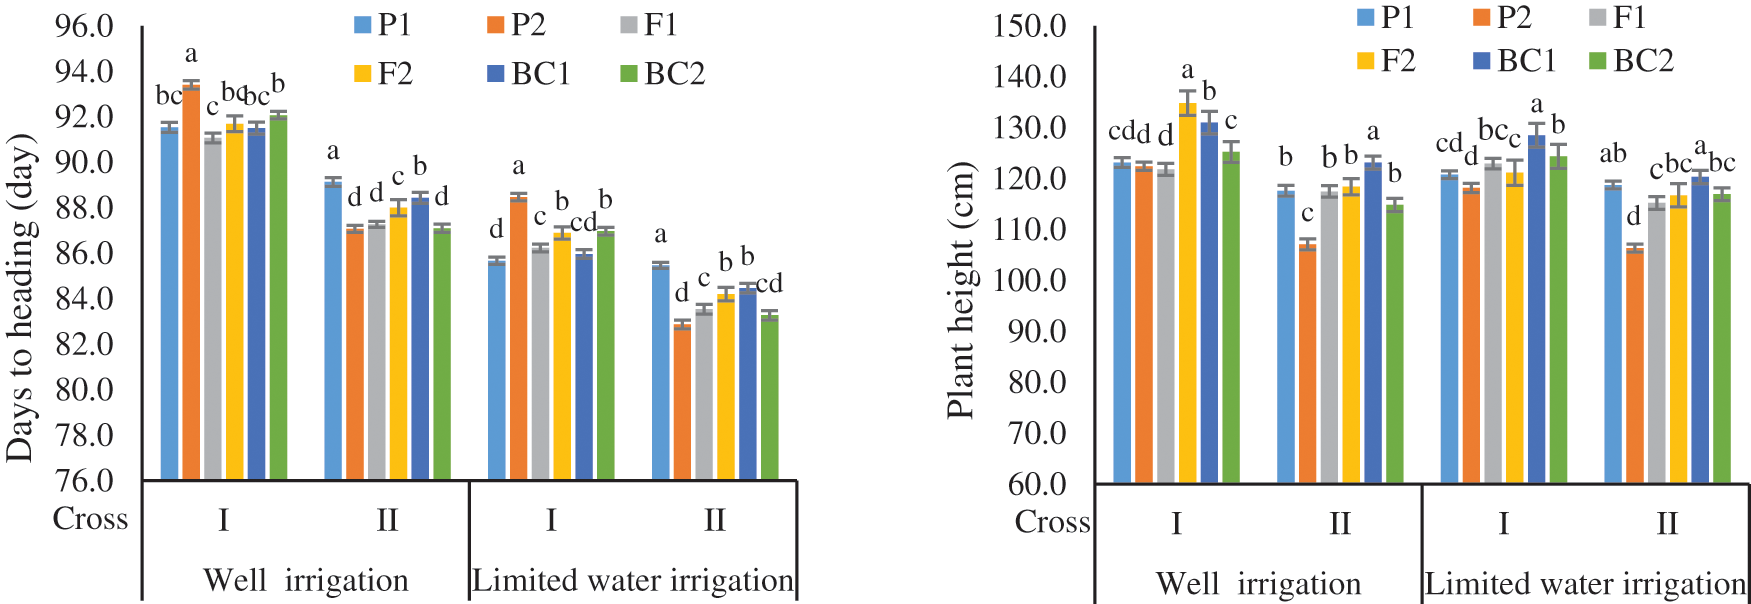
Figure 1: Mean of the six populations for days to heading and plant height in two wheat crosses under two water regimes
Plant height (PH) and spike length (SL) were reduced with drought stress by 2.97% and 0.61% for PH, and 3.77% and 2.09% in crosses I and II, respectively compared with adequate water supply. The F1 means were intermediate or more than both the parents for PH character in two crosses under both conditions. The segregating populations (F2, BC1, and BC2) means were more than the F1 ones for PH in the two crosses under both WI and DS. The means of BC1 and BC2 were equal or more than P1 and P2 in two crosses under WI and DS for PH and SL (Figs. 1 and S1). The F1 means were equal or more than the F2 for SL in two crosses under DS and inverses under WI.
Drought stress was reduced in all six populations for the number of spikes per plant (NS/P) by 29.2% and 13.7%, and the number of grains per spike (NG/S) by 4.5% and 2.2% in crosses I and II, respectively compared with adequate water supply. The P1 means were higher than P2, F1, and F2 in two crosses under WI for NS/P and NG/S. The F2 means were higher than F1 in two crosses under WI and DS in cross I for NS/P. The BC2 means were more than P2 and F1 in two crosses under WI and cross I under DS for NS/P. Moreover, the BC1 means were more than P1, F1, and F2 in both crosses under two water regimes for NG/S (Fig. S2).
The F1 means for the 1000-grain weight (TGW) was higher than P1, P2, F2, and BC1 in two crosses under DS, while it had intermediate values to both parents in the cross II under full irrigation. The F2 means were more than the F1 in cross I under optimal irrigation. The BC2 mean was more than the other five populations in two crosses under DS, as well as the BC1 and BC2 means were slightly higher than P2, F1, and F2 in cross II under WI (Fig. S3).
The F1 for grain yield per plant (GY/P) was more than the best parent in cross I under WI and all crosses under DS, indicating the presence of heterotic effects (Fig. 2). The F2 means were more than P1 in cross I under WI. While it was higher than P2 in the cross II under WI and two crosses under DS. The BC1 means were more than both parents in two crosses except cross I under WI. The BC2 means were more than P2 in two crosses under all environments and F1 in two crosses under WI and in cross I under DS.
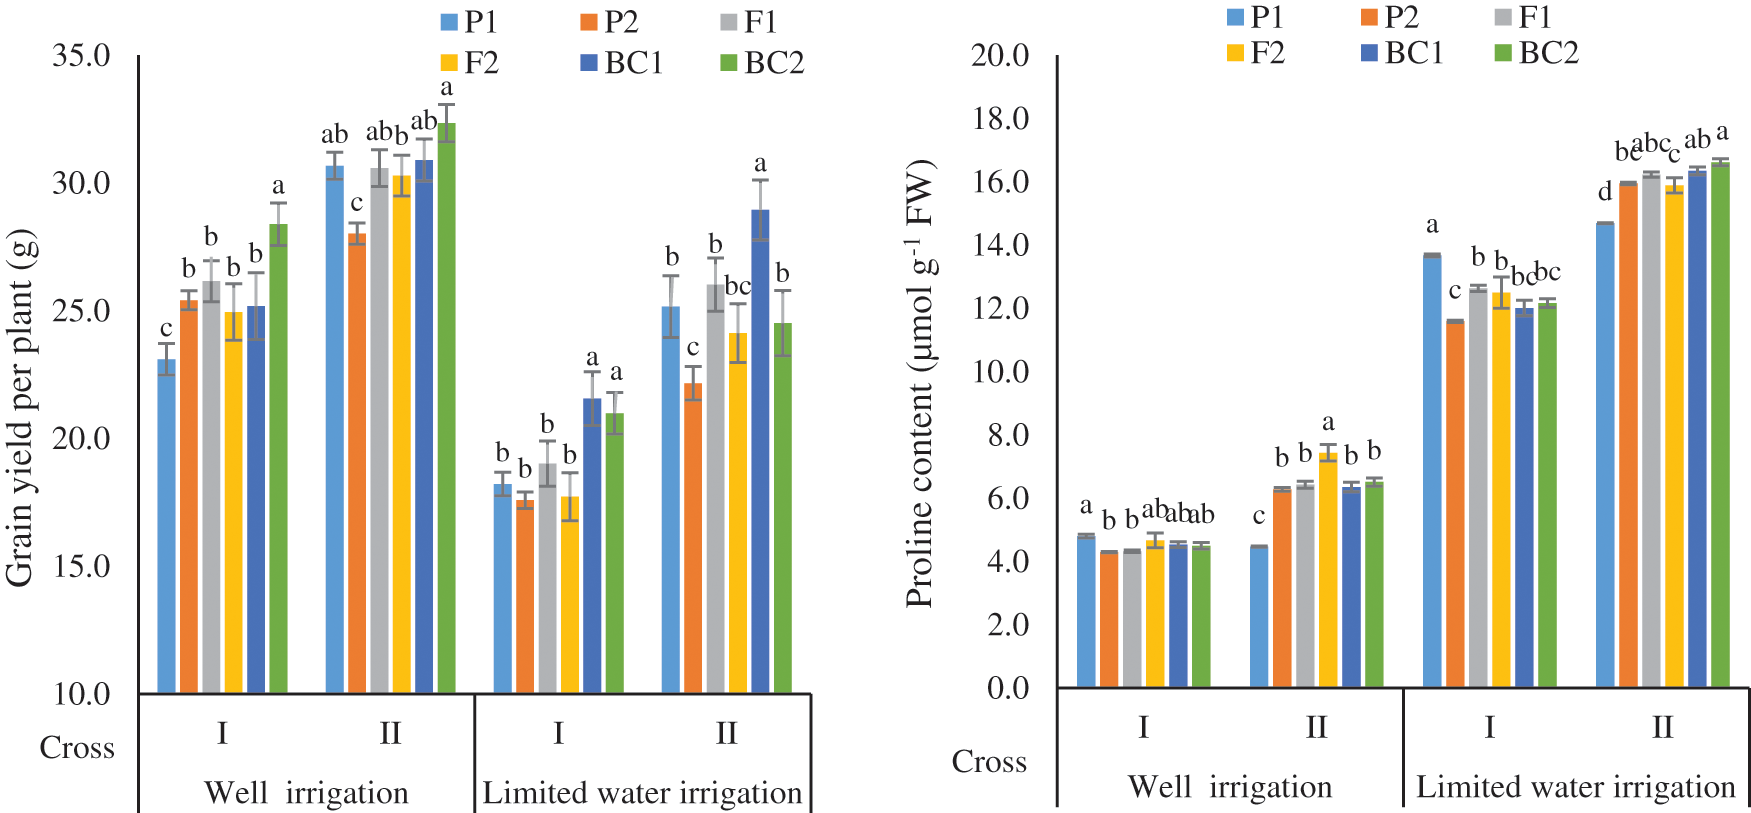
Figure 2: Mean of the six populations for grain yield per plant and proline content in two wheat crosses under two water regimes
For proline content (Fig. 2) the F1 means were intermediate to the parents in cross I and more to the parents in cross II under WI and DS, respectively. The F2 means were more than the F1 ones in all studied crosses under WI. The means of BC1 were more than the P1 and F1 in the cross II under DS. While the BC2 means were more than non-segregating generations in two crosses under WI and in cross II under DS.
3.3 Types of Gene Action and Heritability
Results of the scaling test (A, B, C, and D) exhibited insignificant values in the two crosses under both WI and DS for DH and TGW, as cross I under WI for PC, and two crosses under WI and cross I under DS for NS/P (Table 3). On contrary, the six-parameter model (complex) was fitted for explaining genetic variation for DM, PH, SL, and GY/P in two crosses under both water regimes. Also for PC in cross II under optimal irrigation and two crosses under DS, as well as for NG/S in cross I under WI and two crosses under DS.
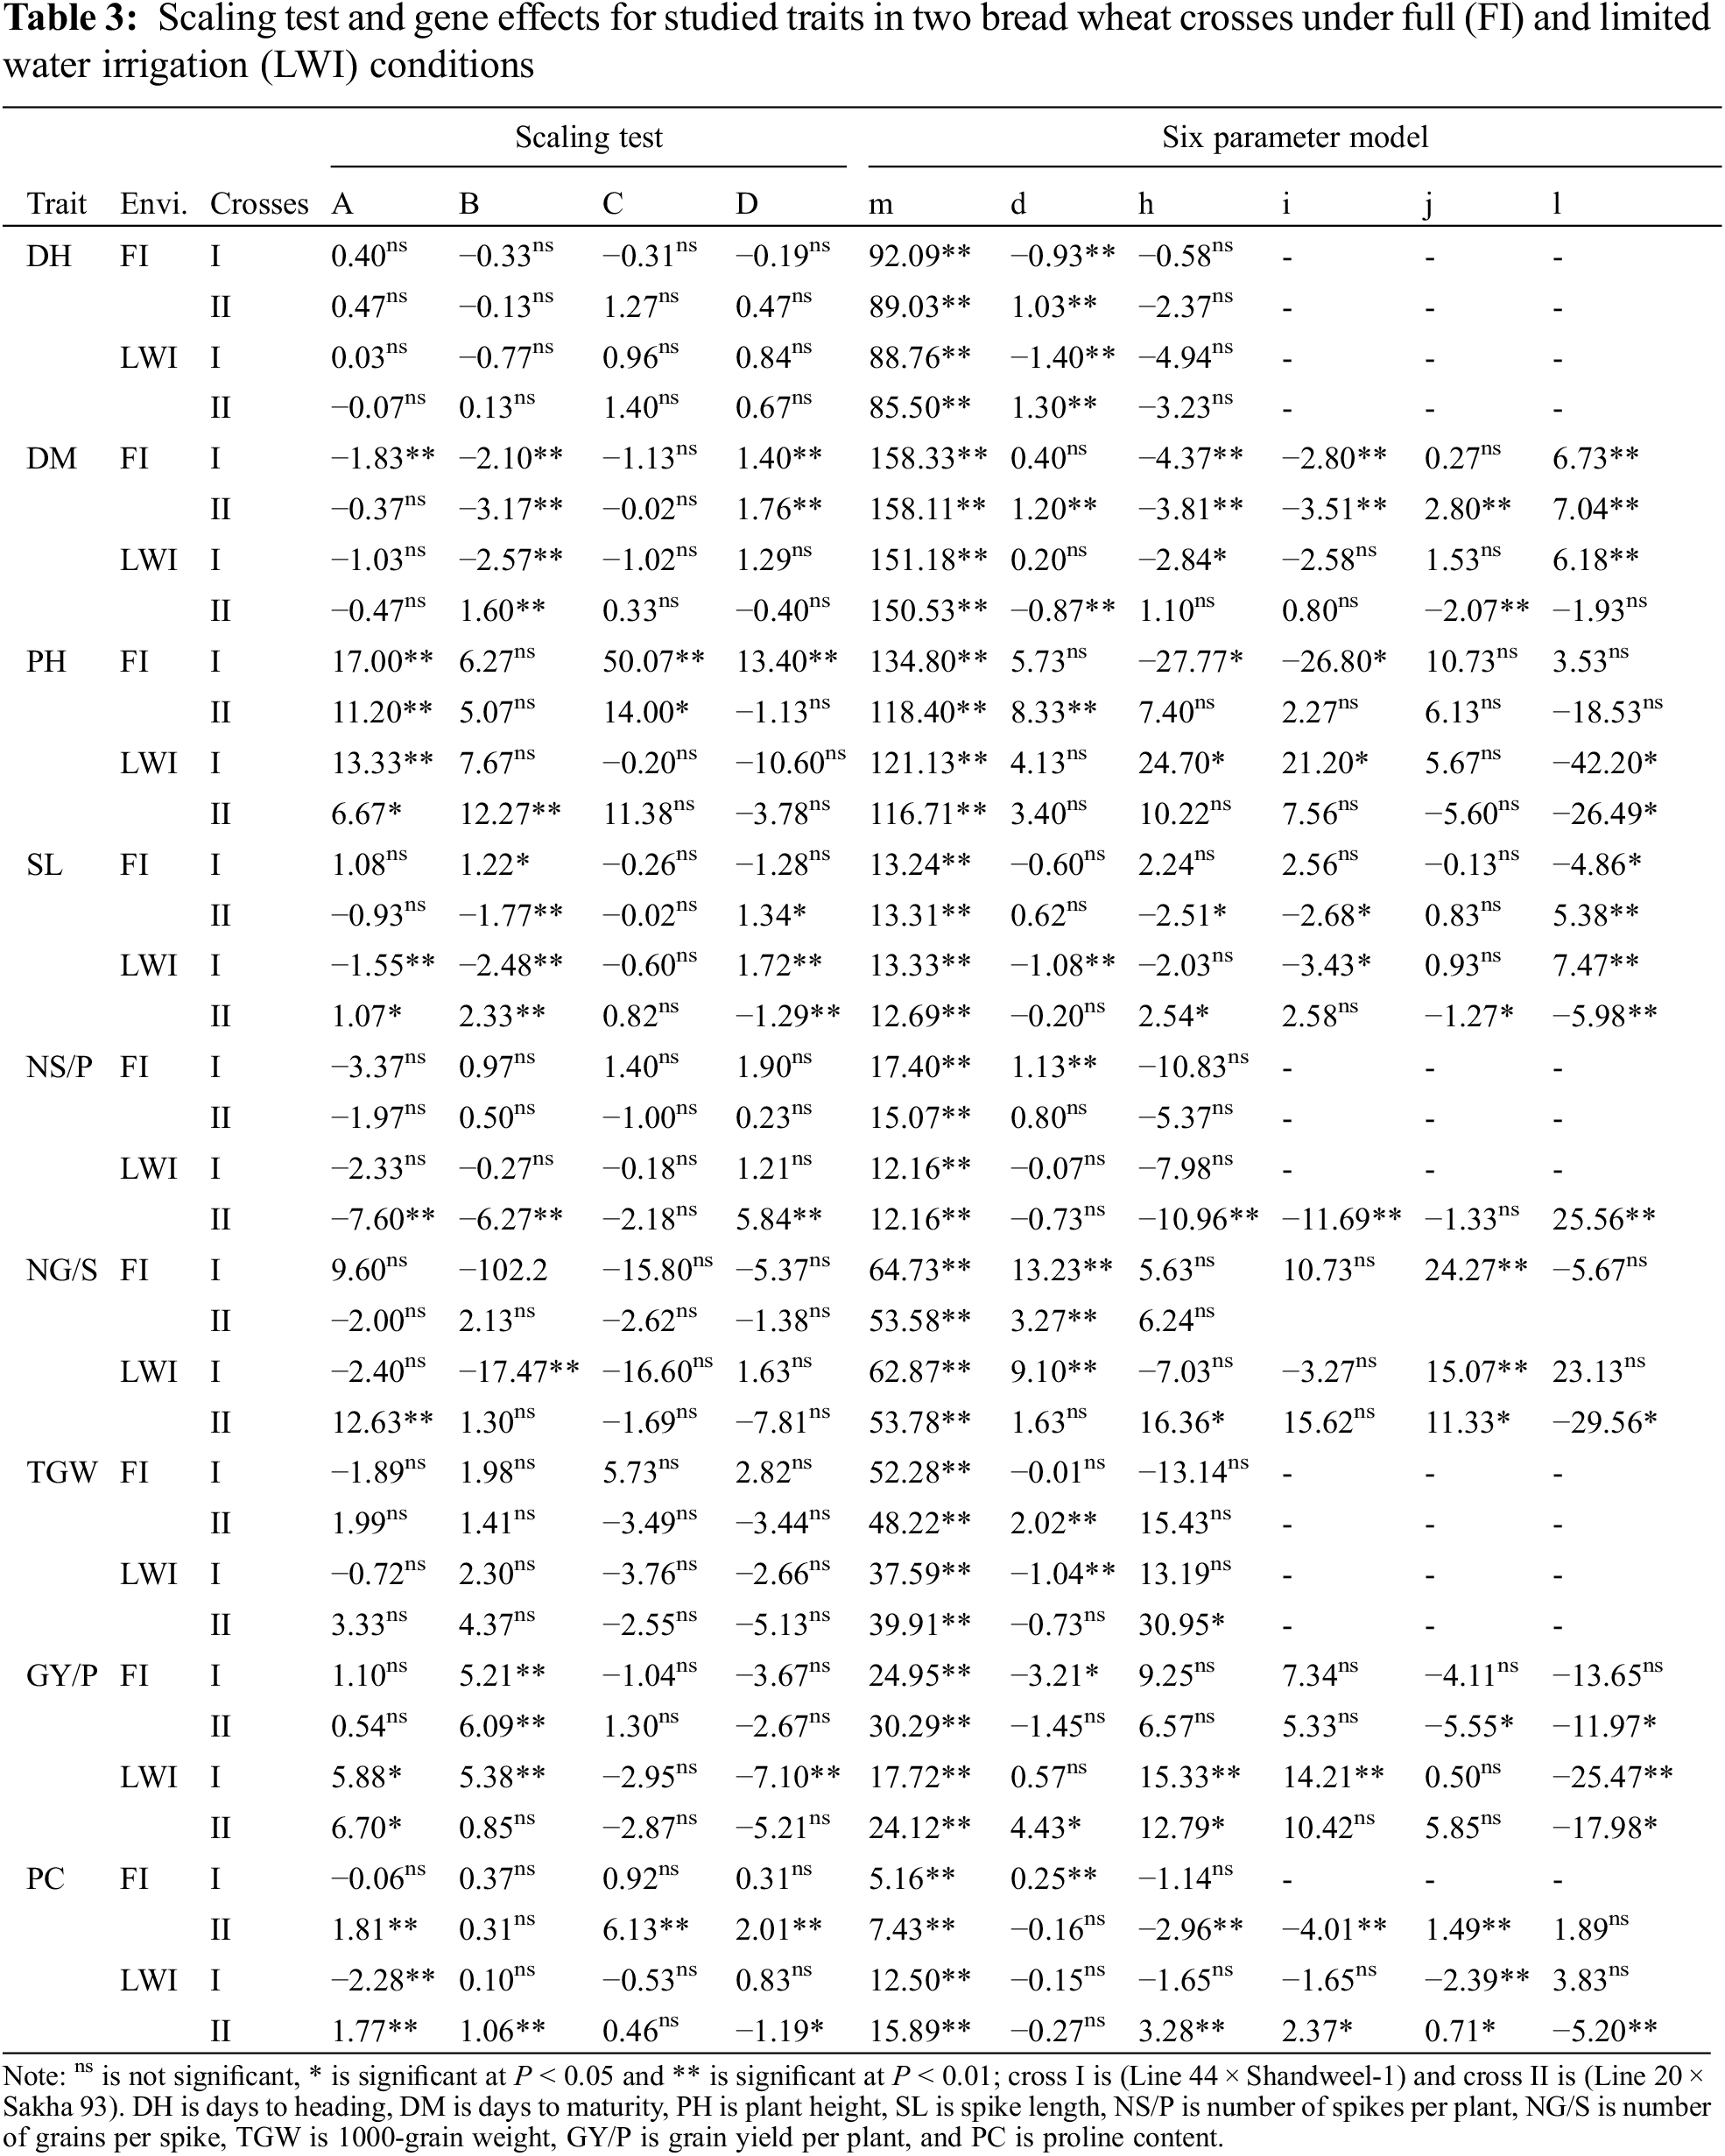
The mean (m) was highly significant for all studied characters in all crosses under optimal irrigation and DS conditions. The additive gene effects (d) were the main type controlling the inheritance of DH in cross I under FL and DS. Also, the additive gene action (d) effects were significantly negative in cross II for DM under DS.
The (d) effects were significantly positive in cross II for PH and TGW under WI and GY/P under DS, cross I for NS/P and PC under WI, and two crosses under WI for NG/S, also cross I under DS for NG/S. In contrast, (d) effects showed negative and significant values in cross I for SL and TGW under DS, and GY/P under WI. The dominance gene action (h) effects were negative and significant in two crosses for DM under WI and I under DS, cross I for PH under WI and cross II for NS/P and SL under DS. Meanwhile, positive and significant (h) effects were recorded in cross I for PH under DS, cross II for PC, NG/S, TGW, and GY/P under DS.
The additive × additive (i) effect was significant and negative in the two crosses for DM under WI, cross I for PH under WI, cross II for PC and SL under WI, and two crosses for SL under DS. Cross I showed positive and significant (i) effects for PH and GY/P under DS and cross II for PC under DS. Further, the additive × dominance (j) effect was significant and negative in cross II for DM under DS, cross I for PC under drought, and cross II for SL under DS and GY/P under WI. The wheat cross II showed positive and significant (j) effects for PC and NG/S under two environments and cross I for NG/S under DS.
The dominance × dominance (l) effect was significant and negative in the two crosses for PH and GY/P under DS, and cross II for SL, PC, and NG/S under DS. On the other hand, the two crosses showed positive and significant (l) effects for DM regardless of irrigation level, and cross II for NS/P under DS and SL under WI. Duplicate type of epistasis was detected since the dominance gene action (h) and its digenic interaction type dominance × dominance (l) effects were significant and had opposite signs in all crosses for DM under WI and GY/P under DS, and cross I for DM and PH under DS. Similarly, cross II for SL, PC, NS/P, and NG/S, under DS, and SL under WI.
3.4 Heritability, Genetic Advances, and Heterosis
High estimates of narrow-sense heritability (h2n) were recorded for DH in cross I (73.16% and 68.25%) and cross II (75.90% and 67.00%) under WI and DS, respectively. In addition, PC showed high h2n estimates under two environments for all crosses, it varied among 76.35% to 83.63% (Table 4). Moderate to high h2n estimates found for PH (41.09% to 79.50%) and SL (44.55% to 88.46%). Moderate estimates of narrow-sense heritability (h2n) were found for DM (45.31% to 60.11%), NS/P (28.08% to 56.08%), NG/S (38.95% to 59.39%) and TGW (37.66% to 58.38%). Low h2n estimates recorded to GY/P (24.3% to 37.25%).
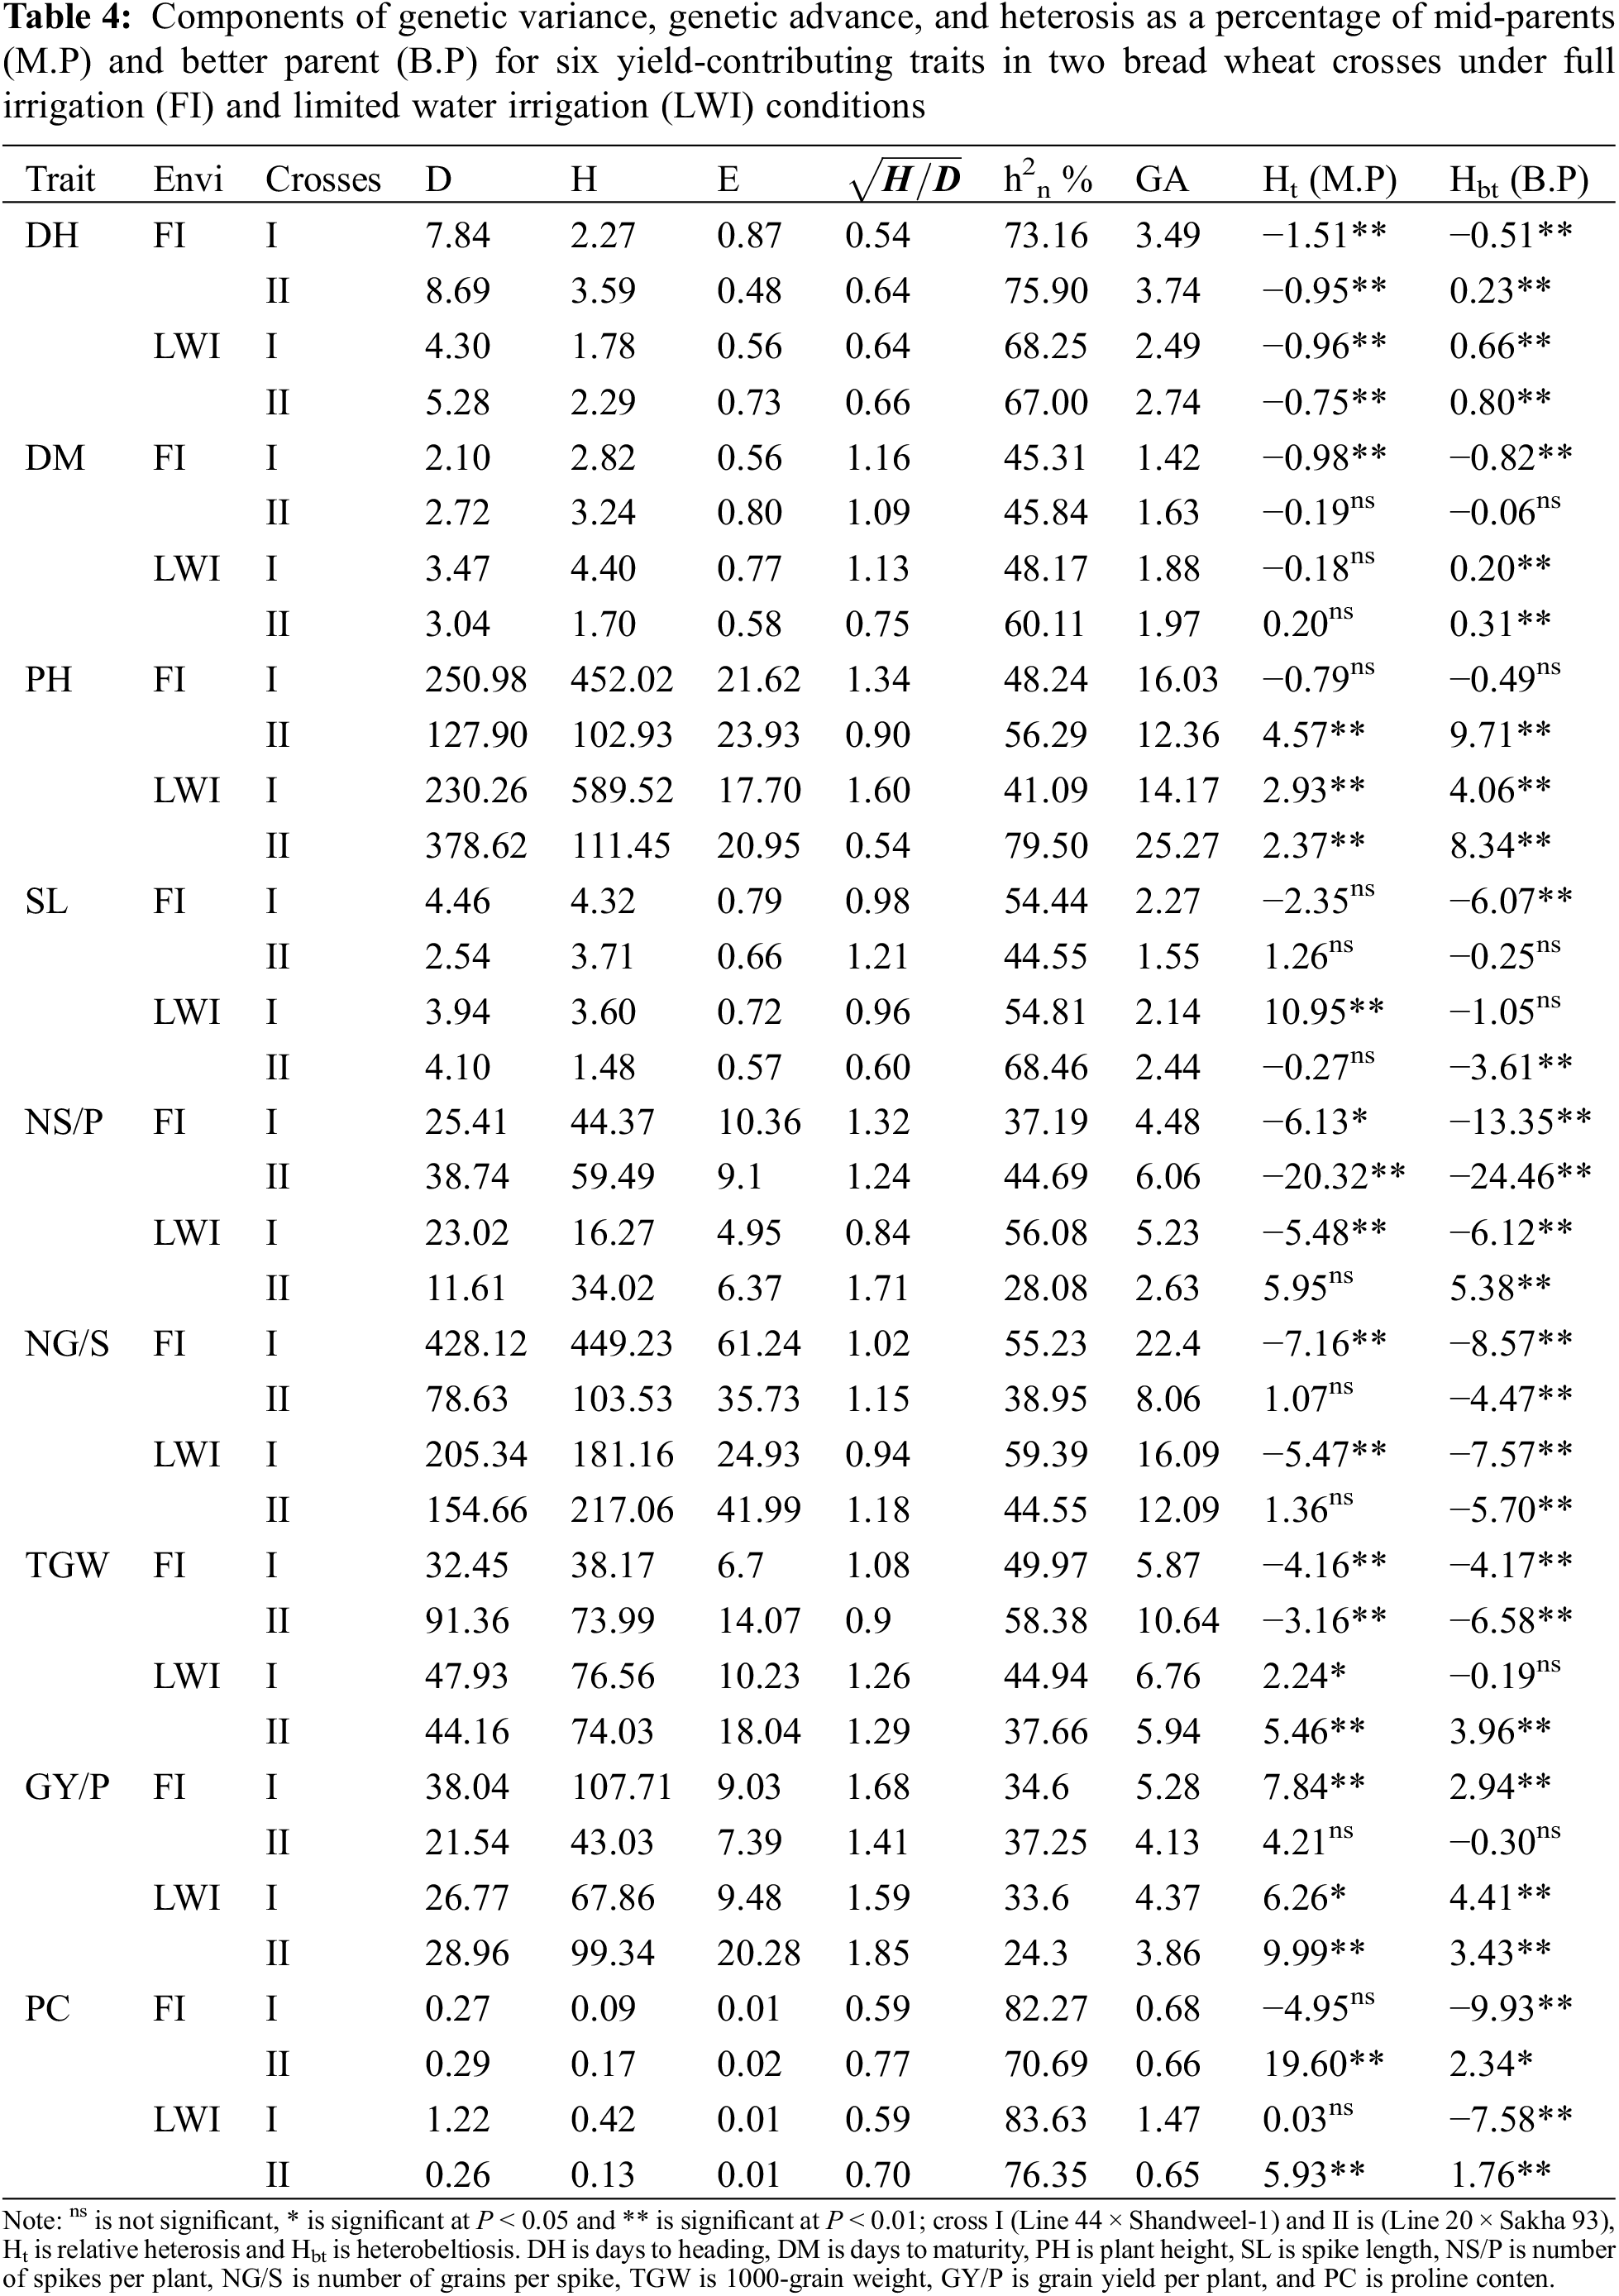
Genetic advances values were low in two crosses for DH and varied from 2.74% to 3.74%. In the same trend, DM, SL, NS/P, and PC showed low values in two crosses under both irrigation levels. However, PH and NG/S had moderate to high values and varied from 12.36% to 25.27% for PH, and from 8.06% to 22.40% for NG/S. In this respect, TGW varied from 5.87% to 10.64%, also grain yield exhibited low values and varied from 3.86% to 5.28%.
The mean values for all the characters of F1 hydrides were compared with the value of mid–parent (relative heterosis) and heterosis over better parent (heterobeltiosis) expressed as a percentage increase or decrease, are presented in Table 4 for different characters. The two crosses had desirable relative heterosis estimates for days to heading under two environments, while cross I had negative significant heterobeltiosis under WI. Cross I showed the negative significant heterosis and heterobeltiosis for days to maturity, under both water treatments. Moreover, the two crosses under DS and cross II under FL had positive significant heterosis and heterobeltiosis for PH, while cross I showed negative values under WI. Cross I exhibited positive significant heterosis under DS for spike length.
Positive significant relative heterosis was revealed for the number of spikes per plant (NS/P) in cross I under full irrigation and DS but cross II demonstrated positive significant relative heterobeltiosis under DS. For the number of grains per spike (NG/S), cross II under two water treatments showed significant positive heterosis of mid-parents and better-parent. Cross I under WI and two crosses under DS had positive significant relative heterosis for 1000-grain weight, whereas two crosses showed positive significant relative heterobeltiosis under DS. Moreover, cross I showed positive significant relative heterosis and heterobeltiosis under both conditions for grain yield per plant, as well as cross II under DS.
Based on the value of MP, GMP, STI, and DRI indices, BC1, BC2, F1, and P1 of cross II then BC1 for the cross I had the best performance and showed the highest value. Moreover, the lowest favorable value of TOL and SSI was assigned to BC1 of cross II, followed by BC1 for the cross I, then F1 and P1 of cross II (Fig. 3 and Table S3).
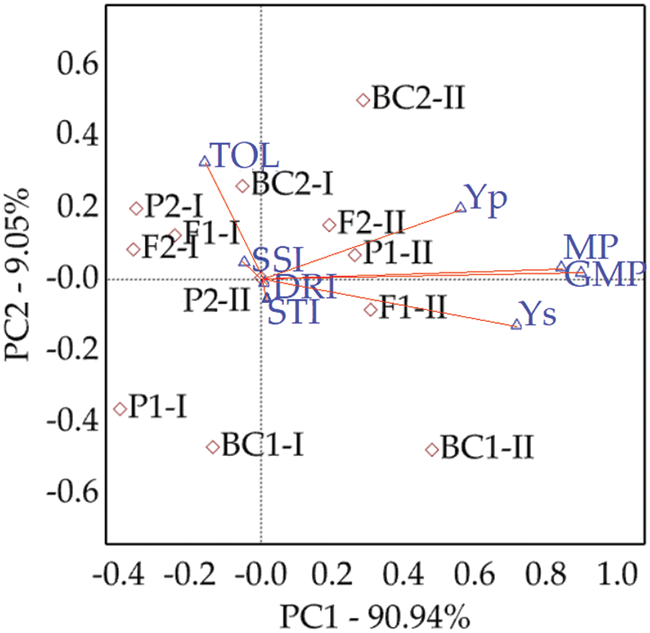
Figure 3: Drawing bi-plot based on first and second components for six bread wheat populations in two crosses and different indices
3.6 Correlation and Path Coefficient
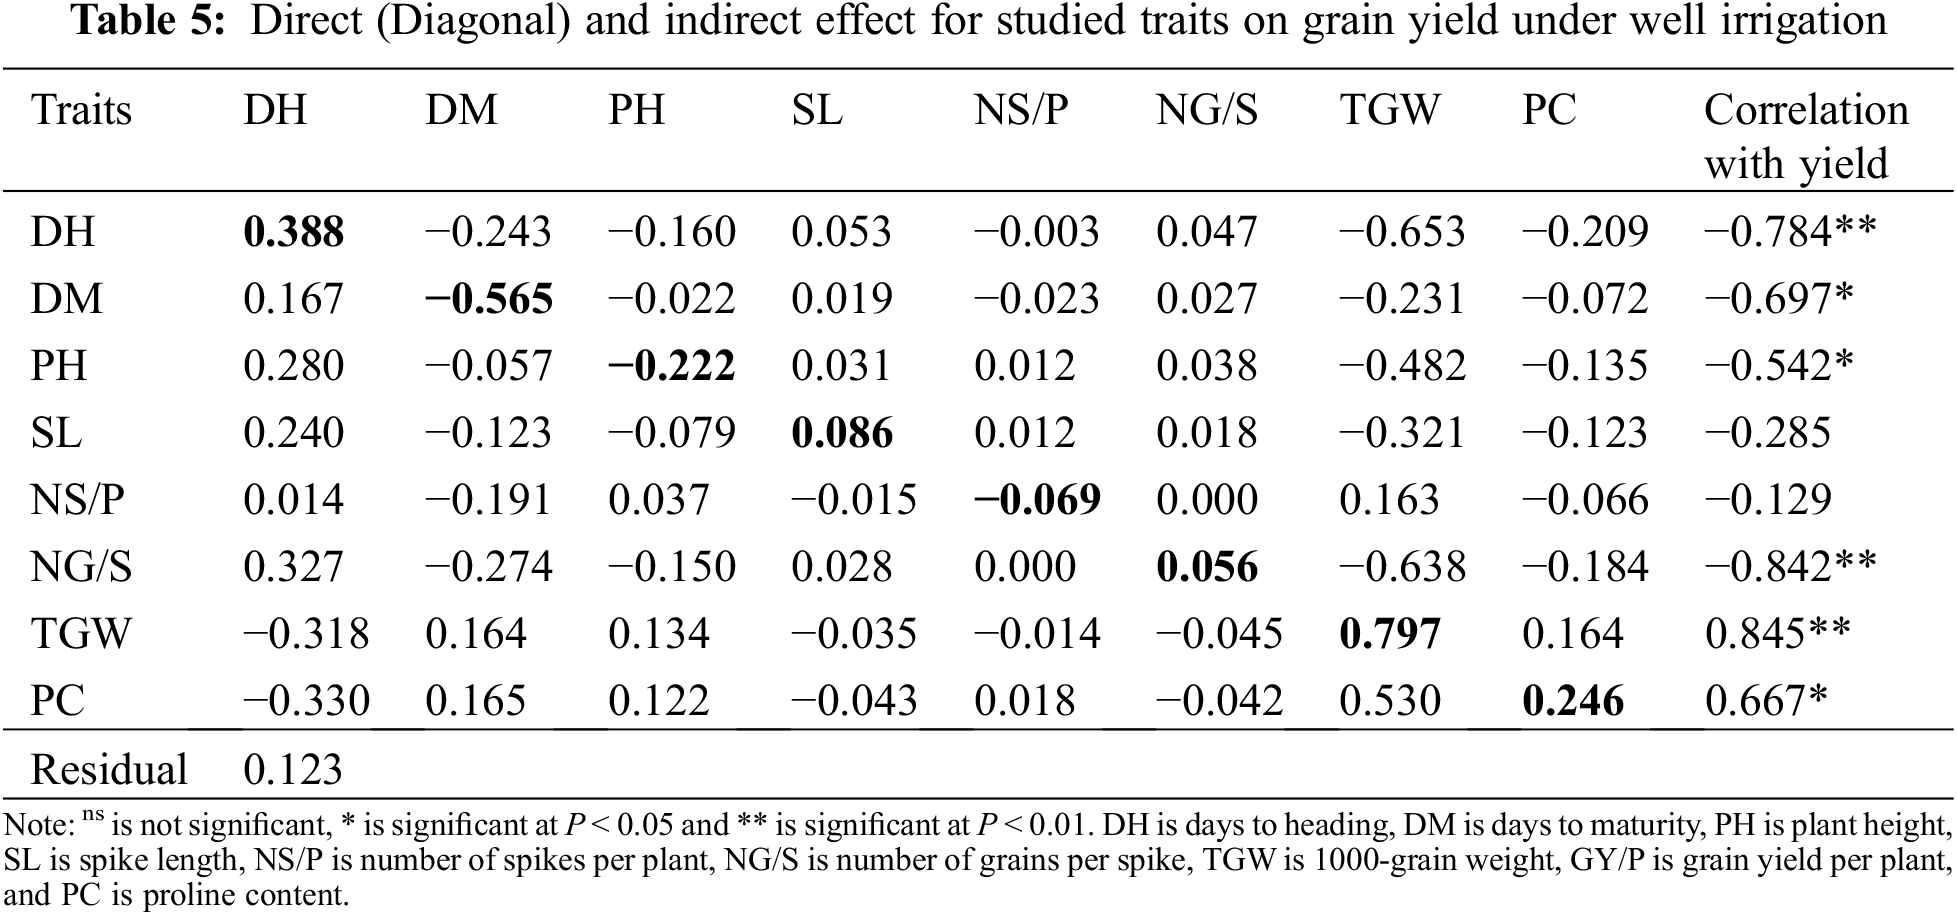
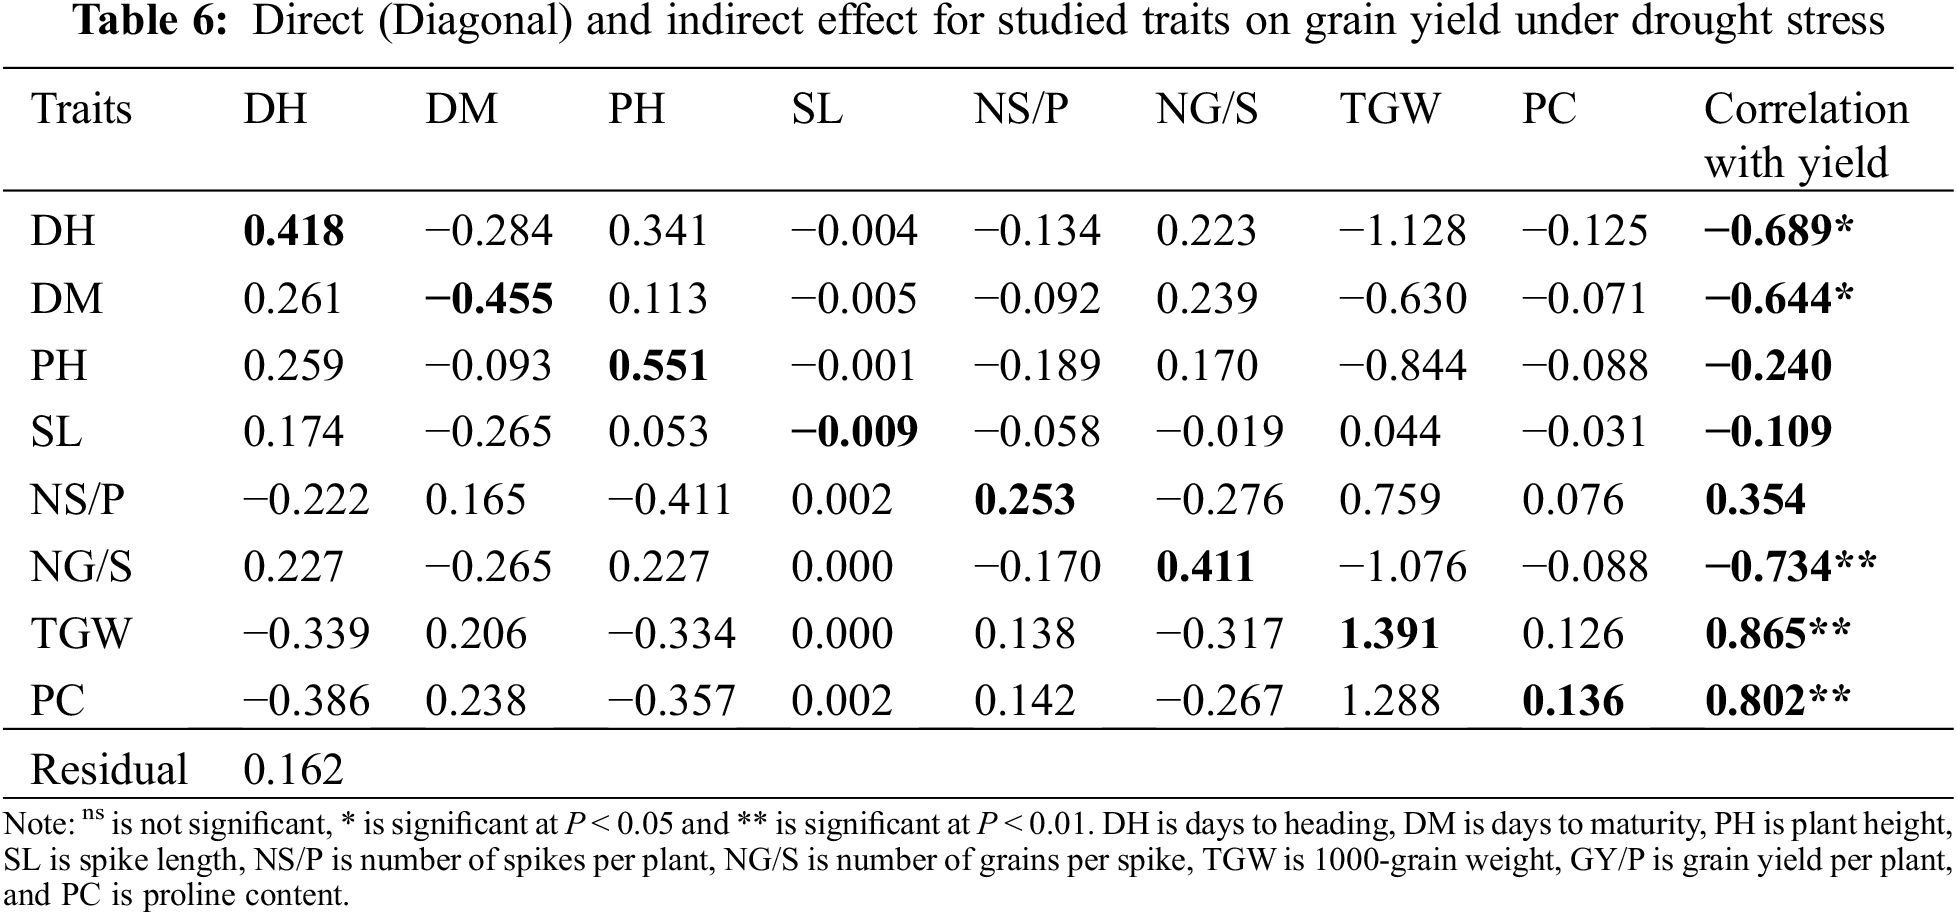
Correlation results under well irrigation and drought stress indicated that 1000-grain weight and proline content had significant positive correlation with grain yield, whereas DH, DM and NG/S had significant negative correlation with this parameter. Direct and indirect effects for some agronomic traits on yield under optimal irrigation relative to correlation coefficients are showing in Table 5. Under well irrigation, the direct effect on grain yield for most studied traits was positive except DM, PH and NS/P. The results displayed that TGW had the largest direct effect on grain yield (0.797) followed by days to heading (0.388), then proline content (0.246), spike length (0.086), and number of grains per spike (0.056). Spike length and number of grains per spike showed positive indirect effects on GY via earliness characters and PH. Days to heading had positive indirect effect on GY via DM, PH, SL, NS/P and NG/S, also, DM, PH and PC showed positive indirect effects on GY via TGW. On the other side, DH, SL, NS/P, and NG/S showed negative indirect effect on grain yield via this trait.
Results in Table 6 presented that TGW had the largest direct effect (1.391) on grain yield under drought stress followed by plant height (0.551), then days to heading (0.418), number of grains per spike (0.411), number of spikes per plant (0.253), and proline content (0.136), whereas SL and DM showed negative direct effect on GY. Plant height and NG/S showed positive indirect effects on GY via earliness traits. DH, PH and TGW had positive indirect effect via SL, also DM and NS/P showed positive indirect effects on GY via PC and TGW, while TGW and PC showed negative indirect effect on grain yield via DH, DM, PH, and NG/S.
The high significant values of genotypes for DH, DM, PH, SL, NS/P, NG/S, TGW, GY/P, and PC, indicate that the tested six populations for two wheat crosses showed abundant genetic variation for effective selection under both well irrigation and water stress tolerance using agronomic characters and proline content. Wheat researchers [12,18,28,29] reported similar results of high wheat genotype variances in different water regimes, where the selection efficiency and heterosis expression also largely depend upon the genetic variability magnitude present in the wheat populations. Genetic diversities are the first step in a wheat breeding program, thus it is a well-recognized value for wheat researchers [16,30].
Wheat populations respond to DS in the form of changes in numerous morphological, biochemical, and physiological characters. The physiological fluctuations detected could be consequences of harmful effects of moisture deficit on main metabolic processes and deference responses of various mechanisms modified by the wheat plant under DS. Farooq et al. [31] indicated that drought stress had effects on plant physiology by increasing leaf senescence and reducing both metabolic functions and stomatal conductance, moreover causing dehydration of tissues. Water stress reduced the means of all six populations compared with good irrigation for all characters except proline content. Similarly, many wheat researchers [30,32,33] were reported a severe decrease in various characters by drought-stressed.
Days to heading (DH) and days to maturity (DM) decreased with water-stressed, similar findings were stated by Pour-Aboughadareh et al. [34]. The decrease in maturity days under moisture stress was controlled by the inferior nutrients in the plant parts, which reduced the content of chlorophyll in leaves of the wheat plant due to the nitrogen element deficiency needed for the adaptation. The chloroplast integrity losses in the wheat leaf cause the early leaf senescence under drought that ultimately leads the wheat plant to mature early. The F1 means were earlier than relative parents in cross I (Line 44 × Shandweel-1) under WI, which was necessary for further selections. These results indicate the heterotic effects attendance and gene effects of over-dominance and the reducing alleles were more frequent than increasing alleles in the genetic constitution of population genotypes [16].
The plant height, spike length, and the number of spikes/plant were decreased at moisture deficient conditions. The reduction percentages on NS/P were 9.3%, and 11.4% in crosses I and II, respectively compared with WI. Whereas under drought situation many stresses were causes, i.e., current photosynthesis disruption, sterile of pollens pollinations, and decrease the transfer of stored food material to the grains from the parts of the wheat plant, which may cause a reduction in the NG/S and finally leads to reducing in NS/P [9,30,35,36].
The means of NG/S diverse from 53.1 to 74.0 under WI and from 49.8 to 70.5 under DS. Thus, reduction percentages were 4.5%, and 2.2% in the two crosses compared with WI. When plants were exposed to water stress at the stage among stem elongation and pollination time was reduced the NG/S than in a well-irrigated environment [9,37].
Furthermore, the means for the TGW differ from 44.7 to 57.1 g under WI and from 41.9 to 54.91 g under DS. The means of 1000-grain weight tended to reduce under water stress. Thus, reduction percentages were 6.03%, and 4.90% in two crosses, respectively compared with WI. The decrease in 1000-grain weight may be due to uptake efficiency of distributed nutrient and photosynthetic translocation within the wheat plant, which produced shriveled kernels/spikes due to hastened the maturity period. This is possible due to the water deficit that forces the wheat plant to complete its kernel development in a relatively lesser time. Thus, during the grain-filling time, drought stress is reduced significantly grain weight of wheat [9–10,12,36].
Grain yield per plant (g) was greater under well-irrigated than drought environments as a consequence of more spikes/square meters, heavier grains weight, and an extended plant cycle duration. A significant decrease in grain yield/plant due to post-anthesis water deficit may result from a decrease of the photo-assimilates production (source limitation), the sink power to absorb photo-assimilates, and the duration of grain filling. Drought decreased GY/P of six populations in two crosses than WI as fewer spikes/plant, lighter of grains weight, and shorter of the plant cycle. A significant decrease in GY/P due to post-anthesis drought deficient may result from a reduction in both grain filling period and photo-assimilates production with the weak ability of sink to absorb photo-assimilates [36]. The reducing percentages for grain yield/plant were 24.88%, and 17.43% in the two crosses, respectively. It was among all populations varied from 25.3 to 32.3 g under WI and from 17.6 to 28.9 g under DS. It is worth noting that the DS had affected all studied traits. Many wheat researchers presented some reasons for grain yield reductions. In this respect, Elmassry et al. [38] observed that DS decreased the mean of all genotypes for GY and yield components. Pour-Aboughadareh et al. [34] reported water stress significantly reduced GY, TGW, and NG/S by 36.49%, 44.93%, 20.60%, and 26.21% compared with well irrigation, although Ahmed et al. [39] found a 53% reduction in GY than the optimal irrigation.
The F1 means for proline content (PC) were intermediate to their parents in two crosses under two water treatments, except cross II (Line 20 × Sakha 93) under DS. These crosses had value more than both the parents, showing they had heterotic effects and the decreasing alleles were less frequent than increasing alleles in the genetic constitution. The F2 means were more than F1 ones in some crosses, indicating accumulation of increasing alleles. All the wheat genotypes when subjected to DS had increased in proline content accumulation by 175.0%, and 155.5% in crosses I, and II respectively, when compared with the same crosses under WI. The increase in PC under DS was the highest in cross II of all populations. Similarly, increases in PC were recorded from well irrigation to drought stress by 309.54% [40] and 159% [39].
The results showed insignificant scaling tests (A, B, C, and D) in two crosses for DH, TGW, and NS/P under two water treatments except cross II under DS for NS/P, as well as cross I for PC and cross II for NG/S under WI. Demonstrating that the absence of epistasis (non-allelic interaction) and the simple additive–dominance genetic model were verified to be fitting in explaining the inheritance of these traits in these crosses. In other words, it provides evidence for the adequacy of a simple genetic model to explain the genetic mechanism controlling these characters. While, each cross showed significant to one or more scaling tests, showing the complex model was fitted for explaining genetic variation for this cross. Correspondingly insignificant scaling tests (A, B, C, and D) were described also by Raza et al. [41] and Attri et al. [42] for DH and DM. The mean effect (m) for DH, DM, and PC was highly significant in two crosses under all conditions, reproducing the contribution due to the general mean plus the small effects and interaction of the fixed loci. Conversely, scaling test results for DM, PH, SL, NG/S, and GY/P showed the presence of non-allelic gene interaction in two wheat crosses. These results showed the attendance of epistasis and the complex genetic model was found to be satisfactory for illustrative the inheritance of the abovementioned characters in the corresponding crosses. These results are in agreement with those obtained by Sultan et al. [37] and Said et al. [29].
The mean parameter (m) values were significant to highly significant for all characters in two crosses under two water conditions, supporting that these traits were quantitatively inherited. The additive gene action (d) and additive × dominance (j) effects displayed positively significant for one or more crosses in all traits under two water environments. The importance of (d) and (j) gene effects in the inheritance of grain yield and its components were found by various wheat researchers [9,29,30,43].
The additive gene effect (d) was positive and significant in cross II, and negative in cross I for DH under two water regimes. Consequently, the phenotypic selection was more than actual for improving this trait. While the magnitude of (d) was small relative to the corresponding dominance effects (h) in cross II (Line 20 × Sakha 93) under WI for PC. Duplicate type of epistasis was detected in two crosses for DM and one cross for PH and PC since dominance (h) and dominance × dominance (l) parameters had an opposite sign. Dominance variance (H) was smaller than additive genetic variance (D), thus additive gene was controlling DH, SL, and PC in two crosses under WI and DS. Similarly NS/P and NG/S in cross I (Line 44 × Shandweel-1) under DS, TGW in cross II (Line 20 × Sakha 93) under full irrigation, resulting in (H/D)0.5 ratio was less than unity for all cases, it is related with homozygosity and proposing the effectiveness of selection for improving these traits and hence it is fixable. The contribution of (d) in the inheritance of DH and DM was also stated by Raza et al. [41], Attri et al. [42] and Saleem et al. [44] for proline content. Moreover, Sultan et al. [37], Patel et al. [43] and Sharma et al. [20] reported additive genes were controlled traits of yield components in the various wheat crosses.
The dominance (h) gene action and peristatic dominance × dominance (l) effects were significant and had opposite signs in one or two crosses for, DM, PH, NS/P, NG/S, and GY/P. These results indicated that the interaction was predominantly of duplicate type, the non-fixable gene action type demonstrated by these traits in these crosses, may propose that improving these traits could be succeeded through the method of hybrid breeding. Thus, the selection of these traits will be more difficult in the early generations.
Meanwhile, the dominant genetic variance (H) was the prevailed type controlling the inheritance of DM, NS/P, NG/S, TGW, and GY/P for all crosses except cross I for NG/S under DS and cross II for TGW under irrigation, resulting in a degree of dominance (H/D)0.5 more than unity for these crosses. Indicating the importance of over-dominance, therefore NS/P, NG/S, TGW, and GY/P traits were governed by non-additive gene action, it was also obvious from the superior performance of F1’s than advanced lines [34,44,45].
Based on the present study, it could be determined that GY/P and its components traits revealed three-gene actions kinds (additive, dominant, and epistasis). These characters showed complex genetic behavior. Therefore, heterosis breeding could be possible to the improvement of these traits over hybridization (recombination breeding) followed by selection at later generations to obtain better lines under both good irrigation and drought stress environments and it is suggesting for exploiting dominance gene action (h) and these methods must be followed in the next future study. The various studies exhibited also the complex genetic inheritance of grain yield/plant and its components [20,29,46].
4.4 Heritability, Genetic Advanced and Heterosis
Both DH and PC traits had high narrow-sense heritability estimates (h2n > 61%) in all crosses under WI and DS, suggesting qualitative gene action with the potential for rapid genetic improvement from the selection. High h2n estimates were recorded by Attri et al. [42] for DH, and Saleem et al. [44] for PC. While it was low for GY/P and low to moderate for NG/S and TGW. These results of heritability in a narrow sense are in line with those obtained by Said et al. [29], they reported a low h2n estimate of NS/P. Moreover, moderate to high heritability for NG/S, NS/P, GY/P, and TGW under WI and low under DS [36–38,47]. Furthermore, Attri et al. [42] found moderate to high h2n for GY/P and its components in all crosses.
Genetic advances values were low in two crosses for DH, PC, NS/P, and GY/P, meanwhile, it was moderate to high for NG/S and low to moderate for TGW under both water conditions. In this respect, Shamuyarira et al. [30] reported the genetic advances for DH, NG/S, and TGW showed low values under non-stressed and drought-stressed conditions. DH was low under irrigation and moderate under DS. Erkul et al. [48] showed low genetic advances for NG/S, TGW, and GY/P, medium for NG/S, and high for NS/P, while Sultan et al. [37] and Elmassry et al. [38] found moderate to high genetic radiances for NG/S, NS/P, TGW, and GY/P. however, Shamuyarira et al. [30] reported the genetic advances for GY/P were 6.84% under drought and 17.12% under non-stressed conditions.
In wheat, the magnitude and nature of heterosis are used to help plant breeders in identifying superior wheat cross combinations that could produce desirable transgressive segregants in advanced generations for additional enrichment of grain yield and yield components. Wheat crosses I and II had early heading and negative heterosis under two water regimes are generally desirable and useful parameters. Also, negative heterosis for days to heading was reported by the other workers [4,42,49]. For proline content, the cross I showed positive significant heterosis under both conditions. Similar findings were reported by Sharma et al. [50].
Wheat cross I showed positive significant relative heterosis for NS/P, NG/S, and GY/P, respectively under WI, as well as crosses I and II under DS for TGW and GY/P. While cross II showed positive significant heterobeltiosis for NS/P, TGW, and GY/P under both conditions. Many researchers were reported positive significant heterosis in wheat crosses for grain yield and its components [29,37,38,42,49,50]. Positive significant heterosis crosses could be used in breeding programs for the improvement of wheat traits under optimal irrigation and water stress conditions.
Wheat breeders have made important improvements in wheat adaptation to water stress environments [7,51] based on empirical selection under drought stress. Six populations showed significant differences between GY/P in DS and WI conditions indicates to the possibility of selection for favorable genotypes in both conditions. The MP, GMP, STI, and SSI indices were the best indices and highly correlated with GY/P. They are suitable to screen wheat drought-tolerant genotype (e.g., BC1, BC2, F1, and P1 of cross II and BC1 for the cross I) in both DS and WI conditions. Similar results were reported by Mohammadi et al. [35], Fellahi et al. [52] and Hamza et al. [53], who found these parameters to be apposite for discriminating the greatest genotypes under DS and WI.
4.6 Correlation and Path Coefficient
Correlation coefficient analysis is a widely used to measure of the direction and extent of the relationships between different traits and can help plant breeders to understand how the improvement in one character can simultaneously lead to changes in other traits [54]. Path coefficient analysis can be used as a basic tool for establishing appropriate causal relationships between yield and yield components. Based on the results obtained, the selection based on TGW, DH, NG/S and PC in this material may be most useful for increasing grain yield, as they have a direct positive contribution to grain yield under well irrigation, indicating the effectiveness of direct selection. However, TGW, PH, DH, NG/S, NS/P and PC could be serve as effective selection criteria for improving wheat grain yield under drought stress. Therefore, it can be concluded that these traits can be selected for different stress environments, which will benefit yield. Fouad [55] and Li et al. [56] reported positive correlation between GY and each of the NG/S and NS/P under well irrigation and drought stress. Mecha et al. [57] and Ganno et al. [58] also showed that SL, NG/S and TGW had positive correlation with grain yield. Grain yield had significant positive correlation with DM, PH, NG/S, TGW, and SL [59], and negative correlation with TGW [60]. Path coefficient revealed that PH and NG/S had the maximum positive direct effect on GY [55,61]. Fouad [55] showed the direct effect of TGW on GY was positive under irrigation and drought.
Genetic analysis showed that means of six populations for all traits were decreased by DS except proline content. Results of scaling test (A, B, C, and D) under WI and DS exhibited significant values in two crosses for all traits except days to heading, number of spikes/plant, and 1000-grain weight revealed that these characters showed all gene action types (additive, dominance, and epistasis). The additive variance (d) was more than the dominance (h) for days to heading, spike length, and proline content under well-watered, number of spikes/plant in cross I under drought, number of grains/spike in cross I under DS, and 1000-grain weight in cross II across two water regimes. Meanwhile, the dominant effect (h) was more effective than the additive (d) one for grain yield/plant in two crosses across two water conditions. Based on these results the investigated traits showed complex genetic behavior. Therefore, the early selection program would be less effective, thus it is recommended to stay the selection to advanced generations because must decrease non-fixable genetic variation and the benefits from the significant additive × additive and the exploit of transgressive segregates due to duplicated epistasis. Thousand-grain weight, plant height, days to heading, number of grains/spike, number of spikes/plant, and proline content could be serve as effective selection criteria for improving wheat grain yield under drought stress.
Acknowledgement: The authors wish to thank Zagazig University, Agricultural Research Center (ARC), Egypt and Prof. Dr. Abdallah A. Swelam, Researcher Emeritus, Wheat Research Department, Field Crops Research Institute, ARC, Egypt, for the technical and financial support of this research.
Funding Statement: The authors received no specific funding for this study.
Conflicts of Interest: The authors declare that they have no conflicts of interest to report regarding the present study.
References
1. FAO (2019). Food and agriculture organization of the united nations crops and livestock products. http://www.fao.org/faostat/en/#data/TP. [Google Scholar]
2. Schmidt, J., Claussen, J., Wörlein, N., Eggert, A., Fleury, D. et al. (2020). Drought and heat stress tolerance screening in wheat using computed tomography. Plant Methods, 16(15), 1–12. DOI 10.1186/s13007-020-00565-w. [Google Scholar] [CrossRef]
3. Reynolds, M. P., Pask, A. J. D., Mullan, D. M. (2012). Physiological breeding, I: Interdisciplinary aapproaches to improve crop adaptation. Mexico, D.F.: CIMMYT. [Google Scholar]
4. Al-Ashkar, I., Alotaibi, M., Refay, Y., Ghazy, A., Zakri, A. et al. (2020). Selection criteria for high yielding and early flowering bread wheat hybrids under heat stress. PLoS One, 15(8), e0236351. DOI 10.1371/journal.pone.0236351. [Google Scholar] [CrossRef]
5. Moustafa, E. S. A., Ali, M. M. A., Kamara, M. M., Awad, M. F., Hassanin, A. A. et al. (2021). Field screening of wheat advanced lines for salinity tolerance. Agronomy, 11(2), 281. DOI 10.3390/agronomy11020281. [Google Scholar] [CrossRef]
6. Mwadzingeni, L., Shimelis, H., Rees, D. J., Tsilo, T. J. (2017). Genome-wide association analysis of agronomic traits in wheat under drought-stressed and non-stressed conditions. PLoS One, 12(2), e0171692. DOI 10.1371/journal.pone.0171692. [Google Scholar] [CrossRef]
7. Ali, M. M. A., Abdulhamid, M. I. E. (2017). Yield stability of wheat under some drought and sowing dates environments in different irrigation systems. Zagazig Journal of Agriculatural Ressearch, 44(3), 865–886. DOI 10.21608/zjar.2017.52284. [Google Scholar] [CrossRef]
8. Li, T., Hasegawa, T., Yin, X., Zhu, Y., Boote, K. et al. (2015). Uncertainties in predicting rice yield by current 130 crop models under a wide range of climatic conditions. Global Change Biology, 21, 1328–1341. DOI 10.1111/gcb.12758. [Google Scholar] [CrossRef]
9. Dong, B., Zheng, X., Liu, H., Able, J. A., Yang, H. et al. (2017). Effects of drought stress on pollen sterility, grain yield, abscisic acid and protective enzymes in two winter wheat cultivars. Frontiers in Plant Science, 8, 1008. DOI 10.3389/fpls.2017.01008. [Google Scholar] [CrossRef]
10. Elsayed, S., Elhoweity, M., Ibrahim, H. H., Dewir, Y. H., Migdadic, M. et al. (2017). Thermal imaging and passive reflectance sensing to estimate the water status and grain yield of wheat under different irrigation regimes. Agricultural Water Management, 189, 98–110. DOI 10.1016/j.agwat.2017.05.001. [Google Scholar] [CrossRef]
11. Kosová, K., Vítámvás, P., Urban, M. O., Kholová, J., Prášil, I. T. (2019). Breeding for enhanced drought resistance in barley and wheat drought-associated traits, genetic resources and their potential utilization in breeding programmes. Czech Journal of Genetics and Plant Breeding, 50, 247–261. DOI 10.17221/CJGPB. [Google Scholar] [CrossRef]
12. Ali, M. M. A., Mansour, E., Awaad, H. A. (2021). Drought tolerance in some field crops: State of the art review. In: Awaad, H., Abu-hashim, M., Negm, A. (Eds.Mitigating environmental stresses for agricultural sustainability in egypt, pp. 17–62. Cham: Springer International Publishing. [Google Scholar]
13. Gutierrez, M., Reynolds, M. P., Raun, W. R., Stone, M. L., Klatt, A. R. (2010). Spectral water indices for assessing yield in elite bread wheat genotypes in well irrigated, limited water irrigation, and high-temperature conditions. Crop Science, 50, 197–214. DOI 10.2135/cropsci2009.07.0381. [Google Scholar] [CrossRef]
14. Fellahi, Z. E., Hannachi, A., Bouzerzour, H., Benbelkacem, A. (2016). Genetic control of bread wheat (Triticum aestivum L.) traits. Songklanakarin Journal of Science and Technology, 38, 91–97. DOI 10.14456/sjst-psu.2016.12. [Google Scholar] [CrossRef]
15. Mansour, E., Moustafa, E. S. A., Desoky, E. M., Ali, M. M. A., Yasin, M. A. T. et al. (2020). Multidimensional evaluation for detecting salt tolerance of bread wheat genotypes under actual saline field growing conditions. Plants, 9(10), 1324. DOI 10.3390/plants9101324. [Google Scholar] [CrossRef]
16. Fischer, R. A., Rebetzke, G. J. (2018). Indirect selection for potential yield in early-generation, spaced plantings of wheat and other small-grain cereals: A review. Crop Pasture Science, 69(5), 439–459. DOI 10.1071/CP17409. [Google Scholar] [CrossRef]
17. Mather, K., Jinks, J. L. (1982). Biometrical genetics, 3rd edition. London: Chapman and Hall. [Google Scholar]
18. Khalaf, A. E. A., Eid, M. A. M., Ghallab, K. H., El-Areed, S. R. M., Yassein, A. A. M. et al. (2021). Development of a five-parameter model to facilitate the estimation of additive, dominance, and epistatic effects with a mediating using bootstrapping in advanced generations of wheat (Triticum aestivum L.). Agronomy, 11(7), 1325. DOI 10.3390/agronomy11071325. [Google Scholar] [CrossRef]
19. Singh, R. K., Chaudhary, B. D. (1987). Biometrical methods in quantitative genetics analysis. New Delhi, India: Kalyani Publishers. [Google Scholar]
20. Sharma, S., Agrawal, A. P. (2020). Study on genetic effect of yield and related traits through generation mean analysis in wheat (Triticum aestivum L.). International Journal of Current Microbiology and Applied Sciences, 9(6), 1546–1556. DOI 10.20546/ijcmas.2020.906.191. [Google Scholar] [CrossRef]
21. Bates, L. S., Waldren, R. P., Teare, I. D. (1973). Rapid determination of free proline for limited water irrigation studies. Plant Soil, 39, 205–207. DOI 10.1007/BF00018060. [Google Scholar] [CrossRef]
22. Jinks, J. L., Jones, R. M. (1958). Estimation of the components of heterosis. Genetics, 43, 223–234. DOI 10.1093/genetics/43.2.223. [Google Scholar] [CrossRef]
23. Wright, S. (1968). The genetics of quantitative variability. In: Wright, S. (Ed.Evolution and genetics of populations, pp. 373–420. University of Chicago Press, Chicago. [Google Scholar]
24. Hallauer, A. R. (1989). Modern methods in maize breeding. Iowa State, USA: Iowa University. [Google Scholar]
25. Allard, R. W. (1999). Principles of plant breeding. New York, USA: John Wiley and Sons. [Google Scholar]
26. Bhatt, G. M. (1971). Heterosis performance and combining ability in a diallel cross among spring wheat (Triticum aestivum L.). Australian Journal of Agricultural Research, 22, 329–368. DOI 10.1071/AR9710359. [Google Scholar] [CrossRef]
27. Dewey, D. R., Lu, K. H. (1959). A correlation and path coefficient analysis of components of crested wheat grass seed production. Agronomy Journal, 51: 515–518. DOI 10.2134/agronj1959.00021962005100090002x. [Google Scholar] [CrossRef]
28. Ahmed, H. G. M., Zeng, Y., Yang, X., Anwaar, H. A., Mansha, M. Z. et al. (2020a). Conferring drought-tolerant wheat genotypes through morpho-physiological and chlorophyll indices at seedling stage. Saudi Journal of Biological Sciences, 27(8), 2116–2123. DOI 10.1016/j.sjbs.2020.06.019. [Google Scholar] [CrossRef]
29. Said, A. H., Yasser, A. M. (2021). Inheritance of drought tolerance using six populations model in two bread wheat crosses. Egyptian Journal of Agronomy, 43(1), 69–81. DOI 10.21608/agro.2021.51233.1239. [Google Scholar] [CrossRef]
30. Shamuyarira, K. W., Shimelis, H., Tapera, T., Tsilo, T. J. (2019). Genetic advancement of newly developed wheat populations under drought-stressed and non-stressed conditions. Journal of Crop Science and Biotechnology, 22(2), 169–176. DOI 10.1007/s12892-018-0262-0. [Google Scholar] [CrossRef]
31. Farooq, M., Hussain, M., Siddique, K. H. M. (2014). Drought stress in wheat during flowering and grain-filling periods. Critical Reviews in Plant Sciences, 33, 331–349. DOI 10.1080/07352689.2014.875291. [Google Scholar] [CrossRef]
32. Mwadzingeni, L., Shimelis, H., Tesfay, S., Tsilo, T. J. (2016). Screening of bread wheat genotypes for drought tolerance using phenotypic and proline analyses. Frontiers in Plant Science, 7, 1276. DOI 10.3389/fpls.2016.01276. [Google Scholar] [CrossRef]
33. Soares, G. F., Ribeiro Júnior, W. Q., Pereira, L. F., Lima, C. A. D., Soares, D. D. S. et al. (2021). Characterization of wheat genotypes for drought tolerance and water use efficiency. Scientia Agricola, 78(5), 1–11. DOI 10.1590/1678-992x-2019-0304. [Google Scholar] [CrossRef]
34. Pour-Aboughadareh, A., Mohammadi, R., Etminan, A., Shooshtari, L., Maleki-Tabrizi, N. et al. (2020). Effects of drought stress on some agroanomic and morpho-physiological traits in durum wheat genotypes. Sustainability, 12(14), 5610. DOI 10.3390/su12145610. [Google Scholar] [CrossRef]
35. Mohammadi, M., Karimizadeh, R., Abdipour, M. (2011). Evaluation of drought tolerance in bread wheat genotypes under dryland and supplemental irrigation conditions. Australian Journal of Crop Science, 5(4), 487–493. DOI 10.3316/informit.281651288962837. [Google Scholar] [CrossRef]
36. Poudel, M. R., Ghimire, S., Poudel, K. (2020). Evaluation of wheat genotypes under irrigated, heat stress and drought conditions. Journal Biology Today’s World, 9(1), 1–12. DOI 10.35248/2322-3308.20.9.212. [Google Scholar] [CrossRef]
37. Sultan, M. S., Abd El-Latif, A. H., Abdel-Moneam, M. A., El-Hawary, M. N. (2011). Genetic parameters for some yield and yield components characters in four crosses of bread wheat under two water regime treatments. Journal of Plant Production, 2(2), 351–366. DOI 10.21608/jpp.2011.85531. [Google Scholar] [CrossRef]
38. Elmassry, E. L., El-Nahas, M. M. (2018). Genetic behavior of some agronomic characters in three bread wheat crosses under different environmental conditions. Alexandria Journal of Agricultural Sciences, 63(5), 313–325. DOI 10.21608/alexja.2018.29390. [Google Scholar] [CrossRef]
39. Ahmed, K., Shabbir, G., Ahmed, M., Shah, K. N. (2020b). Phenotyping for drought resistance in bread wheat using physiological and biochemical traits. Science of the Total Environment, 729, 139082. DOI 10.1016/j.scitotenv.2020.139082. [Google Scholar] [CrossRef]
40. Johari-Pireivatlou, M. (2010). Effect of soil water stress on yield and proline content of four wheat lines. African Journal of Biotechnology, 9(1), 36–40. DOI 10.5897/AJB09.521. [Google Scholar] [CrossRef]
41. Raza, H., Khan, A. S., Ahmed, N. (2019). Genetic analysis for some phenological and morphological traits in wheat (Triticum aestivum L.) under two different sowing windows. Applied Ecology and Environmental Research, 17(2), 2059–2071. DOI 10.15666/aeer/1702_20592071. [Google Scholar] [CrossRef]
42. Attri, H., Dey, T., Singh, B., Kour, A. (2021). Genetic estimation of grain yield and its attributes in three wheat (Triticum aestivum L.) crosses using six parameter model. Journal of Genetics, 100(47), 1–9. DOI 10.1007/s12041-021-01298-y. [Google Scholar] [CrossRef]
43. Patel, H. N., Abhishek, D., Shrivastava, A., Patel, S. R. (2018). Genetic analysis for heterotic traits in bread wheat (Triticum aestivum L.) using six parameters model. International Journal of Current Microbiology and Applied Sciences, 7(6), 239–249. DOI 10.20546/ijcmas.2018.706.029. [Google Scholar] [CrossRef]
44. Saleem, S., Kashif, M., Hussain, M., Khan, A. S. S., Farrukh, S. (2016). Genetic behavior of morpho-physiological traits and their role for breeding drought tolerant wheat. Pakistan Journal of Botany, 48(3), 925–933. DOI 10.47116076/pjb.2016.359214. [Google Scholar] [CrossRef]
45. Ijaz, U., Smiullah, S., Kashif, M. (2013). Generation means analysis for five physiological traits of bread wheat under rainfed condition. Universal Journal of Plant Science, 1(1), 21–26. DOI 10.13189/ujps.2013.010103. [Google Scholar] [CrossRef]
46. Salmi, M., Benmahammed, A., Benderradji, L., Fellahi, Z. E. A., Bouzerzour, H. (2019). Generation means analysis of physiological and agronomical targeted traits in durum wheat (Triticum durum Desf.) cross. Revista Facultad Nacional de Agronomía Medellín, 72(3), 8971–8981. DOI 10.15446/rfnam.v72n3.77410. [Google Scholar] [CrossRef]
47. Usman, I., Ullah, S., Kashif, M. (2013). Generation means analysis for five physiological traits of bread wheat under rain fed conditions. Universal Journal of Plant Science, 1, 21–26. DOI 10.13189/ujps.2013.010103. [Google Scholar] [CrossRef]
48. Erkul, A., Ünay, A., Konak, C. (2010). Inheritance of yield and yield components in a bread wheat (Triticum aestivum L.) cross. Turkish Journal of Field Crops, 15(2), 137–140. DOI 10.17557/tjfc.30098. [Google Scholar] [CrossRef]
49. Kumar, P., Singh, H., Lal, C., Choudhary, R. (2021). Heterosis analysis for yield and its component traits in bread wheat (Triticum aestivum L.) over different environments. Journal of Environmental Biology, 42, 438–445. DOI 10.22438/jeb/42/2(SI)/SI-251. [Google Scholar] [CrossRef]
50. Sharma, V., Kamaluddin (2020). Heterosis for yield and physio-biochemical traits in bread wheat (Triticum aestivum L.) under different environmental conditions. Bangladesh Journal of Botany, 49(3), 515–520. DOI 10.3329/bjb.v49i3.49618. [Google Scholar] [CrossRef]
51. Al-salimiyia, M., Luigi, G. D., Abu-Rabada, E., Ayad, H., Basheer-Salimia, R. (2018). Adaption of wheat genotypes to drought stress. International Journal of Environment, Agriculture and Biotechnology, 3(1), 182–186. DOI 10.22161/ijeab/3.1.23. [Google Scholar] [CrossRef]
52. Fellahi, Z. E. A., Hannachi, A., Bouzerzour, H. (2018). Analysis of direct and indirect selection and indices in bread wheat (Triticum aestivum L.) segregating progeny. International Journal of Agronomy, 2018, 1–11. DOI 10.1155/2018/8312857. [Google Scholar] [CrossRef]
53. Hamza, D. A., Sanaa, I. M., Barakat, M. N., Ageez, A., Nawar, A. I. (2018). Evaluation of drought tolerance indices for screening some wheat (Triticum aestivum L.) genotypes under drought conditions. Middle-East Journal of Agricculature Research, 7, 1234–1244. [Google Scholar]
54. Sabit, Z., Yadav, B., Rai, P. K. (2017). Genetic variability, correlation and path analysis for yield and its components in f5 generation of bread wheat (Triticum aestivum L.). Journal of Pharmacognasy and Phytochemistry, 6(4), 680–687. DOI 10.9790/2380-1201011723. [Google Scholar] [CrossRef]
55. Fouad, H. M. (2018). Correlation, path and regression analysis in some bread wheat (Triticum aestivum L.) genotypes under normal irrigation and drought conditions. Egypt Journal of Agronomy, 40(2), 133–144. DOI 10.21608/AGRO.2018.3109.1097. [Google Scholar] [CrossRef]
56. Li, D., Ruitao Lou, R., Li, Y., Bian, Z., Zhu, Y. (2020). Effects of multi-stage continuous drought on photosynthetic characteristics, yield and water use efficiency of winter wheat. Phyton-International Journal of Experimental Botany, 89(3), 691–703. DOI 10.32604/phyton.2020.010661. [Google Scholar] [CrossRef]
57. Mecha, B., Alamerew, S., Assefa, A., Dutamo, D., Assefa, E. (2017). Correlation and path coefficient studies of yield and yield associated traits in bread wheat (Triticum aestivum L.) genotypes. Advances in Plants and Agriculture Research, 6(5), 128–136. DOI 10.15406/apar.2017.06.00226. [Google Scholar] [CrossRef]
58. Ganno, J., Alemu, D., Ayalew, G. (2017). Study of genetic variation and grain quality traits in bread wheat (Tritium aestivum L.) genotypes. African Journal of Plant Breeding, 4(1), 172–182. [Google Scholar]
59. Baye, A., Berihun, B., Bantayehu, M., Derebe, B. (2020). Genotypic and phenotypic correlation and path coefficient analysis for yield and yield-related traits in advanced bread wheat (Triticum aestivum L.) lines. Cogent Food and Agriculture, 6(1), 1752603. DOI 10.1080/23311932.2020.1752603. [Google Scholar] [CrossRef]
60. Ataei, R., Gholamhoseini, M., Kamalizadeh, M. (2017). Genetic analysis for quantitative traits in bread wheat exposed to irrigated and drought stress conditions. Phyton-International Journal of Experimental Botany, 86, 228–235. DOI 10.32604/phyton.2017.86.228. [Google Scholar] [CrossRef]
61. Barman, M., Choudhary, V. K., Singh, S. K., Parveenn, R., Gowda, A. K. (2020). Correlation and path coefficient analysis in bread wheat (Triticum aestivum L.) genotypes for morphophysiological traits along with grain Fe and Zn content. Current Journal of Applied Science and Technology, 39(36), 130–140. DOI 10.9734/cjast/2020/v39i3631081. [Google Scholar] [CrossRef]
Supplementary Materials
Table S1: Soil mechanical and chemical analyses of the experimental sites
Table S2: Monthly weather data during the field trial at Kafer El-Hamam, Sharkia Governorates
Table S3: Estimation of stress tolerance indices from the potential yield and the stress yield data of six populations in two-bread wheat crosses
Figure S1: Mean of the six populations for days to maturity and spike length in two wheat crosses under two water regimes
Figure S2: Mean of the six populations for number of spikes per plant and number of grains per spike in two wheat crosses under two water regimes
Figure S3: Mean of the six populations for 1000-grain weight and grain yield per plant in two wheat crosses under two water regimes
Cite This Article
 Copyright © 2022 The Author(s). Published by Tech Science Press.
This work is licensed under a Creative Commons Attribution 4.0 International License , which permits unrestricted use, distribution, and reproduction in any medium, provided the original work is properly cited.
 Downloads
 Citation Tools