
 Submit a Paper
 Propose a Special lssue
 Open Access
ARTICLE
The Effect of Methylation Modification of MDD on the Expression of Key Genes in the Process of Saponin Synthesis in Eleutherococcus senticosus
College of Life Sciences, North China University of Science and Technology, Tangshan, 063210, China
* Corresponding Authors: Yuehong Long. Email: ; Zhaobin Xing. Email:
(This article belongs to the Special Issue: Biotechnology of Plant Secondary Metabolites)
Phyton-International Journal of Experimental Botany 2022, 91(12), 2649-2668. https://doi.org/10.32604/phyton.2022.021631
Received 25 January 2022; Accepted 12 April 2022; Issue published 29 August 2022
 View Full Text
 Download PDF
Abstract
Mevalonate pyrophosphate decarboxylase is a kind of key enzyme in the terpenoid synthesis pathway in Eleutherococcus senticosus. The results of bisulfite sequencing showed that there were three kinds of samples with a low (0.68%), medium (0.72%) and high (0.79%) DNA methylation ratio in the promoter of MDD in E. senticosus, respectively. The transcriptome sequencing results showed that the expression of MDD in E. senticosus was significantly up-regulated in the types with low DNA methylation ratios of MDD (P < 0.05). There was a significant negative correlation between the saponin content in E. senticosus and the DNA methylation ratio of MDD promoter (P < 0.05). The screening results of differentially expressed transcription factors among the three groups with different DNA methylation ratio showed that a total of 4 transcription factors could bind to 6 CpG sites. Protein-protein interaction analysis showed that E. senticosus MDD could interacted with other key enzymes in the process of terpenoid synthesis. In addition, it was found that the DNA methylation of MDD promoter was mainly regulated by DNA methyltransferase. These results demonstrated that under the action of DNA methyltransferase, the changes of DNA methylation of MDD promoter could regulate its own expression level by affecting the combination ability of transcription factors, and then affected the expression of other genes in terpenoid synthesis pathway. The synthesis and accumulation of saponins in E. senticosus was also changed.Keywords
Supplementary Material
Supplementary Material FileEleutherococcus senticosus Maxim, one of traditional Chinese medicines, has been used to calm the mind, strengthen the spleen, tonify the kidney and anti-fatigue [1]. Pharmacological studies show that E. senticosus contains triterpene saponins, coumarins, lignins, phenols, flavonoids and other secondary metabolites, which have the effects of antioxidation, sedation, hypnosis, hypoglycemia and anti-tumor [2]. So far, 43 saponins have been isolated from E. senticosus, of which oleanane type of triterpenoid saponin is one of the main active components [3].
In recent years, it has been a research hotspot to analyze how the diversity of key enzyme affected the content of medicinal components during the synthesis of active components in medicinal plants. Previously, Hwang et al. [4] performed the transcriptome sequencing of E. senticosus and analyzed the expression profile of key enzymes in terpenoid synthesis pathway. The key enzymes in the biosynthesis of saponins, including squalene synthase (SS), squalene epoxidase (SE) and mevalonate pyrophosphate decarboxylase (MDD), have been cloned successively [5]. The analysis of single nucleotide polymorphism (SNPs) showed that there were 6 SNP located in the SS gene, but none of them was significantly correlated with the content of total saponins; there were 9 SNPs in SE gene, of which 6 SNPs had a significant effect on the content of total saponins [6]. The analysis of the members of the SS gene family showed that the expression of SS2, the key enzyme in the biosynthesis of triterpene saponins, was significantly correlated to the content of saponins [7]. For MDD, there are significant differences between its mRNA expression and the saponin content even in E. senticosus planted under the same conditions and from the same clone. This indicated that the analysis only based on DNA sequence variation could not completely reveal the molecular mechanism of the differences in the content of saponins. It must be explored in the field of epigenetics besides DNA sequence variations.
DNA methylation is one of the most important epigenetic modifications [8]. At present, the analysis of DNA methylation mostly derived from model species, and just a few from medicinal plants. The genome-wide DNA methylation analysis demonstrated that the DNA methylation level of in vitro cultured embryonic calli of E. senticosus was significantly lower than that of non-embryonic calli which have no regeneration capacity [9]. Bisulfite sequencing results showed that several DNA methylation sites were deposited in the promoters of FPS, SS and SE genes of E. senticosus, which had a certain effect on the synthesis and accumulation of saponins [4].
In this study, the DNA methylation sites in MDD were screened by bisulfite sequencing and the transcriptome sequencing of E. senticosus with different DNA methylation types was carried out to analyze the molecular mechanism of different saponin content in E. senticosus.
2.1 The Extraction of Genomic DNA and the Synthesis of cDNA
The leaves of E. senticosus with similar growth states, same age and growth potential in Wulingshan National Nature Reserve (Chengde, China) were selected as test materials (n = 100). Total RNA and genomic DNA were extracted by an RNAprep pure plant kit (Beijing Tiangen Biotechnology Co., Ltd., China) and a plant genomic DNA kit (Beijing Tiangen Biotechnology Co., Ltd., China), respectively. Total RNA was then reversely transcribed to cDNA by using RevertAid™ First strand cDNA synthesis Kit (Beijing Tiangen Biotechnology Co., Ltd., China).
2.2 Prediction of CpG Island and Analysis of DNA Methylation Sites in the Promoter of MDD
According to the manufacturer’s instruction of the DNA Bisulfite Conversion Kit (TIANGEN Biotech), DNA samples were treated with bisulfite with 3 biological repetitions.
The potential function of the promoter of MDD (GenBank: OL467356) was analyzed by PlantCARE online program [10]. Li et al. [11] were used to predict the CpG island in the promoter of MDD. To amplify the promoter of MDD after bisulfite treatment, the primers were then designed using Prime premier 6 [12]. The primers are listed in Table 1, in which the primers for amplifying the upstream and downstream of CpG island were designated with CMDDJHS2-X4 and CMDDJHS4-X6, respectively. The processed DNA was amplified by PCR with a Methylation-Specific Kit (Beijing Tiangen Biotechnology Co., Ltd., China). The total reaction system was 20 µL with 1.0 µL bisulfite-treated DNA (50 ng/µL), 1.0 µL each prime (15 µm), 1.6 µL dNTPs, 0.4 µL MSP DNA poly and 2.0 µL MSP DNA buffer. The amplification conditions of upstream CpG island were pre-denaturation at 94°C for 5 min, then followed by 40 cycles of Denaturation at 94°C for 20 s, annealing at 54°C for 30 s and extension at 72°C for 15 s, and then supplementary extension at 72°C for 5 m. The reaction for amplifying the downstream CpG island was performed with thermal cycling condition of initial denaturation at 95°C for 5 m, then 40 cycles of 94°C for 20 s, 53°C for 30 s, and 72°C for 40 s, and a final extension at 72°C for 5 m.

After separated by 1.5% agarose gel electrophoresis and purified by an agarose gel DNA Recovery Kit (Beijing Tiangen Biotechnology Co., Ltd., China), PCR products were cloned into PGM-T vector and then transformed into Escherichia coli TOP10 competent cells. From each sample, 10 positive strains were selected for sequencing (Beijing Nosai gene Co., Ltd., China).
BIQ analyzer 2.0 software [13] was used to view and compare the sequences of MDD with or without treatment of bisulfite. Type A, Type B and Type C are grouped according to the DNA methylation ratio of MDD from low to high.
According to the DNA methylation type (Types A, B and C) in the promoter of MDD, mRNA in mature leaves was extracted and grouped. The cDNA library of each sample with 3 biological replicates was constructed and sequenced on the Nova SEQ 6000 sequencing platform (Illumina, USA). The splice sequences in raw data and low-quality reads were removed to obtain high-quality clean data. Each library sequence was then spiced with the Trinity software (http://trinityrnaseq.github.io/). The transcripts with low expression were filtered according to FPKM < 1, TPM < 1, or IsoPct < 5.0%, and then clustered into unigenes using Tgicl (v2.0.6) (https://sourceforge.net/projects/tgicl/). Unigene sequence was compared with the data in Non-redundant (Nr), Swiss-Prot, Gene Ontology (GO), Clusters of Orthologous Groups of proteins (COG), euKaryotic Orthology Groups (KOG), the Kyoto encyclopedia of genes and genomes (KEGG), Pfam database to obtain annotation information.
2.4 Analysis of Transcription Factors Binding to MDD Promoter
PlantTFDB [14] and PlantRegMap [15] were used to predict transcription factors that may bind to the promoter of EsMDD gene with reference to the transcription factors of Nicotiana tabacum. The transcriptome sequencing results of E. senticosus were used to screen the differentially expressed transcription factors, which were then mapped by HeatMap function of TBtools [16]. MEGA7 [17] was used for phylogenetic analysis of the transcription factor families and string [18] was used for protein-protein interaction prediction.
2.5 Expression Analysis of Key Genes in the Process of Terpenoid Synthesis
According to the transcriptome sequencing results, the known key enzyme gene sequences of the terpenoid synthesis pathway of E. senticosus were compared using BLAST. The key enzyme genes of the terpenoid synthesis pathway in the samples were screened, and qRT-PCR primers were designed (Table 1). According to the qRT-PCR primers of the key enzyme genes of E. senticosus terpenoid synthesis pathway in Table 1, the cDNA of the three selected DNA methylation types of E. senticosus samples was used as the template for qRT-PCR reaction with Abiprism 7900-HT (Applied Biosystems, Foster City, CA 94404, USA). Each sample was set with 3 biological replicates. The total reaction system was 10 µL. 2 × Talent qPCR premix was 5.0 µL (Beijing Tiangen Biotechnology Co., Ltd., China). Forward primer was 0.3 µL (primer concentration 15 µm), and reverse primer was 0.3 µL. E. senticosus cDNA template was 0.5 µL (concentration 50 ng/µL), and 50 × Rox reference dye was 1 µL and RNase free H2O was 2.9 µL. The reaction conditions were 95°C pre-denaturation for 3 m with denaturation at 95°C for 5 s, annealing at 55°C for 10 s, and supplementary extension at 72°C for 15 s; The reaction was ended after 40 cycles. The gene expression of each sample was calculated by 2−ΔΔCt method with SDS 2.4 software.
2.6 Content Determination of Total Saponins of E. senticosus
The leaves of E. senticosus with different DNA methylation types were dried and ground, and then shake with 0.5 mL 8% vanillin ethanol solution [19] and 5 mL 72% sulfuric acid solution. The samples were then heated for 10 min at 60°C, and cooled for 15 min in ice bath. The absorbance value of each sample at 534 nm was detected by vanillin-concentrated sulfuric acid coloration method [5]. The total saponin contents were calculated by the regression equation. SPSS 22.0 was used to analyze the correlation between DNA methylation ratio in the promoter of MDD and total saponin content.
2.7 Analysis of DNA Methylation Related Enzymes and Protein Interaction of MDD
According to the transcriptome annotation information, the data of DNA methyltransferase and DNA demethylase genes of E. senticosus were also extracted. The results were then identified by the NCBI-CDD function. MEGA7 and DNA methyltransferase and DNA demethylase in other species were used for phylogenetic analysis.
The string was used to analyze the protein-protein interaction between MDD protein in Arabidopsis and other key enzymes in the terpenoid synthesis pathway.
3.1 DNA Methylation Analysis of MDD Promoter
The results of Li Lab showed that there were 2 CpG islands in the promoter of MDD. The upstream CpG island was in −2265–2148 bp and the downstream CpG island was in −1787–1663 bp. BIQ Analyzer 2.0 software was used to compare the MDD promoter the sequence treated with bisulfite with the untreated DNA sequence. The results showed that there were 10 and 18 DNA methylation sites in the upstream and downstream CpG islands of MDD, respectively (Fig. 1A), The DNA methylation sites in all samples were located at −2267, −2264, −2214, −2176, −2162, −2157, −2100, −1885, −1849, −1769, −1758, −1742, −1715, −1708, −1644, −1519 bp in the upstream of the transcriptional site. The differential methylation sites were located at −2205, −2196, −2130, −1923, −1572, −1430 bp, the methylation sequencing map of −1923 bp site is shown in Fig. S1 for example. There were 3 types of DNA methylation sites, corresponding to DNA methylation ratios, which were designated as Type A, Type B, Type C. There were 18. 19 and 21 DNA methylation sites in samples of Types A, B and C and the methylation rate of cytosine were 0.68%, 0.72% and 0.79%, respectively (Fig. 1B).
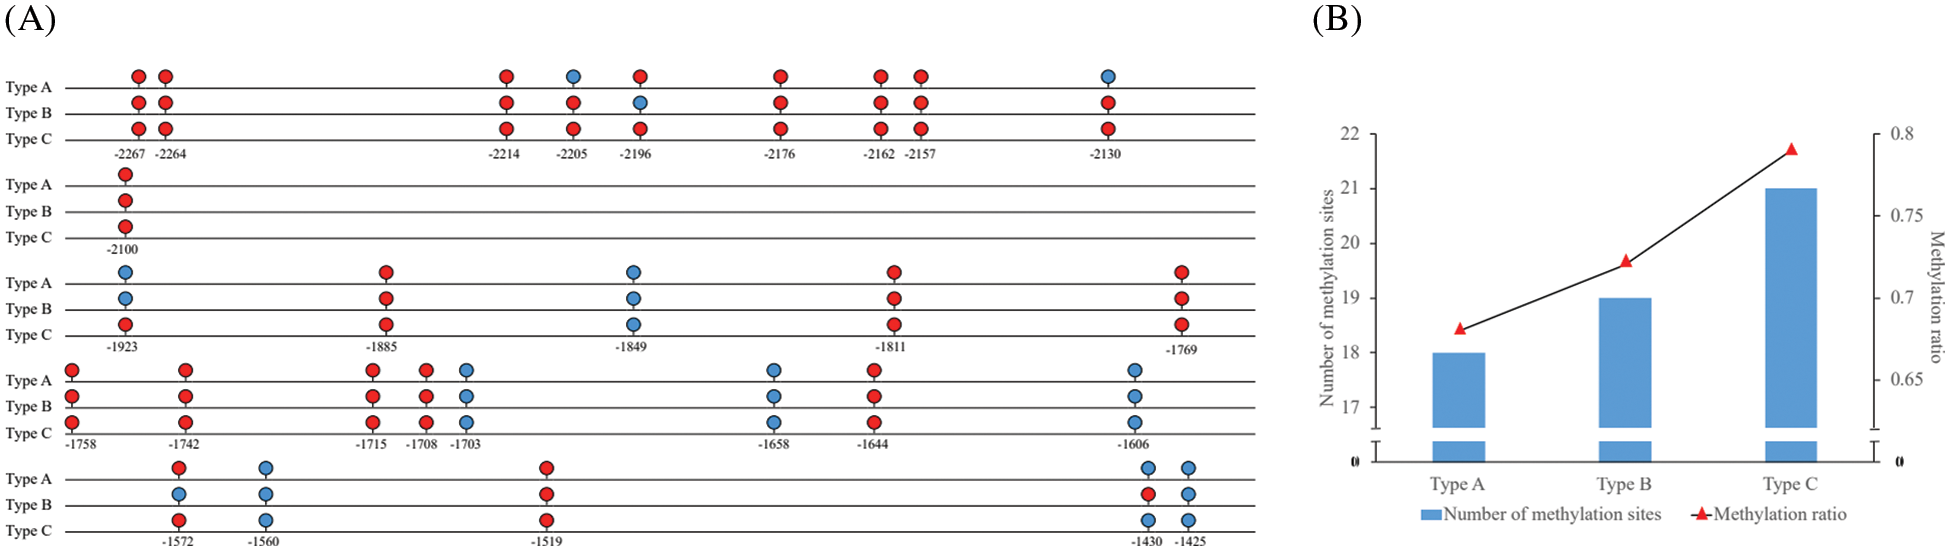
Figure 1: (A): Schematic map of The expression of DNA methylation sites of MDD gene promoter of E. senticosus. Red site is DNA methylation site, and blue site is DNA unmethylated sites; (B): Schematic diagram of number and ratio of methylation sites
3.2 Determination of Total Saponin Content in E. senticosus
The total saponin contents in the 3 groups of samples of Types A, B and C were determined by vanillin-concentrated sulfuric acid method. According to the average absorbance (0.155 ± 0.000471 for Type A, 0.247 ± 0.000816 for Type B, and 0.338 ± 0.000420 for Type C) the total saponin contents of were calculated as 4.65%, 2.32%, and 1.83% for Types A, B and C, respectively. The correlation analysis showed that there was a significantly negative correlation between the DNA methylation ratio of MDD and the saponin content (P < 0.05). The correlation equation was y = −23.532x + 20.112 (R2 = 0.7562), where “y” standed for the saponin content.
3.3 Assembly and Annotation of Transcriptome Sequencing Results
High-throughput transcriptome sequencing was performed on the 3 groups of E. senticosus samples of Types A, B and C on Illumina Nova Seq 6000 platform. After removing junction and low-quality reads, 20.51–29.33 M clean reads and 6.15–8.80 Gb clean bases were obtained. The GC content of all samples was about 43%–45%, and that of all Q30 bases was over 94% (Table 2), which indicated that the quality of sequencing data was acceptable.

Samples are the sample names; Clean reads are the number of Clean reads; Clean bases are the total number of bases in Clean data; GC is the percentage of GC content in Clean data; ≥Q30 is the percentage of bases whose clean data quality values are greater than or equal to 30. Q30 is the percentage of bases with clean data quality values greater than or equal to 30.
Clean reads generated after filtering the transcriptome sequencing data were assembled using the Trinity program. A total of 374,281 transcripts were generated, of which the longest transcript was 17,973 bp, and the shortest was 197 bp. The average length of the transcripts was 303 bp, and the length of the N50 transcript was 243 bp. Further filtering of the low-expressed transcripts, there were 364,816 unigenes with an average length of 284 bp and an N50 of 240 bp (Table 3). The unigenes with lengths between 200–300 bp accounted for the largest proportion of the total (345,555, 94.72%), and unigenes with lengths between 200–1,000 bp, 1,000–2,000 bp and 2,000–3,000 bp accounted for 97.57% (355,956), 1.51% (5,497) and 0.62% (2,258) of the total, respectively. In addition, the length of 1,105 (0.30%) unigenes were longer than 3,000 bp (Table 3)

Types are the type listed; Unigenes were unigenes obtained after assembly and filtration; Transcripts are transcripts obtained after assembly; Total sequence number is the total number of sequences; Total sequence length is the total length of all sequences; Maximum length is the maximum length of the assembled sequences; Minimum length is the minimum length of the assembled sequences; Average length is the average length of all sequences obtained from the assembly; GC% is the sum of the number of GC bases as a percentage of the total number of bases; N50: the length of the assembled transcripts sorted from longest to shortest, and the length of the transcripts accumulated to 21%–50% of the total length.
The assembled unigenes sequences were compared with the data in KEGG, NR, Swiss-Prot, GO, COG, KOG and Trembl databases by BLAST program. Amino acid sequences of unigenes were compared with the data from Pfam database using HMMER software to obtain the annotation information. The results are shown in Fig. 2A. A total of 192,820 unigenes were annotated by at least 1 of the above 7 databases, accounting for 52.85% of the total unigenes. In the NR database, 177,470 (48.65%) unigenes were annotated, and the highest matching rate was obtained, and the COG was the least annotated with 64,532 (17.69%). Comparing with the NR database, it was found that the single gene sequence of E. senticosus showed the highest match rate (4.69%) with that of Daucus carota, and the lowest match rate with Ramularia collo-cygni (1.22%) (Fig. 2B).
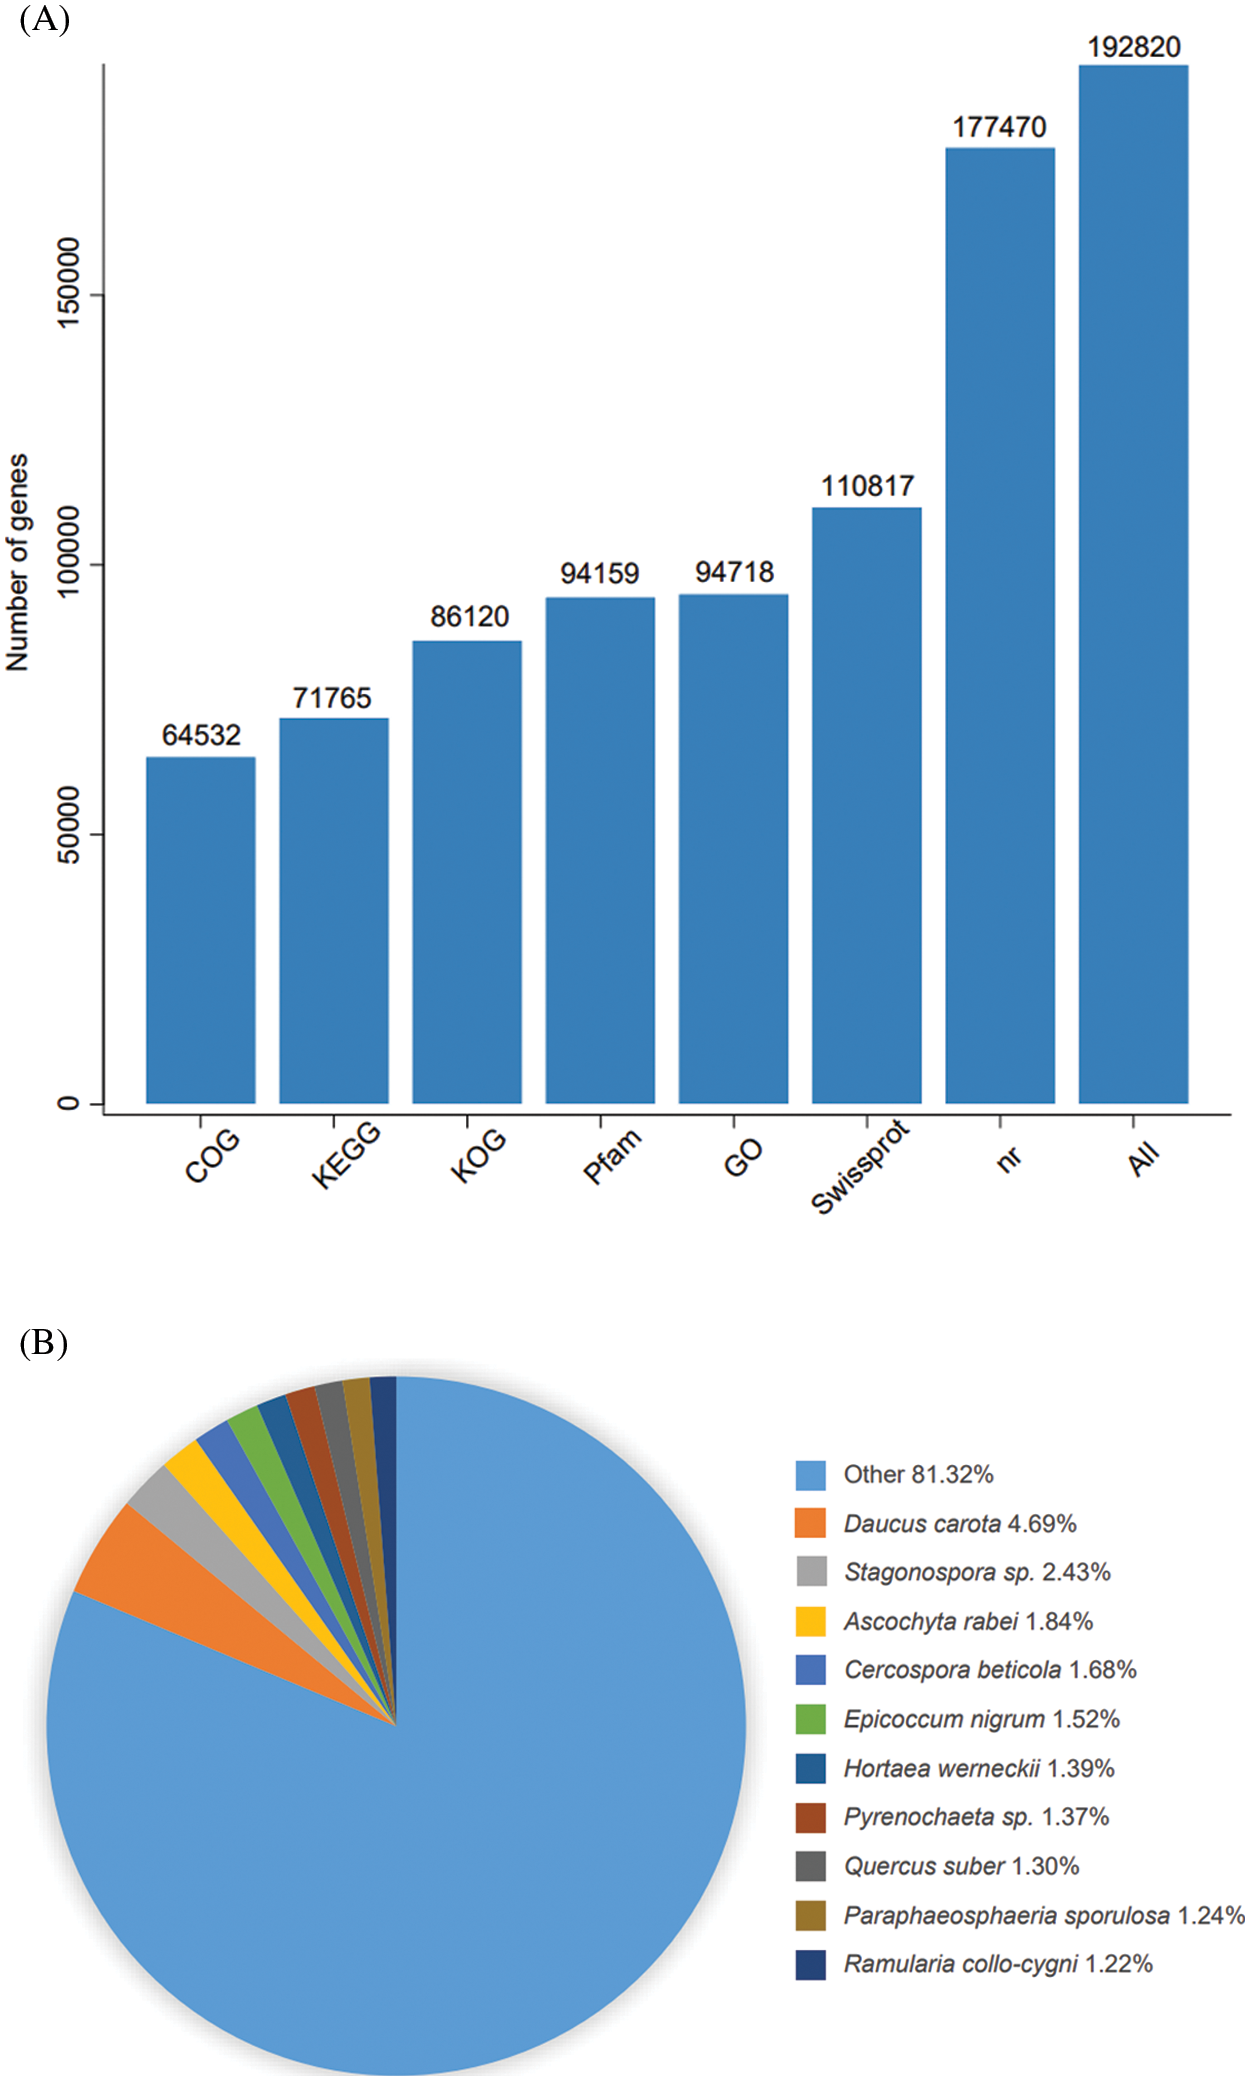
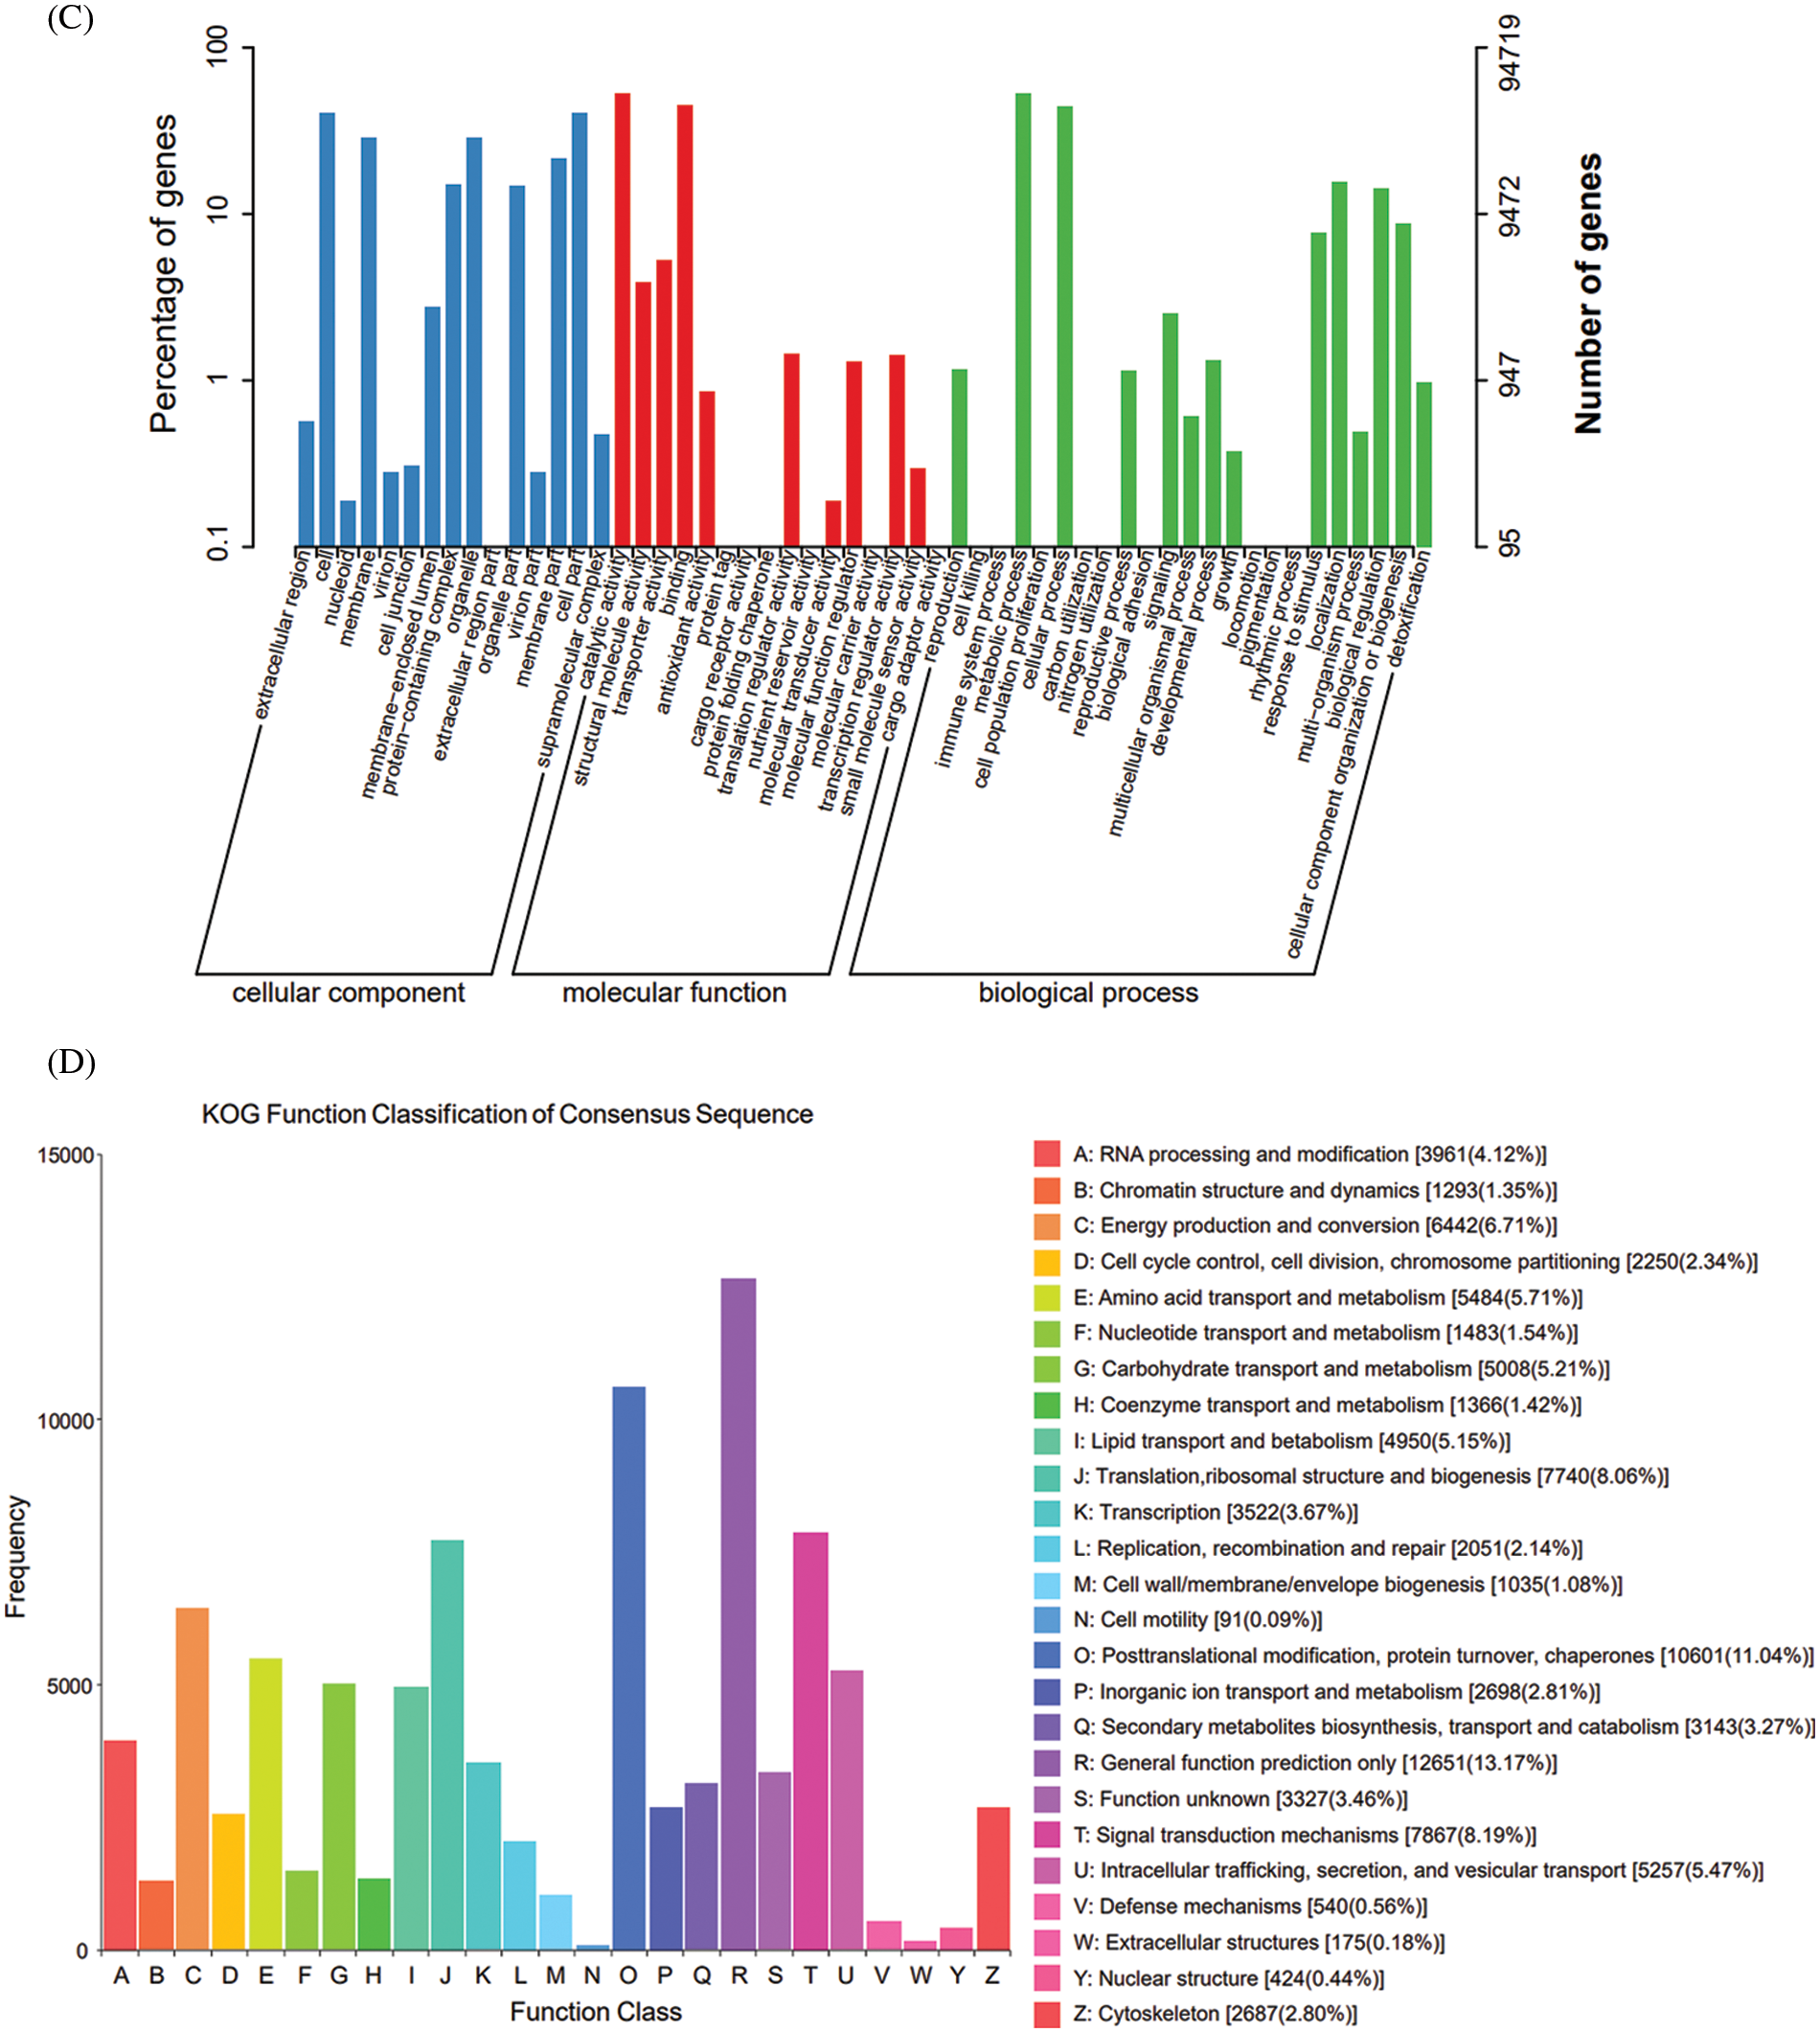
Figure 2: Annotation map of the transcriptome of E. senticosus. (A): annotation of Unigenes in 7 databases; (B): annotation results of Nr database; (C): annotation results of GO database; (D): annotation results of KOG database
A total of 364,817 unigenes were divided into 3 groups and 54 classes in the GO database according to their functions. The cellular component group mainly includes cells (cell, 38,186), membranes (membrane, 27,338) and organelles (organelle, 27,408); the molecular function mainly involves the catalytic activity (50,432), binding (42,708) and transporter activity (3,699). The biological process mainly involves metabolic process (50,154), cellular process (42,115) and localization (14,885) (Fig. 2C). Only 13.17% of Unigene annotation information in KOG was annotated to General function prediction, and only 0.09% annotated to cell motility (Fig. 2D).
3.4 Identification and Validation of Differentially Expressed Genes in the Terpenoid Synthesis Pathway
The transcriptome sequencing data were used to screen differentially expressed genes (DEGs) among samples of Types A, B and C with FDR < 0.01 and | log2 FC | ≥ 1 as the screening criteria. A total of 4,618 DEGs were detected in the Type A vs. Type C, with 2,203 up-regulated genes and 2,415 down-regulated genes; a total of 345 DEGs were detected in the Type B vs. Type C, with 116 up-regulated genes and 229 down-regulated genes; a total of 4,657 DEGs were detected in the Type A vs. Type B, including 2,228 up-regulated genes and 2,429 down-regulated genes. Among these, 719 DEGs were differentially expressed in Type A and Type B only, 683 DEGs in Type A vs. Type C only, and 25 DEGs in Type B vs. Type C only (Fig. 3A). A total of 91 DEGs were differentially expressed in the all 3 types (Fig. 3B). These findings suggested that there was a significant difference in transcript expression among samples of Types A, B and C.
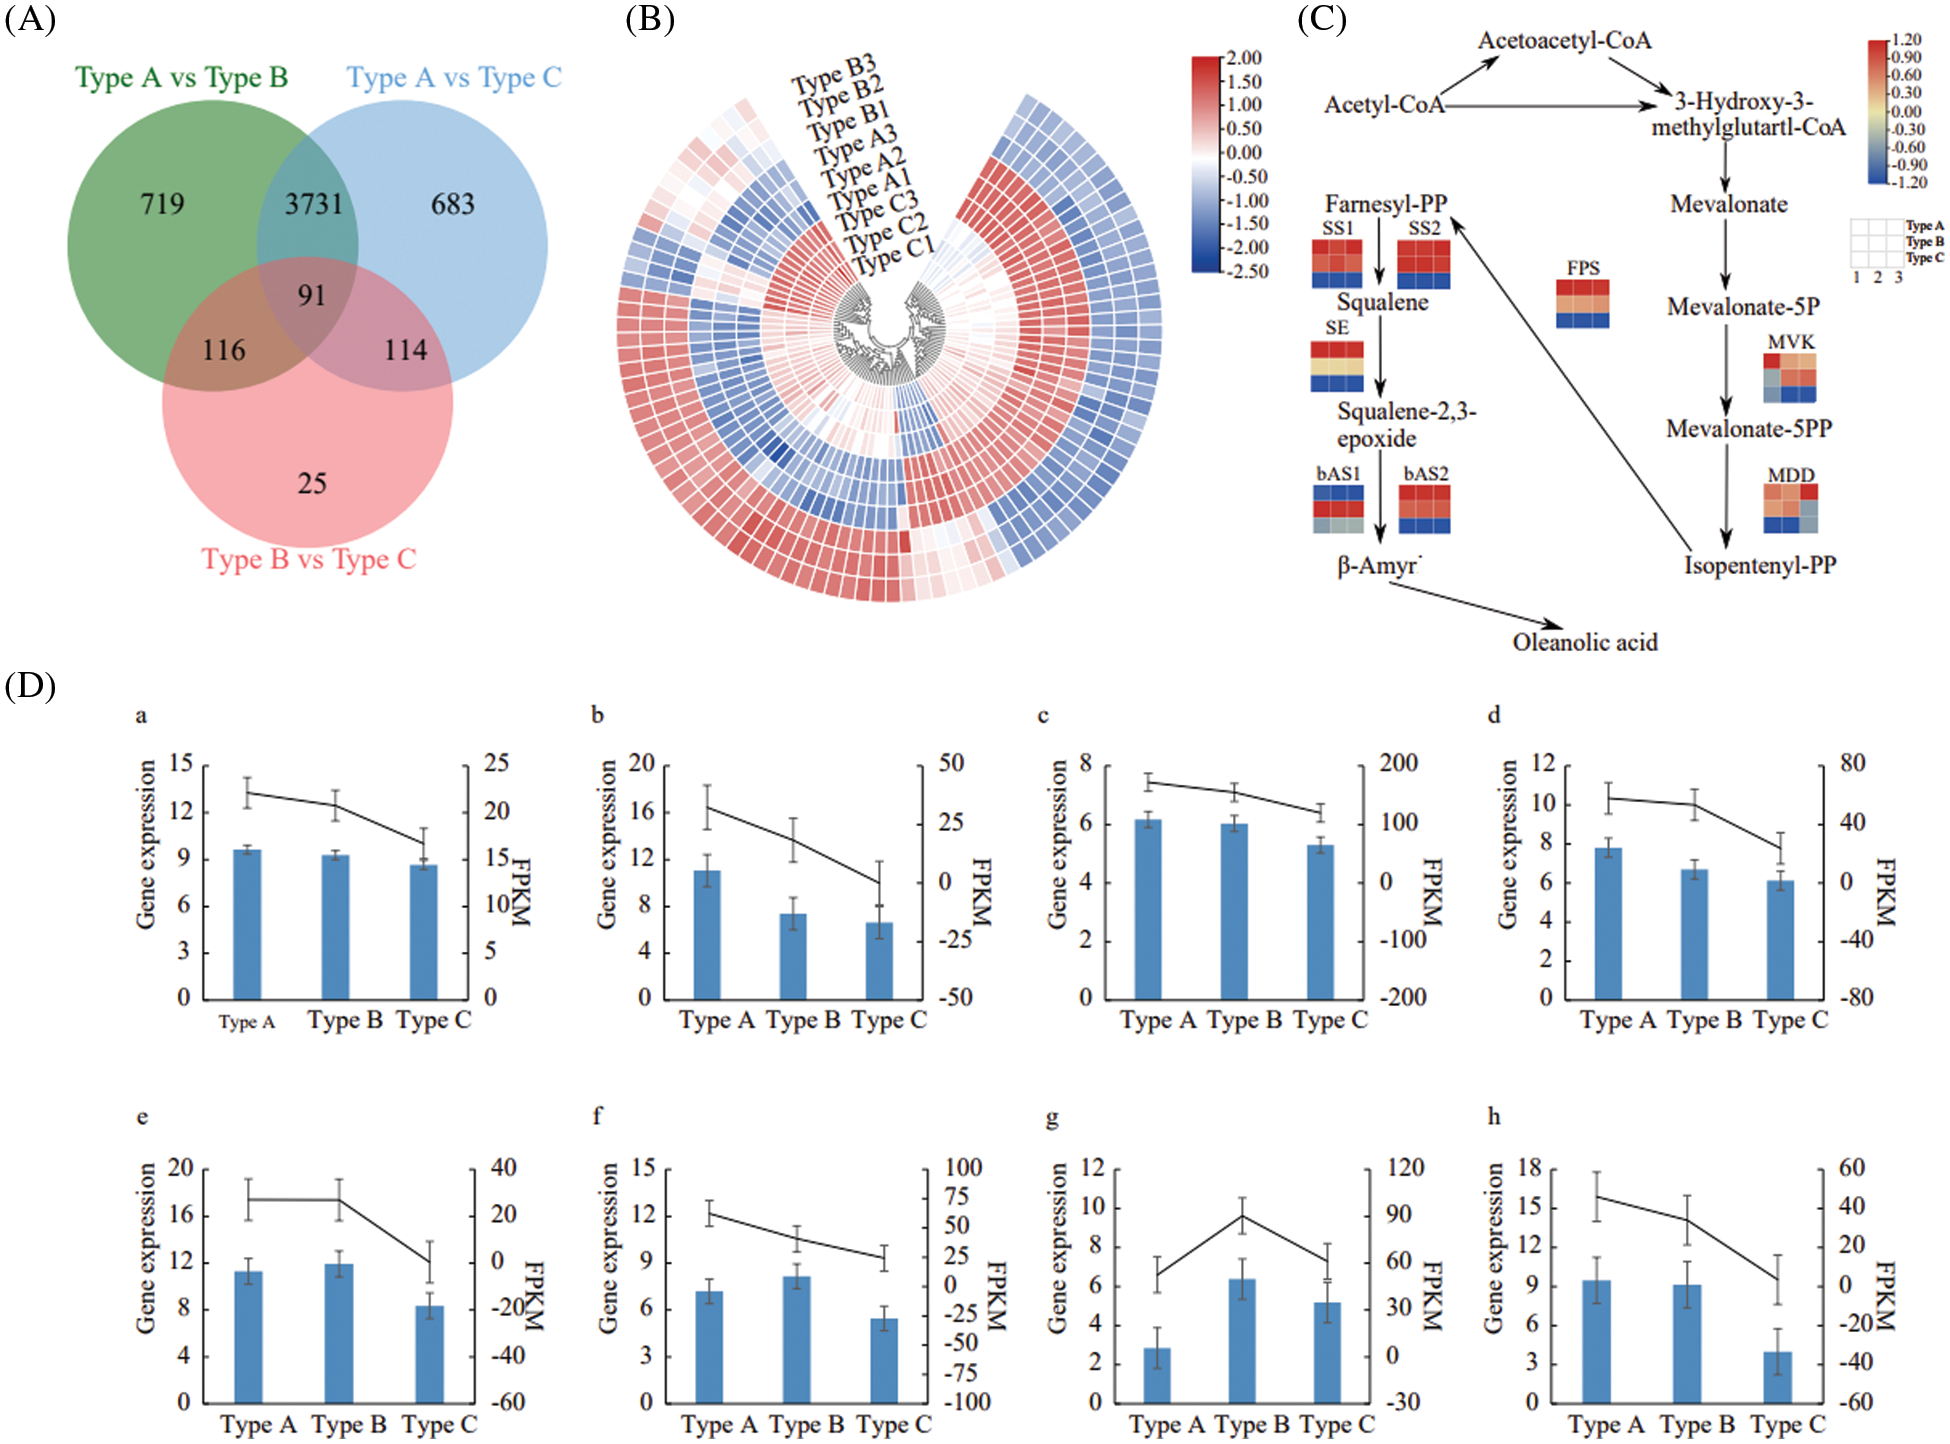
Figure 3: Effect of E. senticosus MDD promoter DNA methylation on gene expression. (A): statistical map of differential genes of the transcriptome; (B): clustering map of 91 DEGs differentially expressed in all 3 groups of samples; (C): analysis of gene expression of key enzymes of the transcriptional terpenoid synthesis pathway; (D): qRT-PCR validation results of key enzyme genes of terpenoid synthesis pathway: blue bars are qRT-PCR gene expressions, and black lines are the FPKM value of the relative gene expression of the transcriptome. (a): MVK; (b): MDD; (c): FPS; (d): SS1; (e): SS2; (f): SE; (g): bAS1; (h): bAS2
In plants, MVK (Mevalonate kinase), MDD, FPS (Farnesyl pyrophosphate synthase), SS, SE, and bAS (β-amyrin synthase) are key enzymes which involved in the terpenoid synthesis. Eight differentially expressed genes were screened according to the KO numbers of the above 6 genes in 3 groups. The further judgment showed that the sequences of FPS and SS1 and SS2 in the transcriptome sequencing data were the same with those obtained by cloning in our previous study [5]. All seven genes, except bAS, were highly expressed in the Type A, but low expressed in Type C. These expression patterns showed a significant negative correlation with the DNA methylation ratio of E. senticosus MDD gene promoter (P < 0.05). In contrast, among the bAS gene family, bAS2 was significantly negatively correlated with the DNA methylation ratio of MDD (P < 0.05) and positively correlated with the saponin content (P < 0.05), but bAS1 was not (Fig. 3C).
To verify the reliability of the transcriptome data, eight differentially expressed genes involved in terpenoid synthesis were validated by qRT-PCR. The results showed that the trends of the relative expression of differentially expressed genes were all consistent with the transcriptome sequencing data, which indicating the reliability of transcriptome sequencing results (Fig. 3D).
3.5 Analysis of the E. senticosus MDD Gene Promoter Cis-Acting Element and Binding Prediction of Differentially Expressed Transcription Factors
The results of predicted cis-acting elements in the promoter of MDD are shown in Table 4. In addition to TATA-box and CAAT-box, the largest number of elements were related to light response, such as TCT-motif and Box-4. Other cis-acting elements were responded to drought, gibberellin, methyl jasmonate, and abscisic acid (Fig. 4).

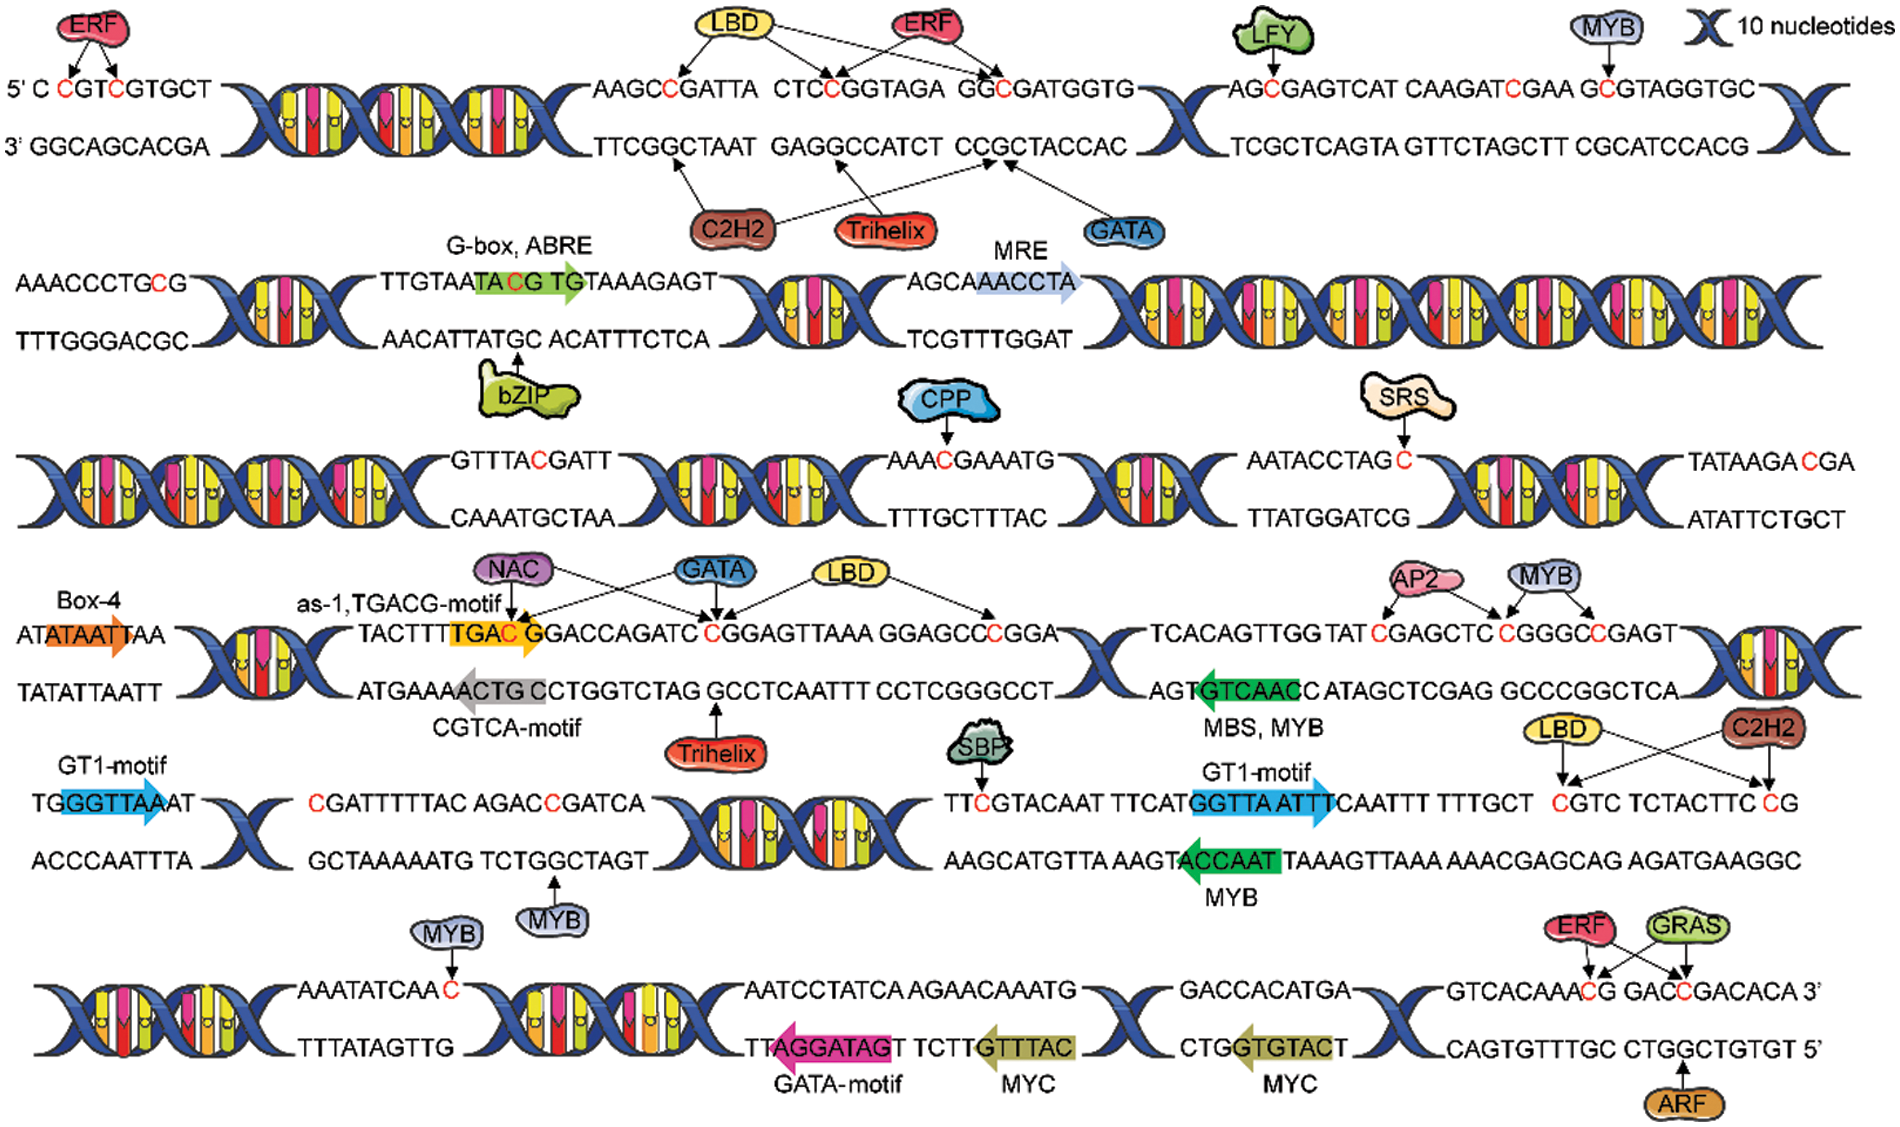
Figure 4: Binding prediction of transcription factors with E. senticosus MDD promoter region and cis-acting elements prediction (−2268 to −1419 bp)
PlantTFDB was used to predict the transcription factor binding sites in the promoter region of E. senticosus MDD with Nicotiana tabacum as the reference. The results showed that the promoter region of MDD could bind to 34 of 324 transcription factors. Among them, 15 can bind to DNA methylation sites in CpG island (Fig. 4). Nineteen of 120 differentially expressed transcription factors binding to MDD promoter were found among samples with different DNA methylation types of MDD. Sixty-two were positively correlated with the DNA methylation ratio, while 58 were negatively related with it (Fig. 5A).
Among the 28 DNA methylation sites, 5 sites did not have bindable transcription factors (−2162, −1923, −1811, −1742, −1658 bp). Among the remaining 23 sites, only 4 sites (−2205, −2196, −1572 and −1430 bp sites) have differences in methylation status across three types, which was likely to bind to four gene families, including ERF (Ethylene-responsive factor), LBD (Lateral Organ Boundaries Domain), C2H2 (Cys2/His2-type zinc finger protein) and GRAS. Among them, 18 members of ERF gene family mainly bind to −2205 bp and −2196 bp sites, and a small number of them bind to −1430 bp sites. There were 9 members of LBD family, mainly binding to −2205 bp and −2196 bp sites, and a small number of them binding to −1572 bp site. In addition, 1 member of the C2H2 gene family is combined with −2196 bp and −1572 bp sites, and 1 member of the GRAS gene family is combined with −1430 bp site.
The cluster analysis showed that the above 4 differentially expressed transcription factors were significantly different across different DNA methylation types of MDD (P < 0.05), which were mainly divided into 2 expression patterns. The first one was high expression in Type A and low expression in Type C. The second one was low expression in Type A and high expression in Type C. ERF and GRAS mainly showed in the second expression pattern, while LBD and C2H2 mainly showed in the first expression pattern. But there are also some exceptions. For example, EsERF1 (TRINITY_DN14850_c2_g1), which belongs to ERF family, appeared in the first expression pattern; EsLBD1-1 (TRINITY_DN10977_c0_g1) and EsLBD1-2 (TRINITY _ DN10977_c0_g2), which were LBD family members, showed in the second pattern and the first pattern, respectively (Fig. 5B).
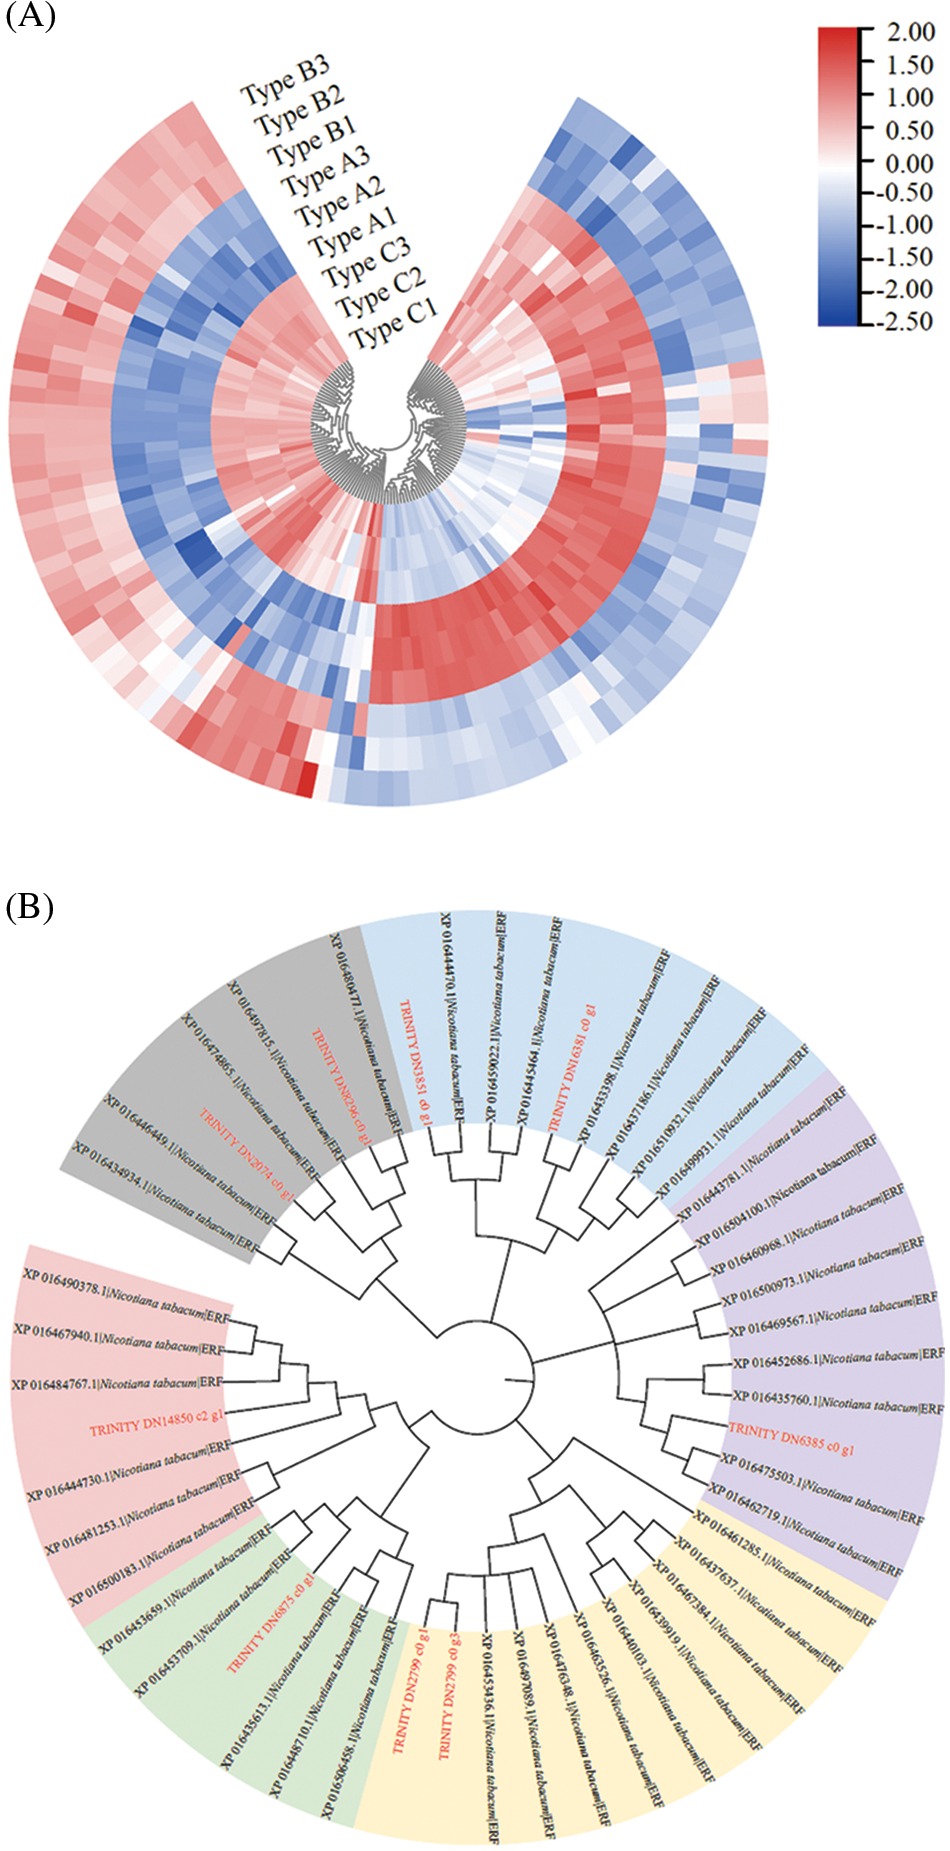
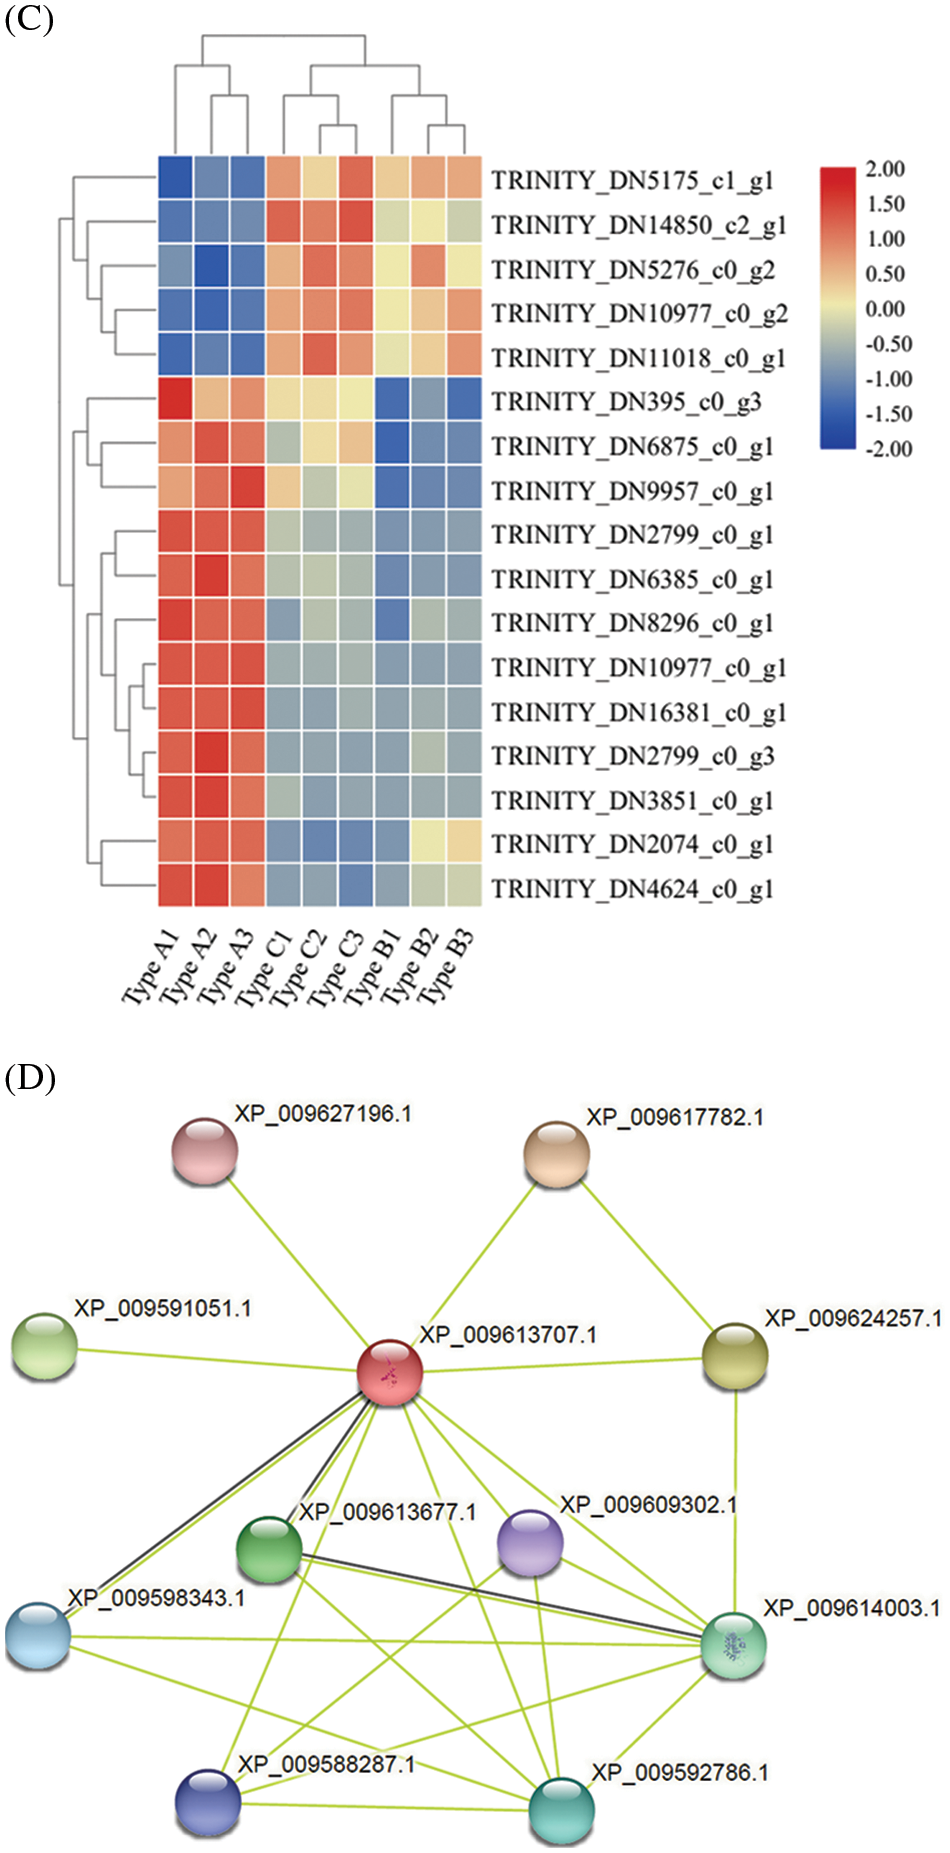
Figure 5: Effect of E. senticosus MDD promoter DNA methylation on transcription factor expression and protein interactions analysis (A): Differential transcription factor analysis of 3 E. senticosus MDD promoter DNA methyl types; (B): Cluster analysis of differentially expressed transcription factors in promoter methylation sites of E. senticosus MDD gene; (C): Clustering diagram of ERF genes differentially expressed in E. senticosus MDD promoter region and N.tabacum ERF gene family. ERF genes differentially expressed in the E. senticosus MDD promoter region are labeled in red; members of the N.tabacum ERF family are labeled in black, and different colored regions represent ERF members of different subfamilies. (D): Protein interaction analysis of LBD transcription factor at −1572 bp site of E. senticosus MDD promoter. Green lines represent interaction and black lines represent co-expression
After that, the second most differentially expressed transcription factors, ERF and LBD, were also analyzed. Phylogenetic analysis was performed using the N. tabacum ERF gene family in PlantTFDB with differentially expressed ERFs in the promoter region of the E. senticosus MDD. After the comparison with ClustaW, the NJ method is used 1500 times to construct the phylogenetic tree, and the results are shown in Fig. 5C. The ERFs of E. senticosus were divided into several different subfamilies, in which EsERF1 was a member of a different subfamily from the other E. senticosus ERF members. EsLBD1-1 and EsLBD1-2, which belong to the LBD family and are different transcripts of the same gene, were identified to have a binding site at −1572 bp after comparing with the N. tabacum LBD. Protein-protein interaction analysis was performed on the LBD members bound to this site, and the results were shown in Fig. 5D. The members at this site interacted with bHLH (Basic helix-loop-helix, XP_009609302.1), ERF (XP_009588287.1) and KNOX (Knotted1-like homebox, XP_009613677.1, XP_009598343.1, XP_009617782.1).
3.6 Analysis of DNA Methyltransferase and Demethylase in E. senticosus
DNA methylation is affected by many factors, among which DNA methyltransferase and DNA demethylase have a direct effect on it. Due to the lack of key information of DNA methyltransferase in N. tabacum, the DNA methyltransferase gene of A. thaliana and the DNA demethylase of Lonicera japonica are used as the identification standard. The comparison method is ClustaW, and the test is carried out 1500 times by using the NJ method to construct the phylogenetic tree. The results are shown in Fig. 6A. A total of 1 DNA methyltransferase gene, named EsMT0 (TRINITY_DN4200_c0_g1), and 1 DNA demethylase gene, named EsDM0 (TRINITY_DN722_c1_g1), were identified in E. senticosus. Clustering analysis of the 2 genes showed that EsMT0 clustered with the DNA methyltransferase of A. thaliana, while EsDM0 clustered with the DNA demethylase of L. japonica.
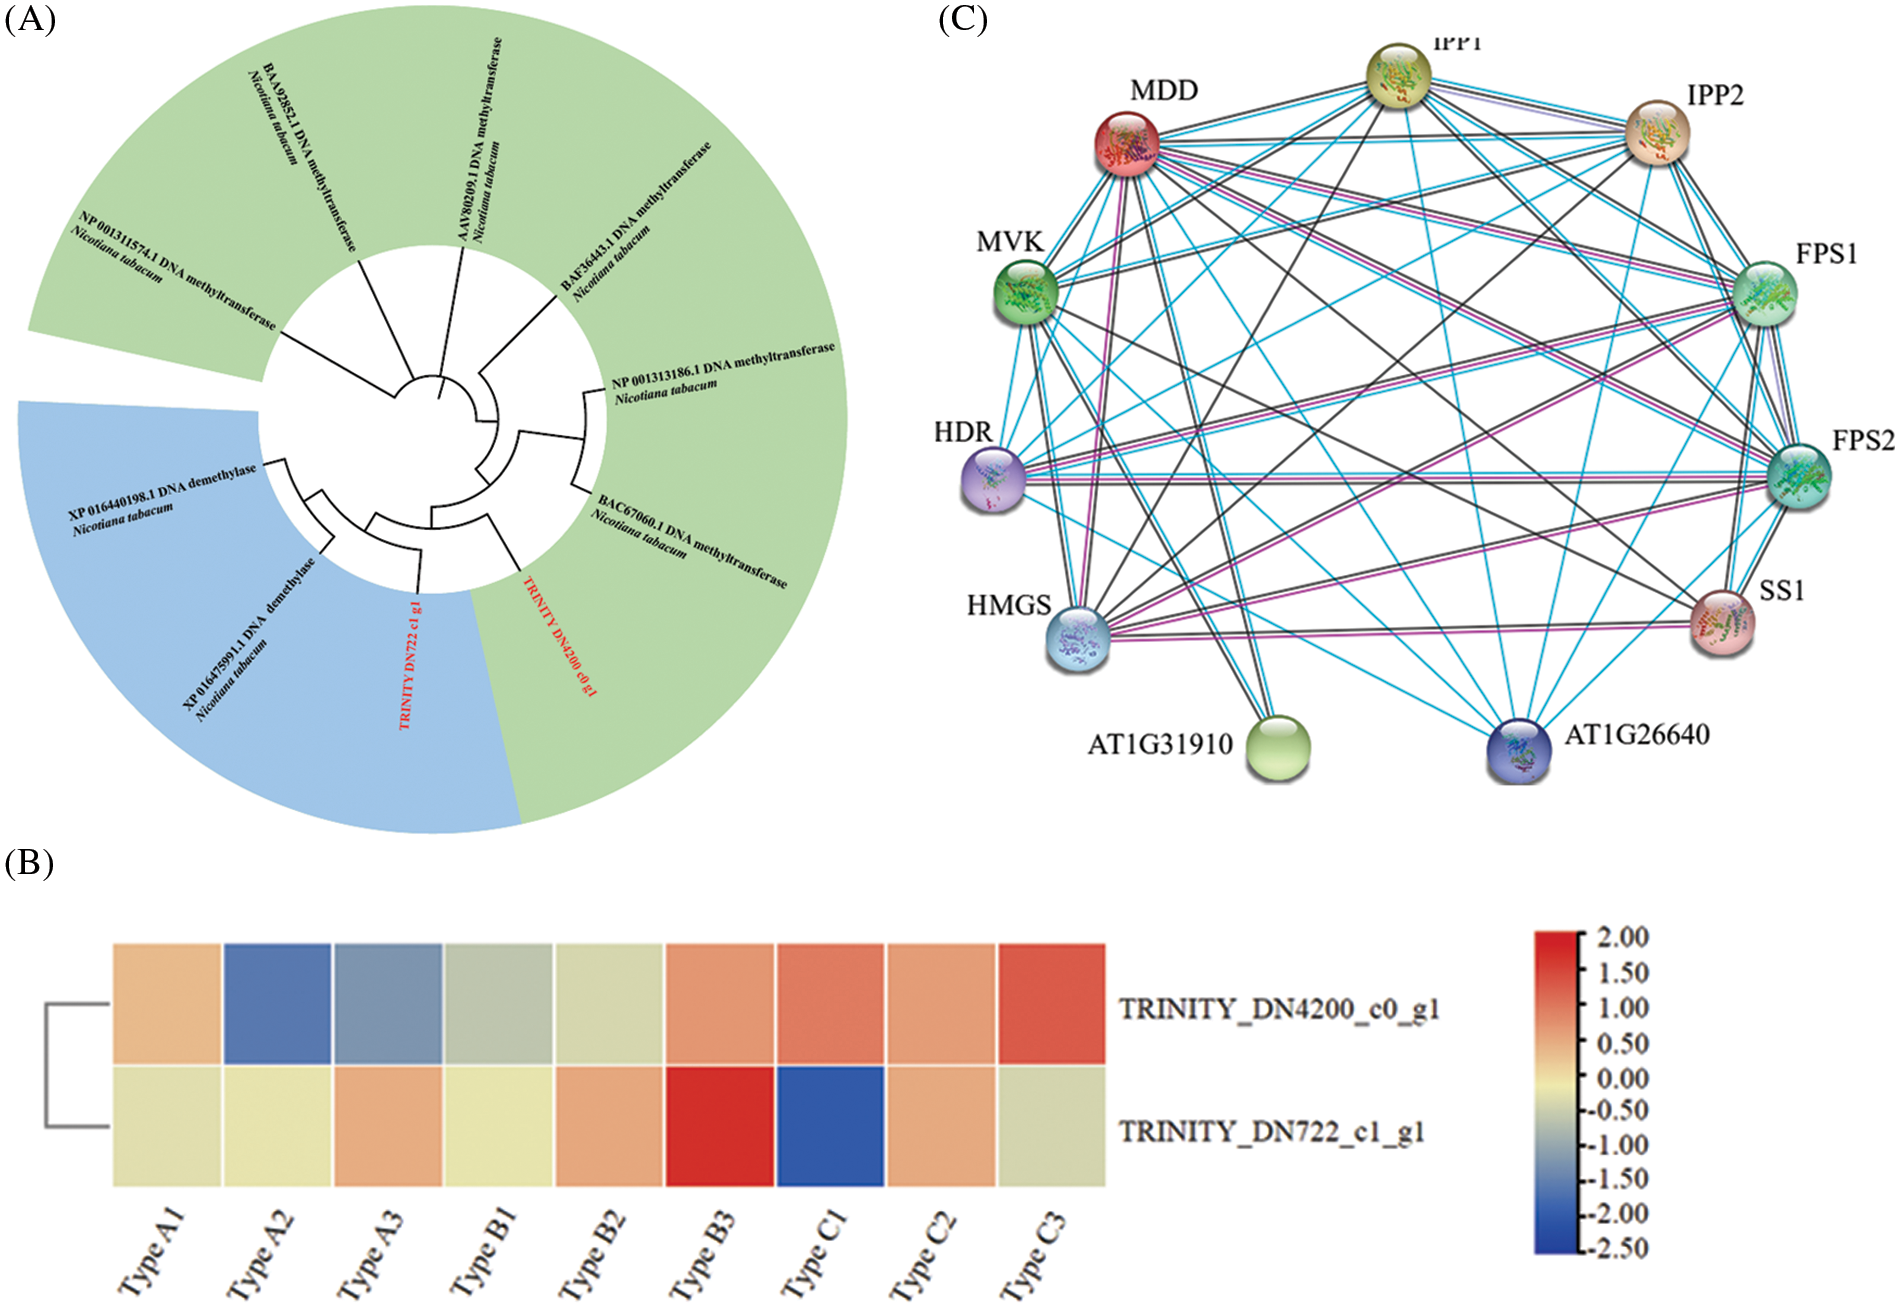
Figure 6: DNA methyltransferase/demethylase analysis and protein interaction analysis of MDD in A. thaliana (A): Identification and analysis of DNA methyltransferase in E. senticosus; (B): Heat map of DNA methyltransferase and demethylase expression in E. senticosus; (C): MDD protein interaction in A. thaliana. Red lines represent experimentally validated interactions; blue lines represent interactions validated by databases; black lines represent co-expression, and purple lines represent homology
Analysis of the differential expression of these 2 genes in the 3 groups of samples revealed that the DNA methyltransferase gene EsMT0 was significantly correlated with the methylation ratio (P < 0.05), and it was significantly low expressed in Type A and significantly high expressed in Type C. Its expression was significantly and positively correlated with the methylation ratio; while EsDM0 did not show a significant correlation with DNA methylation ratio (Fig. 6B). Meanwhile, another 22 methyltransferases and 20 demethylases were found in the proteome of E. senticosus (Table S1, Table S2), but the genes corresponding to these enzymes were not differentially expressed in the transcriptome.
The protein-protein interaction analysis of MDD in A. thaliana was performed using String program, and the results were shown in Fig. 6C. MDD interacts with multiple genes in the terpenoid synthesis pathway, including HMGS, HDR, MVK in the upstream, IPP1 and its homologous genes IPP2, FPS1, FPS2 and SS1 in the downstream. AT1G31910 and AT1G26640 are unclassified proteins.
This study discovered the effect of DNA methylation in the promoter region of E. senticosus MDD on the expression of key genes related to saponin synthesis and the content of saponin. The results showed that with the increase of DNA methylation ratio, the expression of E. senticosus MDD was significantly down-regulated, and the expression of key genes related to terpenoid synthesis pathway, such as EsFPS, EsSS and EsSE, were also significantly reduced, and the content of saponin was also decreased, which was basically consistent with the results of Wang et al. [4]. The expression of bAS1 was not significantly correlated with the methylation ratio of MDD, while that of bAS2 was significantly correlated with the ratio, which was consistent with previous studies on the correlation between bAS expression and saponin content in E. senticosus [20].
Plant growth and development processes are closely related to DNA methylation, and in DNA methylation studies on Glycine max [21], A. thaliana [22] and Citrus reticulata [23], DNA methylation ratios were found to be positively correlated with their growth and development. Studies on Brassica rapa showed that DNA methylation modifications are necessary for plant growth [24]. One of the factors affecting DNA methylation/demethylation is temperature. The trend of DNA methylation/demethylation varies among different species, even among different parts within the same species and tissues. For example, the ratio of DNA methylation was increased in Fragaria x ananassa under the low-temperature stress [25], while decreased in A. thaliana under the same condition [26]. After low-temperature treatment on 4 varieties of Cannabis sativa [27], it was found that there were differences in DNA methylation among different varieties. The study of Oryza sativa [28] showed that there were differences in DNA methylation among different tissues. As one of the environmental signals, the temperature may lead to DNA methylation changes in some sensitive genes [29]. Therefore, it is speculated that MDD may be a low-temperature sensitive gene. The regulatory mechanism derived to enhance the tolerance to low temperature can be seen in the 2 calmodulin-binding transcription activator CAMTA transcription factors (TRINITY_DN15573_c0_g3, TRINITY_DN45924_c0_g4) that bind to the promoter region of E. senticosus MDD. This transcription factor has been confirmed to be involved in cold adaptation regulation [30]. The low temperature-responsive element as-1 was found in CpG island region and covered –1796 bp DNA methylation site. That may explain why there were still significant differences in DNA methylation status and saponin content among samples with similar growth status, age and growth potential. Hwang and his colleges demonstrated that the expression of SE, bAS, CYP (Cytochrome P450s), UGT (UDP-glycosyltransferases), which involved in the process of terpenoid synthesis, were significantly up-regulated after treatment with MeJA [7]. In present study, MeJA responsive elements were also found in the promoter regions of MDD in E. senticosus, which suggesting that MeJA might be a key element in regulating terpenoid synthesis.
One of the determinants of gene expression is the transcription factor, which selects genes for transcription or inhibition by recognizing the base sequence of the gene promoter region. DNA methylation in the promoter CpG island region is thought to inhibit the binding of transcription factors to the promoter, silencing gene expression [31]. However, recent studies have shown that DNA methylation might inhibit, promote or have no effect on the binding capability of transcription factor [32]. In this study, transcription factors ERF, LBD, GRAS, and C2H2 was significant correlated with the the DNA methylation. The expression of ERF and GRAS was significantly inhibited by DNA methylation, while LBD and C2H2 tended to be promoted by it. LBD is involved in the growth and development of plant organs, and its expression was positively correlated with the growth in Phyllostachys heterocycle [33], which indicating LBD might be positively correlated with the DNA methylation ratio. EsLBD1-1 and EsLBD1-2 are different transcripts in LBD family; however, their expression patterns are opposite, which may be due to protein interaction with bHLH transcription factor. In plants, bHLH plays an important role in signal transduction, growth, development and stress responses [34,35]. In recent years, bHLH has been proved to be involved in regulating the biosynthesis of secondary metabolites in medicinal plants. The full length of bHLH in various medicinal plants have been cloned, including Panax ginseng [36] and Panax notoginseng [37], which belong to Araliaceae, the same family with E. senticosus. The study of LBD in A. thaliana showed that bHLH could reduce the binding ability of LBD to DNA and inhibit its expression through protein interaction [38]. In the prediction of transcription factors, it was also found that there was a binding site of bHLH in the promoter region of E. senticosus MDD, which was located in the middle and lower reaches near 3’ end. Through the prediction of Strings, it was also found that there was a protein-protein interaction between LBD and bHLH, which indicated that bHLH might indirectly affect the expression of E. senticosus MDD by affecting LBD.
ERF belongs to AP2/ERF superfamily. ERF is mainly involved in various stress responses of plants, such as low-temperature stress [39], drought stress [40], and salt stress [41]. After Gossypium hirsutum ERF was introduced into A. thaliana for overexpression, transgenic A. thaliana plants grew slowly and showed dwarf phenotype [42], which indicated that ERF might be negatively correlated with plant growth. With the relationship between DNA methylation and plant growth, it can be speculated that ERF was mainly negatively correlated with DNA methylation ratios, while EsERF1 showed the opposite expression pattern. In the study of Carica papaya, it was found that there were multiple subfamilies of ERF, and the expression patterns were different among different subfamilies [43]. Therefore, EsERF1 may present different expression patterns with other ERF subfamilies.
Studies based on methyl-SELEX and bisulfite-SELEX analysis of the sensitivity of human transcription factors to DNA methylation showed that most C2H2 and GATA family members preferred to recognize binding sites with DNA methylation modification, which indicated that C2H2 and GATA transcription factors might be positively correlated with DNA methylation ratios. Besides, DNA methylation in the binding region decreases the binding capability of MYB, bZIP, and HSF families to the recognized sequences [44]. TRINITY_DN5175_c1_g1 and TRINITY_DN5276_c0_g2 belong to C2H2 and GATA family, respectively. They both had a positive correlation with DNA methylation ratios. The binding sequence of MYB was near the 3’ of non-CpG island region, and the bZIP binding sequence was located in the 5’ of non-CpG island region. The HSF binding region was between –2264 bp and –2214 bp, without covering the DNA methylation site. The binding tendency of the above transcription factors is consistent with previous studies.
In the analysis of DNA methyltransferase and DNA demethylase in E. senticosus, it was found that there was no significant correlation between DNA demethylase and methylation ratio, while DNA methyltransferase EsMT0 showed a significant positive correlation. In the study of Citrus reticulata, it was found that the increase in DNA methylation level was due to the decrease of demethylase rather than the increase of methyltransferase [23]. Therefore, it was speculated that these two enzymes had different methylation regulating modes in different species. In other words, some species were mainly affected by DNA methyltransferase, some were mainly affected by demethylase, and some might work together. Based on this study, it could be inferred that the process of DNA methylation in E. senticosus was mainly regulated by DNA methyltransferase.
Previous studies in plants showed that the expression levels of the key genes on terpenoid synthesis pathway, such as Hevea brasiliensis [45] and Picrorhiza kurroa [46], changed in the same trend. In recent studies, it was found that the expression levels of key enzymes in the terpenoid synthesis pathway of plants and animals such as Dendroctonus and armandi also changed in the same trend [47]. The analysis of protein-protein interaction with MDD in A. thaliana showed that there was interaction and co-expression relationship between the key enzymes in the terpenoid synthesis pathway, which may explain the above expression trend. It can be speculated that the MDD with different methylation status affected its own expression and regulated the expression of other key genes in the process of terpenoid synthesis through protein-protein interaction and co-expression.
The CpG island of MDD promoter in E. senticosus was subjected to DNA methylation at specific sites, which affected the binding activity of specific transcription factors and regulated the expression level of MDD. In this study, 28 DNA methylation sites were found in the promoter of MDD, of which −2205, −2196, −1572, −1430 bp sites were differentially methylated. The DNA methylation rates of cytosine were 0.68% for Type A, 0.72% for Type B and 0.79% for Type C. The content of saponins was significantly negatively correlated with the methylation ratio. Except for bAS1, the key genes in terpenoid synthesis pathway were significantly negatively correlated with the methylation ratio. The 4 transcription factors can bind to 4 methylation modification sites, and the expression of them was significantly correlated with DNA methylation ratios and might be affected by the protein interaction of other transcription factors. Analysis of DNA methyltransferases/demethylases in E. senticosus suggested that methyltransferases might play a dominant role in the process of methylation of MDD promoter, and the change of DNA methylation status might affect the expression of other genes in the terpenoid biosynthesis pathway through protein-protein interaction.
Authorship: The authors confirm contribution to the paper as follows: study conception and design: Zhaobin Xing, Yuehong Long; data collection: Minghui Cui, Jie Zhang, Xin Song, Shuo Wang, Jing Dong, Xuelei Zhao; analysis and interpretation of results: Minghui Cui, Limei Lin; draft manuscript preparation: Minghui Cui, Limei Lin, Zhaobin Xing, Yuehong Long. All authors reviewed the results and approved the final version of the manuscript.
Funding Statement: This research was funded by Natural Science Foundation of Hebei Province, Grant No. H2020209302 and Hebei Education Department Sponsored Scientific Research Projects, Grant No. ZD2019075.
Conflicts of Interest: The authors declare that they have no conflicts of interest to report regarding the present study.
References
1. Jia, A., Zhang, Y., Gao, H., Zhang, Z., Zhang, Y. et al. (2021). A review of Acanthopanax senticosus (Rupr and Maxim.) harms: From ethnopharmacological use to modern application. Journal of Ethnopharmacology, 268(3), 113586. DOI 10.1016/j.jep.2020.113586. [Google Scholar] [CrossRef]
2. Huang, L., Zhao, H., Huang, B., Zheng, C., Peng, W. et al. (2011). Acanthopanax senticosus: Review of botany, chemistry and pharmacology. Pharmazie, 66, 83–97. DOI 10.1002/chin.201125219. [Google Scholar] [CrossRef]
3. Murthy, H. N., Kim, Y., Georgiev, M. I., Paek, K. (2014). Biotechnological production of eleutherosides: Current state and perspectives. Applied Microbiology and Biotechnology, 98(17), 7319–7329. DOI 10.1007/s00253-014-5899-9. [Google Scholar] [CrossRef]
4. Hwang, H. S., Lee, H., Choi, Y. E. (2015). Transcriptomic analysis of Siberian ginseng (Eleutherococcus senticosus) to discover genes involved in saponin biosynthesis. BMC Genomics, 16(1), 180. DOI 10.1186/s12864-015-1357-z. [Google Scholar] [CrossRef]
5. Wang, Z., Guo, H., Zhang, Y., Lin, L., Cui, M. et al. (2019). DNA Methylation of farnesyl pyrophosphate synthase, squalene synthase, and squalene epoxidase gene promoters and effect on the saponin content of Eleutherococcus senticosus. Forests, 10(12), 1053. DOI 10.3390/f10121053. [Google Scholar] [CrossRef]
6. Xing, Z., Lao, F., Long, Y., Liang, N., Chen, L. et al. (2012). Single nucleotide polymorphism of squalene synthase and squalene epoxidase genes and their correlation with content of saponins in Eleutherococcus senticosus. Chinese Traditional and Herbal Drugs, 10, 2020–2024. [Google Scholar]
7. Xing, Z., Long, Y., Li, F., Zhou, M., Xiu, L. et al. (2014). Relationship between expression of two member of squalene synthase gene family from Eleutherococcus senticosus and saponins content. Southwest China Journal of Agricultural Sciences, 3, 1252–1255. DOI 10.3969/j.issn.1001-4829.2014.03.065. [Google Scholar] [CrossRef]
8. Tedeschi, F., Rizzo, P., Huong, B. T. M., Czihal, A., Rutten, T. et al. (2019). Effector of transcription factors are novel plant-specific regulators associated with genomic DNA methylation in Arabidopsis. The New Phytologist, 221(1), 261–278. DOI 10.1111/nph.15439. [Google Scholar] [CrossRef]
9. Chakrabarty, D., Yu, K. W., Paek, K. Y. (2003). Detection of DNA methylation changes during somatic embryogenesis of Siberian ginseng (Eleuterococcus senticosus). Plant Science, 165(1), 61–68. DOI 10.1016/S0168-9452(03)00127-4. [Google Scholar] [CrossRef]
10. Lescot, M., Dehais, P., Thijs, G., Marchal, K., Moreau, Y. et al. (2002). PlantCARE, a database of plant cis-acting regulatory elements and a portal to tools for in silico analysis of promoter sequences. Nucleic Acids Research, 30(1), 325–327. DOI 10.1093/nar/30.1.325. [Google Scholar] [CrossRef]
11. Li, L. C., Dahiya, R. (2002). MethPrimer: Designing primers for methylation PCRs. Bioinformatics, 18(11), 1427–1431. DOI 10.1093/bioinformatics/18.11.1427. [Google Scholar] [CrossRef]
12. Singh, V. K., Mangalam, A. K., Dwivedi, S., Naik, S. (1998). Primer premier: Program for design of degenerate primers from a protein sequence. Biotechniques, 24(2), 318–319. DOI 10.2144/98242pf02. [Google Scholar] [CrossRef]
13. Bock, C., Reither, S., Mikeska, T., Paulsen, M., Walter, J. et al. (2005). BiQ Analyzer: Visualization and quality control for DNA methylation data from bisulfite sequencing. Bioinformatics, 21(21), 4067–4068. DOI 10.1093/bioinformatics/bti652. [Google Scholar] [CrossRef]
14. Jin, J., Tian, F., Yang, D., Meng, Y., Kong, L. et al. (2017). PlantTFDB 4.0: Toward a central hub for transcription factors and regulatory interactions in plants. Nucleic Acids Research, 45(D1), D1040–D1045. DOI 10.1093/nar/gkw982. [Google Scholar] [CrossRef]
15. Tian, F., Yang, D., Meng, Y., Jin, J., Gao, G. (2020). PlantRegMap: Charting functional regulatory maps in plants. Nucleic Acids Research, 48, D1104–D1113. DOI 10.1093/nar/gkz1020. [Google Scholar] [CrossRef]
16. Chen, C., Hao, C., Yi, Z., Hannah, R. T., Margaret, H. F. et al. (2020). TBtools: An integrative toolkit developed for interactive analyses of big biological data. Molecular Plant, 13(8), 1194–1202. DOI 10.1016/j.molp.2020.06.009. [Google Scholar] [CrossRef]
17. Kumar, S., Stecher, G., Tamura, K. (2016). MEGA7: Molecular evolutionary genetics analysis version 7.0 for bigger datasets. Molecular Biology and Evolution, 33(7), 1870–1874. DOI 10.1093/molbev/msw054. [Google Scholar] [CrossRef]
18. Szklarczyk, D., Gable, A. L., Nastou, K. C., Lyon, D., Kirsch, R. et al. (2021). The STRING database in 2021: Customizable protein-protein networks, and functional characterization of user-uploaded gene/measurement sets. Nucleic Acids Research, 49(D1), D605–D612. DOI 10.1093/nar/gkaa1074. [Google Scholar] [CrossRef]
19. Phuong, N. T., Lee, K. A., Jeong, S. J., Fu, C. X., Choi, J. K. et al. (2006). Capillary electrophoretic method for the determination of diterpenoid isomers in Acanthopanax species. Journal of Pharmaceutical and Biomedical Analysis, 40(1), 56–61. DOI 10.1016/j.jpba.2005.05.023. [Google Scholar] [CrossRef]
20. Long, Y., Li, F., Yang, G., Xing, Z. (2015). Gene cloning and expression level of bAS and their correlation with content of saponins in Eleutherococcus senticosus. Chinese Traditional and Herbal Drugs, 9, 1354–1359. DOI 10.7501/j.issn.0253-2670.2015.09.018. [Google Scholar] [CrossRef]
21. An, Y. C., Goettel, W., Han, Q., Bartels, A., Liu, Z. et al. (2017). Dynamic changes of genome-wide DNA methylation during soybean seed development. Scientific Reports, 7(1), 12263. DOI 10.1038/s41598-017-12510-4. [Google Scholar] [CrossRef]
22. Lin, J. Y., Le, B. H., Chen, M., Henry, K. F., Hur, J. et al. (2017). Similarity between soybean and Arabidopsis seed methylomes and loss of non-CG methylation does not affect seed development. Proceedings of the National Academy of Sciences of the United States of America, 114(45), E9730–E9739. DOI 10.1073/pnas.1716758114. [Google Scholar] [CrossRef]
23. Huang, H., Liu, R., Niu, Q., Tang, K., Zhang, B. et al. (2019). Global increase in DNA methylation during orange fruit development and ripening. PNAS, 116(4), 1430–1436. DOI 10.1073/pnas.1815441116. [Google Scholar] [CrossRef]
24. Grover, J. W., Kendall, T., Baten, A., Burgess, D., Freeling, M. et al. (2018). Maternal components of RNA-directed DNA methylation are required for seed development in Brassica rapa. Plant Journal, 94(4), 575–582. DOI 10.1111/tpj.13910. [Google Scholar] [CrossRef]
25. Zhang, L., Wang, Y., Zhang, X., Zhang, M., Han, D. et al. (2012). Dynamics of phytohormone and DNA methylation patterns changes during dormancy induction in strawberry (Fragaria x ananassa Duch.). Plant Cell Reports, 31(1), 155–165. DOI 10.1007/s00299-011-1149-0. [Google Scholar] [CrossRef]
26. Burn, J. E., Bagnall, D. J., Metzger, J. D., Dennis, E. S., Peacock, W. J. (1993). DNA methylation, vernalization, and the initiation of flowering. PNAS, 90(1), 287–291. DOI 10.1073/pnas.90.1.287. [Google Scholar] [CrossRef]
27. Mayer, B. F., Ali-Benali, M. A., Demone, J., Bertrand, A., Charron, J. B. (2015). Cold acclimation induces distinctive changes in the chromatin state and transcript levels of COR genes in Cannabis sativa varieties with contrasting cold acclimation capacities. Plant Physiology, 155(3), 281–295. DOI 10.1111/ppl.12318. [Google Scholar] [CrossRef]
28. Wang, W. S., Pan, Y. J., Zhao, X. Q., Dwivedi, D., Zhu, L. H. et al. (2011). Drought-induced site-specific DNA methylation and its association with drought tolerance in rice (Oryza sativa L.). Journal of Experimental Botany, 62(6), 1951–1960. DOI 10.1093/jxb/erq391. [Google Scholar] [CrossRef]
29. Choi, C. S., Sano, H. (2007). Abiotic-stress induces demethylation and transcriptional activation of a gene encoding a glycerophosphodiesterase-like protein in tobacco plants. Molecular Genetics and Genomics, 277(5), 589–600. DOI 10.1007/s00438-007-0209-1. [Google Scholar] [CrossRef]
30. Doherty, C. J., van Buskirk, H. A., Myers, S. J., Thomashow, M. F. (2009). Roles for Arabidopsis CAMTA transcription factors in cold-regulated gene expression and freezing tolerance. Plant Cell, 21(3), 972–984. DOI 10.1105/tpc.108.063958. [Google Scholar] [CrossRef]
31. Bird, A. (2002). DNA methylation patterns and epigenetic memory. Genes & Development, 16(1), 6–21. DOI 10.1101/gad.947102. [Google Scholar] [CrossRef]
32. Heberle, E., Bardet, A. F. (2019). Sensitivity of transcription factors to DNA methylation. Essays in Biochemistry, 63(6), 727–741. DOI 10.1042/EBC20190033. [Google Scholar] [CrossRef]
33. Huang, B., Huang, Z., Ma, R., Ramakrishnan, M., Chen, J. et al. (2021). Genome-wide identification and expression analysis of LBD transcription factor genes in Moso bamboo (Phyllostachys edulis). BMC Plant Biology, 21(1), 296. DOI 10.1186/s12870-021-03078-3. [Google Scholar] [CrossRef]
34. Lau, O. S., Deng, X. W. (2010). Plant hormone signaling lightens up: Integrators of light and hormones. Current Opinion in Plant Biology, 13(5), 571–577. DOI 10.1016/j.pbi.2010.07.001. [Google Scholar] [CrossRef]
35. Zhou, M., Memelink, J. (2016). Jasmonate-responsive transcription factors regulating plant secondary metabolism. Biotechnology Advances, 34(4), 441–449. DOI 10.1016/j.biotechadv.2016.02.004. [Google Scholar] [CrossRef]
36. Wang, M., Qiu, X., Pan, X., Li, C. (2021). Transcriptional factor-mediated regulation of active component biosynthesis in medicinal plants. Current Pharmaceutical Biotechnology, 22(6), 848–866. DOI 10.2174/1389201021666200622121809. [Google Scholar] [CrossRef]
37. Chu, Y., Xiao, S., Su, H., Liao, B., Zhang, J. et al. (2018). Genome-wide characterization and analysis of bHLH transcription factors in Panax ginseng. Acta Pharmaceutica Sinica B, 8(4), 666–677. DOI 10.1016/j.apsb.2018.04.004. [Google Scholar] [CrossRef]
38. Luo, H., Sun, C., Sun, Y., Wu, Q., Li, Y. et al. (2011). Analysis of the transcriptome of Panax notoginseng root uncovers putative triterpene saponin-biosynthetic genes and genetic markers. BMC Genomics, 12(S5), 507. DOI 10.1186/1471-2164-12-S5-S5. [Google Scholar] [CrossRef]
39. Husbands, A., Bell, E. M., Shuai, B., Smith, H. M., Springer, P. S. (2007). Lateral organ boundaries defines a new family of DNA-binding transcription factors and can interact with specific bHLH proteins. Nucleic Acids Research, 35(19), 6663–6671. DOI 10.1093/nar/gkm775. [Google Scholar] [CrossRef]
40. Zhang, Z., Huang, R. (2010). Enhanced tolerance to freezing in tobacco and tomato overexpressing transcription factor TERF2/LeERF2 is modulated by ethylene biosynthesis. Plant Molecular Biology, 73(3), 241–249. DOI 10.1007/s11103-010-9609-4. [Google Scholar] [CrossRef]
41. Sakuma, Y., Maruyama, K., Osakabe, Y., Qin, F., Seki, M. et al. (2006). Functional analysis of an Arabidopsis transcription factor, DREB2A, involved in drought-responsive gene expression. Plant Cell, 18(5), 1292–1309. DOI 10.1105/tpc.105.035881. [Google Scholar] [CrossRef]
42. Peng, X., Ma, X., Fan, W., Su, M., Chen, L. et al. (2011). Improved drought and salt tolerance of Arabidopsis thaliana by transgenic expression of a novel DREB gene from Leymus chinensis. Plant Cell Reports, 30(8), 1493–1502. DOI 10.1007/s00299-011-1058-2. [Google Scholar] [CrossRef]
43. Li, X., Zhu, X., Mao, J., Zou, Y., Fu, D. et al. (2013). Isolation and characterization of ethylene response factor family genes during development, ethylene regulation and stress treatments in papaya fruit. Plant Physiology and Biochemistry, 70, 81–92. DOI 10.1016/j.plaphy.2013.05.020. [Google Scholar] [CrossRef]
44. Yin, Y., Morgunova, E., Jolma, A., Kaasinen, E., Sahu, B. et al. (2017). Impact of cytosine methylation on DNA binding specificities of human transcription factors. Science, 356(6337), eaaj2239. DOI 10.1126/science.aaj2239. [Google Scholar] [CrossRef]
45. Sando, T., Takaoka, C., Mukai, Y., Yamashita, A., Hattori, M. et al. (2008). Cloning and characterization of mevalonate pathway genes in a natural rubber producing plant, Hevea brasiliensis. Bioscience, Biotechnology, and Biochemistry, 72(8), 2049–2060. DOI 10.1271/bbb.80165. [Google Scholar] [CrossRef]
46. Pandit, S., Shitiz, K., Sood, H., Naik, P. K., Chauhan, R. S. (2013). pattern of fifteen genes of non-mevalonate (MEP) and mevalonate (MVA) pathways in different tissues of endangered medicinal herb Picrorhiza kurroa with respect to picrosides content. Molecular Biology Reports, 40(2), 1053–1063. DOI 10.1007/s11033-012-2147-1. [Google Scholar] [CrossRef]
47. Sun, Y., Dai, L., Kang, X., Fu, D., Gao, H. et al. (2021). Isolation and expression of five genes in the mevalonate pathway of the Chinese white pine beetle, Dendroctonus armandi (Curculionidae: Scolytinae). Archives of Insect Biochemistry and Physiology, 106, e21760. DOI 10.1002/arch.21760. [Google Scholar] [CrossRef]
Appendix
Supplementary Table 1: Sequence information of Eleutherococcus senticosus methyltransferase protein
Supplementary Table 2: Sequence information of Eleutherococcus senticosus demethylases protein
Cite This Article
 Copyright © 2022 The Author(s). Published by Tech Science Press.
This work is licensed under a Creative Commons Attribution 4.0 International License , which permits unrestricted use, distribution, and reproduction in any medium, provided the original work is properly cited.
 Downloads
 Citation Tools