| Phyton-International Journal of Experimental Botany |
DOI: 10.32604/phyton.2022.022379
ARTICLE
Phytochemical Analysis, Estimation of Quercetin, and in Vitro Anti-Diabetic Potential of Stevia Leaves Samples Procured from Two Geographical Origins
1Department of Pharmacognosy and Phytochemistry, Krupanidhi College of Pharmacy, VarthurHobli, Bengaluru, 560035, India
2Department of Pharmacy Practice, College of Pharmacy, AlMaarefa University, Dariyah, Riyadh, 13713, Saudi Arabia
3Department of Clinical Laboratory Sciences, The Faculty of Applied Medical Sciences, Taif University, Taif, 21944, Saudi Arabia
4Centre of Biomedical Sciences Research (CBSR), Deanship of Scientific Research, Taif University, Taif, 21944, Saudi Arabia
5Department of Pharmaceutical Sciences, College of Clinical Pharmacy, King Faisal University, Al-Hofuf, Al-Ahsa, 31982, Saudi Arabia
6Department of Pharmaceutics, Vidya Siri College of Pharmacy, Bangalore, 560035, India
7Department of Biotechnology and Food Science, Faculty of Applied Sciences, Durban University of Technology, Durban, 4001, South Africa
*Corresponding Authors: Syed Mohammed Basheeruddin Asdaq. Email: sasdaq@gmail.com, sasdag@mcst.edu.sa; M. Saifulla Khan. Email: khan.saifulla1@gmail.com
Received: 07 March 2022; Accepted: 11 April 2022
Abstract: The current study used RP-HPLC to compare phytochemicals and estimate the bioactive constituents found in Stevia rebaudiana Bert. (SRB) leaves collected from two different geographical sources. SRB leaves were collected from Bangalore, Karnataka, India, and Reduit, Mauritius. Extracts were prepared using ethanol and aqueous solvents. Proximate analysis was used to evaluate moisture content, ash values, crude fibers, and extractive values. Following that, preliminary phytochemical screening was done on both ethanol leaves extracts, and subsequently total flavonoid content was determined. In addition, TLC chromatograms and RP-HPLC studies were performed on both plant extracts to determine the presence of flavonoid components in both leaves extracts, followed by in vitro anti-diabetic activity was performed with alpha amylase and alpha glucosidase enzymes against Acarbose as standard. Results revealed that both the extracts from two different geographical sources varied significantly with the yield, content of chemicals, and presence of quercetin (flavonoid) content when estimated through the RP-HPLC standardized method. Glycosides, flavonoids, proteins, steroids, saponins, terpenoids, and phenols were found in various concentrations during phytochemical screening. Among both zones, the ethanol leaves extract of SRB taken from Mauritius had a greater content of phytochemicals and a higher yield than other extracts due to the soil nature. The Mauritius sample had greater total flavonoid levels as well as more quercetin (0.92 ± 0.011) than the other extracts. Following that, ethanol extract inhibited enzymes (alpha amylase, alpha glucosidases) more than aqueous extract, and this inhibition was dose dependent. Among them, the Mauritius ethanol sample showed higher anti-diabetic efficacy than the Indian sample, but this difference was not significant. Overall, SRB ethanol leaves extracts outperformed other leaves extracts in terms of yield, phytoconstituents, and total flavonoids. Overall, both SRB samples had high quercetin levels and possessed anti-diabetic potential, but they were greater in the Mauritius sample, demonstrating that plant traits are influenced by geographic location.
Keywords: Antidiabetic activity; Stevia rebaudiana; phytochemicals; proximate analysis; TLC; RP-HPLC
Recently, the value of leading a healthy lifestyle has been recognized as a means of improving one’s quality of life and reducing physical and emotional suffering. Research and medication guidelines have emphasized the need of limiting sugar, salt, and fatty foods, as well as encouraging exercise and avoiding a sedentary lifestyle. Reduced sucrose intake in meals decreases the relative amount of carbohydrates, which may be advantageous for a well-balanced diet and human health [1]. There are many natural plant-based sweeteners available that have caloric content, but a miracle Stevia, which is a genus that has around 240 species and is in the Asteraceae family, has its identity with non-caloric natural sweeteners [2]. Botanist Moises Santiago Bertoni was the one who first brought the plant to the attention of the world in 1887 [3].
The plant originated from South America, especially from Brazil and Peru. The Stevia rebaudiana Bert. (SRB) plant is also known as the honey plant or candy plant in India and is commercially cultivated due to its low-calorie leaves (extremely sweet) throughout the world. The plant is cultivated for the commercialization of the sweet leaves, and although some of its extracts may have a bitter or licorice-like aftertaste at high concentrations with its steviol glycoside extracts, Stevia’s taste has a delayed start and longer persistence than that of sugar, notably as a sweetener and sugar substitute. Stevia has gained popularity as a low-carbohydrate, low-sugar food substitute since it contains up to 300 times the sweetness of sugar. As a natural sweetener, SRB appeals to people on carbohydrate-restricted diets as a Stevia was allowed for use in the European Union beginning in early December 2011 [4,5]. The leaves of SRB were found to contain 95% glycosylated Steviol derivatives, notably Stevioside, Rebaudiosides, and Dulcoside A, with lesser levels of Rubausoside, Steviolbioside, and Rebuiosides [6]. SRB leaves extract also contains alkaloids, flavonoids, caffeic and chlorogenic acids, some free sugars, amino acids, lipids, and oils [7]. Different novel techniques have been applied to improve the extraction of the various phytoconstituents from SRB viz., microwave-assisted extraction, pressurized liquid extraction, and pressurized hot water extraction applied to obtain higher concentrations of stevioside [8]. Recent literature revealed the analytical method for steviol extraction and determination of phytochemicals through ohmic heated water extraction [9]. Because of the presence of these constituents, the plant shows versatile medicinal and therapeutic efficacy. Stevioside is used in the treatment of diabetic conditions (type 2) through the reduction of the level of postprandial blood glucose in patients and helps in glucose metabolism [10]. It acts as an antioxidant due to its ability to neutralize free radicals [11]. Apart from that, it protects gastrointestinal ulcers, serves as an antihypertensive, anti-diabetic, treats depression, possesses antibacterial, anti-inflammatory, wound-healing, lipid lowering and hepatoprotective properties [12–17].
All pharmacological activities outlined above, as well as the presence of bioactive constituents, vary greatly with geographical location. As a result, scientists are becoming increasingly concerned about the impact of plant geographical distributions on chemical composition, physical properties, and biological activities. According to several scientific studies [18], the efficiency of medicinal plants is influenced by the bioactive constituents present in individual species, plant sections, and even environmental factors including climate, geographical location, season, soil type, and growth circumstances. Plants’ bioactive phytochemical concentrations have also been found to vary, and that showed the impact on the changed therapeutic efficacy even changed quantitatively with season [19]. The variance in phytochemicals and activity of the same plant sections from the same plant harvested at different geographical locations is even more dramatic. Therefore, medicinal plants grown in different locations may not consistently generate the same compounds in the same amounts. All the above constituents were already isolated and reported but there was a scanty report on presence of quercetin in the leaves of SRB. Hence, it was worthwhile to investigate the impact of geographical location on the SRB plant on phytochemicals and the content of specific bioactive constituent quercetin. Thereafter, in vitro antidiabetic activity was evaluated for both the extracts based on the reported therapeutic activities and the results were compared. The study compared and reported the variations in the percentage yield, the phytochemicals, and quercetin present in the two different extracts (ethanol and aqueous) of the SRB leaves collected from two different countries (Bangalore, India and Reduit, Mauritius) and its impact on in vitro determined antidiabetic potentiality.
Instruments such as HPLC (Shimadzu, India) for quantitative estimation, Muffle furnace (Lab India, India) for ash determination, UV spectrophotometer (Shimadzu, India) for estimation of in vitro antidiabetic assay, borosil desiccator (H.L Scientific Industries, Amballa Cantt., India) for moisture content determination, precoated TLC plates (Merck Company, Gujarat, India) rotating vacuum evaporator (Bedford, MA, USA) were used in the present study.
All chemicals and kits employed in this study were procured form standard suppliers and distributers located in India. Assay kits (Mumbai, India) for alpha amylase and alpha glucosidase enzymes, standard rutin (Sigma Aldrich chemicals, India) for determination of total flavonoids, tris buffer, Aluminium chloride (AlCl3), Sodium hydroxide (NaOH), Sodium nitrite (NaNO2), Hydrochloric acid (HCl), Quercetin standard (Sigma Aldrich chemicals, India) were used in the study.
2.2 Collection of Plant Material
The SRB leaves were obtained from the Indian Institute of Horticultural Research, Bengaluru, and Réduit, Mauritius. The cultivated SRB leaves were collected in June–July, 2021, harvested in afternoon at 4 PM. The plant leaves were identified and authenticated by a plant taxonomist, Dr. P. E. Rajshekharan, IIHR, Bengaluru, and Dr. Suman Seeruttun, Research Manager in charge of Crop ManagementProgramme, Mauritius Sugarcane Industry Research Institute, Réduit, Mauritius. Both the samples were preserved with the voucher specimens (KCP-PCOG/Stevia/338/2021 and KCP-PCOG/Stevia/339/2021) separately in the department of Pharmacognosy, Krupanidhi College of Pharmacy, Bengaluru, in the herbarium (Fig. 1).
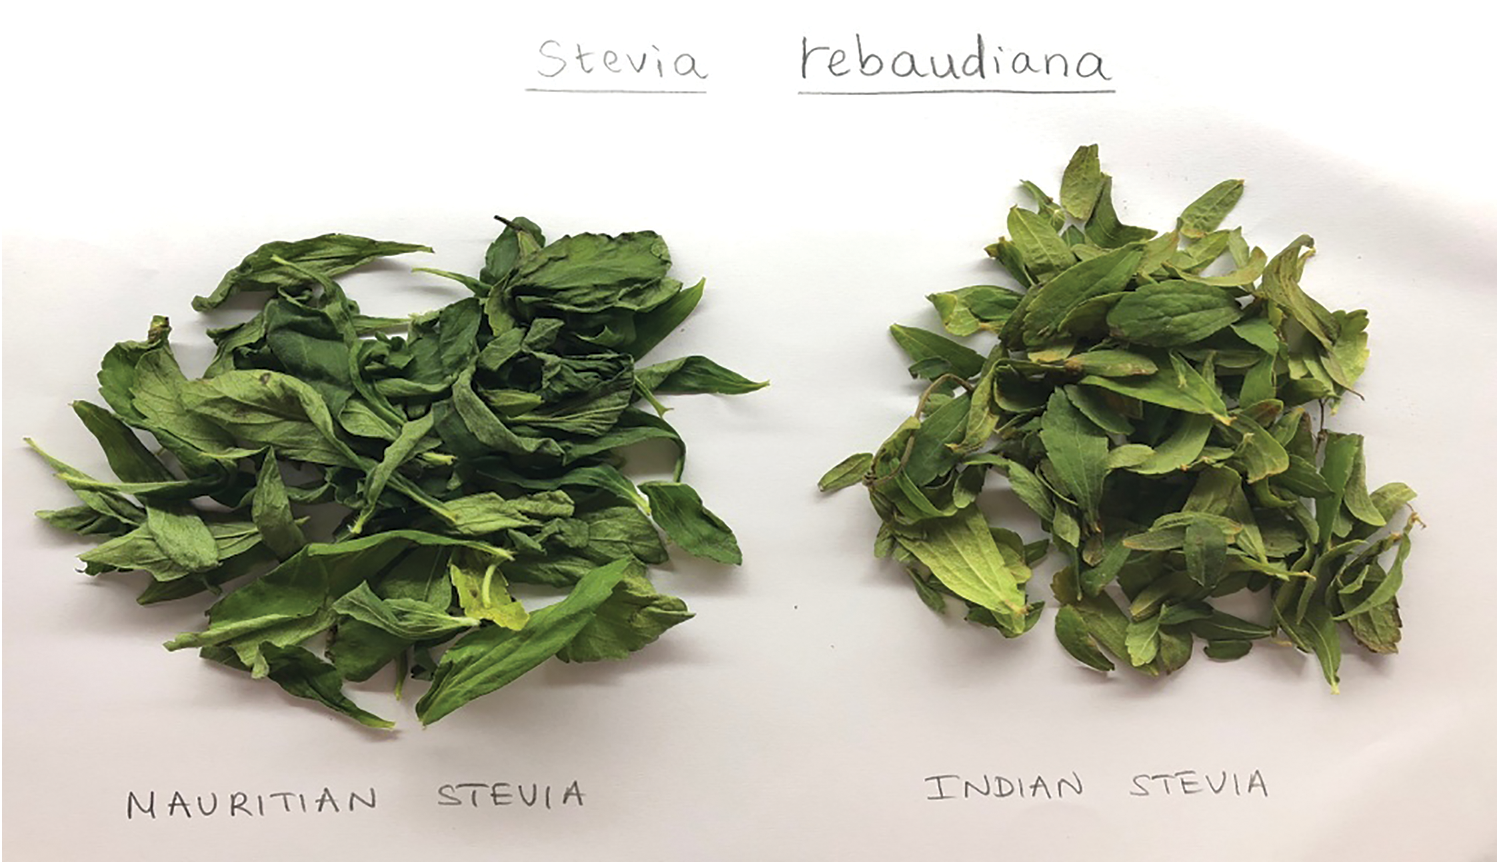
Figure 1: SRB sample from two different geographical location
2.3 Preparation of Plant Crude Extracts
The leaves were cleaned with running water and shade dried for 15 days at room temperature. Then the leaves were separated and coarsely powdered. They were labeled separately and kept in a plastic sealed cover to prevent moisture or microbial contamination until they were needed for the experiment.
For the preparation of the extract, ethanol and aqueous solvents were used. Each 250 g of powdered drugs was extracted for 6 h at 40°C using the Soxhlet and reflux methods. Separately, the filtration of the extract was done using Whatman filter paper No. 42. To get semi-solid crude extracts, the extracts were concentrated into a thick viscous form using a rotary evaporator and stored in glass bottle in refrigeration condition at 4–5°C.
The crucible was placed in the drying oven for 2 h at 105°C. The crucible was then placed in desiccators to cool. 5 g of powder was added to the beaker after it was weighed. The sample was dried for 3 h in a 105°C oven and then weighed. Finally, the moisture content was estimated as per the following formula [20]:
Total ash was estimated based on the method described in earlier literature [21]. For 2 h, 1 g of dried leaves was maintained in a silica crucible at 450°C in a muffle furnace. After ash, it was weighed and cooled in a desiccator. It was reheated in the muffle furnace for another half-hour, then cooled and weighed. Finally, the total ash was calculated with the below given formula:
The ash was digested for 30 min in a boiling water bath with 25 mL of alcohol as a solvent. Filter paper with less ash was used to filter the contents of the silica crucible. The residue-covered filter paper was removed with care and deposited in the same crucible. It was then dried in a hot air oven before being burnt at 600°C for an hour in a muffle furnace, cooled in a desiccator, and weighed. The soluble ash content was calculated, the formula given below [20]:
The ash further was heated for 5 to 10 min in 25 ml of 2N HCl. The insoluble materials were then collected after the solution was filtered using an ash-free filter paper. This insoluble substance was then rinsed with hot water, burned, and weighed. The proportion of acid insoluble ash was estimated using the air-dried medication as per the details given in the literature [20].
The crude fiber was calculated with the standard method [22]. The 2 g samples were digested in 150 ml of hot 0.2N H2SO4 for 30 min. After draining the acid, the sample was washed in hot deionized water. Finally, the fiber was removed and dried by soaking it in a small amount of acetone and letting it drain. The sample was burned for 3 h at 550°C. Until all the carbonaceous stuff has been consumed. The crucible containing the ash was weighed after cooling in the desiccators. The following equation was used to compute the crude fiber percentage:
where:
w1 = Weight of sample used;
w2 = Weight of sample and crucible before ash form;
w3 = Together weight of crucible and ash.
5.0 g of leaves were coarsely powdered and then macerated in a closed iodine flask for overnight using 100 ml of alcohol and distilled water, respectively. During the first three hours, the flask was repeatedly shaken, and then it was left to stand overnight (24 h). After 24 h, the contents of the flask were filtered using Whatman No. 42 filter paper and put 20 ml into a petri plate, which was then dried in a hot air oven at 105°C and weighed. The following formula was used to compute the percentage of soluble extractive:
Screening for the presence of bioactive compounds in MP plant extracts was identified separately using the method described in the literature [23].
2.7 In Vitro Anti Diabetic Activity
2.7.1 Inhibition of Alpha Amylase
At various concentrations, from 50–250 g/ml, the alpha amylase enzyme was mixed with the extracts at 1.0 mg/ml. In the same solution, 1% of starch and 0.3 mm of phosphate buffer (50 µl) were added and pH was maintained at 6.9. The reaction was kept for 5 min at 37°C, and the reaction was then stopped with the addition of 2 ml of 3, 5-dinitrosalicylic acid. The final mixture sample was heated for 15 minutes at 100°C. In an ice bath, 10 mL of water was added and diluted. A color intensity determination at 540 nm was used to record the inhibitory activity of the α-amylase enzyme using a UV spectrophotometric reading [24].
2.7.2 Alpha Glucosidases Inhibitory Activity
Incubation of 1 ml of starch solution (2% w/v maltose) was added in 0.2 M tris buffer at pH 8. The mixed reaction was incubated for 10 min at 37°C. 1 ml of α-glucosidase enzyme (1 U/ml) was added into the sample and further incubated for 45 min at 35°C after adding 4 ml of 6N HCl. The color intensity was recorded at the same level as in the above procedure [25].
In both cases (Sections 2.5.1 and 2.5.2), the inhibitory concentration (IC50) values were determined. It was carried out to know the inhibition of the enzyme activity of 50%. It was calculated from plots of percent inhibition vs. log inhibitor concentration.
2.8 Total Flavonoid Content (TFC)
The TFC of both the leaves extracts was estimated based on the method of Ayoola et al. [26]. The extracts (1 mg/mL) were mixed with 1.25 mL of distilled water and 0.75 µL 5% NaNO2 and incubated for 6 min. Then 150 µL 10% AlCl3 solution was added and further incubated for 5 min. Finally, 1 mL of NaOH was added and, for the final solution, the absorbance was recorded using a UV-visible spectrophotometer, with an absorbance of 510 nm. The result was determined using standard rutin calibration curves. The results were given in milligrams of rutin equivalents per gram of dry extract (mg rutin/g).
Based on the total flavonoids, and a preliminary chemical test, further extracts were performed with various standard flavonoids. Various ratios of mobile phase were prepared and observed for the presence of phytoconstituents. After standardization, toluene, ethyl acetate, and formic acid with a 5:4:0.2 ratio were selected.
2.10.1 RP-HPLC Instrumentation
The external calibration method was used to achieve quantitative estimation with the Empower 2 software applications. A Milli-Q academic water purification system with a 0.22 m Millipak express filter and a rotating vacuum evaporator (Bedford, MA, USA) was used. The mobile phase was filtered using Millipore membrane filters with a pore size of 0.45 m, and the sample was filtered using Whatman’s syringe filters (NYL 0.45 m). Finally, they detected the peak at 203 nm.
2.10.2 Preparation of Standard and Sample
In ethanol, a standard solution of quercetin (1 mg/ml) was produced. Calibration samples weighing 5–100 g/mL were manufactured. Dissolving 10 mg of extract in 1 mL of ethanol was also used to make the sample solution. A Whatman NYL 0.45 m syringe filter was used to filter both the standard and sample solutions. Peak regions vs. concentration were used to evaluate the responses.
The mobile phase was made with a 95:5 (v/v) mixture of ethanol and water. After adjusting the pH of the water to 3.2 with 1% (v/v) glacial acetic acid, both solvents were filtered through a 0.45 mm Millipore membrane filter and finally ultra-sonicated to de-gas and resist the interference of any air bubbles in the column system.
According to ICH criteria, the method was validated for linearity, specificity, limit of detection (LOD), limit of quantification (LOQ), accuracy, and precision [27].
The range of linearity of quercetin was investigated (n = 6) in the optimum chromatographic conditions using standard solutions containing quercetin. A linear regression was used to fit triplicate values obtained at various concentrations (5 to 100 g/ml) to create the standard response curve for quercetin. The peak regions of 20l of each solution were measured after chromatography. The linear range of quercetin was determined by plotting peak regions against corresponding concentrations.
The method’s specificity was evaluated by comparing with the standard’s retention time and test samples for identity and determination of purity.
2.10.7 Limit of Detection (LOD) and Limit of Quantification (LOQ)
Based on the ICH guidelines, the LOD and LOQ were computed by estimating the SD of the response and the slope of the linear equation (S). The following equation was used to compute the LOD and LOQ. LOD = 3.3/S, LOQ = 10/S, where S is the slope of the calibration curve and SD is the standard deviation of the response.
Low quality control (LQC), medium quality control (MQC), and high-quality control (HQC) were used to determine the accuracy and precision of each analyte (HQC). Both sets of data were evaluated by comparing them within a single run (n = 6). The method’s accuracy was determined using a typical addition methodology and represented as a percent RSD. The method’s precision was tested by injecting six replicates at three different concentrations of the reference substances and measuring intra-day and inter-day fluctuations. The percentage RSD was used to represent the values.
To determine the proximate analysis for all leaves samples, the mean and SEM (standard error of the mean) of total phenolics and total flavonoids contents were used. GraphPad Prism Version 5.0 was used to do statistical analysis for HPLC, and the findings are provided as the mean percent RSD. Thereafter, by using regression analysis, the IC50 was determined for the extracts.
All the plant leaves were extracted with an ethanol solvent and calculated for the yield of the crude extracts (w/w). The results revealed the yield was higher in both the ethanol sample than the aqueous sample but was much higher with Mauritian SRB leaves (40.6 g) than Indian SRB leaves (32.8 g). The same was less in the aqueous sample but still greater with Mauritian SRB leaves (34.6 g) than with Indian SRB leaves (27.3 g). The percentage yield of the extracts was tabulated in Fig. 2.
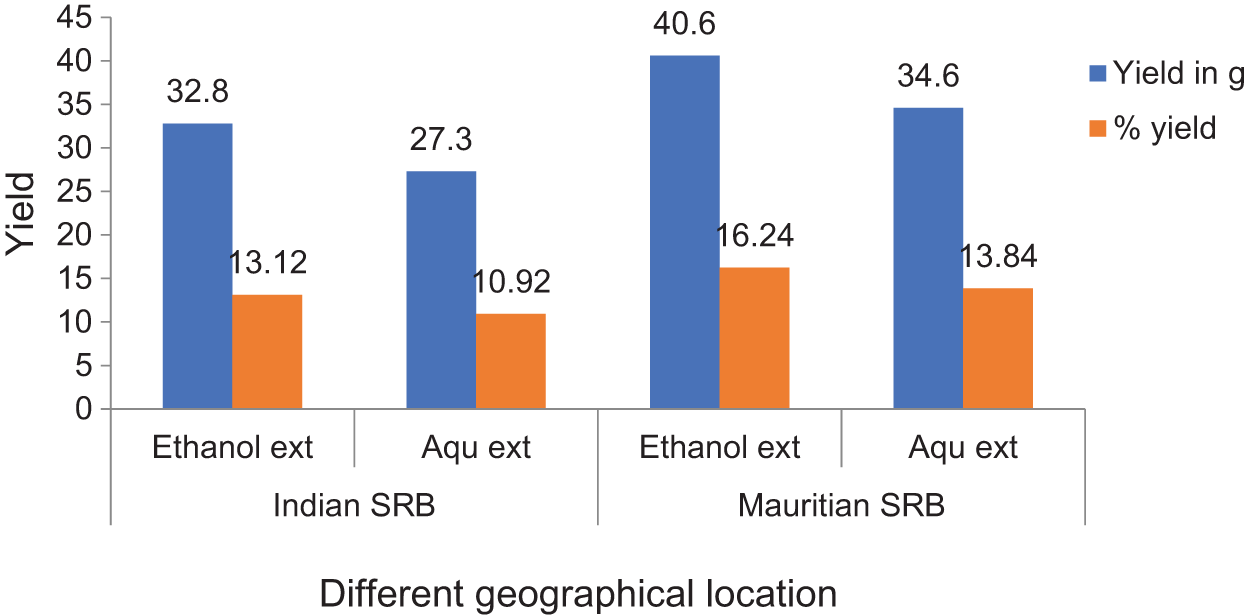
Figure 2: Percentage yield and amount of crude extracts of SRB leaves samples
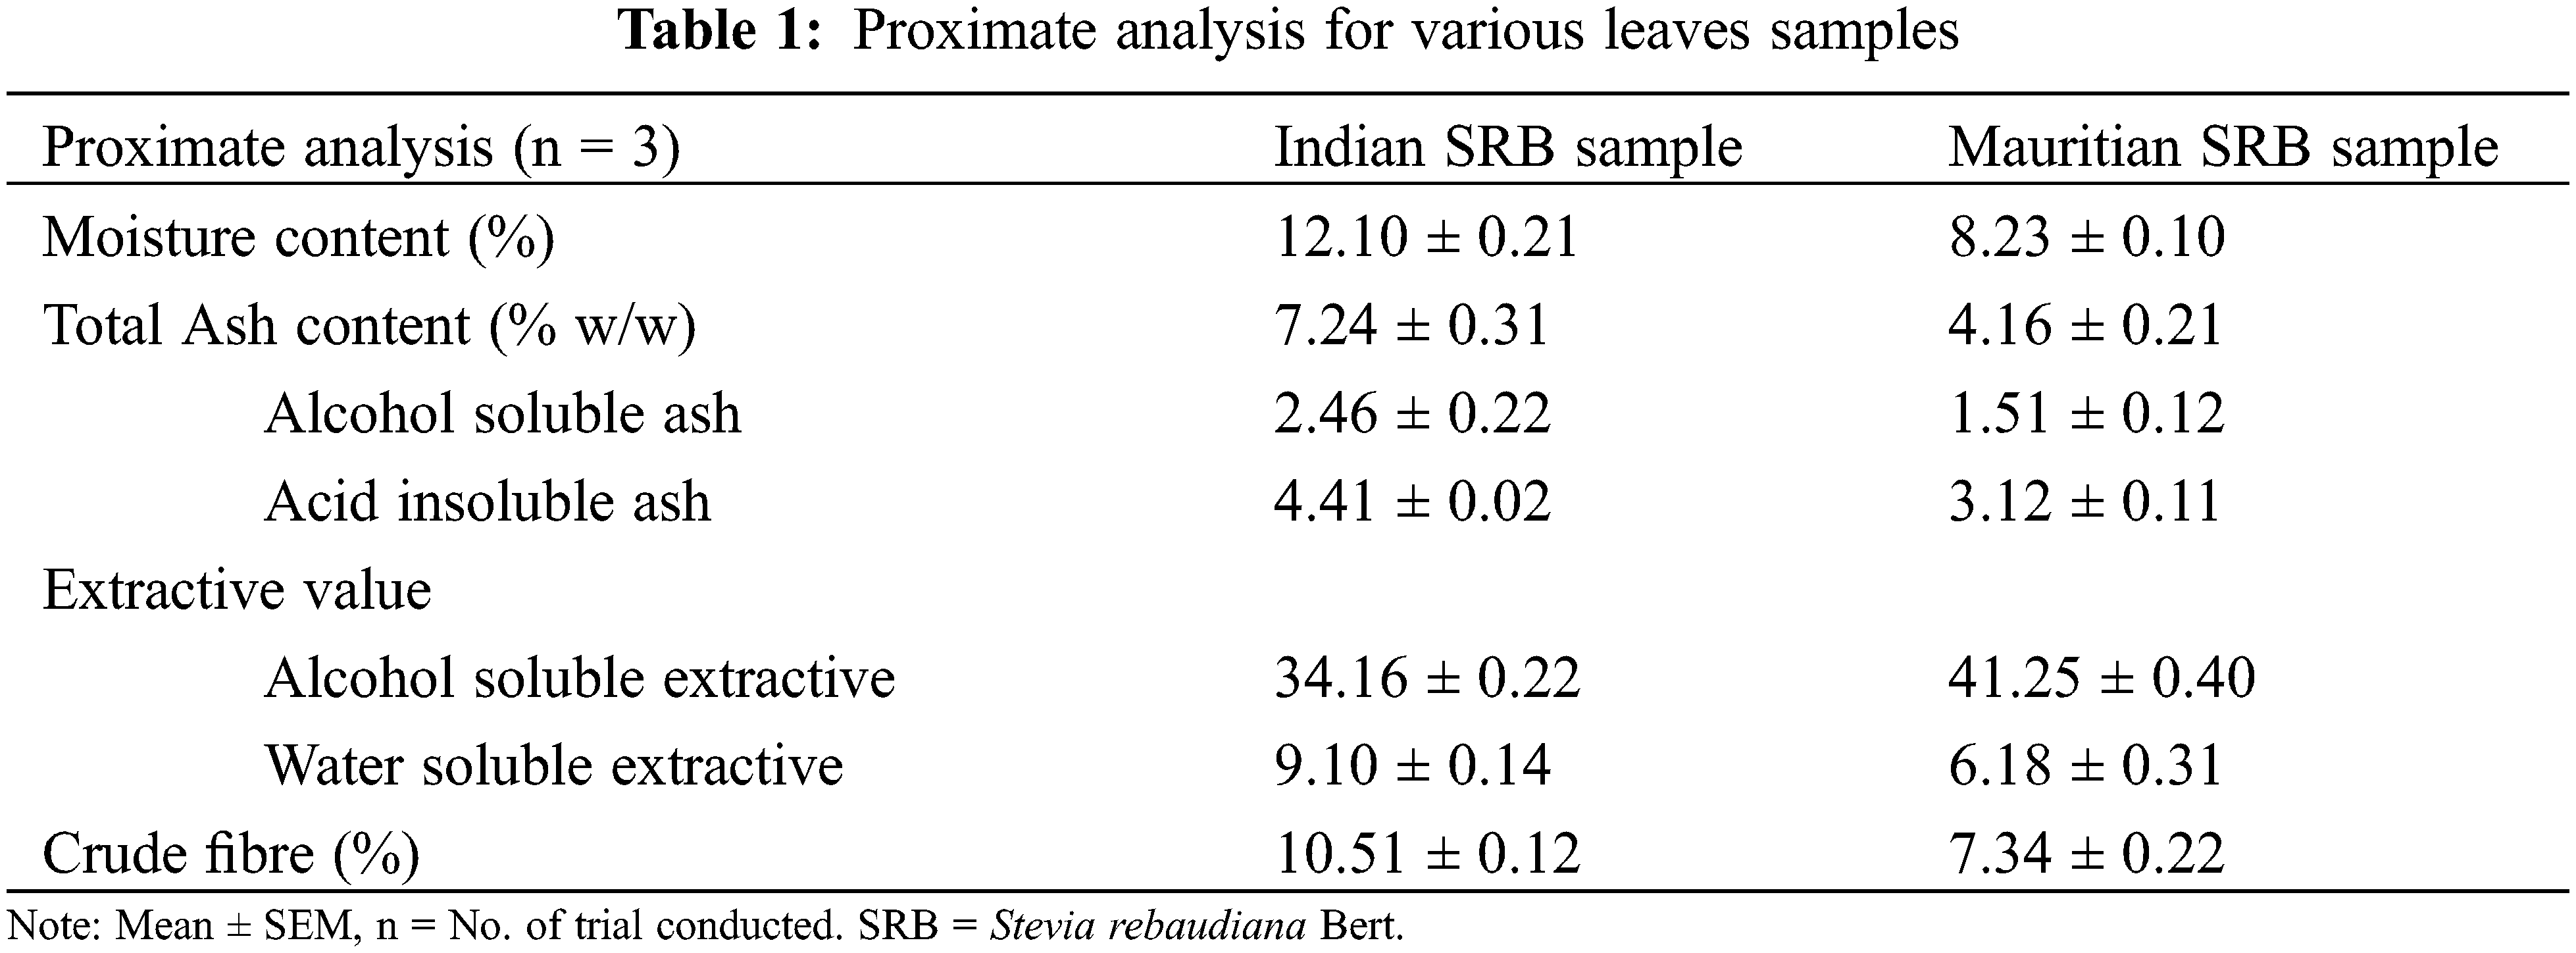
For both powdered samples, various characteristics such as moisture content, total ash, alcohol soluble and acid insoluble ash, extractive value, and crude fiber were determined, and the result was tabulated in Table 1.
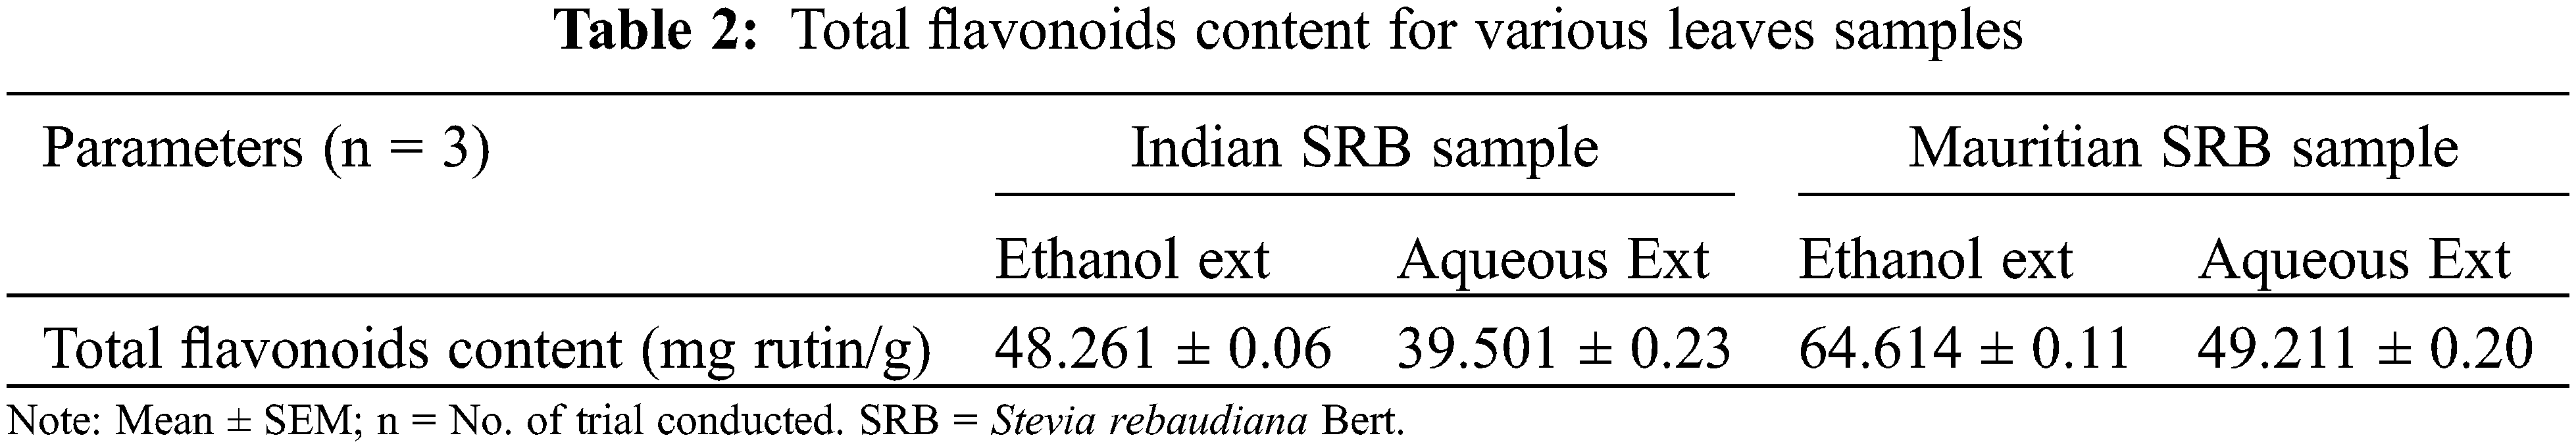
Total flavonoids were estimated for all the said leaves and the result was tabulated in Table 2.
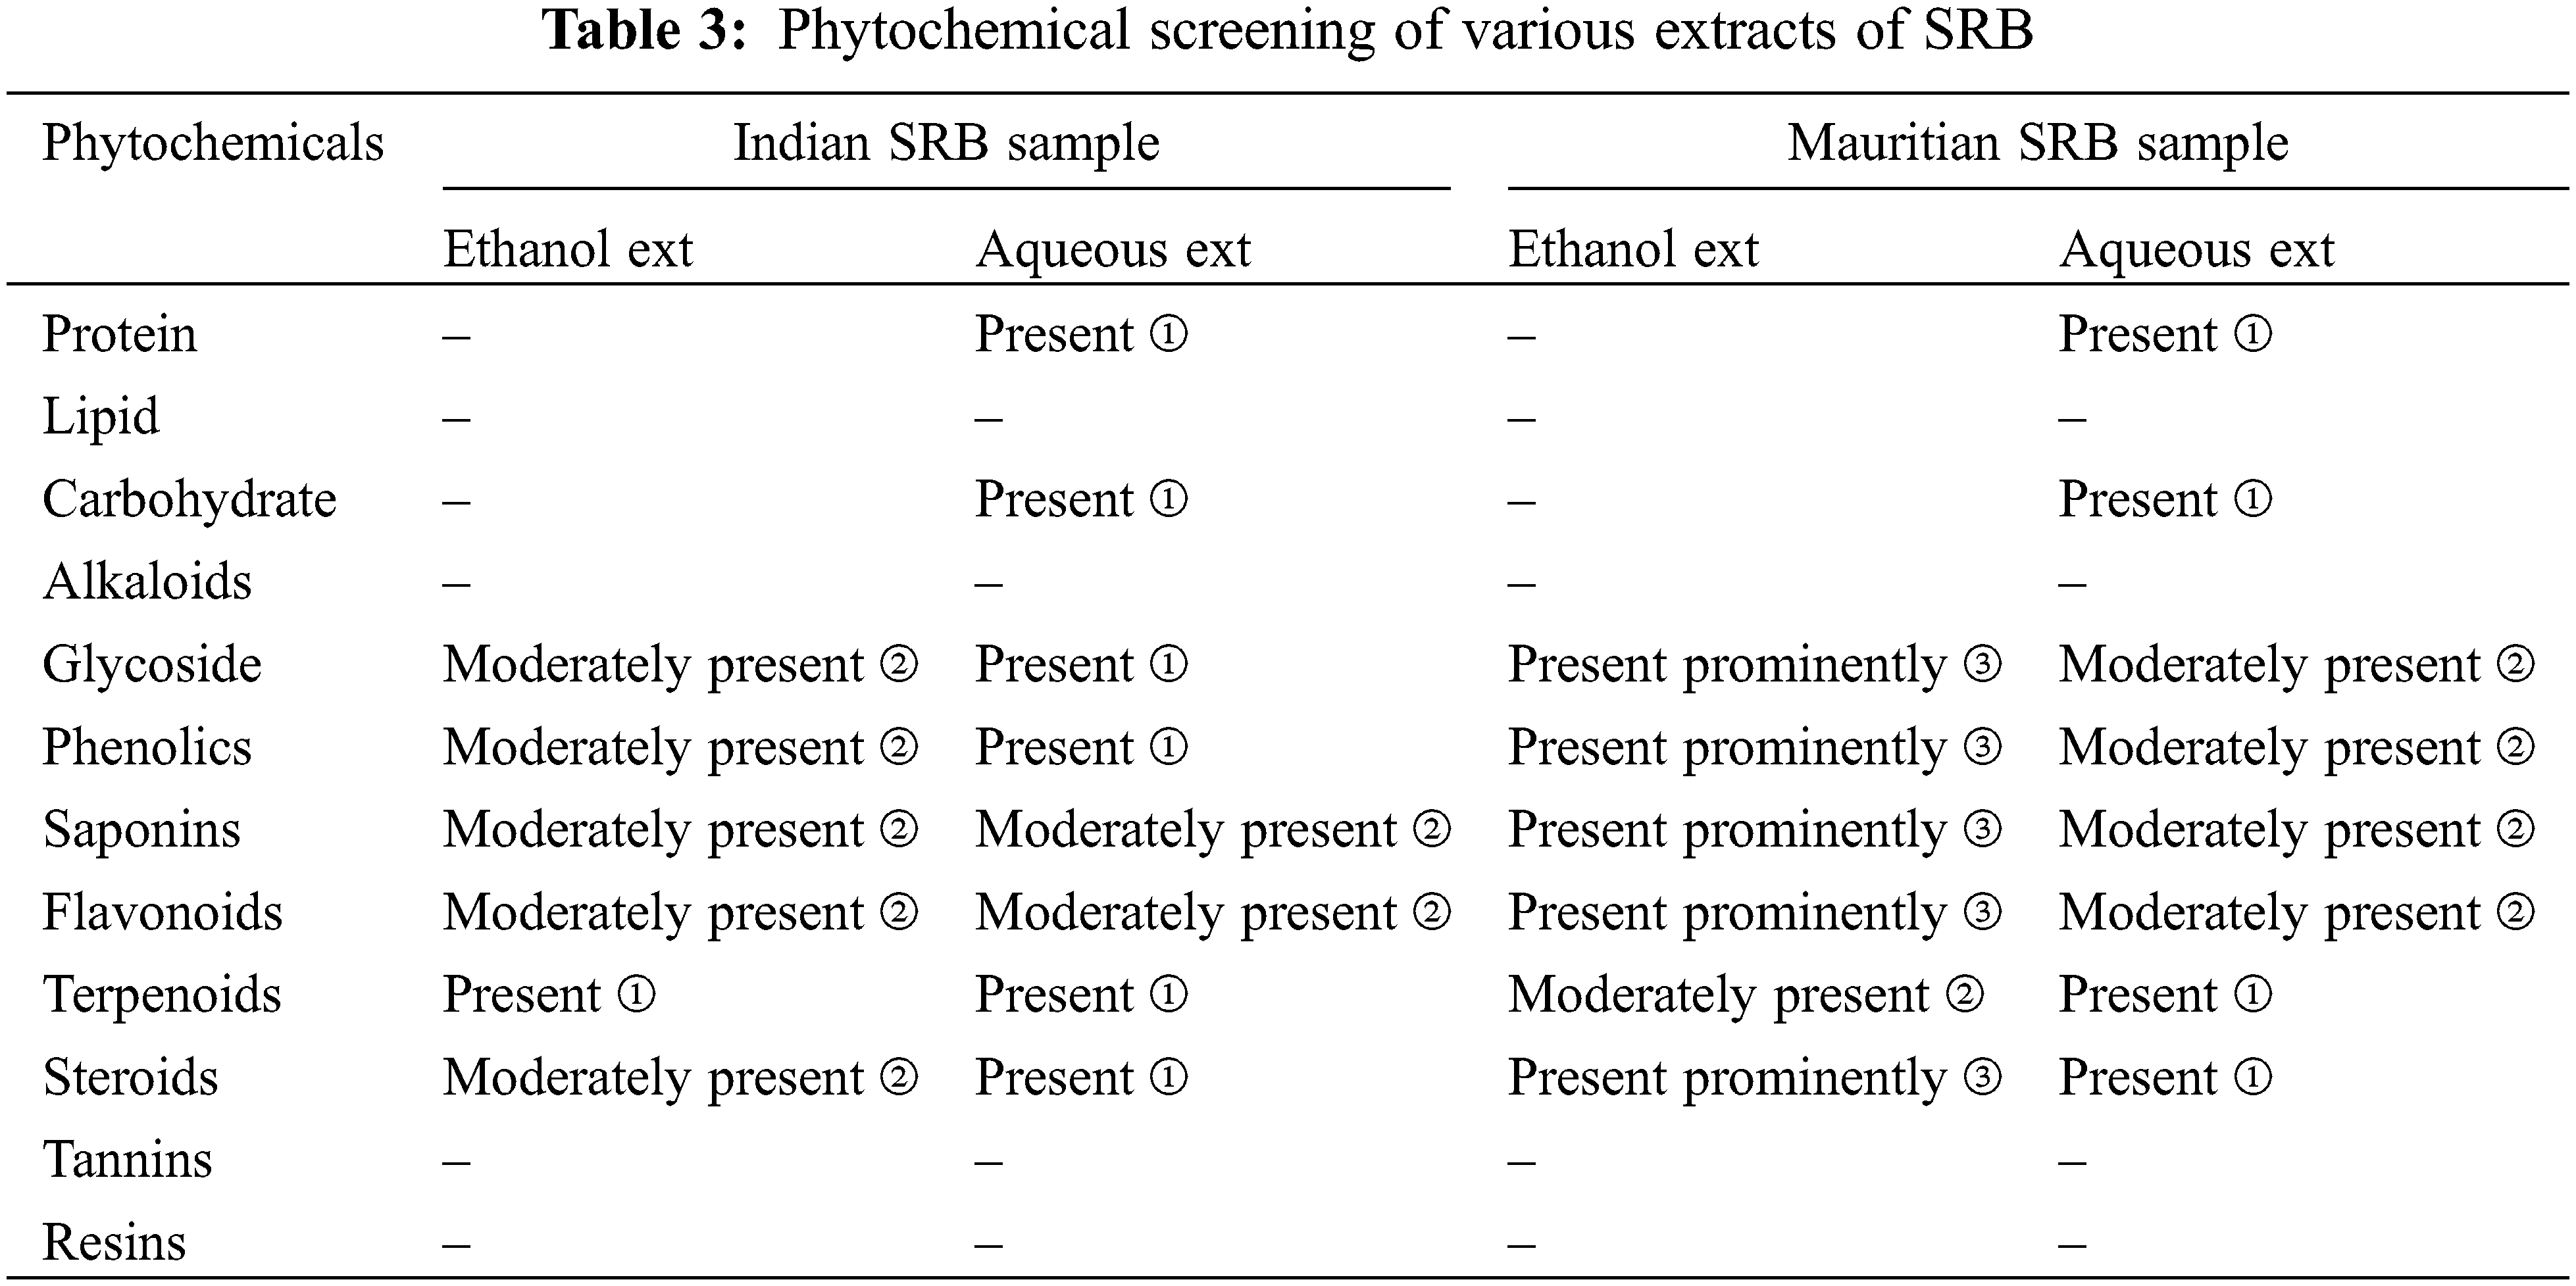
Various chemical tests for the plant extracts were performed and revealed the presence of various groups of constituents namely, alkaloids, glycosides, flavonoids, proteins, saponins, steroids, phenols, and tannins. The result was tabulated in Table 3.
3.5 In Vitro Anti Diabetic Activity
3.5.1 Inhibition of Alpha Amylase and Alpha Glucosidase Enzymes
Both the ethanol and aqueous SRB extracts inhibited the α-amylase enzyme significantly when tested at different concentrations. The same trend also occurred with the alpha glucosidase enzymes. The results are depicted in Fig. 3 (inhibition activity of alpha amylase) and Fig. 4 (inhibition activity of alpha glucosidase).
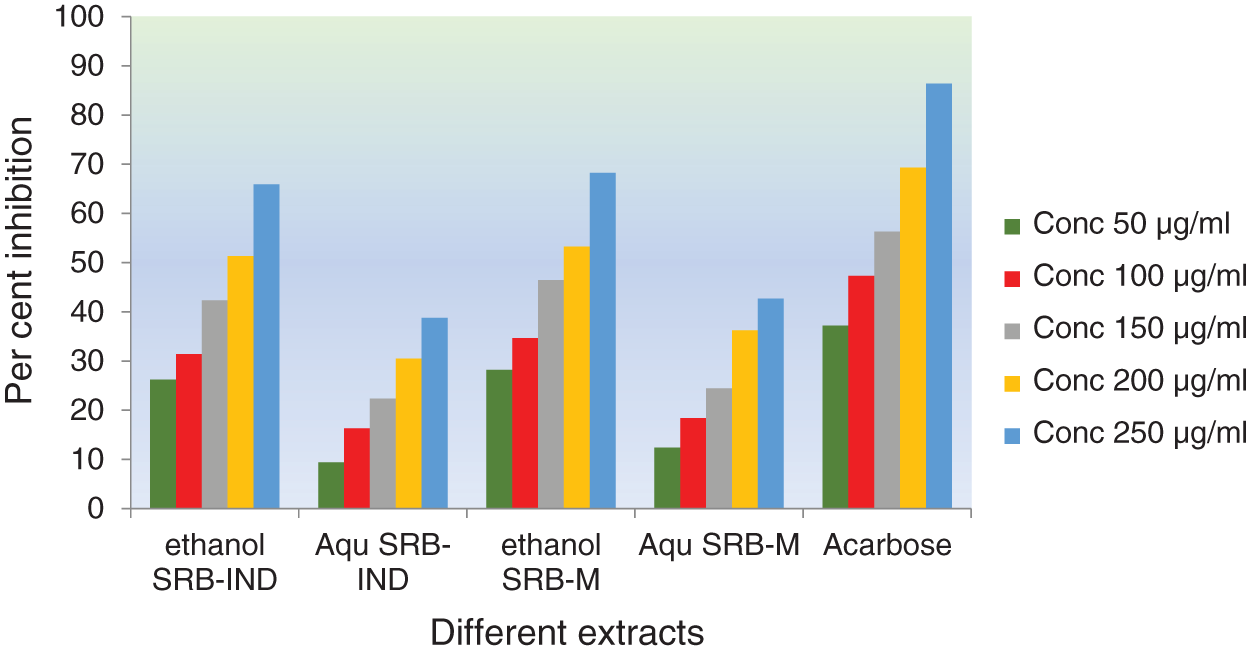
Figure 3: In vitro alpha amylase inhibitory activity of different extracts against standard
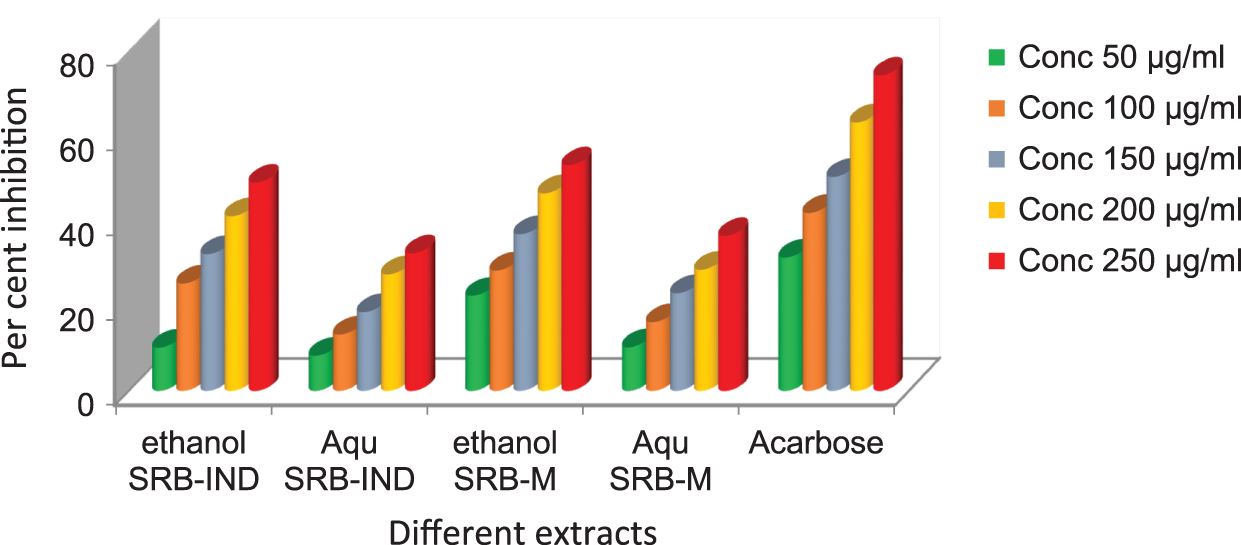
Figure 4: In vitro alpha glucosidase inhibitory activity of different extracts against standard
In the case of inhibition of alpha amylase, standard acarbose showed significant inhibition with 86.41% at a concentration of 250 µg/ml and in the same concentration, Mauritius ethanol SRB sample showed inhibition of 68.23% and the Indian ethanol sample showed 65.89%, which was significant (P < 0.05%). The results of the activities between the two ethanol samples (India and Mauritius) were closely associated, which were non-significant. Thereafter, the IC50 value for the standard showed 87.23 ± 2.35 against alpha amylase and 76.12 ± 4.01 against alpha glucosidase (Fig. 4).
An ethanol sample from Mauritius gave 165.23 ± 3.60 against alpha amylase and 193.42 ± 5.21 against alpha glucosidase, whereas the same resulted in a higher IC50 in the Indian sample (234.20 ± 1.38 and 253.42 ± 5.21 for alpha amylase and alpha glucosidase, respectively).
3.6 Thin Layer Chromatography of Samples
Various flavonoids such as rutin, quercetin, kampherol are tried with the extracts and result revealed presence of quercetin in both the samples when run with the standardized mobile phase along with the standard Quercetin and found the Rf of 0.47.
3.7 High Performance Liquid Chromatographic Study
3.7.1 Validation of the Method
All validation studies were carried out by injecting standard and sample solutions in duplicate. Calibration plots were created by plotting mean areas against corresponding concentrations using standard solutions at five different concentrations. Table 4 showed the correlation coefficient and intercept values that were used to evaluate the approach. Quercetin linearity was measured in the range of 10 to 60 g/ml. The quantification limit was 4.61 g/ml, with a detection limit of 0.91 g/ml. A recovery study was carried out to ensure that the developed approach was accurate. The recovery of the chemical was calculated using a standard solution (10 g/ml) added to three distinct pre-analyzed sample solutions. Table 5 shows the results of the accuracy assessments. According to the current accuracy test, all the samples had recovery levels of 96.88, 97.38, 99.59, and 96.21 percent, respectively. It was also demonstrated that the current approach allows for precise quantification of quercetin in three distinct leaves extracts. The average recovery level for all spiked quercetin standards in all samples was 98.24%. Replicate analysis was used to assess the precision features by assessing the intra- and inter-day retention times and peak area for the quercetin standard. The R.S.D. (relative standard deviation) was used to express it (Table 6). The present findings revealed that the intra- and inter-day R.S.D. for retention time and peak area were both low, with acceptable precision. The intra-day R.S.D. for retention time was 0.12%, while the intra-day R.S.D. for peak area was 1.63 percent.In the meantime, the inter-day R.S.D. for retention time was 0.32 percent, while the R.S.D. for peak area was 2.14 percent. The resolution between the standards’ peaks was used to determine the method’s selectivity for the standards. The peak of quercetin is entirely separated under chromatographic conditions, with no interference, indicating that the technique is selective. As shown in Figs. 5a–5e, the specificity was determined by comparing the chromatograms obtained from extracts (ethanol extracts from both geographical sites) and the standard. The method was specifically for the quantitative determination of quercetin in SRB leaves since the retention periods of standard solution and leaves extracts from both geographical sites were almost identical.
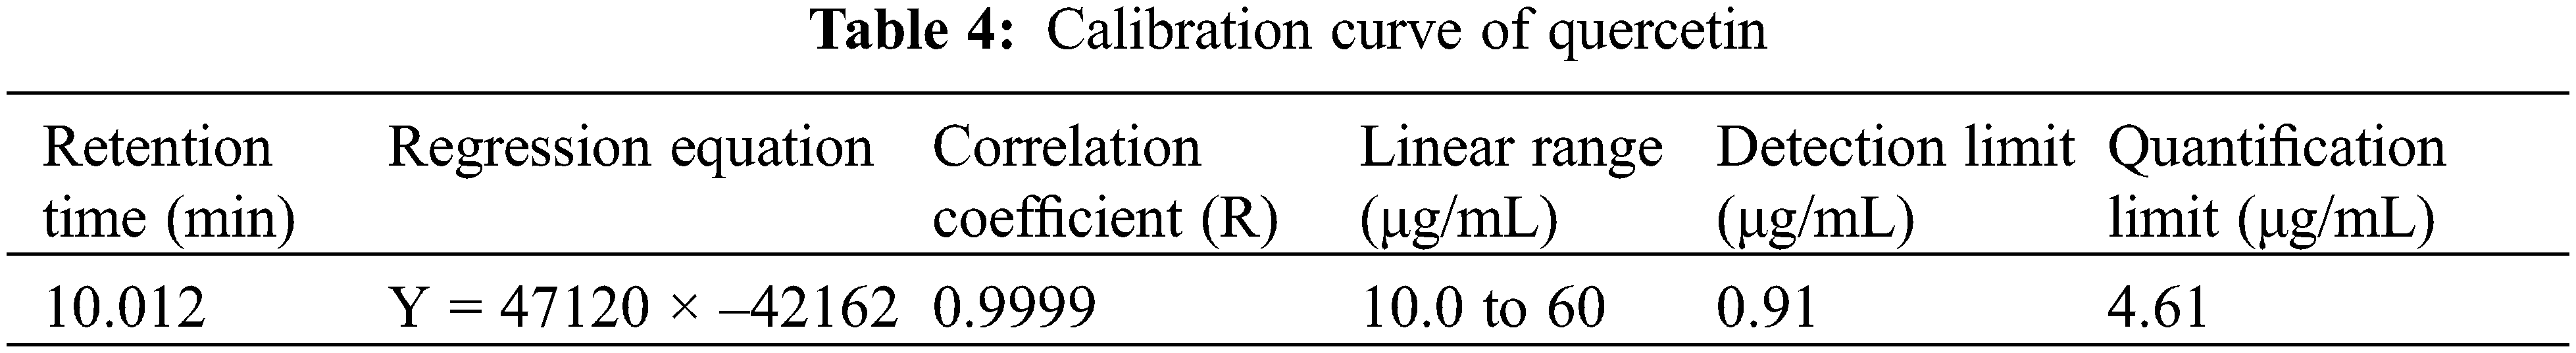
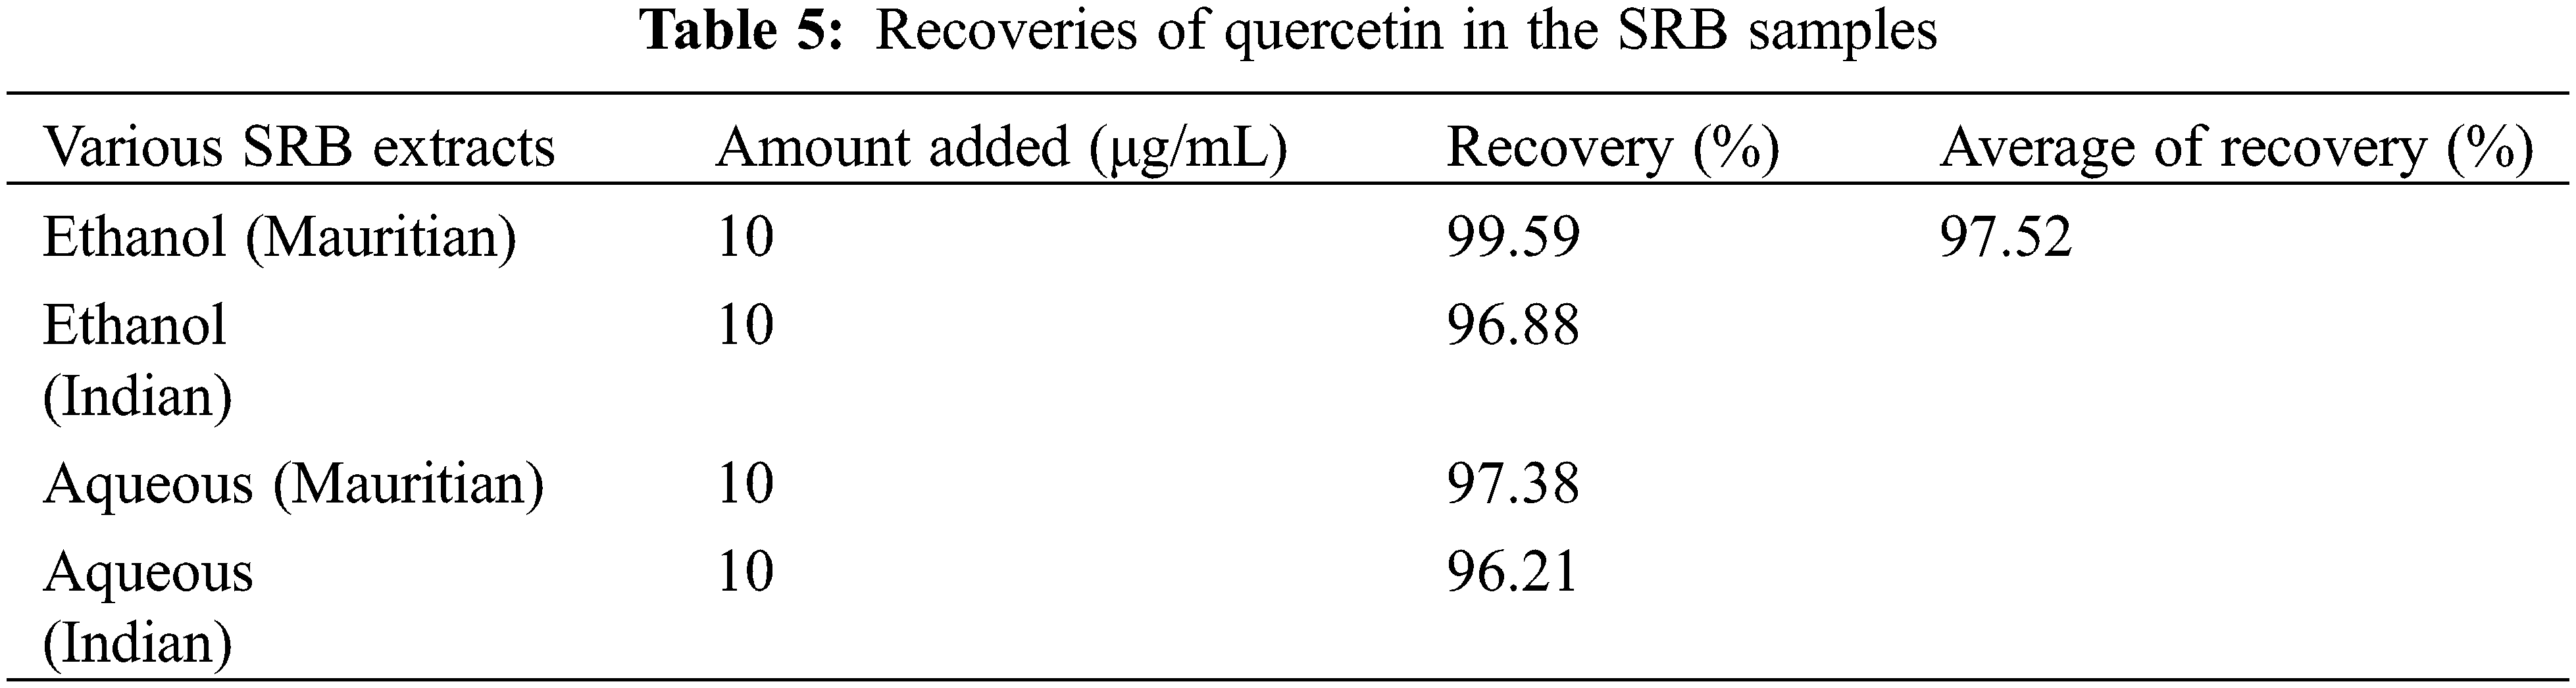
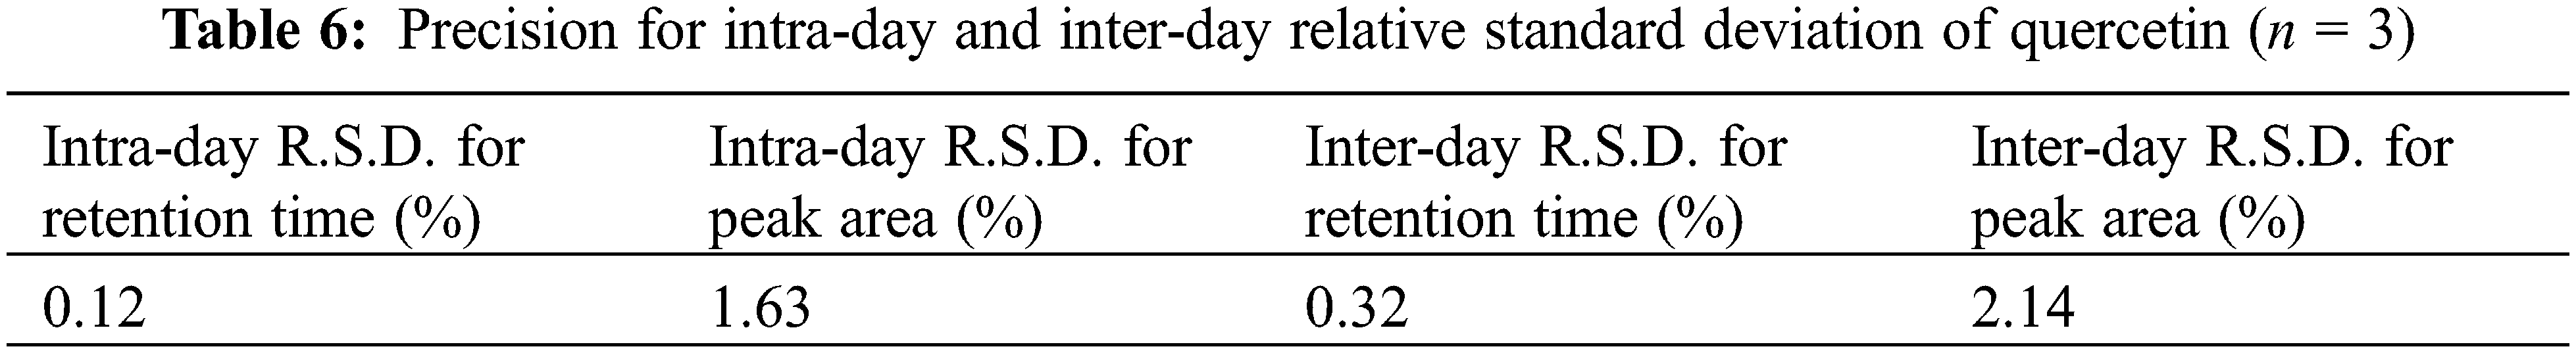
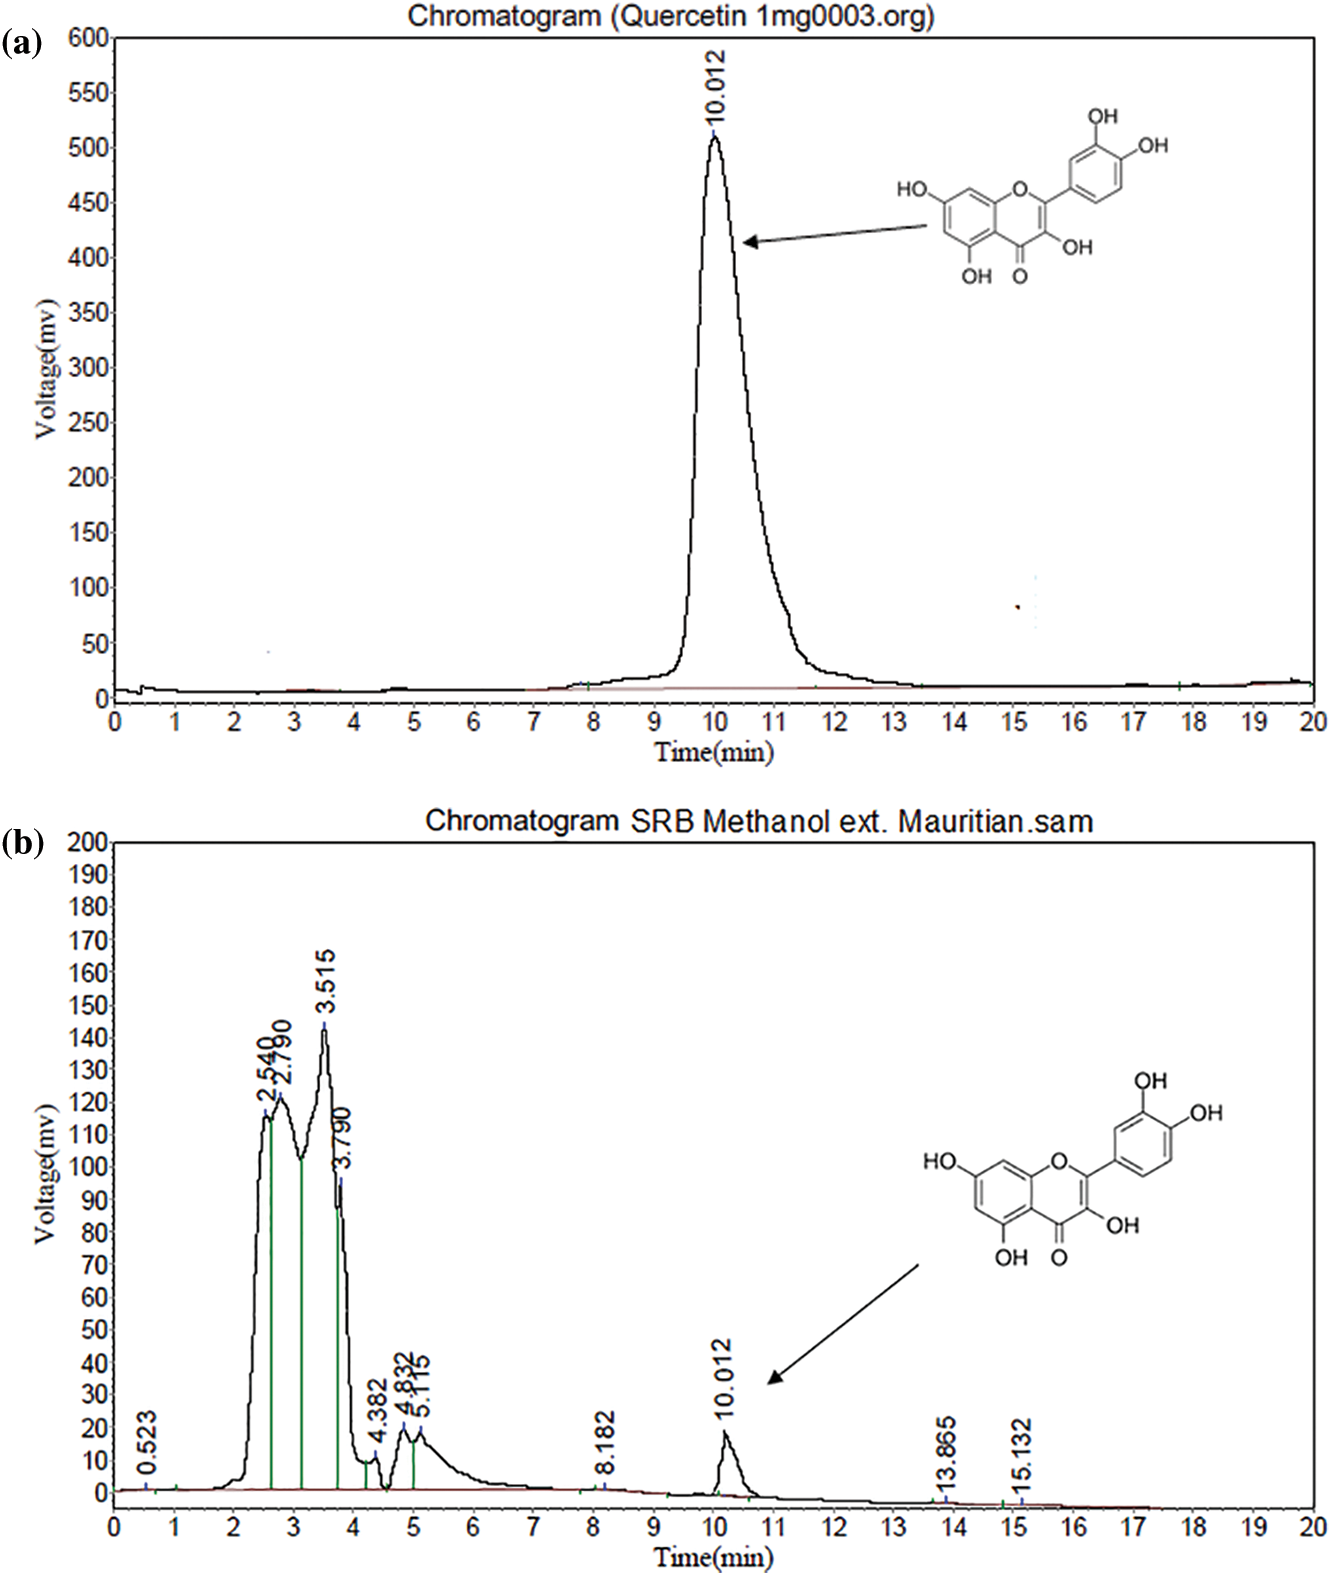
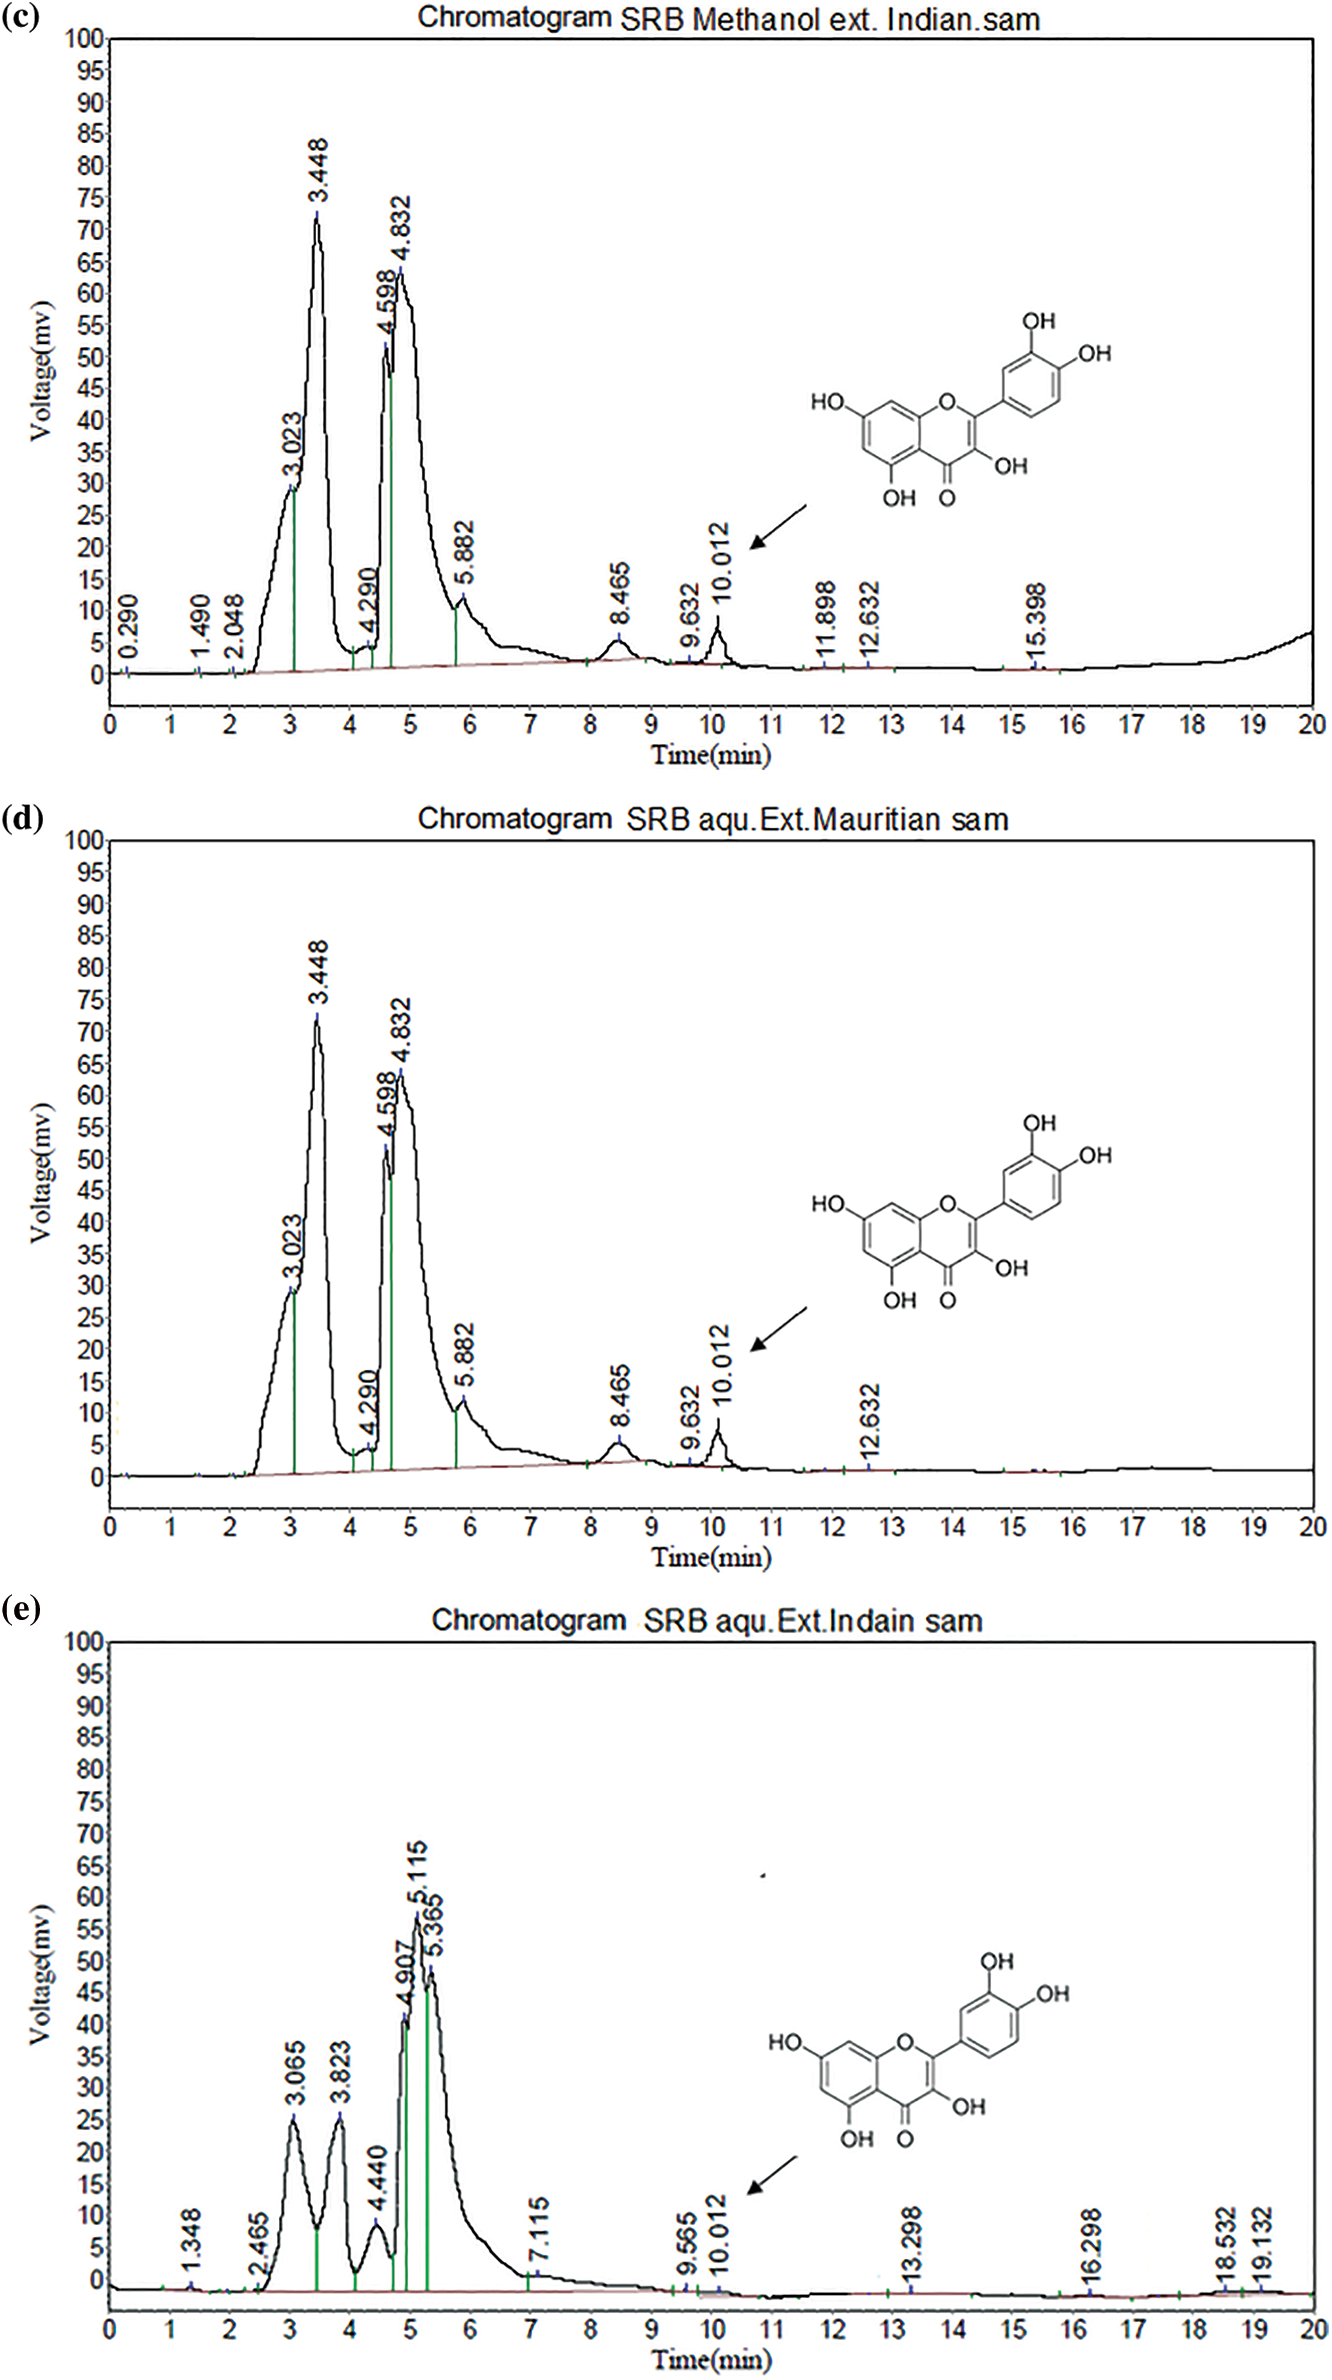
Figure 5: (a) HPLC of Standard quercetin (b) HPLC study of SRB ethanol sample (Mauritian) (c) HPLC study of SRB ethanol sample (Indian) (d) HPLC study of SRB aqueous sample (Mauritian) (e) HPLC study of SRB aqueous sample (Indian)
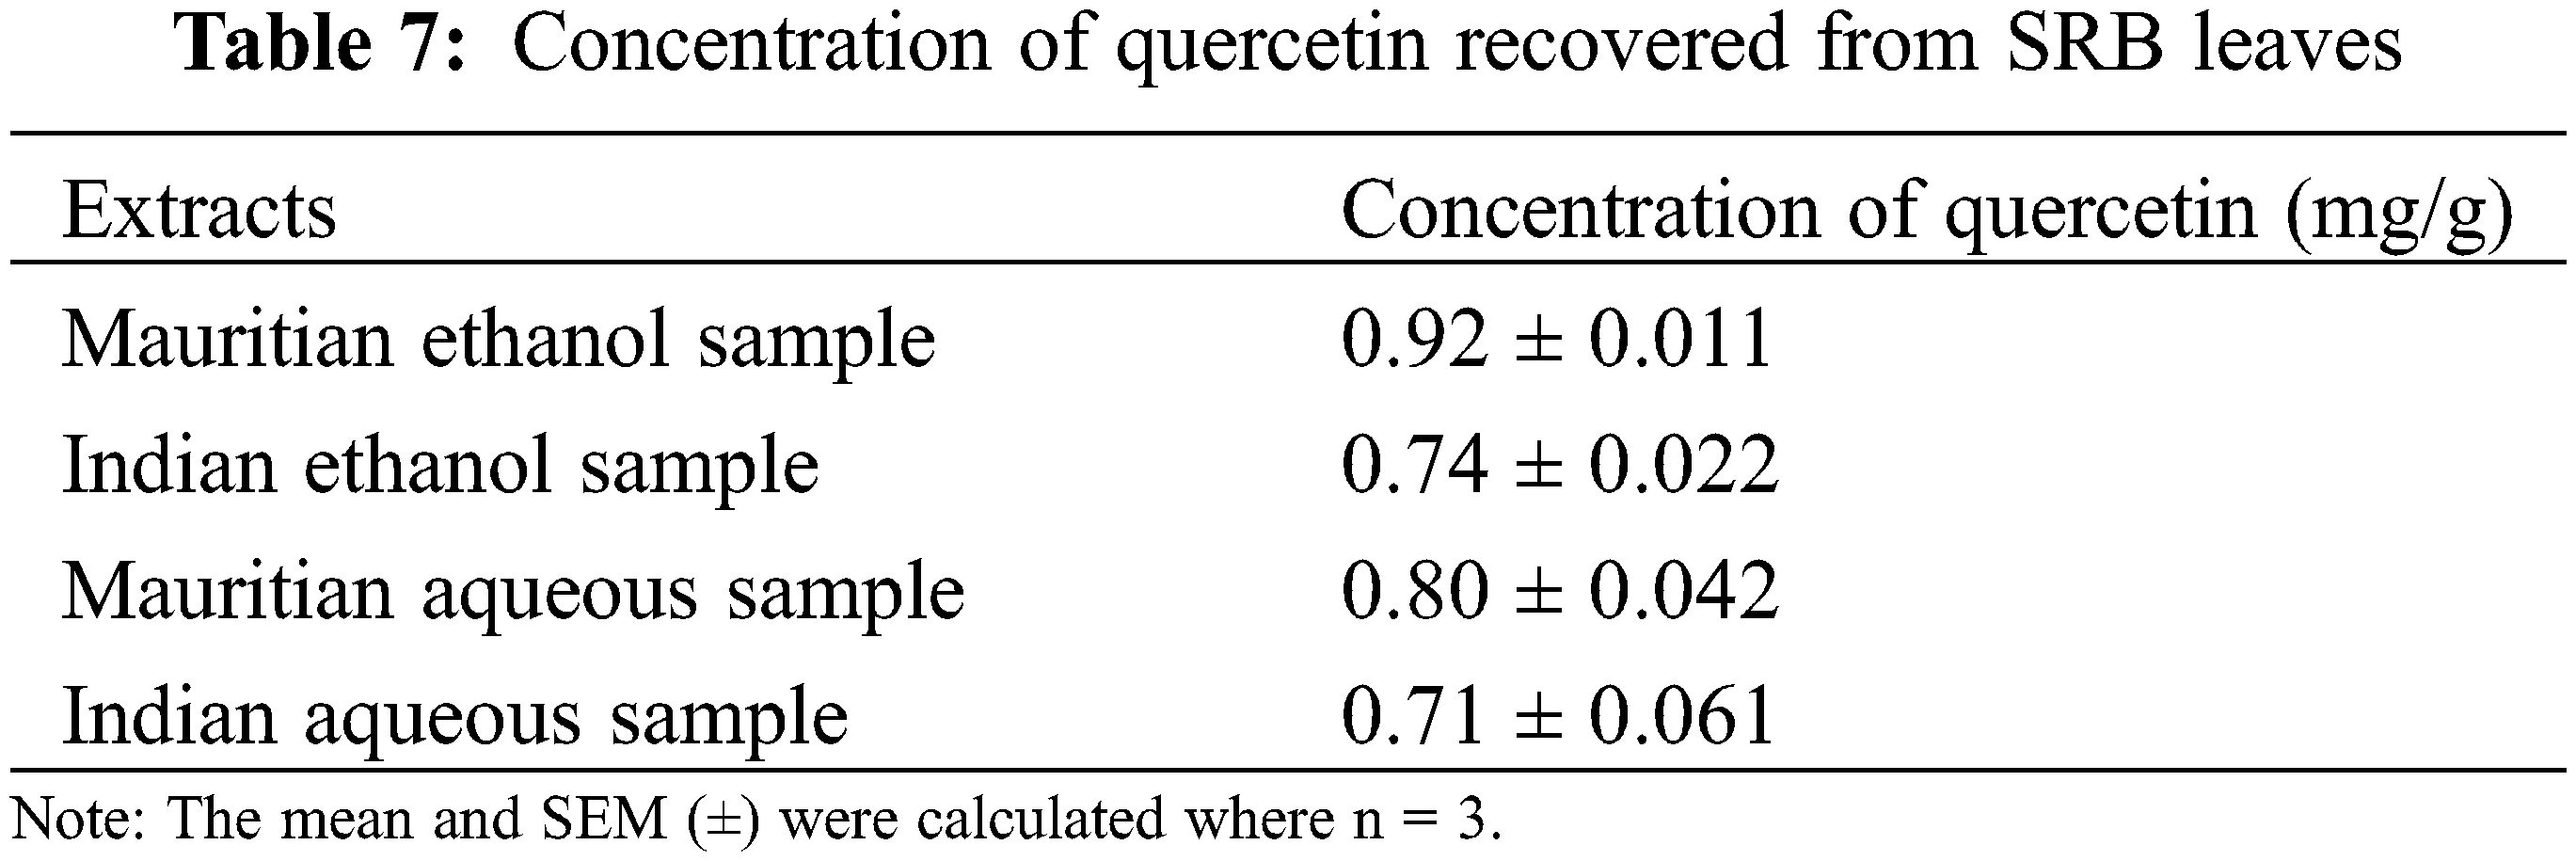
The present result showed that SRB ethanolic leaves extract recorded the highest quercetin concentration at 0.92 mg/g (Mauritian) followed by Indian sample as shown in Table 7.
Indian and Mauritius Stevia leaves were selected in the present study because of the easy availability and based on the soil nature. Mauritius soil (Place: Réduit) is more acidic (pH: 4.89) than Indian soil (pH: 5.18) from where Stevia leaves were collected (Place: Bangalore) and it was reported that acidic soil is much more favourable for the SRB growth and phytochemical contents [28]. Ethanol and aqueous leaves extract of SRB were carried out for two different geographically located samples, viz. India and Mauritius. The ethanol SRB leaves sample from Mauritius had a higher percentage of crude extract at 16.24%, followed by the ethanolic SRB sample from India, which had 13.12%. This increased percentage of leaves extract is due to less ash content in the SRN leaves sample of Mauritian origin. An earlier report also showed that ethanol leaves extract gave more yield than other solvent extracts [29]. Our present investigation also followed the same trend as the higher yield shown by the leaves extract from the Mauritius sample.
Moisture content and total ash content were estimated for powdered leaves separately for all the SRB samples. Results revealed that both the moisture and ash content were higher in leaves for the Indian SRB sample. This is due to more fibers, veins, and vein islets being present in the leaves which enhanced these contents. The earlier research evidence also proved the same [30,31], where leaves powder showed more moisture and ash content than any other plant part. Not only that, but all the proximate parameters also depend on the age of the leaves, the dimension of the leaves size, and the climatic conditions [32]. In the present investigation, Mauritian SRB leaves showed less ash content, moisture content, and crude fiber content than Indian ones. The main consequences of this discovery are that plant medications with a high moisture content will have a shorter shelf life. Following that, the ash values for each leaves of the SRB samples were examined independently to rule out the existence of any foreign materials such as soil, sand, or water-soluble salt adhesion to the drug’s surface. Because silica is commonly found in acid insoluble ash, a high level of acid insoluble ash is a sign of contamination with earthy materials. In the present investigation, the Indian SRB leaves showed more acid insoluble ash (4.41 ± 0.02%) than the Mauritian ones. It indicated the lowest content of bioactive compounds in the extract [29], which was also below the limits. The same result followed in the present study.
The study indicated that leaves of SRB collected from both geographical locations, showed the presence of glycosides, phenolics, flavonoids, steroids, saponins, proteins, and terpenoids when confirmed with chemical tests. But the concentration of the samples was higher with the Mauritian sample because of the fewer inorganic compounds present in the SRB sample. Similarly, an Indian SRB sample also showed the presence of these constituents but not prominently. It was reported that any medicinal or therapeutic activities mainly depend on the active constituents present in the plant parts [31]. Earlier research reported that solvent extracts also have effects on phytochemicals present in plants as well as on various therapeutic activities [33,34]. Our experiment also showed maximum constituents in ethanol solvent for leaves of SRB from the geographically located zones.
In vitro anti-diabetic activity was performed for the confirmation of its efficacy as an anti-diabetic plant because diabetic conditions lead to multiple complications in the human body, i.e., atherosclerosis-related myocardial infarction and stroke [35]. This is possible to reduce by decreasing uptake of carbohydrate related foods and requires breaking down complex forms of carbohydrates into simple forms of carbohydrates (monosaccharides) by α-amylase and α-glucosidases before absorption in the duodenum and upper jejunum [36]. Therefore, interesting results were found in this experiment, where an ethanolic sample showed higher inhibition than an aqueous extract. The earlier literature also reported a similar result with the high efficiency of ethanol extract as compared to aqueous extract towards the said enzymatic activities [24]. The activity was higher due to the presence of flavonoids (quercetin being one of them) in the Mauritian SRB sample. It was also reported that quercetin is one of the flavonoids that inhibits intestinal glucose absorption, insulin secretory and insulin-sensitizing activities and simultaneously improves utilization of glucose in peripheral tissues, which results in regulation of diabetic conditions [37].
Total flavonoid content was estimated higher in leaves ethanol extract of SRB from Mauritius. A similar trend followed for the Indian ethanol SRB extract. An ethanol solvent was used for the extraction, which increased the solubility of flavonoids. Flavonoids are also responsible for the bioactivity of the crude extracts. They also show antioxidant activity and a radical scavenging effect due to their hydroxyl groups [38]. In the present experiment, flavonoid content was estimated higher in Mauritian leaves than in Indian samples and showed a similar trend to the previous reports [39]. Following that, ash value has a correlation with the content of bioactive components in plants, with higher ash values indicating fewer bioactive components present in the leaves sample.
Based on the present phytochemical and proximate analysis investigations, further quercetin was identified by TLC for both the samples and identified the presence of quercetin in both the SRB leaves. Further quercetin content was estimated for both the SRB samples through a RP-HPLC study and resulted in a higher ethanolic SRB sample followed by the aqueous sample collected from both the geographical locations (India and Mauritius).
SRB leaves contain high level of flavonoids which are already reported as powerful antioxidant properties [40] and further antioxidant activity has correlation with the antidiabetic activity. Especially quercetin helps in inhibition of intestinal glucose absorption, insulin secretory and insulin-sensitizing activities and these actions improve glucose utilization in peripheral tissues and reveals antidiabetic action [40]. Further, in vitro model was selected for the above said study to minimize the animal experimentation and avoidance of animal killing. The outcome was also correlated with the proximate analysis and was consistent with previous findings [24,37].
To summarize, SRB leaves from both origins contain a significant amount of phytochemicals including flavonoids, particularly quercetin, and are likely to have a variety of pharmacological effects. In addition, we discovered anti-diabetic action in vitro, which could be attributable to the presence of quercetin and other flavonoids. Overall, the Mauritius sample had a high level of biologically active content and antidiabetic potential due to the soil nature especially acidic pH (4.89), demonstrating that geographic location has an impact on plant materials including the therapeutic efficacy especially antidiabetic potentiality. However, more research is required to determine the impact of geographical origin on specific pharmacological activities of the plant to confirm the findings of our study.
Acknowledgement: All the authors of this manuscript are thankful to their respective institutes/Universities for successful completion of this study.
Institutional Review Board Statement: Not applicable.
Funding Statement: Walaa F. Alsanie would like to acknowledge Taif University for support No. TURSP (2020/53). Syed Mohammed Basheeruddin Asdaq, would like to thank AlMaarefa University, Riyadh, Saudi Arabia for extending support (TUMA-2021-1) to do this research.
Conflicts of Interest: The authors declare that they have no conflicts of interest to report regarding the present study.
1. Abdel-Azim, A., Abdel-Rahmanb, M. S., Ashry1, E. E., Abd-Elhamid, D. H., Soad, A. (2019). The potential utility of aqueous extract of Stevia rebaudiana Bertoni in adjunct with metformin in treating diabetes mellitus. American Journal of Biomedical Science & Research, 2(5), 185–196. DOI 10.34297/AJBSR.2019.02.000605. [Google Scholar] [CrossRef]
2. Carrera-Lanestosa, A., Moguel-Ordóñez, Y., Segura-Campos, M. (2017). Stevia rebaudiana Bertoni: A natural alternative for treating diseases associated with metabolic syndrome. Journal of Medicinal Food, 20, 933–943. DOI 10.1089/jmf.2016.0171. [Google Scholar] [CrossRef]
3. Gasmalla, M. A. A., Yang, R., Hua, X. (2014). Stevia rebaudiana Bertoni: An alternative sugar replacer and its application in food industry. Food Engineering Reviews, 6(4), 150–162. DOI 10.1007/s12393-014-9080-0. [Google Scholar] [CrossRef]
4. Peteliuk, V., Rybchuk, L., Bayliak, M., Storey, K. B., Lushchak, O. (2021). Natural sweetener Stevia rebaudiana: Functionalities, health benefits and potential risks. EXCLI Journal, 20, 1412–1430. DOI 10.17179/excli2021-4211. [Google Scholar] [CrossRef]
5. Ismail, T., Ponya, Z., Mushtaq, H., Masood, A. (2020). Stevia a bio sweetener scope in the European Union as a commercial product. American-Eurasian Journal of Sustainable Agriculture, 14(2), 23. DOI 10.22587/aejsa.2020.14.2.3. [Google Scholar] [CrossRef]
6. Wölwer-Rieck, U. (2012). The leaves of Stevia rebaudiana (Bertonitheir constituents and the analyses thereof: A review. Journal of Agricultural and Food Chemistry, 60(4), 886–895. DOI 10.1021/jf2044907. [Google Scholar] [CrossRef]
7. Atteh, J., Onagbesan, O., Tona, K., Buyse, J., Decuypere, E. et al. (2011). Potential use of Stevia rebaudiana in animal feeds. Archivos de Zootecnia, 60(229), 133–136. DOI 10.4321/S0004-05922011000100015. [Google Scholar] [CrossRef]
8. Nemeth, A., Janosi, S. Z. (2019). Extraction of steviol glycosides from dried Stevia rebaudiana by pressurized hot water extraction. Acta Alimentaria, 48(2), 241–252. DOI 10.1556/066.2019.48.2.12. [Google Scholar] [CrossRef]
9. Moongngarm, A., Sriharboot, N., Loypimai, P., Moontree, T. (2022). Ohmic heating-assisted water extraction of steviol glycosides and phytochemicals from Stevia rebaudiana leaves. LWT, 154, 112798. DOI 10.1016/j.lwt.2021.112798. [Google Scholar] [CrossRef]
10. Bajčan, D., Tomáš, J., Uhlířová, G., Arvay, J., Trebichalský, P. et al. (2013). Antioxidant potential of spinach, peas and sweet corn in relation to freezing period. Czech Journal of Food Sciences, 31(6), 613–618. DOI 10.17221/529/2012-CJFS. [Google Scholar] [CrossRef]
11. Ruiz, J. C. R., Ordoñez, Y. B. M., Basto, A. M., Campos, M. R. S. (2014). Basto, Antioxidant capacity of leaf extracts from two Stevia rebaudiana Bertoni varieties adapted to cultivation in Mexico. Nutricion Hospitalaria, 31, 1163–1170. DOI 10.3305/nh.2015.31.3.8043. [Google Scholar] [CrossRef]
12. Awan, U. S. A. M. A., Raza, M. A. (2012). Green consumer behavior: Empirical study of swedish consumer behavior. Recent Researches in Economics, 1, 89–104. [Google Scholar]
13. Das, K., Kathiriya, A. K. (2012). Hepatoprotective activity of Stevia rebaudiana Bert. leaves against thioacetamide induced toxicity. Turkish Journal of Pharmaceutical Sciences, 9, 343–352. [Google Scholar]
14. Das, K. (2013). Wound healing potential of aqueous crude extract of Stevia rebaudiana in mice. Revista Brasileira de Farmacognosia, 23(2), 351–357. [Google Scholar]
15. Das, K., Dang, R., Gupta, N. (2009). Comparative antimicrobial potential of different extracts of leaves of Stevia rebaudiana Bert. International Journal of Natural and Engineering Sciences, 3(1), 59–62. DOI 10.1590/S0102-695X2013005000011. [Google Scholar] [CrossRef]
16. Ajami, M., Seyfi, M., Abdollah Pouri Hosseini, F., Naseri, P., Velayati, A. et al. (2020). Effects of stevia on glycemic and lipid profile of type 2 diabetic patients: A randomized controlled trial. Avicenna Journal of Phytomedicine, 10(2), 118–127. DOI 10.22038/ajp.2019.13652. [Google Scholar] [CrossRef]
17. Li, Y. Q., Kong, D., Fu, Y., Michael, R., Wu, S. H. (2020). The effect of developmental and environmental factors on secondary metabolites in medicinal plants. Plant Physiology and Biochemistry, 148, 80–89. DOI 10.1016/j.plaphy.2020.01.006. [Google Scholar] [CrossRef]
18. Adegbaju, O. D., Otunola, G. A., Afolayan, A. J. (2020). Effects of growth stage and seasons on the phytochemical content and antioxidant activities of crude extracts of Celosia argentea L. Heliyon, 6(6), e04086. [Google Scholar]
19. Krishna, T. A., Krishna, T. A., Kumuthakallavalli, R., Raj, V. S., Juliet, S. et al. (2014). Physico-chemical evaluation and biochemical quantification of crude drug powder (stem) of Chassaliacurviflora (Wall. ex Kurz.) Thwaites; A folk medicinal plant. Journal of Pharmacognosy and Phytochemistry, 3(4), 121–124. [Google Scholar]
20. Ilodibia, C. V., Ewere, F. U., Akachukwu, E. E., Adimonyemma, R. N., Igboabuchi, N. A. et al. (2016). Proximate composition, vitamin and anatomical studies on Gomphrena celosioides. Annual Research and Review in Biology, 10, 1–6. DOI 10.9734/ARRB/2016/25546. [Google Scholar] [CrossRef]
21. Sabir, S. M., Maqsood, H., Hayat, I., Khan, M. Q., Khaliq, A. (2005). Elemental and nutritional analysis of sea buckthorn (Hippophaerhamnoides sp. turkestanica) Berries of Pakistani Origin. Journal of Medicinal Food, 8(4), 518–522. DOI 10.1089/jmf.2005.8.518. [Google Scholar] [CrossRef]
22. Donkor, A. M., Mosobil, R., Suurbaar, J. (2016). In vitro bacteriostatic and bactericidal activities of Senna alata, Ricinus communis and Lanneabarteri extracts against wound and skin disease causing bacteria. Journal of Analytical & Pharmaceutical Research, 3(1), 00046. DOI 10.15406/japlr.2016.03.00046. [Google Scholar] [CrossRef]
23. Pant, G., Sai, K., Babasaheb, S., Reddy, R., Sibi, G. (2013). In vitro α-amylase and α-glucosidase inhibitor activity of abutilon indicum leaves. Asian Journal of Pharmaceutical and Clinical Research, 6(5), 22–24. [Google Scholar]
24. Ramana MurtyKadali, S. L. D. V., Das, M. C., Vijayaraghavan, R., Shanmukha, I. (2017). In vitro evaluation of antidiabetic activity of aqueous and ethanolic leaves extracts of Chloroxylon swietenia. National Journal of Physiology, Pharmacy and Pharmacology, 7(5), 486–490. DOI 10.5455/njppp.2017.7.1235104012017. [Google Scholar] [CrossRef]
25. Ayoola, G. A., Ipav, S. S., Sofidiya, M. O., Adepoju-Bello, A. A., Coker, H. A. et al. (2008). Phytochemical screening and free radical scavenging activities of the fruits and leaves of Allanblackia floribunda Oliv (Guttiferae). International Journal of Health Research, 1(2), 87–93. DOI 10.4314/ijhr.v1i2.47920. [Google Scholar] [CrossRef]
26. Mukherjee, P. K., Wahile, A. (2006). Perspectives of safety for natural health products. In: Herbal drugsda twenty first century perspectives, pp. 50–59.Jaypee Brothers, Medicinal Publishers, Ltd. http://www.jaduniv.edu.in/viewAllDataPopUpProfile.php?uid=556&pageName=BooksPublished. [Google Scholar]
27. Radić, S., Vujčić, V., Glogoški, M., Radić-Stojković, M. (2016). Influence of pH and plant growth regulators on secondary metabolite production and antioxidant activity of Stevia rebaudiana (Bert). Periodicum Biologorum, 118(1), 9–19. DOI 10.18054/pb.2016.118.1.3420. [Google Scholar] [CrossRef]
28. Samydurai, P., Thangapandian, V. (2012). Physico-phytochemical analysis and their minimum inhibitory concentrations of various extracts of Decalepishamiltonii Wight &Arn against gastrointestinal disorder pathogens. International Journal of Pharmacy and Pharmaceutical Sciences, 4(3), 289–292. [Google Scholar]
29. Borkataky, M. U. N. M. I., Kakoty, B. B., Saikia, L. R. (2013). Proximate analysis and antimicrobial activity of Eclipta alba (L.) Hassk.—A traditionally used herb. International Journal of Pharmacy and Pharmaceutical Sciences, 5(1), 149–154. [Google Scholar]
30. Puthalath, S., Dang, R., Das, K. (2015). Total safety management through standardization of formulated ayurvedic Kajal using Eclipta alba and Vernonia cinerea herbs. World Scientific News, 11, 31–43. [Google Scholar]
31. Oduntan, A. O., Olaleye, O., Akinwande, B. A. (2012). Effect of plant maturity on the proximate composition of Sesamum radiatum Schum leaves. Journal of Food Studies, 1(1), 69–76. DOI 10.5296/jfs.v1i1.1806. [Google Scholar] [CrossRef]
32. Ahmad, A., Husain, A., Mujeeb, M., Khan, S. A., Alhadrami, H. A. A. et al. (2015). Quantification of total phenol, flavonoid content and pharmacognostical evaluation including HPTLC fingerprinting for the standardization of Piper nigrum Linn fruits. Asian Pacific Journal of Tropical Biomedicine, 5(2), 101–107. DOI 10.1016/S2221-1691(15)30152-0. [Google Scholar] [CrossRef]
33. Naima, R., Oumam, M., Hannache, H., Sesbou, A., Charrier, B. et al. (2015). Comparison of the impact of different extraction methods on polyphenols yields and tannins extracted from Moroccan Acacia mollissima barks. Industrial Crops and Products, 70, 245–252. DOI 10.1016/j.indcrop.2015.03.016. [Google Scholar] [CrossRef]
34. Felhi, S., Daoud, A., Hajlaoui, H., Mnafgui, K., Gharsallah, N. et al. (2017). Solvent extraction effects on phytochemical constituents profiles, antioxidant and antimicrobial activities and functional group analysis of Ecballium elaterium seeds and peels fruits. Food Science and Technology, 37, 483–492. DOI 10.1590/1678-457x.23516. [Google Scholar] [CrossRef]
35. Pothireddy, S., Chukka, S., Shankaraiah, P. (2014). Evaluation of antidiabetic, antidyslipidemic & hepatoprotective activity of Homalium zeylanicum in alloxan induced diabetic rats. International Journal of Research and Development in Pharmacy and Life Sciences, 3(3), 1004–1010. [Google Scholar]
36. Mohamed, E. A., Siddiqui, M. J., Ang, L. F., Sadikun, A., Chan, S. H. et al. (2012). Potent α-glucosidase and a-amylase inhibitory activities of standardized 50% ethanolic extracts and sinensetin from Orthosiphon stamineus Benth as anti-diabetic mechanism. BMC Complementary and Alternative Medicine, 12, 176. DOI 10.1186/1472-6882-12-176. [Google Scholar] [CrossRef]
37. Eid, H. M., Haddad, P. S. (2017). The Antidiabetic potential of quercetin: Underlying mechanisms. Current Medicinal Chemistry, 24(4), 355–364. DOI 10.2174/0929867323666160909153707. [Google Scholar] [CrossRef]
38. Tomsone, L., Kruma, Z., Galoburda, R. (2012). Comparison of different solvents and extraction methods for isolation of phenolic compounds from horseradish roots (Armoracia rusticana). World Academy of Science, Engineering and Technology, 64(4), 903–908. [Google Scholar]
39. Baba, S. A., Malik, S. A. (2015). Determination of total phenolic and flavonoid content, antimicrobial and antioxidant activity of a root extract of Arisaema jacquemontii Blume. Journal of Taibah University for Science, 9(4), 449–454. DOI 10.1016/j.jtusci.2014.11.001. [Google Scholar] [CrossRef]
40. Xu, D., Hu, M. J., Wang, Y. Q., Cui, Y. L. (2019). Antioxidant activities of quercetin and its complexes for medicinal application. Molecules, 24(6), 1123. DOI 10.3390/molecules24061123. [Google Scholar] [CrossRef]
 | This work is licensed under a Creative Commons Attribution 4.0 International License, which permits unrestricted use, distribution, and reproduction in any medium, provided the original work is properly cited. |