| Phyton-International Journal of Experimental Botany |
DOI: 10.32604/phyton.2022.021422
ARTICLE
Spatial Heterogeneity of Selected Soil Nutrients Related to Torreya grandis cv. Merrillii Plantation in Southeastern China
1Key Laboratory of Soil Contamination Bioremediation of Zhejiang Province, Zhejiang Agriculture and Forestry University, Hangzhou, 311300, China
2Zhejiang Public Welfare Forest and State Forest Farm Management Station, Hangzhou, 310020, China
*Corresponding Author: Keli Zhao. Email: kelizhao@zafu.edu.cn
#These two authors contributed equally to this work
Received: 13 January 2022; Accepted: 15 February 2022
Abstract: Chinese Torreya grandis (Torreya grandis cv. Merrillii) is a unique economic tree species in China. Intensive management related to application of chemical fertilizer and herbicides caused serious soil quality degradation of Chinese Torreya grandis plantations. Totally, 120 soil samples were collected from the main disbtributed areas of Chinese Torreya grandis in Southeastern China. In this area, soil pH values varied from 3.68 to 6.78, with a median value of 4.91, implying a trend of acidification. The average concentrations of organic matter, available nitrogen, available phosphorus and available potassium were 27.52 g kg−1, 135.77 mg kg−1, 15.12 mg kg−1, and 153.43 mg kg−1, respectively. The results of spatial analysis revealed that target variables had clear spatial patterns. The soil fertility was relevantly high in most of the study area, with soil nutrient imbalances existing. The stand age had a large effect on soil properties, which were also mainly influenced by human activities. Therefore, it is necessary to change the fertilization method for a sustainable management of Torreya grandis plantation.
Keywords: Torreya grandis cv. Merrillii; soil nutrients; geostatistics; Moran’s I; evaluation for soil fertility
Soil provides essential nutrients for plant growth, also makes a vital contribution to human life activities and the balance of the ecosystem [1]. Therefore, soil quality directly affects the biological diversity and the quality of crops. Improper human management measures such as over-application of fertilizer have led to the uneven distribution of soil nutrients at different regional scales, thus causing degradation of soil quality [2]. Soil degradation could cause a series of changes in crop growth, such as affecting the growth process of crops, which is mainly reflected by the crop yield decrease due to uneven distribution of nutrients. Soil fertility is the core foundation and essential characteristics of soil quality, which is closely related to soil nutrients, and has a strong impact on crop yield, fertilizer input, cultivation methods and natural environment [3]. Soil fertility directly affects crop growth, yield and quality of agricultural products [4]. Scientific and reasonable soil fertility assessment is the key to manage soil changes in the field, which is of great significance to guide the fertilization of farmland, maintain soil health and improve environmental quality [3–5]. Moreover, it is conducive to the optimization and sustainable development of agricultural ecosystem [4,6].
Different environmental conditions, management measures and fertilizer requirements of crops can affect the distribution of soil nutrients, while uneven distribution of soil nutrients will significantly affect the growth of crops. In order to achieve the high yield of crops, it is often necessary to test the soil nutrient status, usually including the determination of organic matter (OM), pH, total nitrogen (TN), available phosphorus (AP), available potassium (AK), etc., which then could be used to guide the fertilization and a series of management measures [7]. Soil OM can promote soil physical and chemical properties while providing the necessary nutrients for crop growth and the suitable environment. pH can affect the effectiveness of nutrient elements in soil. Soil nitrogen levels can reflect crop yield and quality. Available phosphorus (AP) and available potassium (AK) can be absorbed by plants directly. Uneven distribution of nutrients will hinder the synthesis of crop and energy, decrease the yield, lead to frequent occurrence of diseases and insect pests, etc. Therefore, it is of importance to understand the distribution pattern of soil nutrients to provide effective measures for soil improvement [1].
Economic forest industry can bring ecological benefit, economic benefit and social benefit to agricultural development. Harvesting and utilization of economic forests is less ecologically destructive than timber harvesting and can therefore be an important component of sustainable forest management for their ecosystem services [8,9]. Economic forest have the potential to alleviate poverty and protect nature in many protected areas around the world because of the renewable ability, which can increase rural income while reducing the impact on forest structure [8,10,11]. Currently, effective spatial auto-correlation methods such as geostatistics and Moran’s I are popular in revealing the spatial patterns of environmental variables [12]. In recent decades, most of the research on the spatial heterogeneity of soil nutrients has focused on farmland and grasslands [13], but few in-depth analyses are carried out on nutrient distribution patterns and evaluation of integrated soil fertility of economic forests. Fu et al. [14] studied the spatial heterogeneity of nutrients in grassland soils in Ireland which provided the basis for a variable rate fertilization model. Ma et al. [15] revealed the spatial variability of soil nutrients in the grasslands along the Kunes River in Xinjiang, China, indicating that the improvement of soil organic matter in the region through changes in land use and agricultural practices will benefit grassland protection.
Torreya grandis cv. Merrillii, an evergreen plant of the Taxus family, is an excellent species which is artificially bred from Torreya grandis Fortune ex Lindley. Torreya grandis is a unique economic forest species in China. Torreya grandis has extremely high nutritional and medicinal values, which is of great significance to human health (disease prevention and improvement of immunity). Moreover, Torreya nut has special fragrance and excellent taste, which is a favorite nut snack in Chinese daily life [16]. Up to date, few studies has been carried out to study the spatial distribution of soil nutrients in the Torreya grandis plantation. The main objectives were: (1) to clarify the spatial distribution of soil nutrients in a typical Torreya grandis region; (2) to discuss spatial heterogeneity and evaluation of integrated soil fertility in the Torreya grandis region; (3) to explore the improvement measures for soil nutrients imbalance and provide a scientific basis for site-specific fertilization.
2.1 Study Site and Sample Collection
The study was conducted in Zhejiang Province of China (118°01′~123°10′E and 27°06′~31°11′N) (Fig. 1), which has a subtropical monsoon climate, with a mean temperature of 16.5oC, an average annual rainfall of 1490 mm and sunshine duration of 1774 h. Parent soil rocks mainly include rhyolite, tuff and rhyolite tuff, and the soil types are mainly red soil, yellow soil and yellow-red soil [17,18]. Torreya grandis generally grows in the alpine environment of 200–800 m above sea level, especially in the ecologically warm, humid environment with less sunshine [19]. The total planting area of Torreya in Zhejiang Province has reached 48,000 ha with the annual output of 6000 t, accounting for 94% of the total national output [20]. The research samples are selected from the typical Torreya grandis production areas in the cities of Zhuji, Shengzhou, Keqiao and Dongyang in the Kuaiji Mountains of Zhejiang Province. Torreya grandis plantations in this area account for 65% of the total province’s area and 80% of its output [21,22].
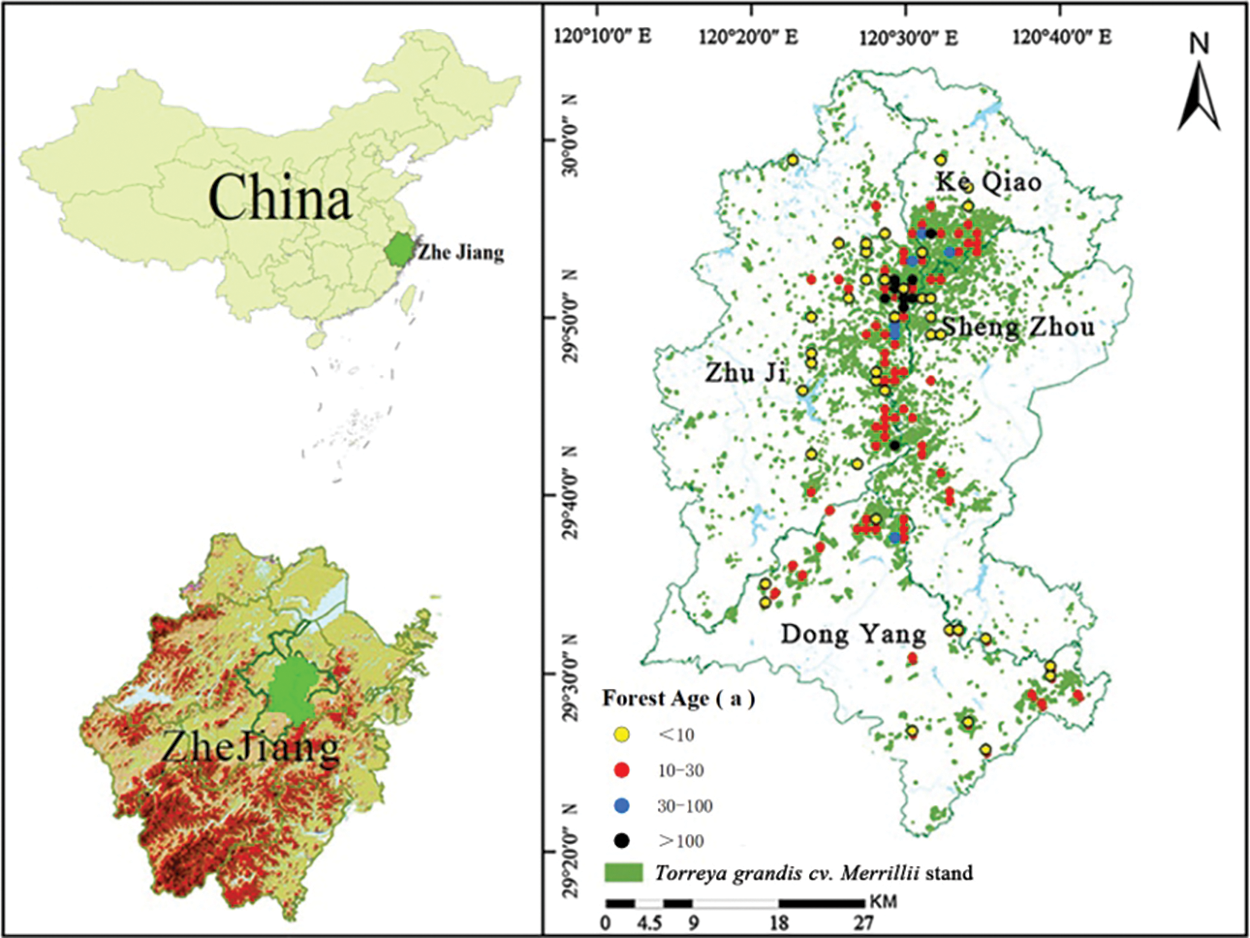
Figure 1: Soil sampling distribution map
In 2019, 120 soil samples were collected from the Torreya grandis plantation including different stand age which is divided into four categories (0–10 years, 10–30 years, 30–100 years and above 100 years, respectively), using a grid of 1.0 km × 1.0 km and accurate positioning was recorded by a hand-held GPS. At the selected sample points, the surface soil samples (0~20 cm) of 5 sub-sample points were gathered and distributed according to the shape of “plum blossom” within a radius of 10 m. The samples were evenly mixed to form a soil sample with a weight of about 1 kg. At the same time, information such as site conditions, household management and Torreya grandis yield of Torreya grandis plantation was recorded.
Soil samples were pretreated following Bao’s [22]. Soil pH was measured with a ratio of 1:2.5 (soil: water). Potassium dichromate oxidation method was used to determine SOM. The alkali-hydrolyzed diffusion method, Olsen method and ammonium acetate leaching-flame photometric method were taken to measure AN, AP and AK, respectively [23].
The semi-variogram is popularly applied in studying spatial patterns of environmental variables, which could be found in detail in relevant references [24–28]. Moran’s I index can systematically reveal the spatial autocorrelation of research variables, which usually includes global and local Moran’s I [29]. Detailed description could be found in previous references [25,30,31].
2.4 Soil Fertility Evaluation Method
Based on previous research results, the above mentioned elements were selected to represent soil fertility quality, We used the membership function method to normalize the indicators, and converted each indicator into a dimensionless value from 0.1 to 1 [32]. Due to the different effect curves of plants, the membership function is divided into S-shaped and parabolic. Combining previous studies and the fertility characteristics of forest soil [16], value of each index in the type function is shown in Table 1.
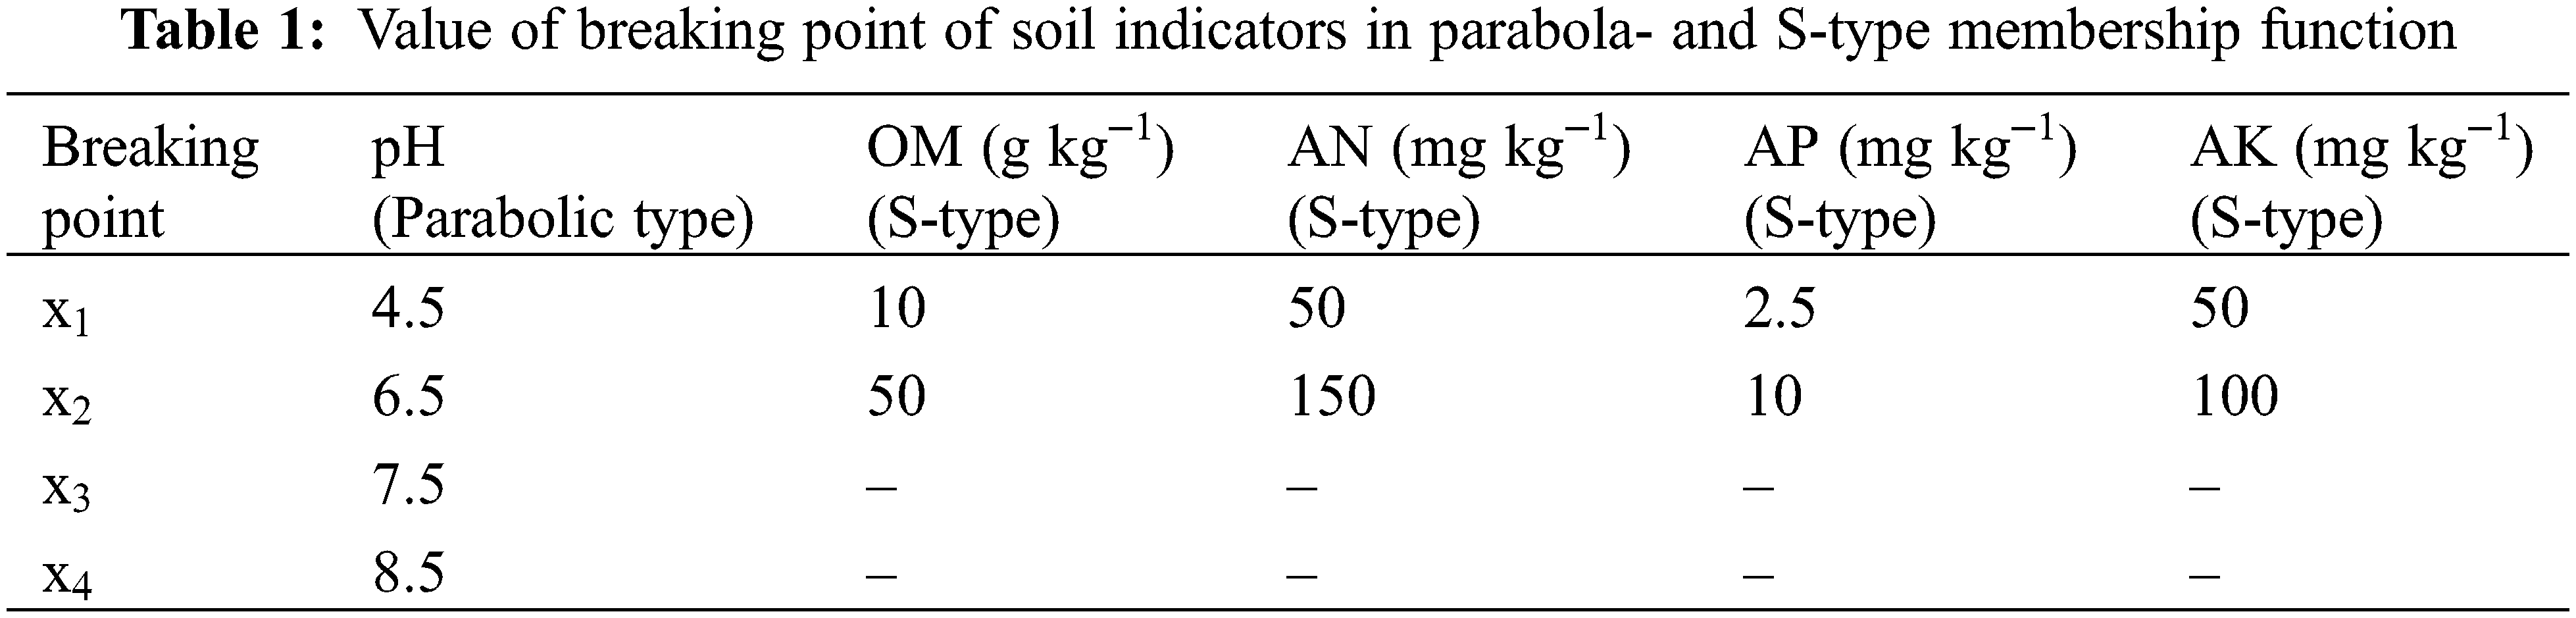
In this study, only pH belongs to the parabolic type, and the other four indexes belong to the sigmoidal function, and the formula is as follows:
Parabolic:
Type S:
where Wi is the membership degree of the index; x is the measured value of the index; x1, x2, x3 and x4 are the classified levels of the indicator.
The weight of soil evaluation index is determined by factor analysis method. The proportion of the common factor variance of each evaluation index is the weighted value [33]. After evaluating each index, the single-factor evaluation result needs to be converted into a comprehensive soil fertility evaluation result. The method of additive synthesis is applied to obtain the comprehensive fertility evaluation index of soil by weighting and summing the membership value of each index. The formula is as follows:
where IFI is the integrated soil fertility evaluation;
This paper uses Kolmogorov-Smirnov (K-S) to test the normality of the data set. K-Sp > 0.05 means that the data conforms to the normal distribution, and the data that does not conform to the normality needs to be logarithmically transformed [34,35]. The analysis of variance (ANOVA) was used to test effects of forest ages on soil pH, OM, AN, AP and AK in Torreya grandis plantations. Duncan’s multiple range test method was used for multiple comparison when a significant effect was detected (α = 0.05). SPSS (version 25.0, SPSS Inc., Chicago, IL, USA) and R software (version 3.3.3) were used for statistical analysis and normal distribution test on the data. The Geoda software (Gamma Design Software, Plainwell, Michigan) was used to analyze and identify spatial clusters and outliers and calculate spatial autocorrelation coefficients. All soil physical and chemical index spatial distribution maps were based on ArcGIS 10.2 software (ESRI, Redlands, CA, USA).
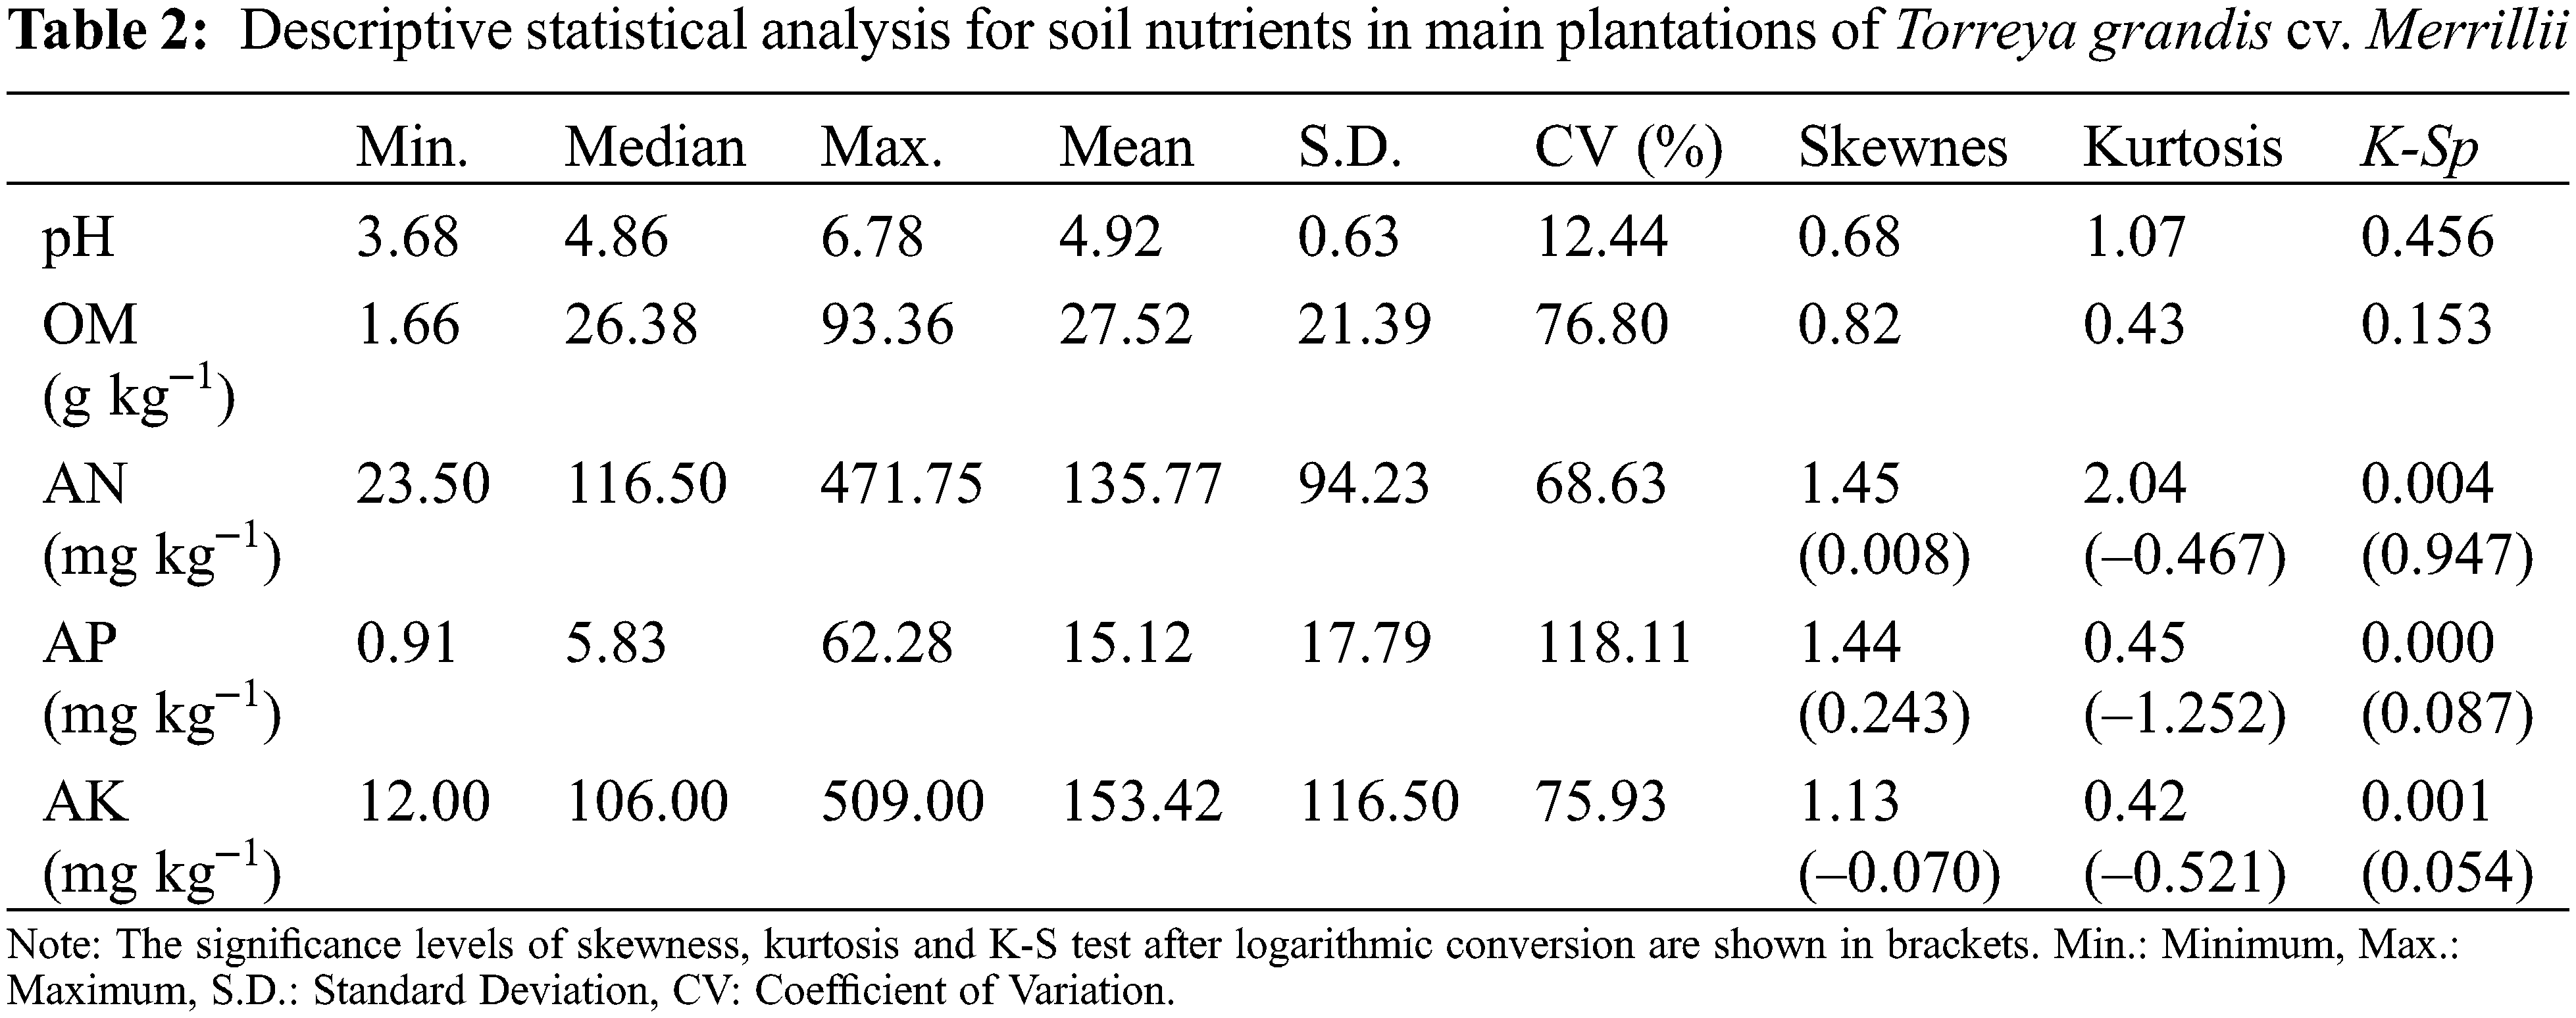
3.1 Descriptive Analysis of Soil Nutrients in Torreya grandis Plantation
As shown in Table 2, pH values of Torreya grandis plantation in the study area ranged from 3.68 to 6.81, with an average value of 4.91. The average values of SOM, AN, AP and AK in the study area were 27.52, 135.77, 15.12 and 153.42 mg kg−1, respectively. Only the pH value was moderately variable, while the other four nutrient elements showed a high variation.
3.2 Spatial Clustering and Outlier Analysis of Soil Fertility Indexes
The global Moran’s I values of soil pH, OM, AN, AP and AK were 0.14, 0.24, 0.20, 0.29, 0.23, respectively, indicating a significantly positive autocorrelation (P < 0.05). The local Moran’s I indicated that the high-value-clusters of soil pH were mainly distributed in Zhuji City, while the low-value-cluster areas were mainly distributed in Keqiao City (Fig. 2). The spatial autocorrelation distributions of soil OM, AN, AP and AK are relatively similar. High-value areas located in the cities of Keqiao and Shengzhou, and low-value located in the city of Zhuji City and Dongyang.
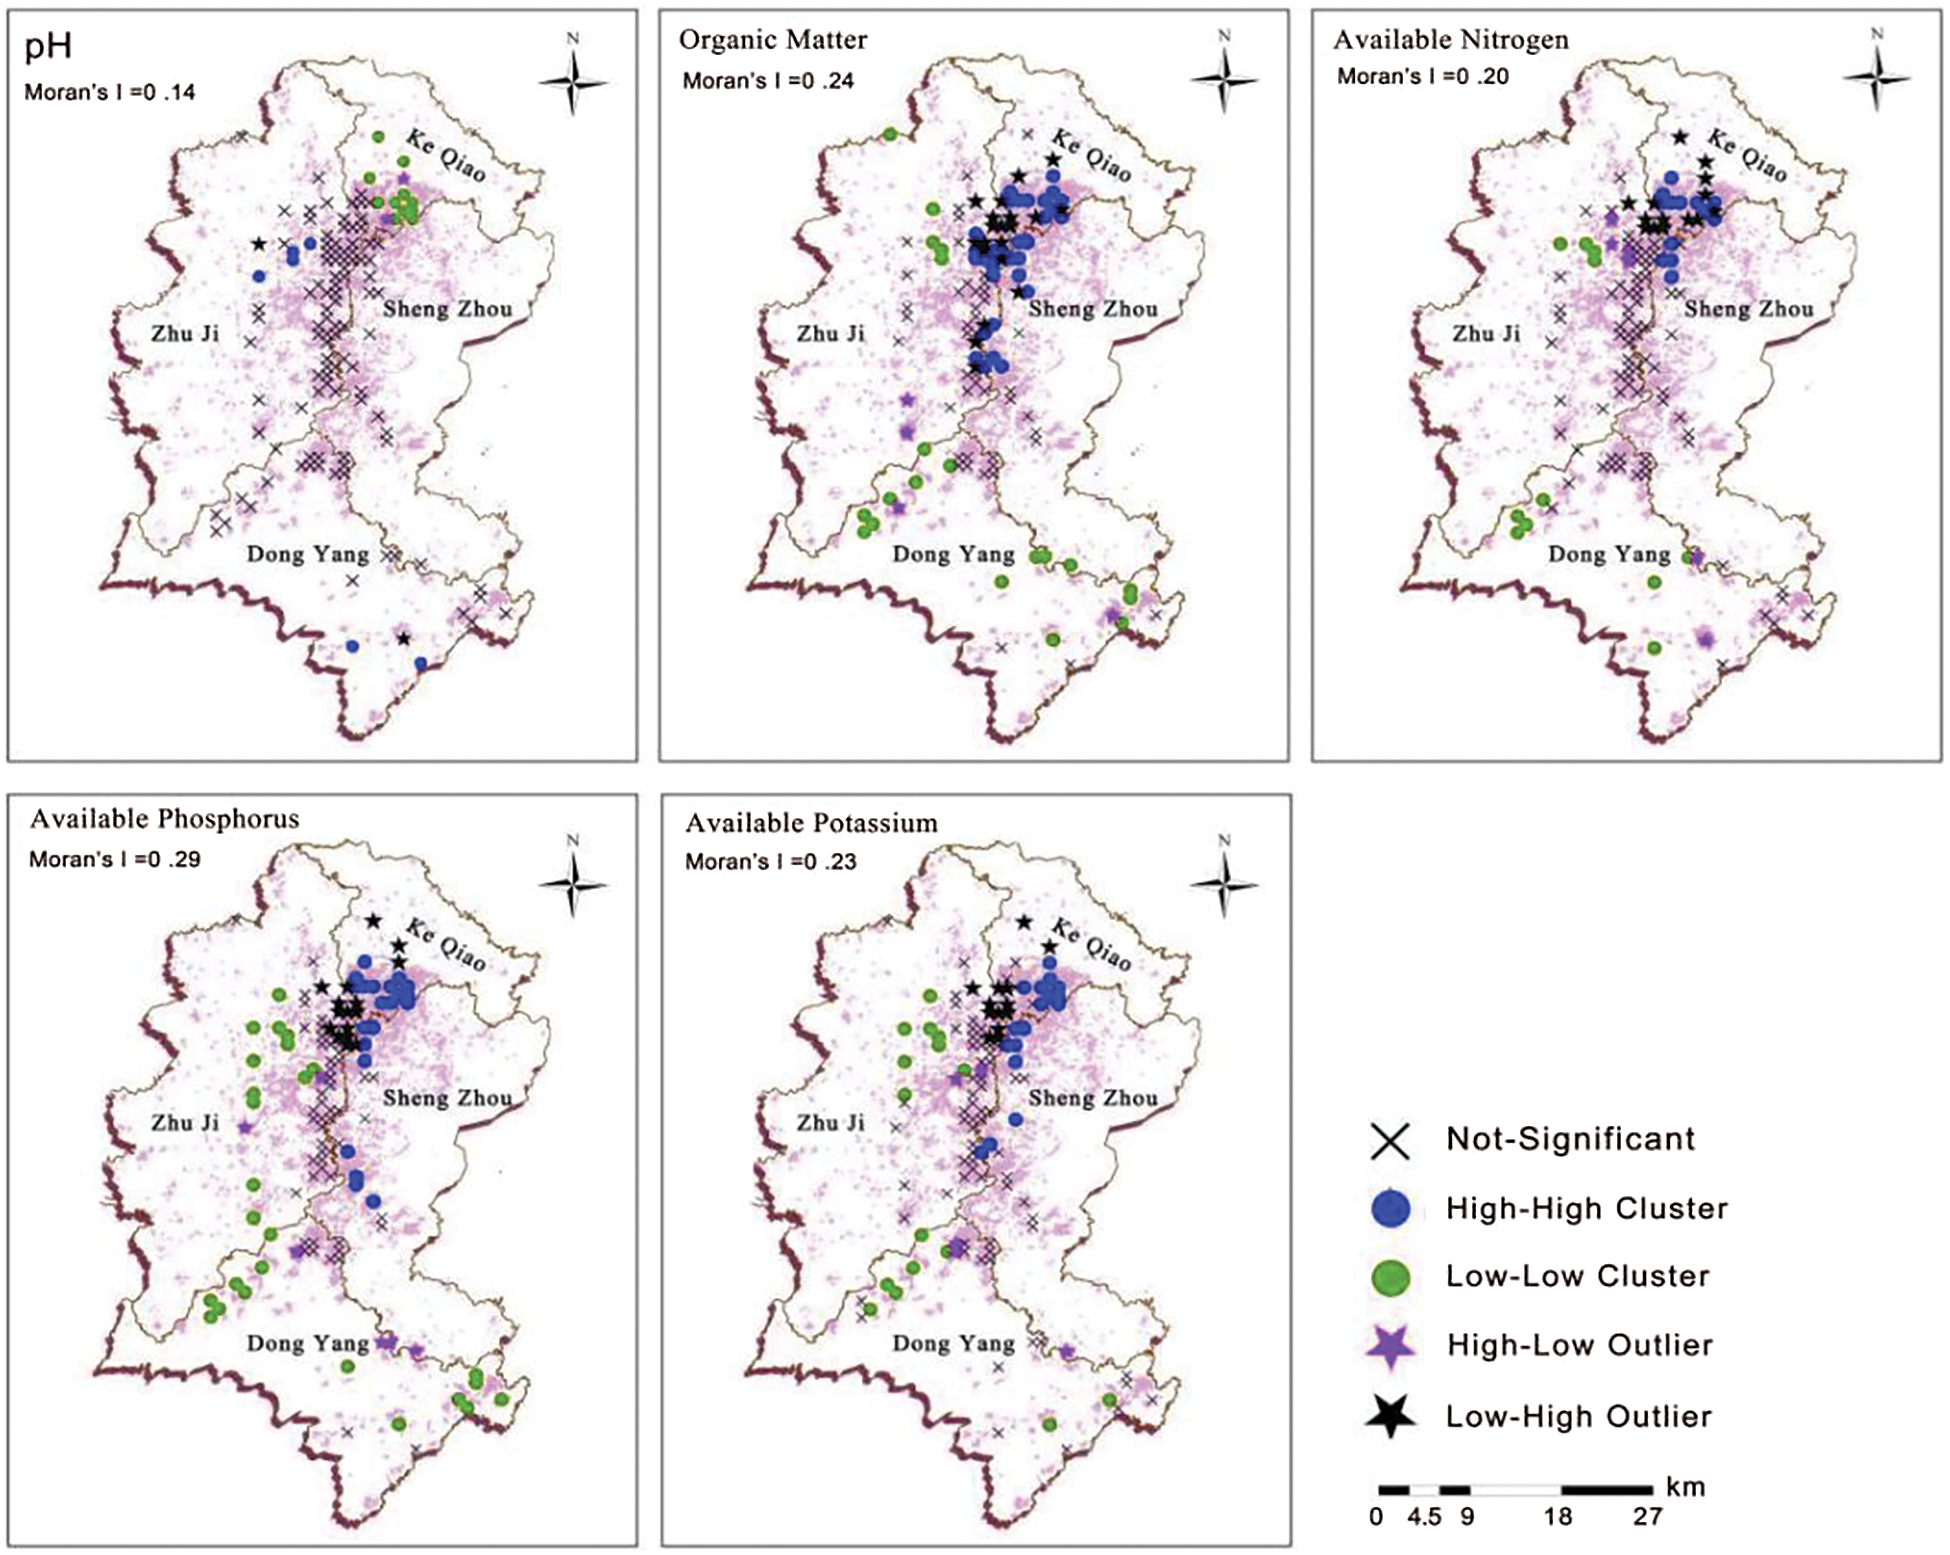
Figure 2: Local indicators of spatial association for soil nutrients in main plantations of Torreya grandis cv. Merrillii
3.3 The Spatial Distribution Characteristics of Soil Nutrients in the Torreya grandis Plantation
Currently, there are few studies on Torreya grandis soil, and there is no corresponding soil nutrient grading standards to measure the soil nutrient status of Torreya. In this study, soil pH, OM, AN, AP and AK were classified into four levels based on the classification standards of nutrients commonly used in Zhejiang Forestry [36]. Through ordinary Kriging interpolation method, the spatial distribution maps of soil elements in the main producing areas of Torreya grandis were obtained. The low soil pH areas were mainly distributed in the city of Keqiao and Shengzhou, and the high-value areas were observed in the city of Zhuji and Dongyang (Fig. 3). Generally speaking, the pH value of the soil in most areas was low, and the soil acidification in the city of Keqiao and Shengzhou was particularly serious.
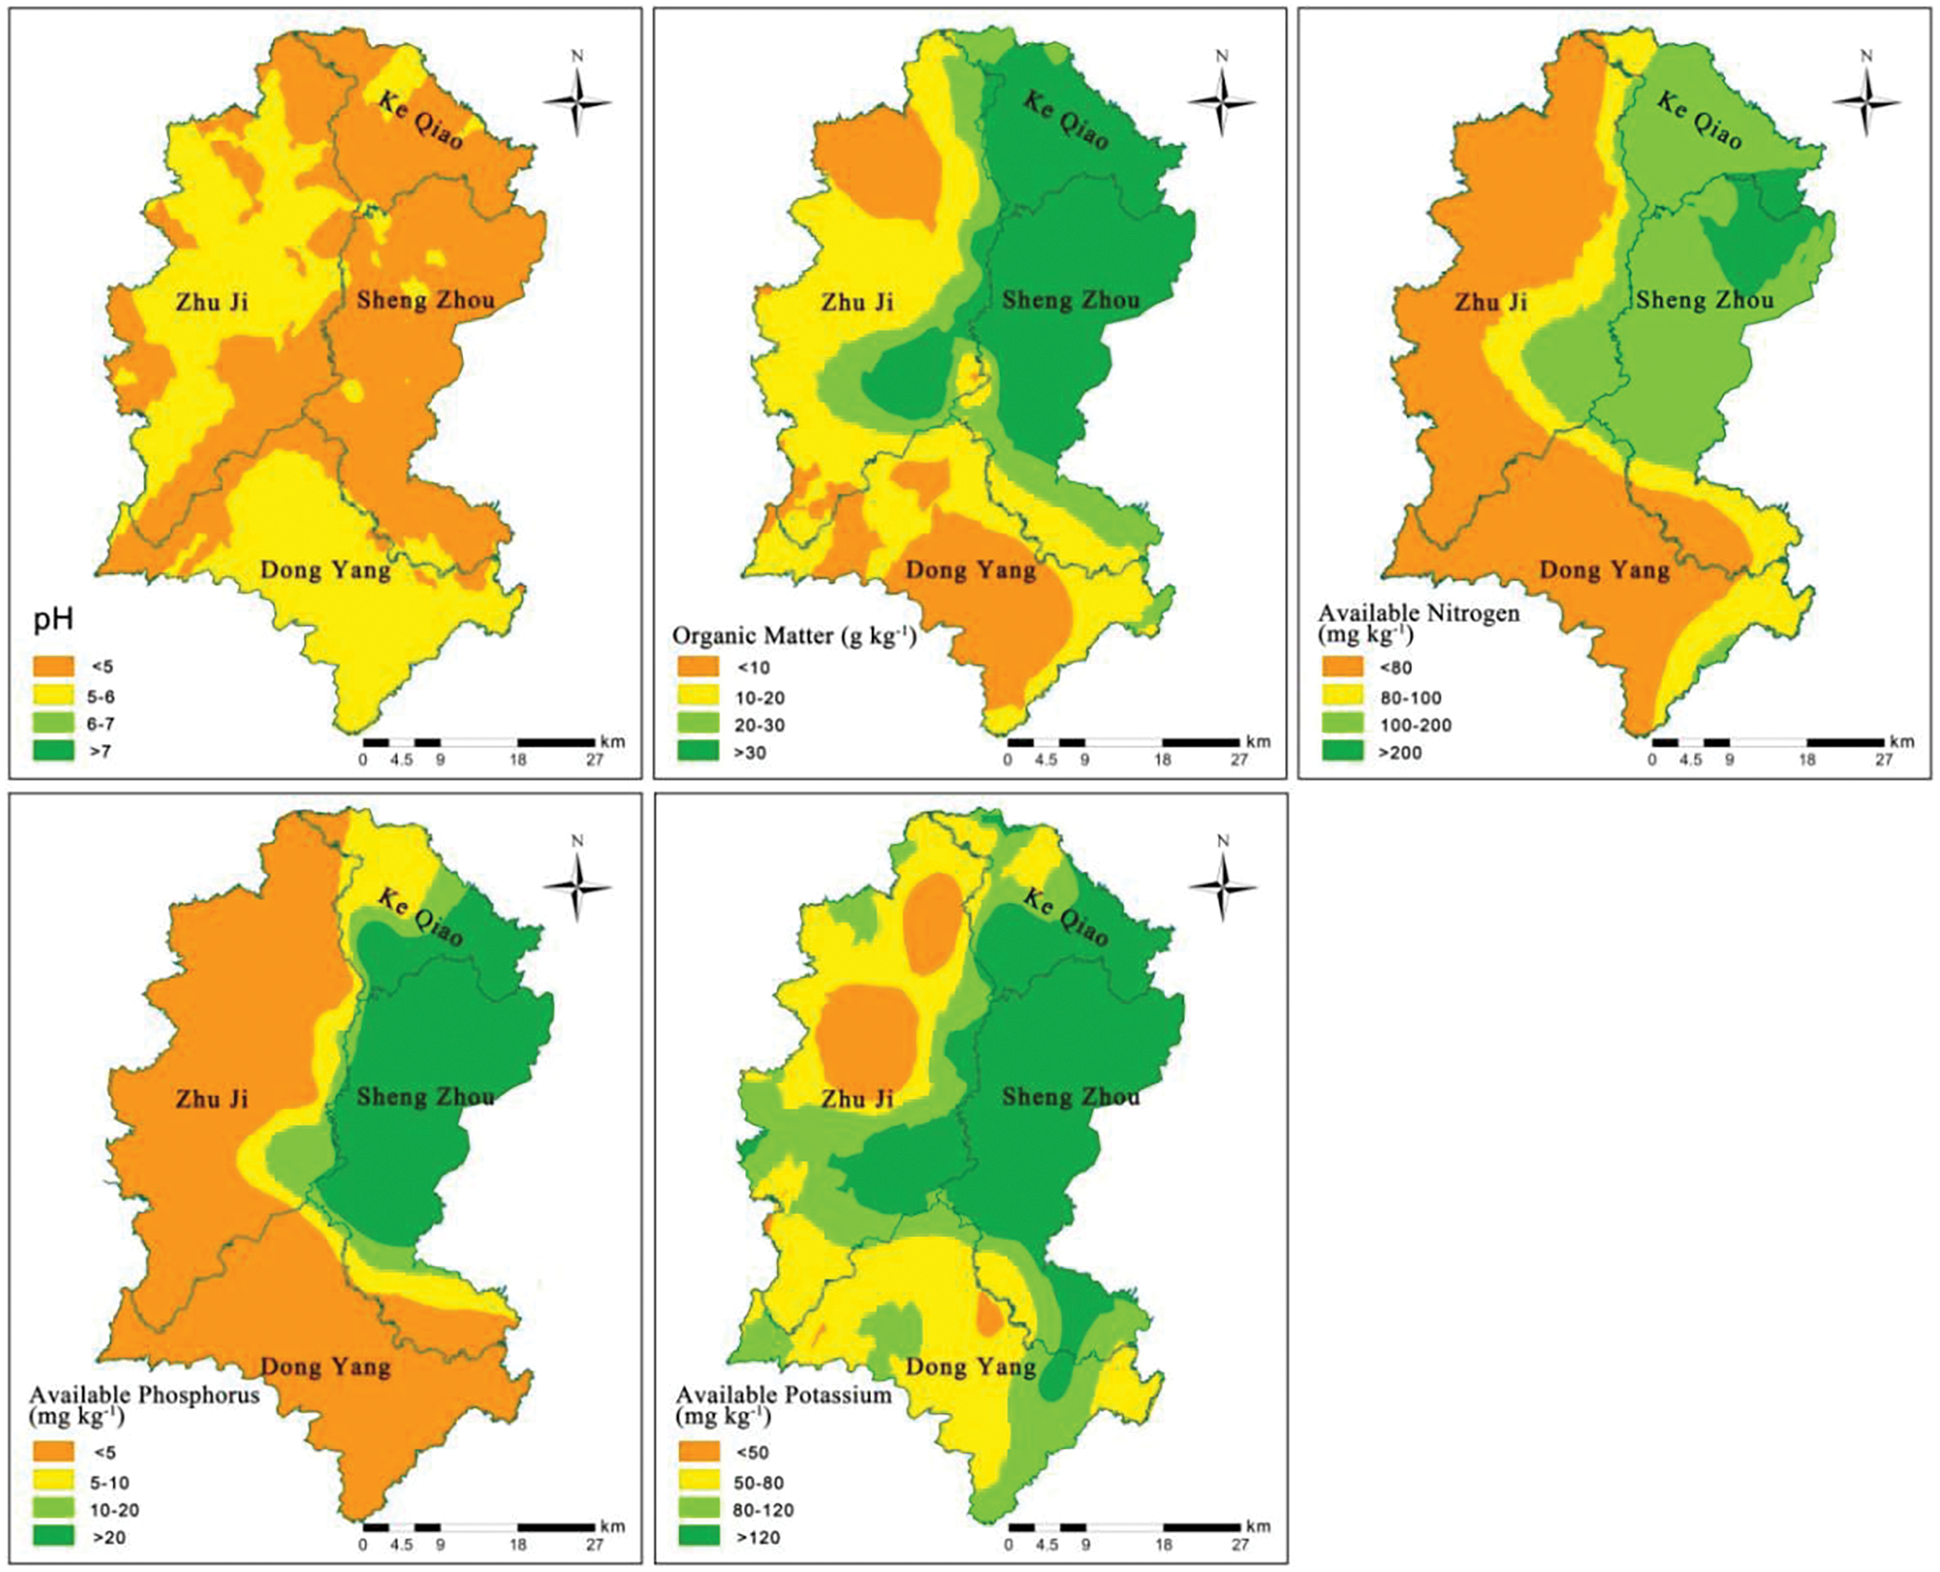
Figure 3: Spatial distribution maps of soil nutrients in plantations of Torreya grandis
The spatial distribution patterns of soil OM, AN, AP and AK had certain similarities. The high-value areas mainly located in the city Keqiao and Shengzhou, a few were in the eastern part of Zhuji City, and the low-value areas were mainly distributed in the eastern part of the city of Zhuji City, and Dongyang City.
3.4 The Soil Nutrients under Different Stand Ages
According to the actual forest age in this region, the forest age was divided into young-aged (<10 years), middle-aged (10–30 years), mature (30–100 years) and over-mature Torreya grandis (>100 years) groups. The soil pH tended to decrease with the growth of the forest age, and the difference in soil pH between young-aged and over-mature groups was significant (Fig. 4). With the growth of the forest age, the content of soil OM, AN and AP were gradually increasing, and there were also significant differences between the young forest (<10 years) and the ancient Torreya gradis forest (>100 years) in these indicators.
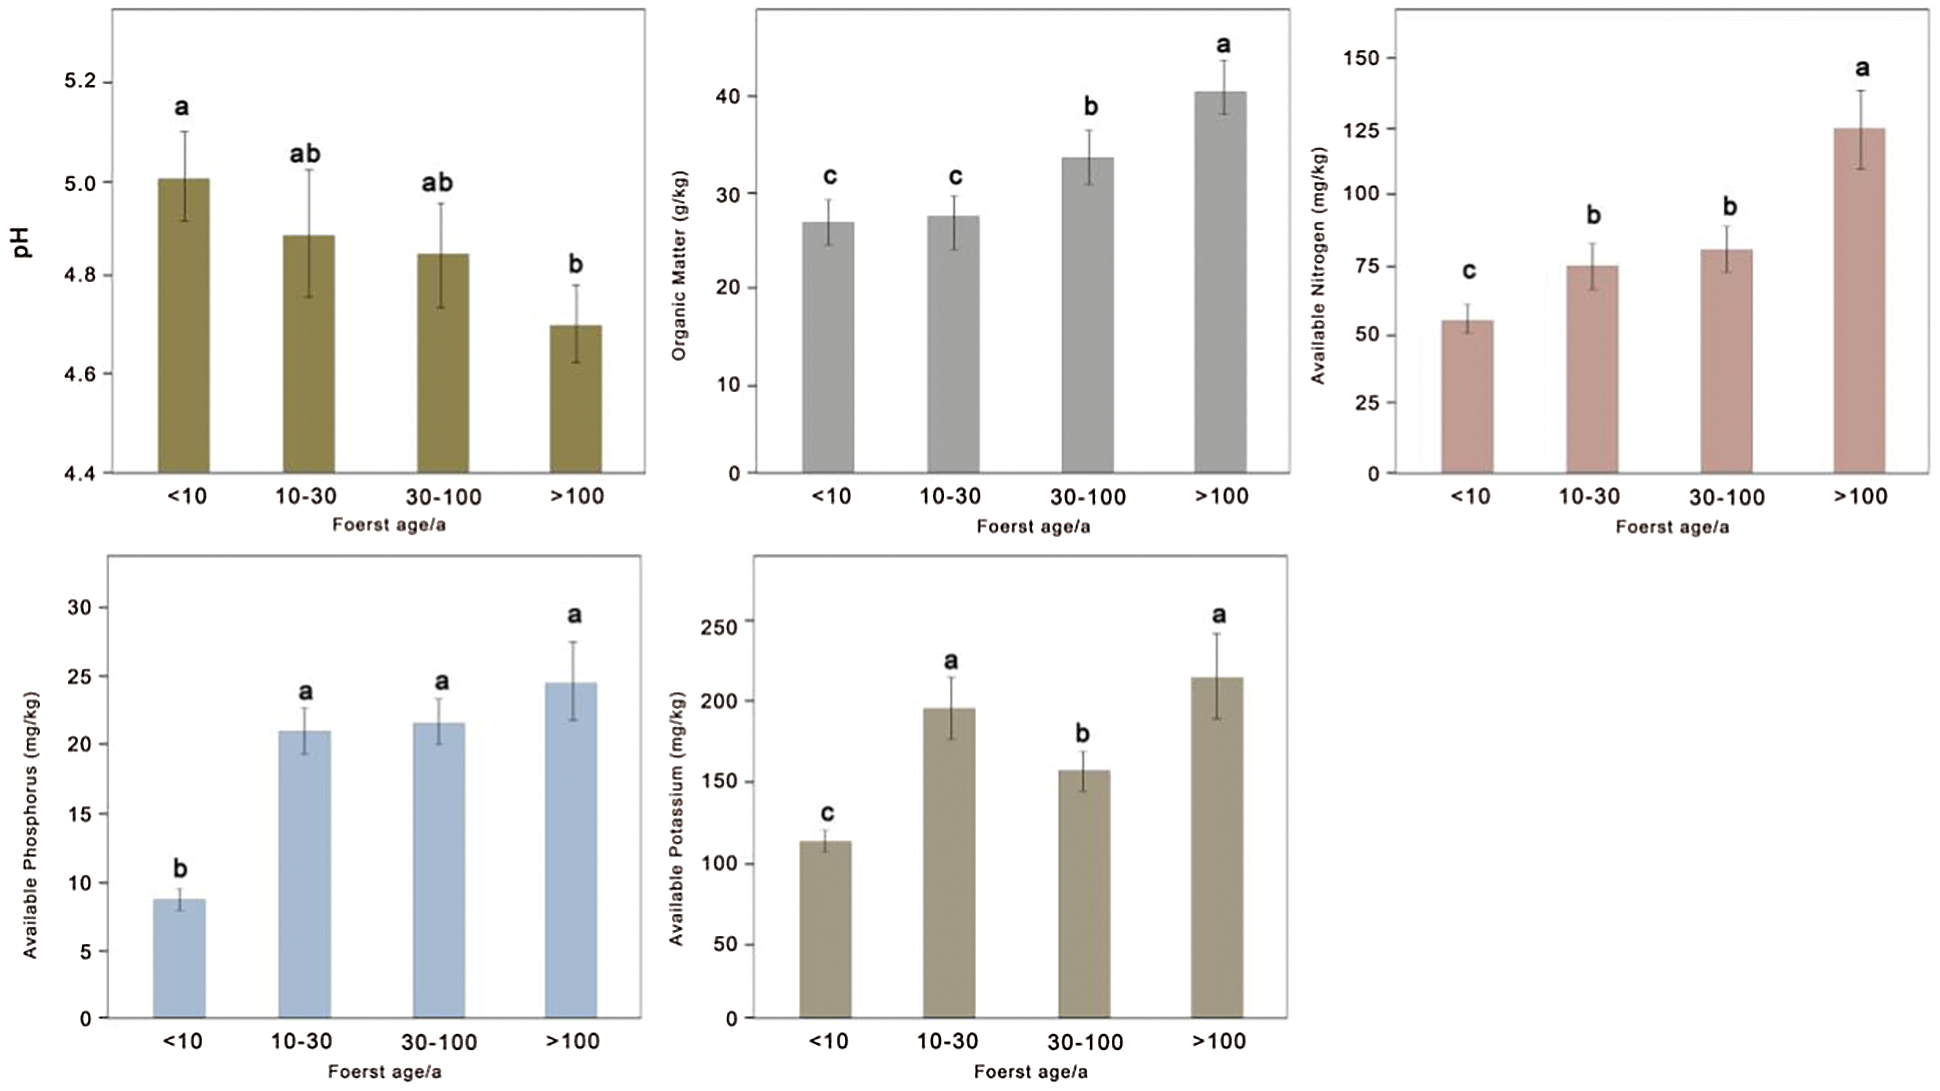
Figure 4: Effects of forest ages on soil pH, OM, AN, AP and AK in Torreya grandis plantations
Note: Different letters indicate significant differences (P < 0.05).
3.5 Evaluation of Integrated Soil Fertility in the Main Plantation of Torreya grandis
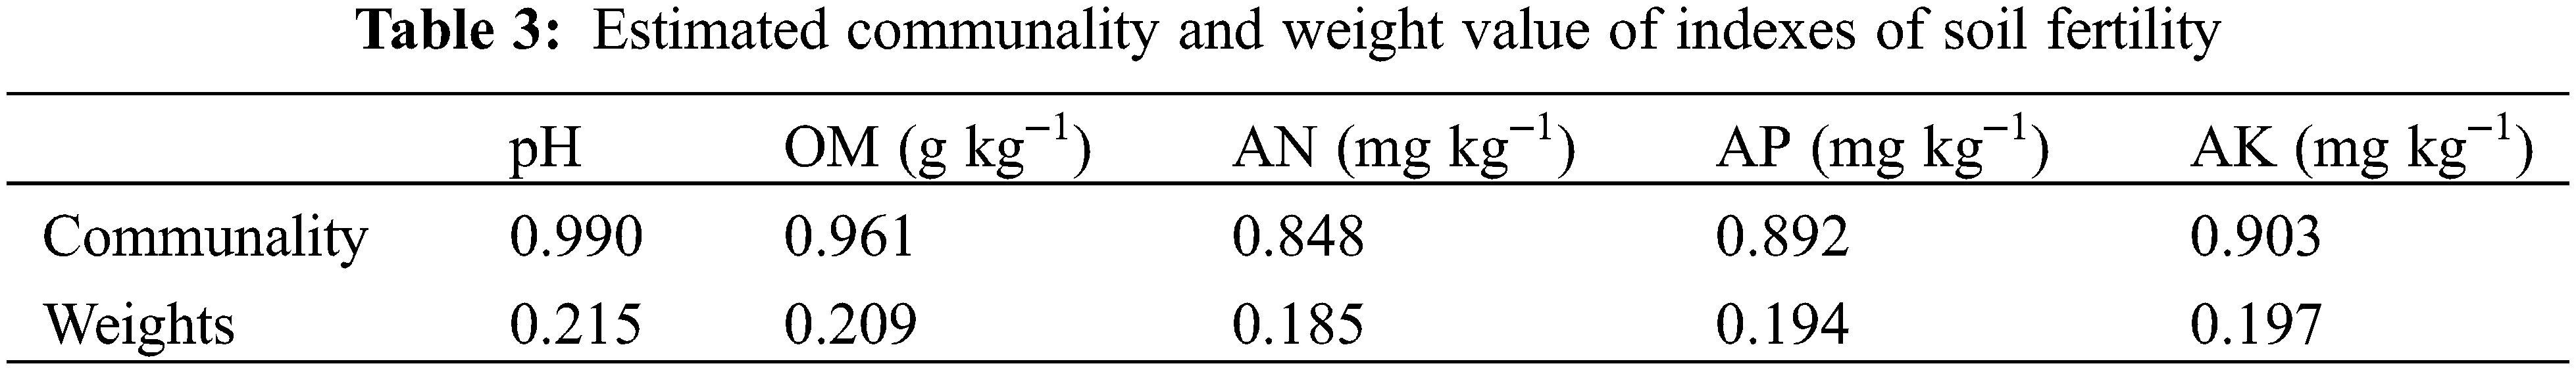
Through factor analysis, the common factor variance value and weight value of each evaluation index were obtained (Table 3). There is little difference in the weights assigned to each variable. The weights assigned to pH and organic matter were higher (0.215 and 0.209), and the weights of AN, AP and AK were 0.185, 0.194 and 0.197, respectively.
The soil fertility index of the study area was calculated according to the comprehensive soil fertility evaluation method (IFI), and the spatial distribution map of soil fertility was drawn by the Kriging interpolation method (Fig. 5). In this study area, 61% of the soil fertility is of medium to high quality (IFI > 0.47), and 39% of the area has a relatively low level of soil fertility. High-fertility soils were mainly found in the cities of Keqiao and Shengzhou, some in the eastern part of Zhuji City, and low-fertility soils were mainly concentrated in the city of Zhuji and Dongyang.
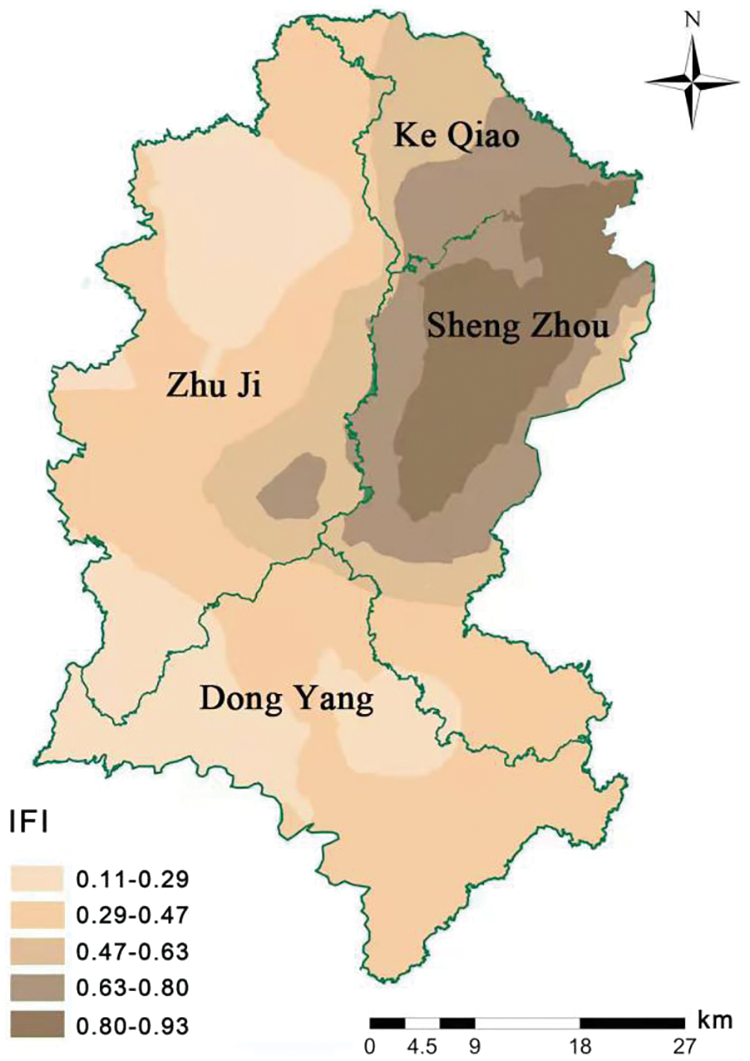
Figure 5: Soil fertility level distribution map of Torreya grandis cv. Merrillii
The selected study area is the main Torreya grandis plantation in China. According to the classification standard of Zhejiang forestry soil [37], the concentrations of soil OM, AN, AP and AK in the study area were relatively high. Based on field investigation, local forest farmers applied a large amount of compound fertilizers (N:P2O5:K2O = 15:15:15 or 17:17:17) and herbicides. The average application amount of compound fertilizer was 5.28 kg plant−1, and the highest application amount was 30 kg plant−1. The average application amount of organic fertilizer was 15.54 kg plant−1, and the highest application amount was 50 kg plant−1. Herbicide application was usually 5 to 6 times a year, at least 1 to 2 times a year. Although fertilizer application could improve the overall soil nutrients, excessive nitrogen and phosphorus addition would affect the yield and quality of Torreya grandis, leading to the deciduous leaf and Torreya grandis nut loss [37]. In other economic plantations (pecan, bamboo and tea) in China, non-scientific fertilizer ratio also led to soil nutrient imbalance [37–39].
Soil pH values had direct effects on other chemical properties of the soil [40], thus affecting the growth of Torreya grandis. However, excessive acidity in soils can lead to reduced yields and quality [30,31]. The pH values in soil of the study area could be affected by factors such as parent rock formation and anthropogenic fertilization, especially the long-term use of chemical fertilizer leads to soil serious acidification. The spatial distribution of soil pH in the study area was obvious, and the soil acidification in Keqiao district and Shengzhou city was relatively serious. Wang and Maleki et al. [41,42] reported that the use of lime and soil conditioners was efficient to improve the acidification of hickory plantation soil. Although the variation of soil acidity in the study area was small, excessive acidification was not conducive to improving the yield and quality of Torreya grandis, and local forest farmers should be guided to carry out scientific management for Torreya grandis plantation [36].
The spatial heterogeneity of soil nutrients was mainly brought by the difference of fertilization modes in different regions and the lacking standardized and unified scientific management measures [42–44]. The spatial distribution of soil nutrients and properties can be influenced by human factors mainly including soil management like fertilization and irrigation and natural factors mainly including soil formation, climate and topography factors [45]. Ecological factors can enhance the spatial correlation of soil nutrient variables, while human activities would weaken the spatial correlation and develop towards homogenization [46,47]. The spatial distribution patterns of soil OM, AN, AP and AK in the study area had certain similarities, as these variables were jointly affected by ecological factors (topography, soil type, parent material, climate, etc.) and human management (fertilization, irrigation, etc.) [16]. However, the natural climate and geographical conditions of the four regions were similar, and the terrain was mainly hilly in this study. Therefore, the difference of anthropogenic management was the main factor leading to the difference of soil nutrients in this study area. Torreya grandis has a wide range of stand age, and human management such as fertilization will accumulate over time. The eastern part of Zhuji is an early planting area of Torreya grandis, and long-term intensive management results in the enrichment of soil nutrients [48]. Keqiao district and Shengzhou city had higher soil nutrient content in the study area, which may be because the average application amount of compound fertilizer was the highest in Keqiao district (15.1 kg/plant), and the average application amount of organic fertilizer was the highest in Shengzhou city (25 kg/plant). For soil fertility quality, further acidification of the soil is not conducive to achieving the goal of sustainable development. With the increase of plantation management years, the site condition is basically stable, and the accumulation rate of organic matter is gradually greater than the decomposition rate. Coupled with the application of organic fertilizer and other management measures, the content of soil OM and AN gradually increased [49]. Meanwhile, the AP was enriched in the soil [50]. Potassium with strong mobility in the soil was easily affected by soil erosion, leaching and runoff loss [41]. According to field surveys, in recent years, forest farmers in various regions have used a large number of compound fertilizers to achieve the increasing yield. The average application amount of compound fertilizer in Keqiao district and Shengzhou City was 7.83 kg/plant, the highest was 30 kg/plant, and the application amount in some areas of Zhuji city reached 25 kg/plant. Although the soil nutrient of the Torreya grandis plantation has been significantly improved, the pursuit of high yields without paying attention to the fertilizer efficiency would not only waste fertilizers, but also lead to fruit quality and yield decrease [44,50,51]. The level of soil fertility is not only determined by soil nutrients and crop absorption capacity, but also affected by the coordination degree of various factors. Therefore, according to the actual status of the soil fertility of the Torreya grandis plantation, the fertilization application based on soil testing should be used to formulate the fertilization structure and dosage to meet the actual production needs, and ultimately realize the sustainable development of the Torreya grandis industry.
The regional-scale variation of soil nutrients in economic forests (such as Torreya grandis) is important information to guide specific precision management measures in the plantations [18,52,53]. Our results revealed that the spatial variation of soil nutrients was clear, especially the soil pH values. Most of the study area had low pH, indicating the problem of soil acidification in the plantation. Qian et al. [36] had shown that too low soil pH affected the growth and development of Torreya grandis, leading to reduced yield and poor quality. Appropriate lime application can increase soil pH [25]. Necessary lime application is needed for Chinese Torreya grandis growth. The Chinese Torreya grandis nut is very famous in China as it has high nutritional, medicinal and economic values [19,41]. How to enhance its yield is concerned by local farmers, which is strongly related to economic profit. In this study, due to intensive management such as non-uniformed fertilizer application in Chinese Torreya grandis plantations, nutrients imbalance was found. Therefore, to avoid negative environmental issues caused by intensive management, natural and ecological application combined with manure fertilizer usage are strongly needed in the plantation management.
In this study, soil nutrients maps of Chinese Torreya grandis plantation indicated that the low-value of OM, AN, AP and AK were mainly distributed in the cities Zhuji and Dongyang and the high-value were mainly distributed in Keqiao and Shengzhou, while the spatial distribution pattern of pH was the opposite. The comprehensive soil fertility index indicated that the soil in Keqiao and Shengzhou was fertile, while in the Zhuji and Dongyang was barren. In summary, we concluded that the soil acidification and nutrient imbalance in the main production areas of Torreya grandis plantation were serious. It is recommended to use soil conditioners to improve acidified soil, and adopt methods such as “stabilizing nitrogen, reducing phosphorus and controlling potassium” for the Torreya grandis plantation. This information can further be used for site-specific fertilizer management of Chinese Torreya grandis plantations.
Acknowledgement: We gratefully acknowledge Mr. Ye L. X. and Cai G. Y. for the field work.
Authorship: The authors confirm contribution to the paper as follows: study conception and design: Zhao K. L., Wu J. S.; data collection: Zhang Y., Dong J. Q.; analysis and interpretation of results: Ye T., Zhang Y., Wang M.; draft manuscript preparation: Bai L. L. All authors reviewed the results and approved the final version of the manuscript.
Funding Statement: This study was supported by the Natural Science Fundation of Zhejiang Province (LY20C160004).
Conflicts of Interest: The authors declare that they have no conflicts of interest to report regarding the present study.
1. Chen, S., Lin, B. W., Li, Y. Q., Zhou, S. N. (2020). Spatial and temporal changes of soil properties and soil fertility evaluation in a large grain-production area of subtropical plain, China. Geoderma, 357(3), 113937. DOI 10.1016/j.geoderma.2019.113937. [Google Scholar] [CrossRef]
2. Fu, W. J., Dong, J. Q., Ding, L. Z., Yang, H. S., Ye, Z. et al. (2022). Spatial correlation of nutrients in a typical soil-hickory system of southeastern China and its implication for site-specific fertilizer application. Soil and Tillage Research, 217(2), 105265. DOI 10.1016/j.still.2021.105265. [Google Scholar] [CrossRef]
3. Munnaf, M. A., Mouazen, A. M. (2021). Development of a soil fertility index using on-line Vis-NIR spectroscopy. Computers and Electronics in Agriculture, 188(6), 106341. DOI 10.1016/j.compag.2021.106341. [Google Scholar] [CrossRef]
4. Tunay, T., Dedeoglu, M., Dengiz, O., Bakan, O., Bayramin, I. (2021). Assessing soil fertility index based on remote sensing and gis techniques with field validation in a semiarid agricultural ecosystem. Journal of Arid Environments, 190(8), 104525. DOI 10.1016/j.jaridenv.2021.104525. [Google Scholar] [CrossRef]
5. Wawire, A. W., Csorba, D., Kovács, E., Mairura, F. S., Michéli, E. (2021). Comparing farmers’ soil fertility knowledge systems and scientific assessment in Upper Eastern Kenya. Geoderma, 396(1), 115090. DOI 10.1016/j.geoderma.2021.115090. [Google Scholar] [CrossRef]
6. Yageta, Y., Osbahr, H., Morimoto, Y., Clark, J. (2019). Comparing farmers’ qualitative evaluation of soil fertility with quantitative soil fertility indicators in Kitui County. Kenya Geoderma, 344(3), 153–163. DOI 10.1016/j.geoderma.2019.01.019. [Google Scholar] [CrossRef]
7. Sanches, G. M., Magalhães, P. G., Luciano, A., Camargo, L., Franco, H. (2020). Comprehensive assessment of spatial soil variability related to topographic parameters in sugarcane fields. Geoderma, 362(6), 114012. DOI 10.1016/j.geoderma.2019.114012. [Google Scholar] [CrossRef]
8. Shen, J. Y., Zhang, Y. J., Zhou, W., Song, Z. J., Duan, W. (2022). Dynamics and determinants of household’s non-timber forest products collection in the giant panda nature reserves of China. Forest Policy and Economics, 137, 102705. DOI 10.1016/j.forpol.2022.102705. [Google Scholar] [CrossRef]
9. Mugido, W., Shackleton, C. M. (2018). Price determination of non-timber forest products in different areas of South Africa. Ecological Economics, 146(39), 597–606. DOI 10.1016/j.ecolecon.2017.12.010. [Google Scholar] [CrossRef]
10. Lowore, J., Meaton, J., Wood, A. (2018). African forest honey: An overlooked NTFP with potential to support livelihoods and forests. Environmental Management, 62(1), 15–28. DOI 10.1007/s00267-018-1015-8. [Google Scholar] [CrossRef]
11. Zhu, L., Lo, K. (2021). Non-timber forest products as livelihood restoration in forest conservation: A restorative justice approach. Trees, Forests and People, 6, 100130. DOI 10.1016/j.tfp.2021.100130. [Google Scholar] [CrossRef]
12. Song, B., Zhou, S. L., Zhao, Q. G. (2003). Evaluation of spatial and temporal changes of soil quality based on geostatistical analysis in the hill region of subtropical China. Geoderma, 115(1–2), 85–99. DOI 10.1016/S0016-7061(03)00078-8. [Google Scholar] [CrossRef]
13. Zhou, Y. J., Jia, Z. Y., Wang, J. X., Chen, L., Zou, M. M. et al. (2019). Heavy metal distribution, relationship and prediction in a wheat-rice rotation system. Geoderma, 354, 113886. DOI 10.1016/j.geoderma.2019.113886. [Google Scholar] [CrossRef]
14. Fu, W., Zhao, K., Jiang, P., Ye, Z., Tunney, H. et al. (2013). Field-scale variability of soil test phosphorus and other nutrients in grasslands under long-term agricultural managements. Soil Research, 51(6), 503–512. DOI 10.1071/SR13027. [Google Scholar] [CrossRef]
15. Ma, J., Li, L., Guo, L., Bai, L., Zhang, J. et al. (2015). Variation in soil nutrients in grasslands along the Kunes River in Xinjiang, China. Chemistry and Ecology, 31(2), 111–122. DOI 10.1080/02757540.2014.917170. [Google Scholar] [CrossRef]
16. Dai, W. S., Li, Z. J., Cheng, X. J., Yu, W. W., Fu, Q. G. (2006). Investigation and analysis of soil nutrient status in Torreya grandis forest. Journal of Zhejiang Forestry College, 23(2), 140–144. DOI 1000-5692(2006)02-0140-05. [Google Scholar]
17. Dai, W., Li, Y. H., Fu, W. J., Jiang, P. K., Zhao, K. L. et al. (2018). Spatial variability of soil nutrients in forest areas: A case study from subtropical China. Journal of Plant Nutrition and Soil Science, 181(6), 827–835. DOI 10.1002/jpln.201800134. [Google Scholar] [CrossRef]
18. Zhao, K. L., Zhang, L. Y., Dong, J. Q., Wu, J. S., Ye, Z. Q. et al. (2020). Risk assessment, spatial patterns and source apportionment of soil heavy metals in a typical Chinese hickory plantation region of southeastern China. Geoderma, 360(1–4), 114011. DOI 10.1016/j.geoderma.2019.114011. [Google Scholar] [CrossRef]
19. Li, L. (2016). Effects of different sites and management measures on the soil fertility of Torreya grandis forest (Master Thesis). China: Zhejiang Agriculture and Forestry University. [Google Scholar]
20. Jiang, N., Laing, C., Zhang, Y., Jiang, Z., Dong, J. (2022). Microbial composition and diversity in soil of Torreya grandis cv. Merrillii relative to different cultivation years after land use conversion. Environmental Science, 43(1), 530–539. DOI 10.13227/j.hjkx.202105124. [Google Scholar] [CrossRef]
21. Xu, G. X. (2019). Research on the industrial development of Torreya grandis in Zhejiang Province and its countermeasures (Master Thesis). China: Zhejiang Agriculture and Forestry University. [Google Scholar]
22. Bao, S. D. (2000). Soil agrochemical analysis (Third Edition). Beijing: China Agriculture Press. [Google Scholar]
23. Fang, M. (2019). Research on the development of modern agricultural industrial park in Zhuji City (Master Thesis). China: Zhejiang Agriculture and Forestry University. [Google Scholar]
24. Dong, J. Q., Zhou, K. N., Jiang, P. K., Wu, J. S., Fu, W. J. (2021). Revealing horizontal and vertical variation of soil organic carbon, soil total nitrogen and C: N ratio in subtropical forests of southeastern China. Journal of Environmental Management, 289(8), 112483. DOI 10.1016/j.jenvman.2021.112483. [Google Scholar] [CrossRef]
25. Jin, J., Wang, L., Muller, K., Wu, J., Wang, H. et al. (2022). A 10-year monitoring of soil properties dynamics and soil fertility evaluation in Chinese hickory plantation regions of southeastern China. Scientific Reports, 11(1), 23531. DOI 10.1038/s41598-021-02947-z. [Google Scholar] [CrossRef]
26. Cambardella, C. A., Moorman, T. B., Novak, J. M., Parkin, T. B., Karlen, D. L. et al. (1994). Field-scale variability of soil properties in central Iowa soils. Soil Science Society of America Journal, 58(5), 1501–1511. DOI 10.2136/sssaj1994.03615995005800050033x. [Google Scholar] [CrossRef]
27. Webster, R., Oliver, M. A. (2001). Geostatistics for environmental scientists. Chichester, JohnWiley & Sons, Ltd. [Google Scholar]
28. Fu, W. J., Zhao, K. L., Zhang, C. S., Wu, J. S., Tunney, H. (2016). Outlier identification of soil phosphorus and its implication for spatial structure modeling. Precision Agriculture., 17(2), 121–135. DOI 10.1007/s11119-015-9411-z. [Google Scholar] [CrossRef]
29. Shi, A., Shao, Y. F., Zhao, K. L., Fu, W. J. (2020). Long-term effect of E-waste dismantling activities on the heavy metals pollution in paddy soil of southern China. Science of the Total Environment, 705, 135971. DOI 10.1016/j.scitotenv.2019.135971. [Google Scholar] [CrossRef]
30. Dai, W., Fu, W. J., Jiang, P. K., Zhao, K. L., Li, Y. H. et al. (2018). Spatial pattern of carbon stocks in forest ecosystems of a typical subtropical region of southeastern China. Forest and Ecology Management, 409, 288–297. DOI 10.1016/j.foreco.2017.11.036. [Google Scholar] [CrossRef]
31. Dai, W., Zhao, K. L., Fu, W. J., Jiang, P. K., Li, Y. F. et al. (2018). Spatial variation of organic carbon density in topsoils of a typical subtropical forest, southeastern China. Catena, 167(2), 181–189. DOI 10.1016/j.catena.2018.04.040. [Google Scholar] [CrossRef]
32. Qi, Y. B., Darilek, J. L., Huang, B., Zhao, Y. C., Sun, W. X. et al. (2009). Evaluating soil quality indices in an agricultural region of Jiangsu Province, China. Geoderma, 149(3–4), 325–334. DOI 10.1016/j.geoderma.2008.12.015. [Google Scholar] [CrossRef]
33. Bandyopadhyay, S., Maiti, S. (2021). Application of statistical and machine learning approach for prediction of soil quality index formulated to evaluate trajectory of ecosystem recovery in coal mine degraded land. Ecological Engineering, 170(2), 106351. DOI 10.1016/j.ecoleng.2021.106351. [Google Scholar] [CrossRef]
34. Fu, W., Fu, Z., Ge, H., Ji, B., Jiang, P. et al. (2015). Spatial variation of biomass carbon density in a subtropical region of Southeastern China. Forests, 6(6), 1966–1981. DOI 10.3390/f6061966. [Google Scholar] [CrossRef]
35. Fu, W., Zhao, K., Hubert, T., Zhang, C. (2013). Using GIS and geostatistics to optimize soil phosphorus and magnesium sampling in temperate grassland. Soil Science, 178(5), 240–247. DOI 10.1097/SS.0b013e31829d463b. [Google Scholar] [CrossRef]
36. Qian, J. F., Wu, J. S., Huang, J. Q. (2014). Effects of grass cultivation on soil nutrients and microbial diversity of hickory woodland. Acta Ecologica Sinica, 34(15), 4324–4332. DOI 10.5846/stxb201212171814. [Google Scholar] [CrossRef]
37. Ye, Z. J., Chai, X. Z. (1986). Zhejiang forestry soil. Hangzhou: Zhejiang Science and Technology Press. [Google Scholar]
38. Fu, W., Jiang, P., Zhao, K., Zhou, G., Li, Y. et al. (2014). The carbon storage in moso bamboo plantation and its spatial variation in Anji County of southeastern China. Journal of Soils and Sediments, 14(2), 320–329. DOI 10.1007/s11368-013-0665-7. [Google Scholar] [CrossRef]
39. Wang, L. (2012). The characteristics of soil nutrients and productivity pattern of Moso bamboo forests in Anhui (Master Thesis). China: Anhui Agricultural University. [Google Scholar]
40. Minasny, B., Hong, S. Y., Hartemink, A. E. (2016). Soil pH increase under paddy in South Korea between 2000 and 2012. Agriculture Ecosystem & Environment, 221, 205–213. DOI 10.1016/j.agee.2016.01.042. [Google Scholar] [CrossRef]
41. Wang, D. D. (2019). The effect of forest land management on the growth of Torreya grandis and soil fertility (Master Thesis). China: Anhui Agricultural University. [Google Scholar]
42. Maleki, S., Karimi, A., Zeraatpisheh, M., Poozeshi, R., Feizi, H. (2021). Long-term cultivation effects on soil properties variations in different landforms in an arid region of eastern Iran. Catena, 206(2), 105465. DOI 10.1016/j.catena.2021.105465. [Google Scholar] [CrossRef]
43. Srisomkiew, S., Kawahigashi, M., Limtong, P., Yuttum, O. (2022). Digital soil assessment of soil fertility for Thaijasmine rice in the Thung Kula Ronghai region. Thailand Geoderma, 409(2), 115597. DOI 10.1016/j.geoderma.2021.115597. [Google Scholar] [CrossRef]
44. Zhang, H. J., Ma, X. X., Zhao, K. L., Ye, Z. Q., Wang, Z. Y. et al. (2018). Soil fertility status and spatial distribution characteristics of hickory forest land. Journal of Zhejiang A&F University, 35(4), 664–673. DOI 10.11833/j.issn.2095-0756.2018.04.012. [Google Scholar] [CrossRef]
45. Zuber, S. M., Behnke, G. D., Nafziger, E. D., Villamil, M. B. (2017). Multivariate assessment of soil quality indicators for crop rotation and tillage in Illinois. Soil and Tillage Research, 174, 147–155. DOI 10.1016/j.still.2017.07.007. [Google Scholar] [CrossRef]
46. Wu, J., Lin, H., Guo, L., Dong, J., Zhang, L. et al. (2019). Biomass and nutrients variation of chinese fir rooted cuttings under conventional and exponential fertilization regimes of nitrogen. Forests, 10(8), 615. DOI 10.3390/f10080615. [Google Scholar] [CrossRef]
47. Jia, Z. Y., Zhang, J. H., Ding, S. Y., Feng, S., Xiong, X. B. et al. (2016). Spatial variability of soil phosphorus in the Yellow River flooding area based on GIS and geostatistics: Taking Zhoukou as an example. Chinese Journal of Applied Ecology, 27(4), 1211–1220. DOI 10.13287/j.1001-9332.201604.012. [Google Scholar] [CrossRef]
48. Li, Z. J., Cheng, X. J., Dai, W. S., Jing, B. H., Wang, A. G. (2004). The production history, current situation and development of Torreya grandis in Zhejiang. Journal of Zhejiang Forestry College, 21(4), 471–474. DOI 1000-5692, 2004. [Google Scholar]
49. Liu, J., Xu, W. Y., Wu, J. S. (2016). Statistical characteristics and spatial distribution of soil fertility in Leizhu forest land. Journal of Zhejiang Forestry Science and Technology, 36(5), 25–30. DOI 001-3776(2016)05-0025-06. [Google Scholar]
50. Huang, Y. Y. (2016). Investigation of soil nutrient status and limiting factors in the cultivation area of Torreya grandis in Lichuan County (Master Thesis). China: Jiangxi Agricultural University. [Google Scholar]
51. Ji, X. J., Wu, X. Y., Wang, Y., Wu, C. Y., Ma, J. Y. et al. (2015). Analysis of available phosphorus nutrient status of cultivated land soil in Dongyang City. Zhejiang Agricultural Sciences, 56(1), 121–122. DOI 10.16178/j.issn.0528-9017.20150139. [Google Scholar] [CrossRef]
52. Fu, W. J., Jiang, P. K., Zhou, G. M., Zhao, K. L. (2014). Using Moran’s I and GIS to study the spatial pattern of forest litter carbon density in a subtropical region of southeastern China. Biogeosciences, 11, 2401–2409. DOI 10.5194/bg-11-2401-2014, 2014. [Google Scholar]
53. Wu, J. S., Lin, H. P., Meng, C. F., Jiang, P. K., Fu, W. J. (2014). Effects of intercropping grasses on soil organic carbon and microbial community functional diversity under Chinese hickory (Carya cathayensis Sarg.) stands. Soil Research, 52(6), 575–583. DOI 10.1071/SR14021. [Google Scholar] [CrossRef]
 | This work is licensed under a Creative Commons Attribution 4.0 International License, which permits unrestricted use, distribution, and reproduction in any medium, provided the original work is properly cited. |