| Phyton-International Journal of Experimental Botany |
DOI: 10.32604/phyton.2022.020139
ARTICLE
Transcriptome Analysis and Morphological Changes in Response to Waterlogging in Iris pseudacorus
College of Landscape Architecture, Sichuan Agricultural University, Chengdu, 611130, China
*Corresponding Author: Xiaofang Yu. Email: xiaofangyu@sicau.edu.cn
#These authors contributed equally to this work
Received: 06 November 2021; Accepted: 10 February 2022
Abstract: Iris pseudacorus is a widely cultivated and studied ornamental plant with a large biomass, strong adaptability and extensive management. Moreover, it has the ability to decontaminate and enrich heavy metals. However, few studies have been conducted on its submergence tolerance with little known about the molecular response of I. pseudacorus to flooding. Morphologically, I. pseudacorus had strong adaptability to waterlogging, the aerenchyma was gradually enlarged and adventitious roots developed between 0 and 14 d. The transcriptome data showed that the differentially expressed genes counts in plants flooded for 2 h, 4 h, 12 h and 24 h compared with the unflooded controls were 3555, 9439, 10734, and 4997, respectively. For GO term entries enriched by different genes, many biological processes, cell components and molecular processes in the I. pseudacorus roots were affected by flooding stress. Pathways enrichment analysis showed DEGs involved in hormone signal transduction pathways, glucose metabolism, glycolysis, and fermentation. The quantitative real-time PCR analysis of DEGs was basically consistent with the trend of transcriptome data, indicating reliability of the transcriptome data. The transcriptome analysis showed that formation of aerenchyma and adventitious roots was mainly induced by IAA (auxin) and accompanied by other hormone signals. Energy production was the primary coping mechanism of I. pseudacorus when aerenchyma was not sufficiently enlarged under water flooding. These results laid a foundation for further study on the mechanism of submerging-tolerance of I. pseudacorus and other aquatic plants.
Keywords: Iris pseudacorus; waterlogging; transcriptome; aerenchyma; energy production
One of the major cellular pathways dependents on oxygen (O2) is mitochondrial respiration. However, flooding or inundation exposes plants to reduced O2 supply because of its slow diffusion rate and limited solubility in water [1]. Metabolically active cells in the root apical zone demand and use more O2. Because of flooding, these active cells have fewer intercellular spaces to conduct O2 by gaseous diffusion [2]. This deficiency of O2 in the abiotic environment or hypoxia decreases the cellular energy charge and cytoplasmic pH, resulting in the accumulation of toxic end products from anaerobic respiration and reactive oxygen species (ROS) [3]. Therefore, plants have developed adaptation mechanisms at the physiological and structural levels to enhance their ability to survive prolonged hypoxic stress. Such adaptation mechanisms include shoot elongation, aerenchyma development and adventitious root formation [4,5].
Aerenchyma is a unique structure consisting of a longitudinal space that enables various gases such as O2, carbon dioxide (CO2), ethylene and methane to exist in plant roots, petioles and stems [6,7]. The internal transport of O2 from bud to root through aerated tissue is particularly important for survival under flooded conditions. Under well-drained soil conditions, many hygrophytes form aerenchyma in roots, but the formation is enhanced when the soil is flooded [8]. Aerenchyma formation in non-wetland plants such as maize usually does not occur under well-drained soil conditions but is induced under flooding, hypoxia, mechanical resistance, and nutrient-deficient aerobic conditions [9,10].
When roots are flooded, O2 supply is restricted, and the O2-dependent energy production pathway is interrupted, resulting in a rapid decrease in adenosine triphosphate (ATP) [11]. At this time, various stress responses are induced to address the energy deficit. Some vegetations have achieved the purpose of escaping hypoxia stress by consuming a large amount of organic matter to make stems and leaves elongate and expand [12,13]. Other plants convert respiratory metabolism from aerobic to anaerobic and maintain ATP through glycolysis and ethanol fermentation [14,15].
RNA-sequencing (RNA-Seq) based on next-generation sequencing (NGS) has been employed as a powerful high-throughput method to explore the gene expression variation and regulatory networks in plants [16–18]. The RNA-Seq has been widely applied to study the response to flooding stress in many plant species, including Oryza sativa [15,19], Cucumis sativus [20,21], Zea mays [14,22,23], Brassica campestris [24], Actinidia chinensis Planch. [25], Vitis vinifera [26], and Prunus [27]. However, few ornamental plants have been studied for their waterlogging tolerance using RNA-Seq.
Iris pseudacorus L. is an aquatic plant with ornamental value and is cultivated worldwide. The plant is characterized by a large biomass and strong adaptability. It shows better performance in removes total nitrogen and phosphorus, COD, BOD, and heavy metals such as lead, cadmium, iron, copper and manganese in sewage [28–30]. However, the mechanism of waterlogging resistance and the discovery of related genes are rarely studied. Therefore, the aim of the study was to gain insight into the response mechanism to waterlogging in I. pseudacorus using the Illumina novaseq 6000 platform. The gene transcription changes of plants under different flooding times were studied. In addition, paraffin sections were used to prepare root tissue sections at multiple treatment time points in a waterlogged environment, and aeration tissues of plants were observed by the anatomical method. The results of this study will help us to further understand the submersion resistance of I. pseudacorus and provide a theoretical basis for biological and ecological characteristics studies.
2.1 Plant Materials and Stress Conditions
The seeds of I. pseudacorus were harvested from mature plants in the nursery of Sichuan Agricultural University. The mean annual temperature of the cultivation areas was 16°C, and the average rainfall was 865.9 mm. One thousand plump seeds were germinated in glass jars for two weeks and each plant that successfully emerged was successively transplanted into a plastic cup with a height of 700 mm. The seedlings with uniform growth were selected after two weeks of slow growth and flooded for 2, 4, 12 and 24 h to 30 mm above the soil surface and compared with the controls, which were watered normally. Each treatment corresponded to 30 I. pseudacorus seedlings, repeated three times. After flooding, the seedlings were randomly sampled for aerenchyma observation at 0, 3, 7 and 14 d, respectively. The root systems of I. pseudacorus seedlings were sampled in liquid nitrogen and stored at –80°C for transcriptomic analysis.
2.2 Determination of Morphological Indices
A scanner (Epson Expression 10,000 XL, Epson (China) Co., Ltd., Beijing, China) was used to scan the whole plant, and the root surface area (cm2), total root length (cm) and the root tip number were obtained through WinRhizo software measurement. The leaf area (mm2) and the plant height (mm) were measured with Winseedle software. The plant height represented the length from the base of the stem to the tip of the longest leaf.
2.3 Observation of Root Anatomy
The roots at 2–3 cm above the root tip were collected and fixed with Formaldehyde-acetic acid-ethanol Fixative (FAA) at 4°C, followed by obtainance of permanent sections after dehydration, waxing, embedding, slicing, spreading, dewaxing, staining and sealing.
2.4 RNA Extraction and Library Construction
Total RNA was extracted from each seedling sample for transcriptome analysis. The quantity and quality of total RNA were assessed using Nanodrop 2000 spectrophotometer (Thermo Fisher Scientific, USA) and 1% agarose gel electrophoresis. Agilent 2100 RNA Nano 6000 Assay Kit (Agilent Technologies, CA, USA) was used to assess the integrity and concentration of RNA samples. Only RNA samples that passed the quality test were selected for RNA-Seq analysis. The cDNA library was performed by the Beijing ANNOROAD kit (ANNOROAD Biotechnology Co., Ltd., Beijing, China), and the transcriptome analysis was carried out using an Illumina NovaSeq 6000 platform.
The assembly software used for unreferenced transcriptome analysis was Trinity (Trinity Release V2.4.0) [31], which uses the basic principle of de Bruijn diagram theory to assemble a full-length transcript with the characteristics of variable splicing. Based on the filtered clean data, a full-length transcriptional sequence was assembled with the Trinity, and the longest transcriptional sequence in each gene was taken as a unigene. Bowtie2 is a super fast and memory-saving tool for splicing short sequences into template genomes. Using Bowtie2 (version 2.2.3) [32], the transcripts were compared with each other to locate the assembled transcripts.
2.6 Prediction and Functional Annotation of Unigenes
Based on the unigene sequences assembled by the Trinity, the unigenes were blasted on the National Center for Biotechnology Information (NCBI) database, non-redundant protein (Nr) database (https://ftp.ncbi.nlm.nih.gov/blast/db/FASTA/), the Kyoto Encyclopedia of Genes and Genomes (KEGG) (http://www.genome.jp/kegg/kegg2.html) database, and euKaryotic Ortholog Groups (KOG) using the BLASTx analysis. The blast2go software was then used to analyze the Gene Ontology (GO) functional classification.
2.7 Differential Expression Unigenes Analysis
With the RPKM (Reads Per Kilobase Millon Mapped Reads) [33] approach, the DEGseq method was used for differential expression analysis. Using the Benjamini-Hochberg method, the corrected P-value, namely false discovery rate (FDR), was used as the key index for differential expression gene screening. Log2 fold change (FC)| ≧ 1 with a corrected P < 0.05 were used as the threshold for differentially expressed genes (DEGs), in which FC was the ratio of RPKM between two groups.
2.8 GO and KEGG Enrichment Analysis of Differentially Expressed Genes
The number of DEGs in each entry was counted, and the hypergeometric tests were applied to find the GO entries that were significantly enriched in the genes compared with the entire genomic background. To check the enrichment of GO Term in each comparison group, the union of the significant GO of all comparison groups was taken. The distribution diagram was made according to the q value, with q < 0.05 as the standard. Hypergeometric test was used for enrichment analysis of each pathway in KEGG to find out the pathways with significant enrichment in DEGs.
2.9 RNA-Seq Data were Verified by Quantitative Real-Time PCR Analysis
Nine genes were selected to validate the expression levels of the DEGs. The synthesis of the first-strand cDNAs was carried out using the RevertAid First Strand cDNA Synthesis chemistry following the manufacturer’s instruction (Thermo Fisher Scientific Inc., USA). The unigene-specific primers were designed using Oligo 7.0 (Table S5). The UBQ gene was used as an internal control gene to estimate the relative transcript levels. Quantitative real-time PCR (qRT-PCR) was performed in a 96-well plate with the CFX-96 real-time system (Bio-Rad, CA, USA) and TB Green™ Premix Ex Taq™ II (TliRNaseH Plus; TaKaRa). All the amplification reactions were calculated relative to the level of UBQ using the 2-ΔΔCt formula [34]. Each PCR reaction mix of 10 uL contained 1 uL (200 ng/uL) cDNA, 1 uL of each forward and reverse primer (4 pmol/uL), 5 uL of TB Green Premix Ex Taq II, and 3 uL ddH2O. Thermal cycling conditions consisted of 95°C for 30 s, and 40 cycles of 95°C for 15 s, 58°C for 15 s, and 72°C for 30 s.
3.1 Morphological Indexes of Iris Pseudacorus
The leaf area (Fig. 1A), root surface area (Fig. 1B), root length (Fig. 1C) and plant height (Fig. 1D) were measured to explain better the submergence tolerance of I. pseudacorus. Numerous morphological data showed no significant changes in the 3rd, 7th and 14th day after waterlogging stress compared with the control (Fig. 1).
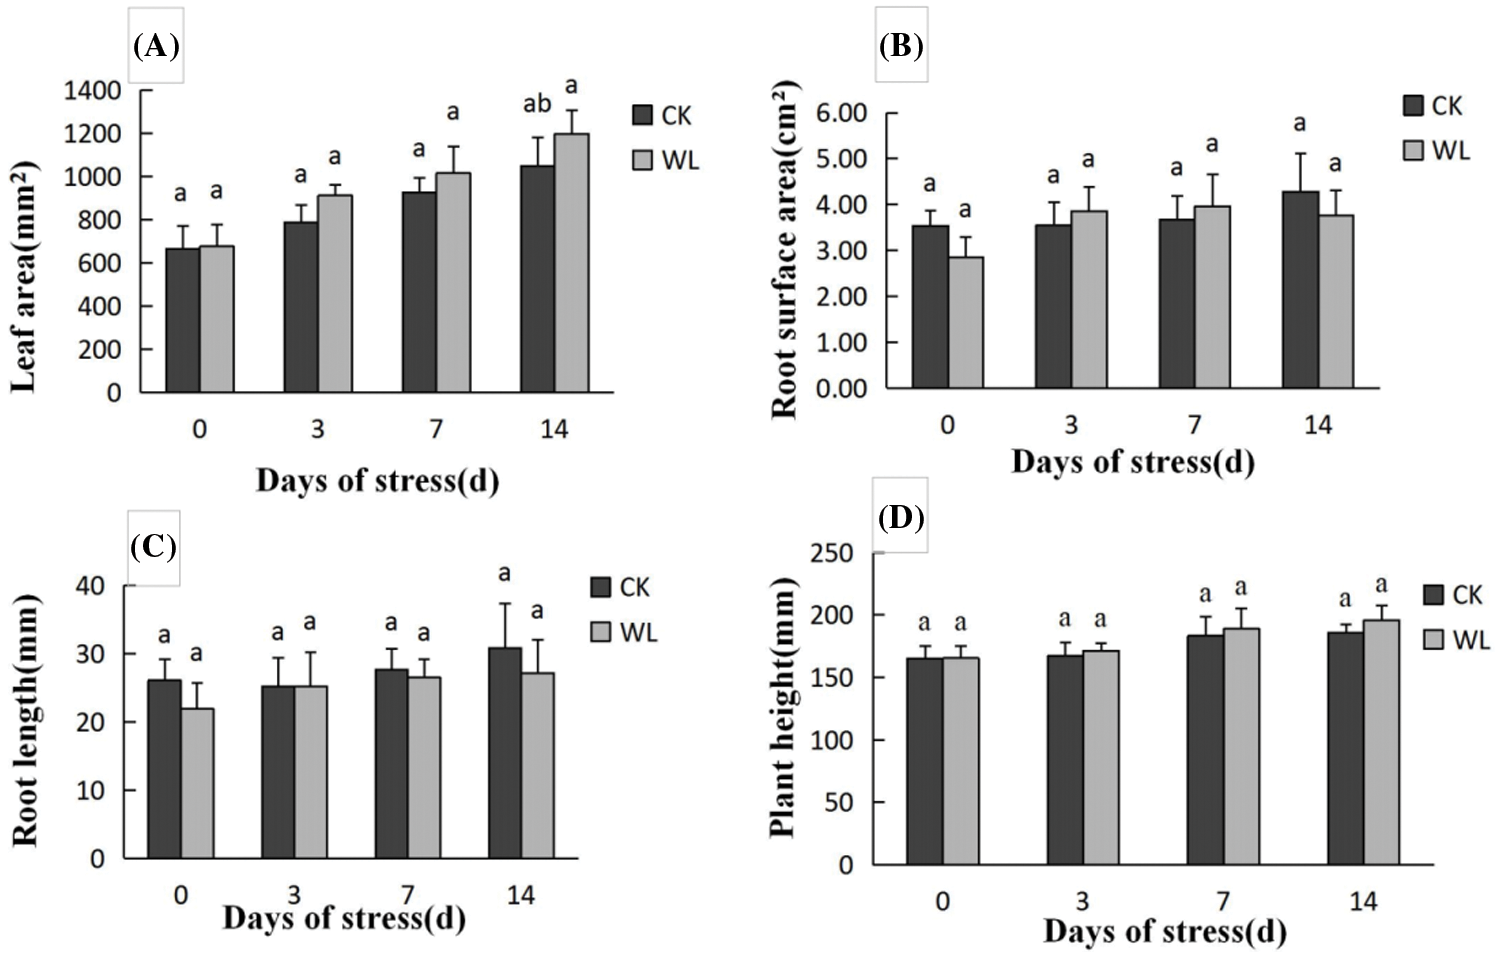
Figure 1: Effects of waterlogging stress on plant height, leaf area, root length and root surface area. A: Shows changes in the leaf area during 0–14 d; B: Shows changes in the root surface area during 0–14 d; C: Shows changes in root length during 0–14 d; D: Shows changes in plant height during 0–14 d. The data were expressed as mean ± standard error. Different letters on the error bars represent significant differences (P < 0.05)
3.2 Root of Aerenchyma and Adventitious Root Primordium
At the beginning (0 d), the aerenchyma cells were oval or square. The adventitious root primordia also did not have significant cell proliferation and differentiation at this age (Fig. 2A). On the 3rd day, aerenchyma unfolded in the direction of periclina (Fig. 2B) with a continuous radial extension on the 7th day (Fig. 2C). On 14th day, the ventilatory cavity without cellular connection ruptured and became connected with the surrounding aerenchyma, eventually enlarging (Fig. 2D). The adventitious roots at this late age were differentiated and about to penetrate the cortex.
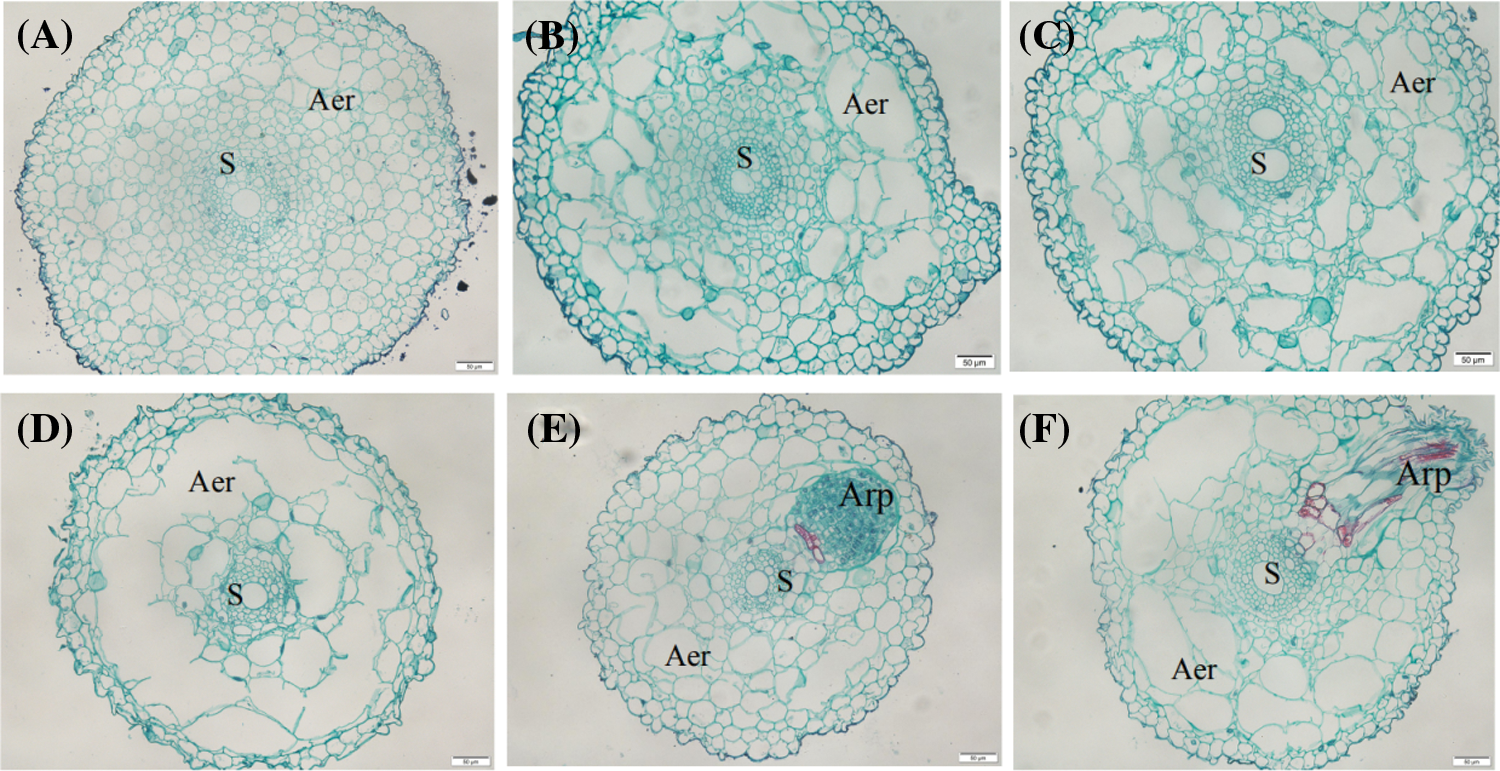
Figure 2: Anatomy of root tip aerenchyma (Aer) and lateral root primordia. A: Day 0 waterlogging treated roots showing a small cavity near the outer cortex; B: Day 3 waterlogging treated roots with large cavity near the outer cortex and a small cavity near the inner cortex; C: Day 7 waterlogging treated roots showing elliptical cavity in the direction of periclina; D: Day 14 waterlogging treated roots with annular cavities in the cortex; E: Day 0 waterlogging treated roots with adventitious root primordium (Arp); F: Day 14 waterlogging treated showing Arp. “S” means stele
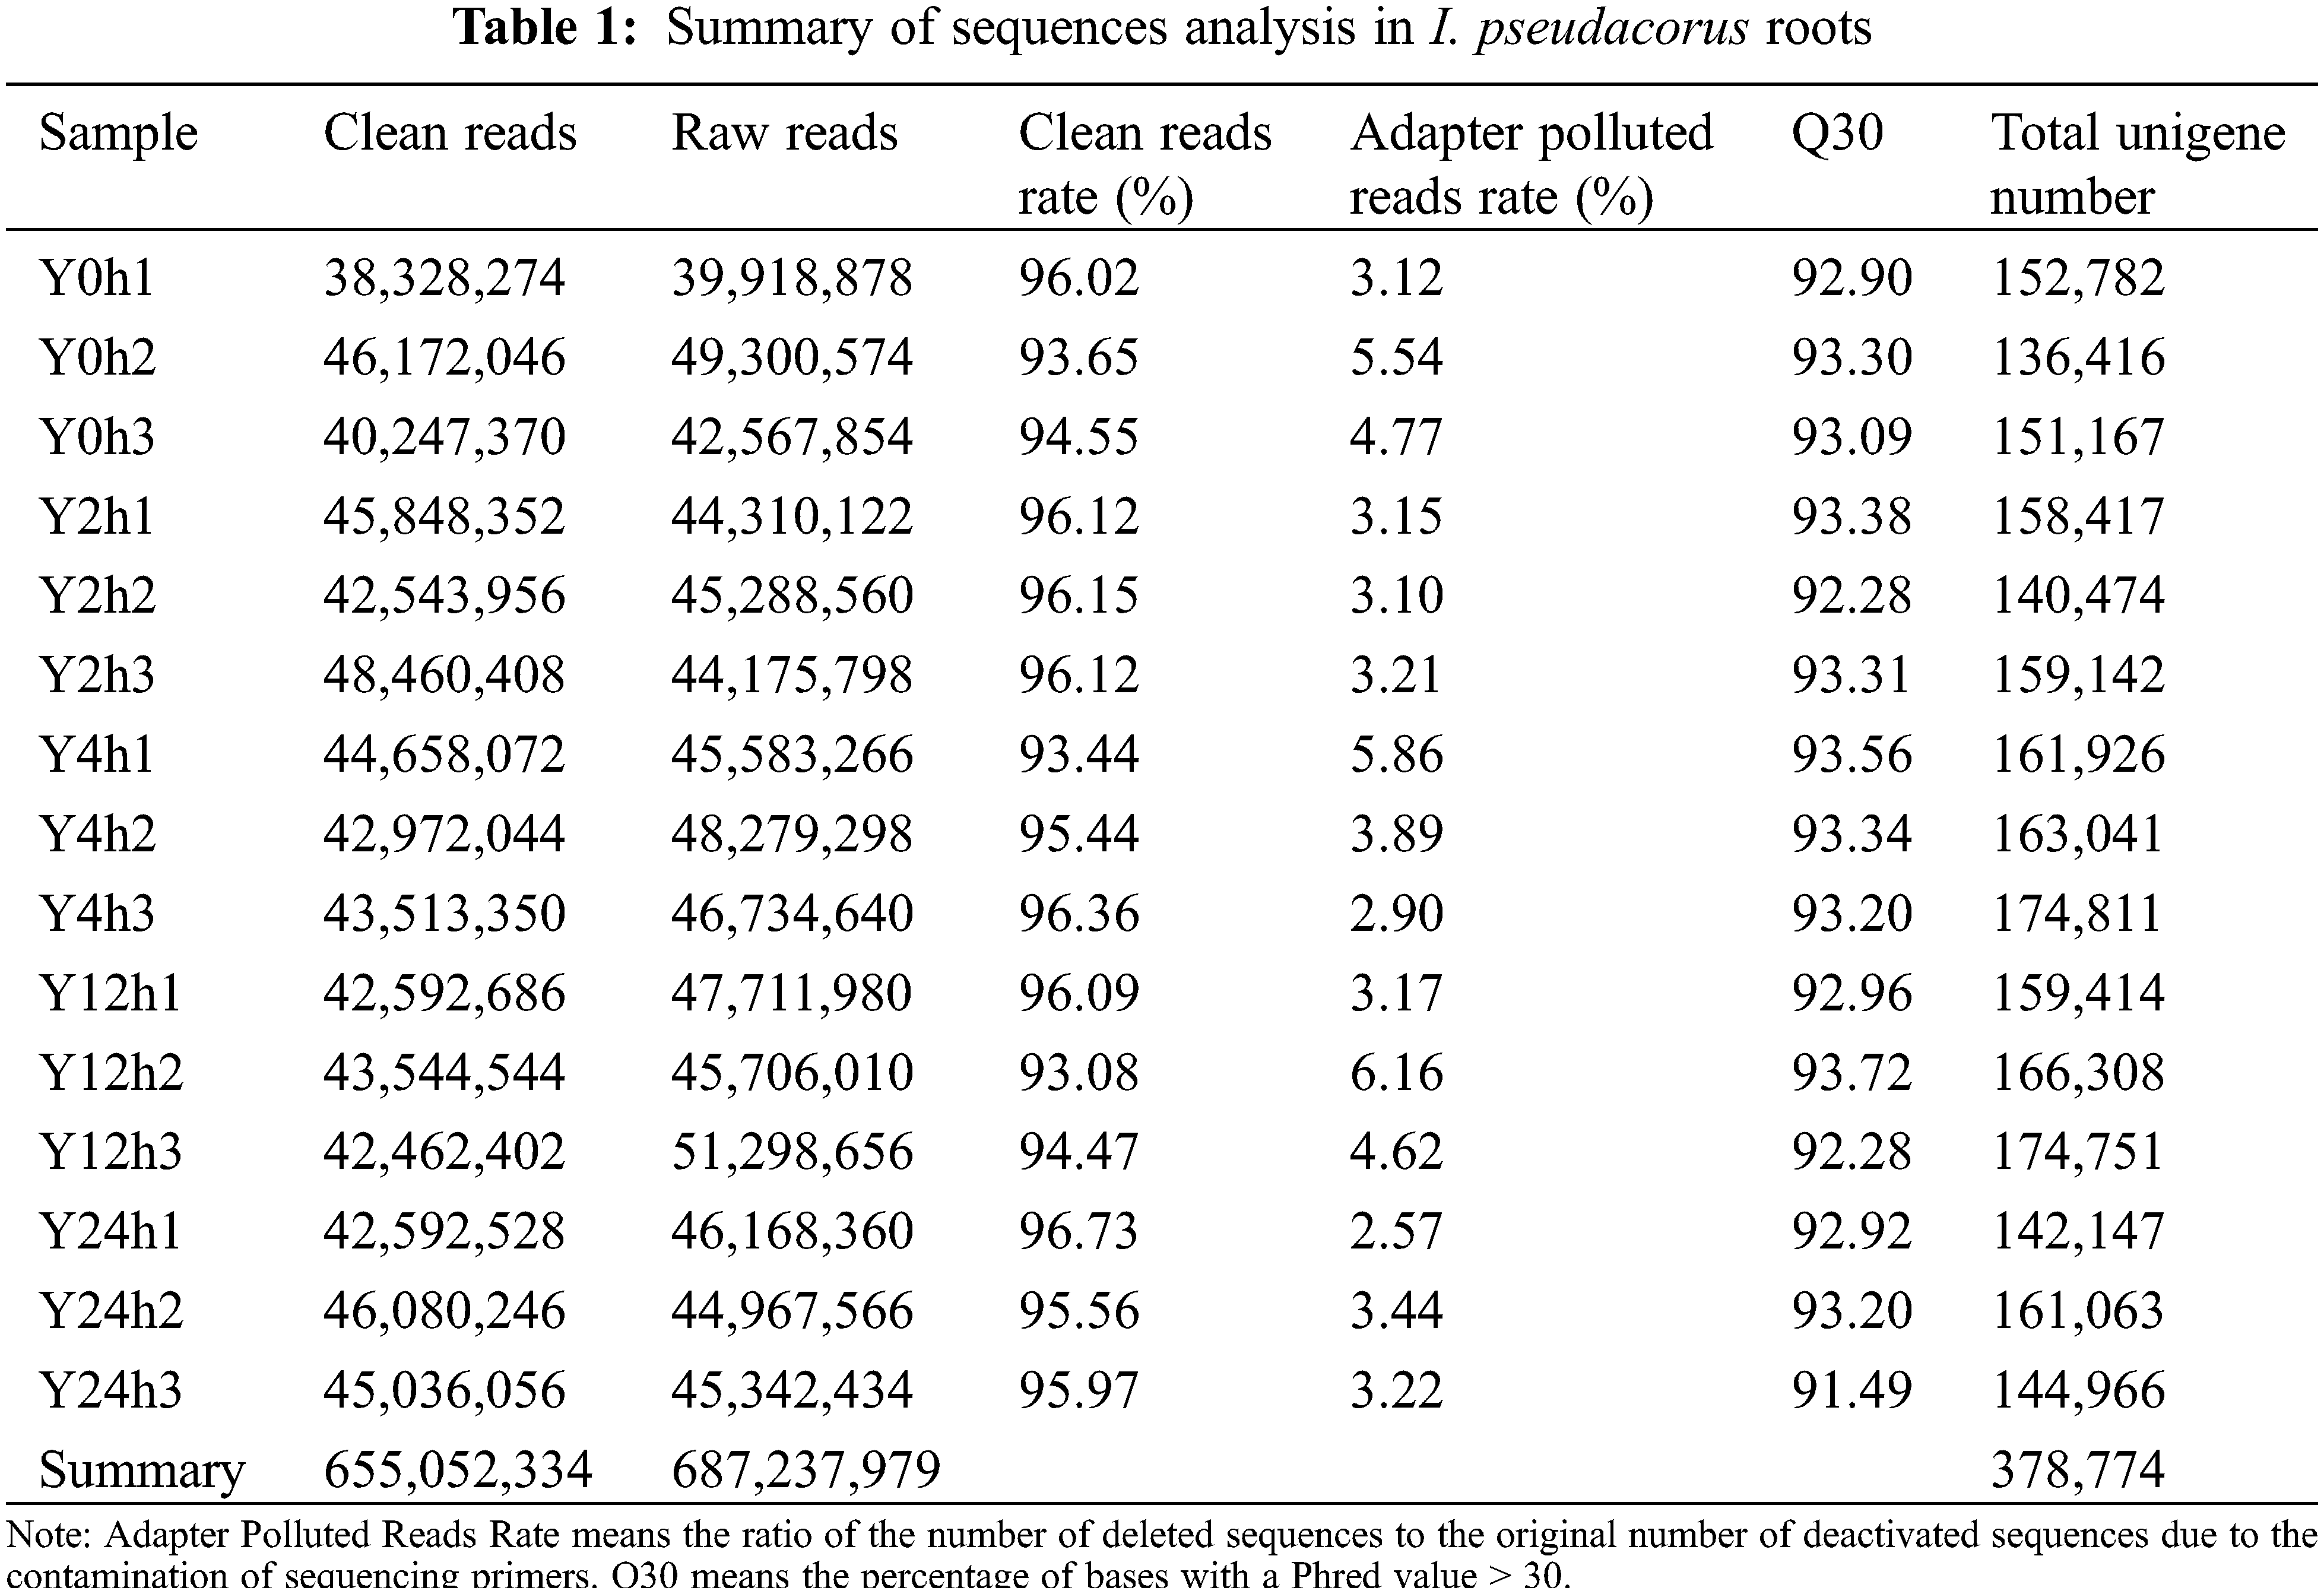
3.3 Illumina Sequencing, Unigenes Assembly and Functional Annotation
Transcriptome data from I. pseudacorus roots were stored in the NCBI Sequence Read Archive database and is accessible through the accession number PRJNA636115. In total, 687,237,979 raw reads were generated (Table 1). The adapter and low-quality sequences were removed, leaving 655,052,334 clean reads, which were assembled into 378,774 unigenes with read lengths ranging from 201 to 14,454 bp and an N50 length of 729 bp (Fig. S1). The unigenes were annotated to genes in public databases, including Nr, GO, universal protein (Uniprot), non-supervised orthologous (egg-NOG), and nucleotide sequence (NT) databases (Table S1). Analyses showed that 175,517 unigenes (46.3%) had significant matches with unigenes in the Nr, 137,542 (36.3%) with GO, 116,187 (30.7%) with Swiss-Prot, 85,285 (22.5%) with the egg-NOG and 68,120 (17.98%) with those available in the NT databases.
The GO terms for the 137,542 unigenes were divided into three main ontologies for GO analysis, namely molecular function, cellular component and biological process (Fig. S2). In addition, a total of 119,335 unigenes were grouped into the KOG categories. The unigenes were mainly involved in the cluster for translation, ribosomal structure and biogenesis, which consisted of 20,614 unigenes. The other categories were general function prediction consisting of 17,423 unigenes and posttranslational modification, protein turnover and chaperones consisting of 13,933 unigenes (Fig. S3).
3.4 The Number of Different Genes between Different Samples
The RPKM was used to analyze the gene expression in the five types of libraries. The RNA-Seq data analysis identified 3555 differentially expressed genes. Among the up-regulated genes, 1,251 genes were highly expressed after 2 h of waterlogging, 2,287 genes after 4 h, 3,673 genes after 12 h and 2,139 genes after 24 h waterlogging. The down-regulated genes included 2,304 genes in I. pseudacorus roots soaked in water for 2 h, 7,152 genes in roots soaked for 4 h, 7,061 genes in roots flooded for 12 h and 2,858 genes repressed in roots after 24 h waterlogging (Fig. 3).
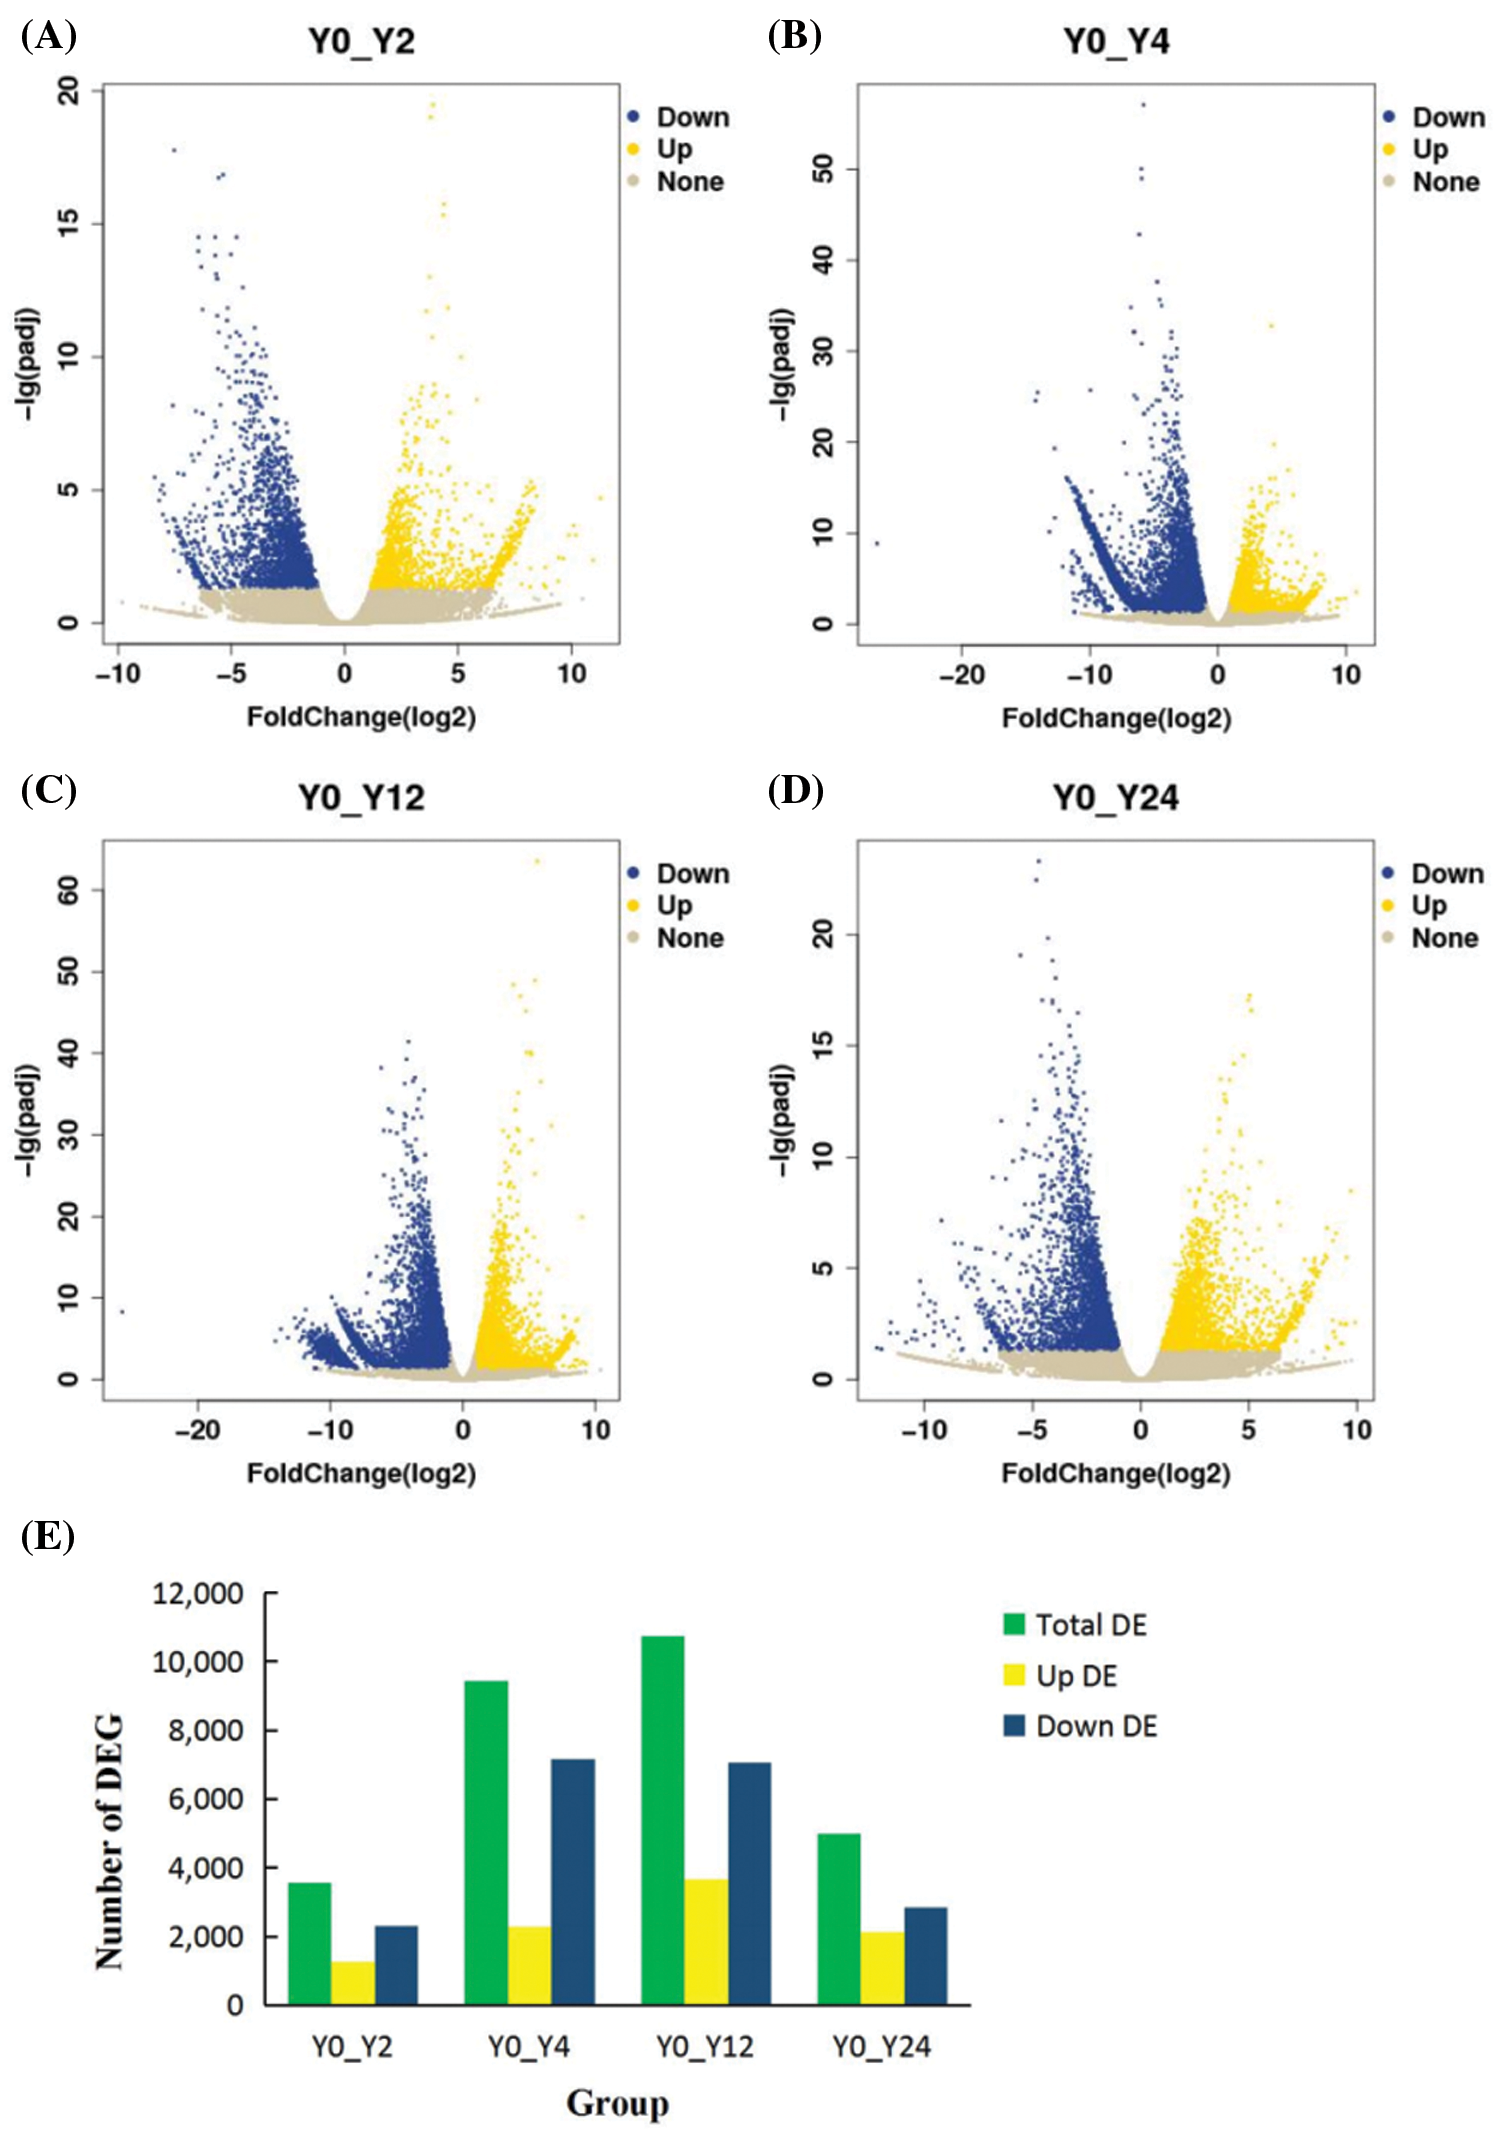
Figure 3: Statistics of the number of DEGs in different comparison groups. A, B, C, D: Up-regulation and down-regulation of differential genes in 2 h, 4 h, 12 h, 24 h flooding treatment; E: The number of differentially expressed genes relative to 0 h (CK) in each treatment were summarized
Note: The upper and lower expressions in the figure are the comparison of 0 h relative to this time point.
3.5 GO Enrichment Analysis of the DEGs
To further analyze the possible functions of the genes, we performed GO enrichment analysis of DEGs against the background of the entire transcriptome and compared each pair of samples. The DEGs were divided into molecular function, cellular component and biological process. When the DEGs from the control roots were compared with those from roots under 2 h waterlogging stress, the DEGs enriched in biological processes involved mainly the biosynthetic process (GO:0009058), cellular macromolecule biosynthetic process (GO:0034645), and macromolecule biosynthetic process (GO:0009059) (Fig. 4, Fig. S4). In the cellular component category, DEGs were associated with the intrinsic (GO:0031224) and integral component of the membranes (GO:0016021) and plasma membrane (GO:0005886) (Fig. 5, Fig. S4). In the molecular function category, however, transferase activity (GO:0016740) was the most significant (Fig. 6, Fig. S4).
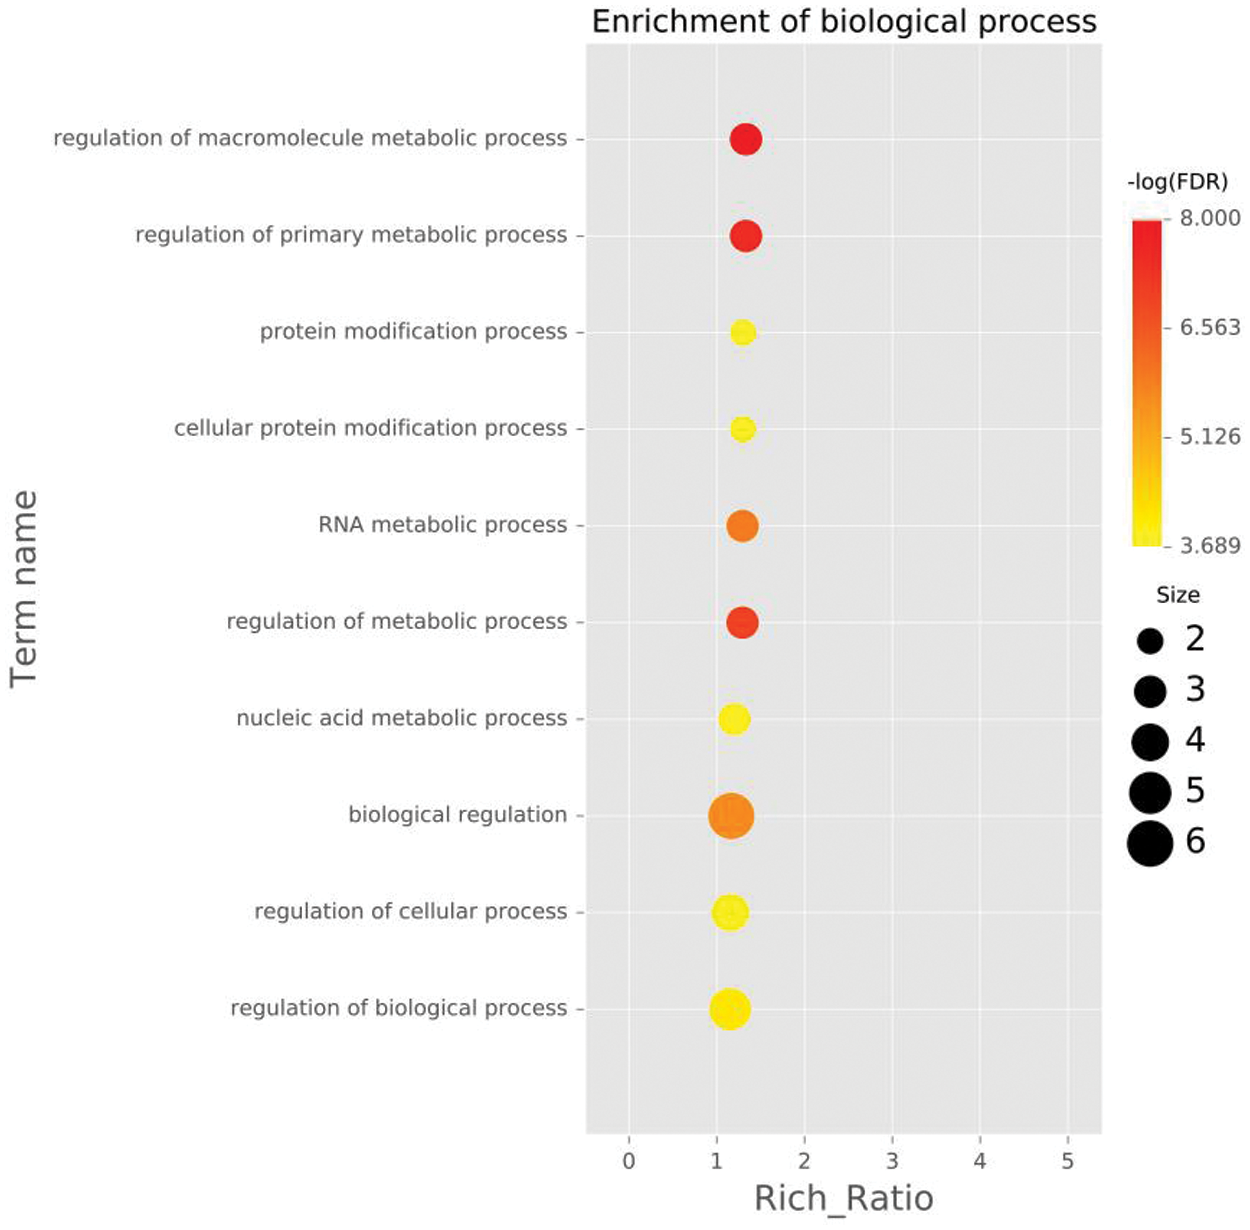
Figure 4: The ten GO entries with the highest enrichment significance for different genes in each comparison group, biological process (BP) of DEGs enriched in roots waterlogged for 2 h.
Note: Each point represents the enrichment degree of the GO item, and the closer the color is to red, the higher the enrichment degree is. The size of each dot indicates the number of genes enriched in this GO item. The larger the dot is, the more genes enriched in this GO item, and vice versa.
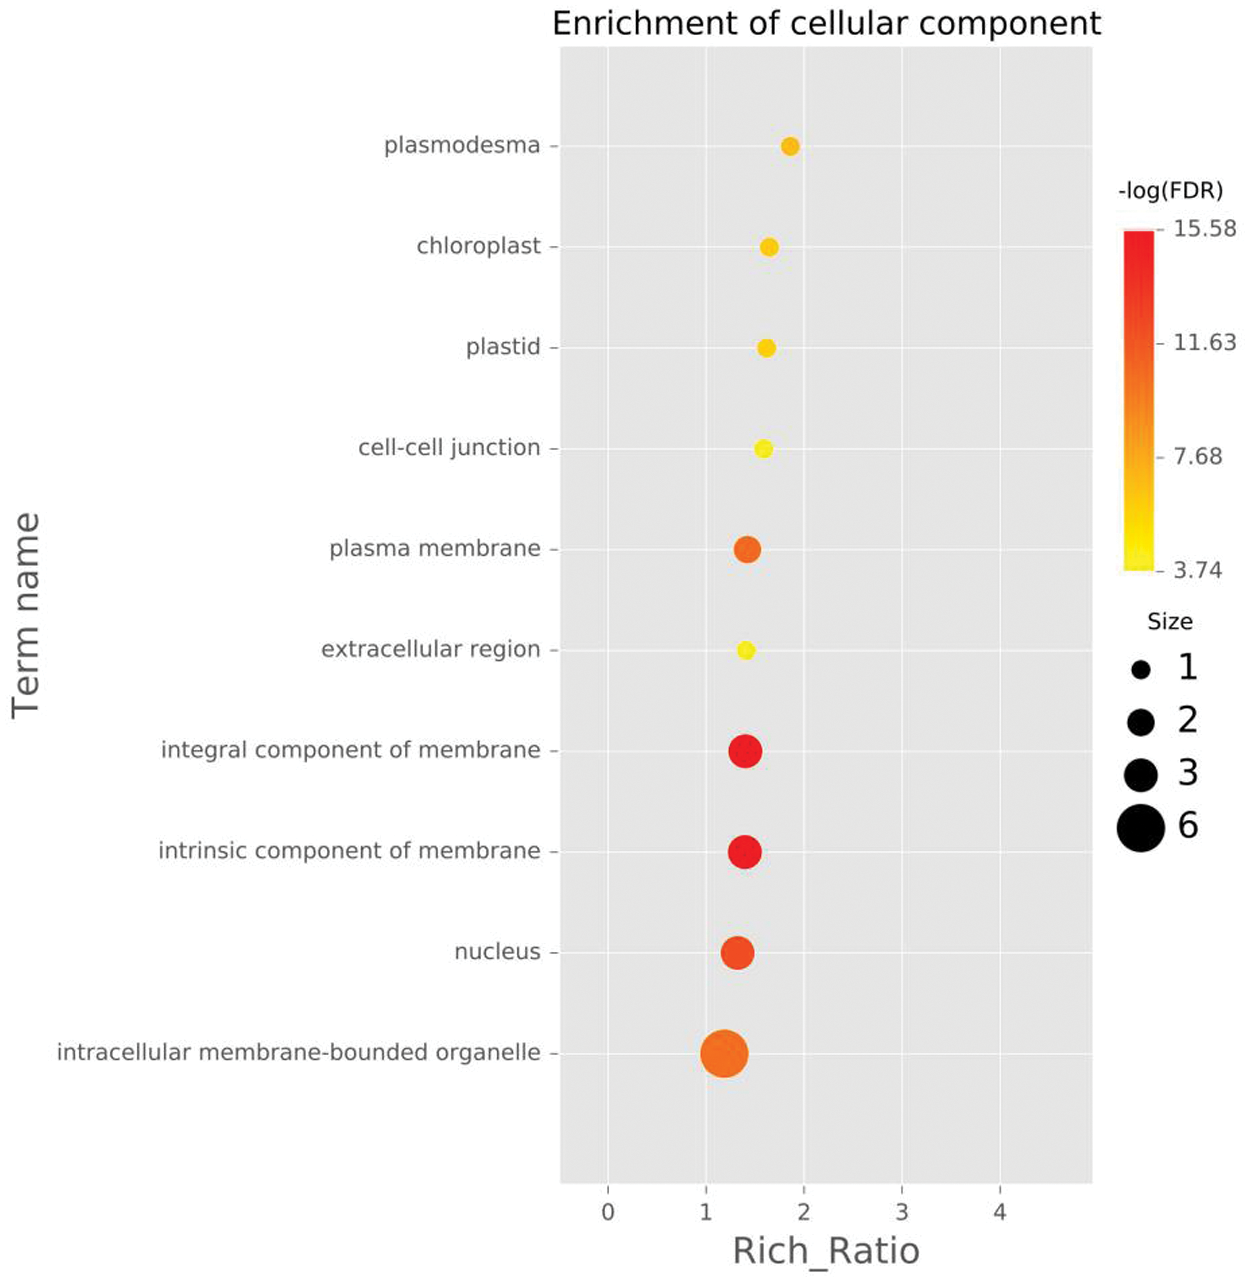
Figure 5: The ten GO entries with the highest enrichment significance for different genes in each comparison group, cellular component (CC) of DEGs enriched in roots waterlogged for 2 h.
Note: Each point represents the enrichment degree of the GO item, and the closer the color is to red, the higher the enrichment degree is. The size of each dot indicates the number of genes enriched in this GO item. The larger the dot is, the more genes enriched in this GO item, and vice versa.
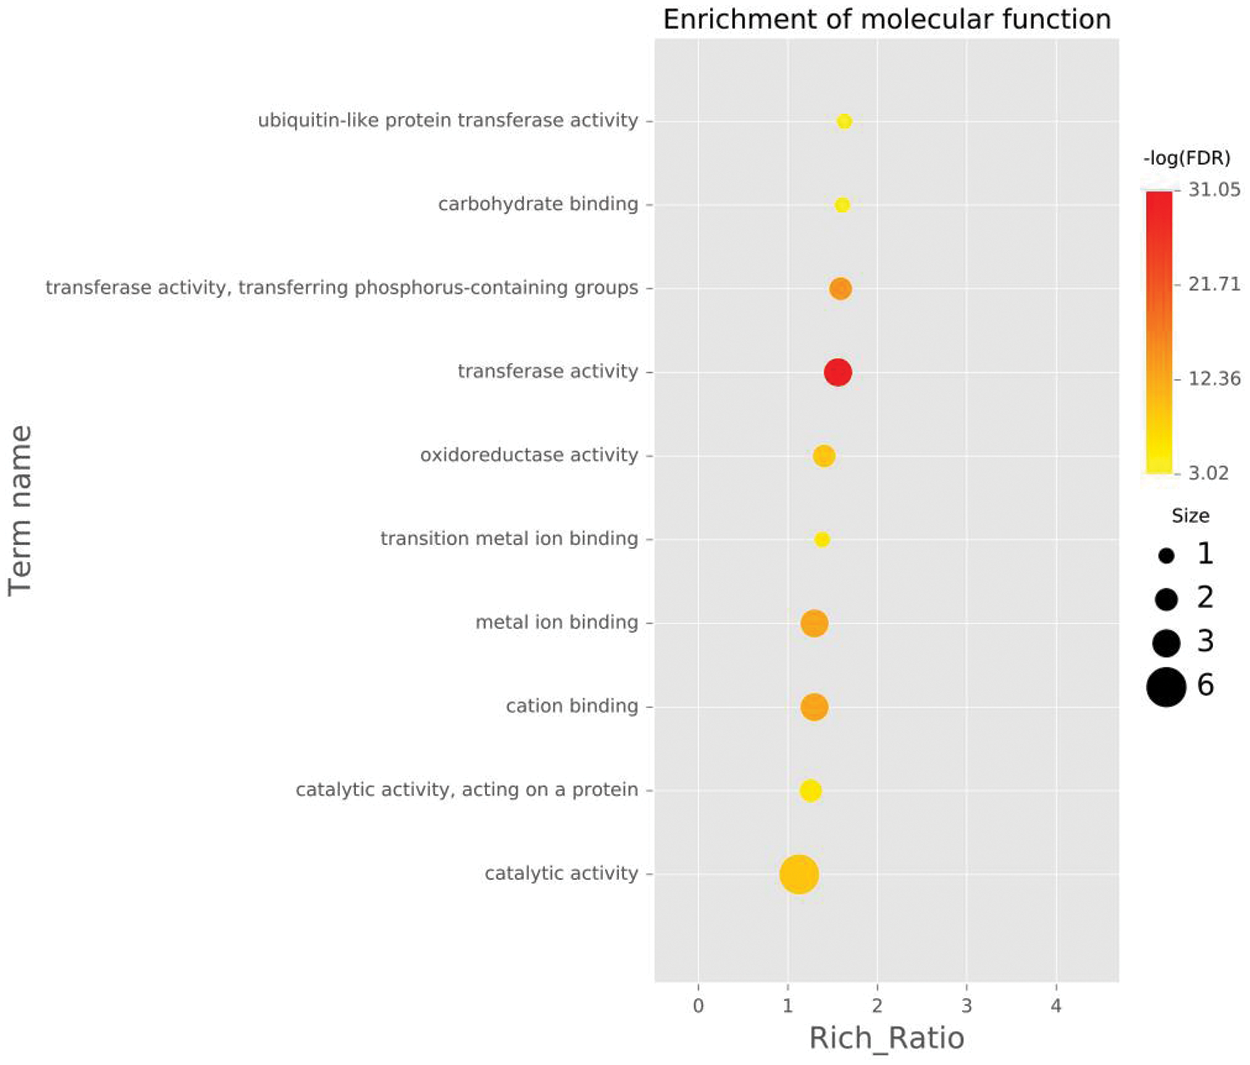
Figure 6: The ten GO entries with the highest enrichment significance for different genes in each comparison group, molecular function (MF) of DEGs enriched in roots waterlogged for 2 h.
Note: Each point represents the enrichment degree of the GO item, and the closer the color is to red, the higher the enrichment degree is. The size of each dot indicates the number of genes enriched in this GO item. The larger the dot is, the more genes enriched in this GO item, and vice versa.
When the genes of the control were compared with those expressed in I. pseudacorus roots exposed to 4 h flooding stress, DEGs enriched in biological processes mainly involved biological (GO:0065007) and cellular processes (GO:0050794) regulations (Figs. S5 and S8). The cellular component category involved mainly the intrinsic (GO:0031224) and the integral (GO:0016021) component of the membrane (Fig. S9, Fig. S5), similar to those observed for genes in roots exposed to 2 h waterlogging stress. The most significant entries (GO:0016740) in the molecular function category were consistent with the results found in genes in roots exposed to 2 h flooding (Figs. S5 and S10). For the GO terms analysis found in roots exposed to 12 h flooding stress, DEGs enriched in biological processes mainly involved biological regulation (GO:0065007) and regulation of the biological process (GO:0050789) (Figs. S6 and S11). The cellular component category mainly involved membrane part (GO:0044425) (Figs. S6 and S12), while in the molecular function category, cofactor binding (GO:0048037) and catalytic activity, acting on a protein (GO:0140096) were the most enriched GO terms (Figs. S6 and S13).
The GO term analysis also showed that genes expressed in I. pseudacorus roots exposed to a 24 h flooding stress and enriched in biological processes mainly involved signal transduction (GO:0007165) and regulation of the nucleobase-containing compound metabolic process (GO:0019219) (Figs. S7 and S14). In the cellular component category, DEGs involved in the membrane part (GO:0044425) (Figs. S7 and S15) and those involved in the transferase activities in the molecular function were the most prominent (GO:0016740) (Figs. S7 and S16).
3.6 KEGG Pathways Enrichment Analysis of the DEGs
After 2 h of exposure of I. pseudacorus roots to waterlogging stress, KEGG pathway enrichment analysis for DEGs indicated that cutin, suberine and wax biosynthesis (map00073), plant hormone signal transduction (map04075), glycolysis/gluconeogenesis (map04075), MAPK signaling (map04016), plant-pathogen interaction (map04626) and alpha-Linolenic acid metabolism pathways (map00592) were the most significantly enriched. However, phenylpropanoid (map00940) and brassinosteroid (map00905) biosynthesis pathways were repressed at 2 h (Fig. 7).
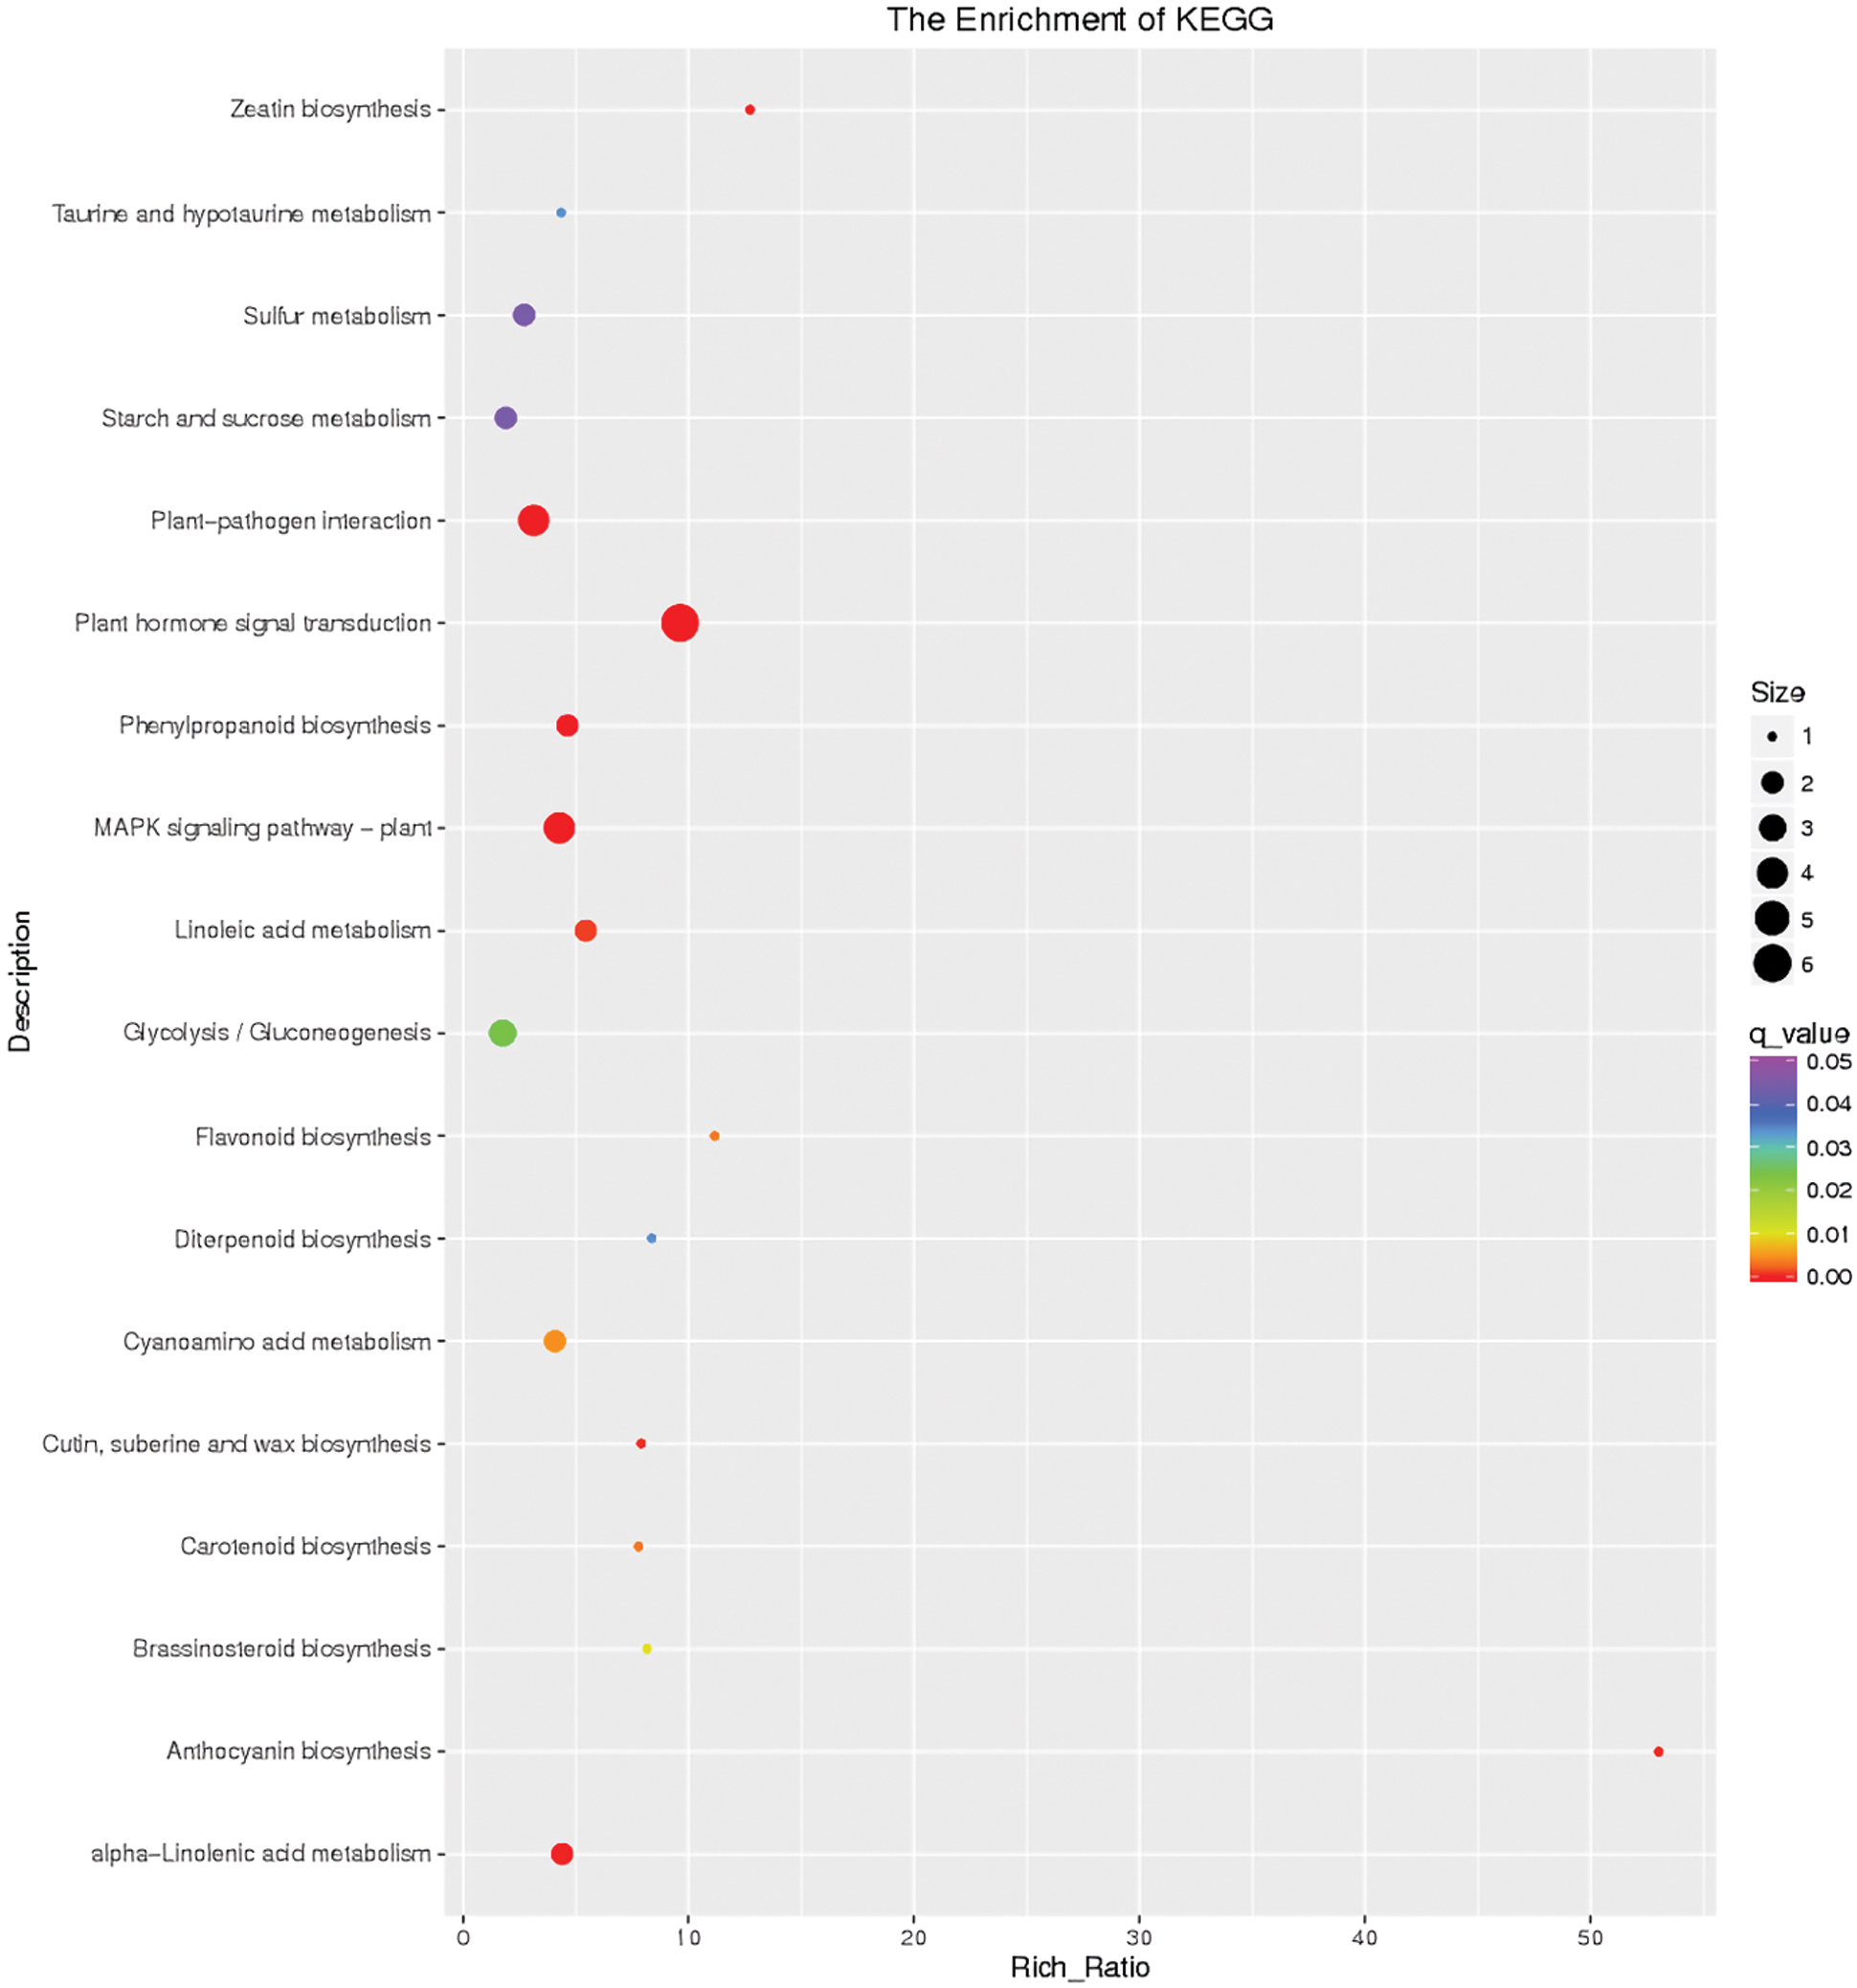
Figure 7: Differential gene KEGG enrichment scatter plot of the control and flooding stress, shows the pathways enriched in comparison between 2 h of flooding stress and 0 h stress
Amino acid biosynthesis (map01230), plant-pathogen interaction (map04626), sulfur metabolism (map00920), glycolysis/gluconeogenesis (map00010), starch and sucrose metabolism (map00500), and plant hormone signal transduction (map04075) were the pivotal pathways involved in response to 4 h waterlogging stress (Fig. 8). All these pathways excluding sulfur metabolism were involved in response to 12 h flooding stress in I. pseudacorus roots. In addition, oxidative phosphorylation (map00190) was also a key pathway involved in response to roots soaked in water for 12 h (Fig. 9).
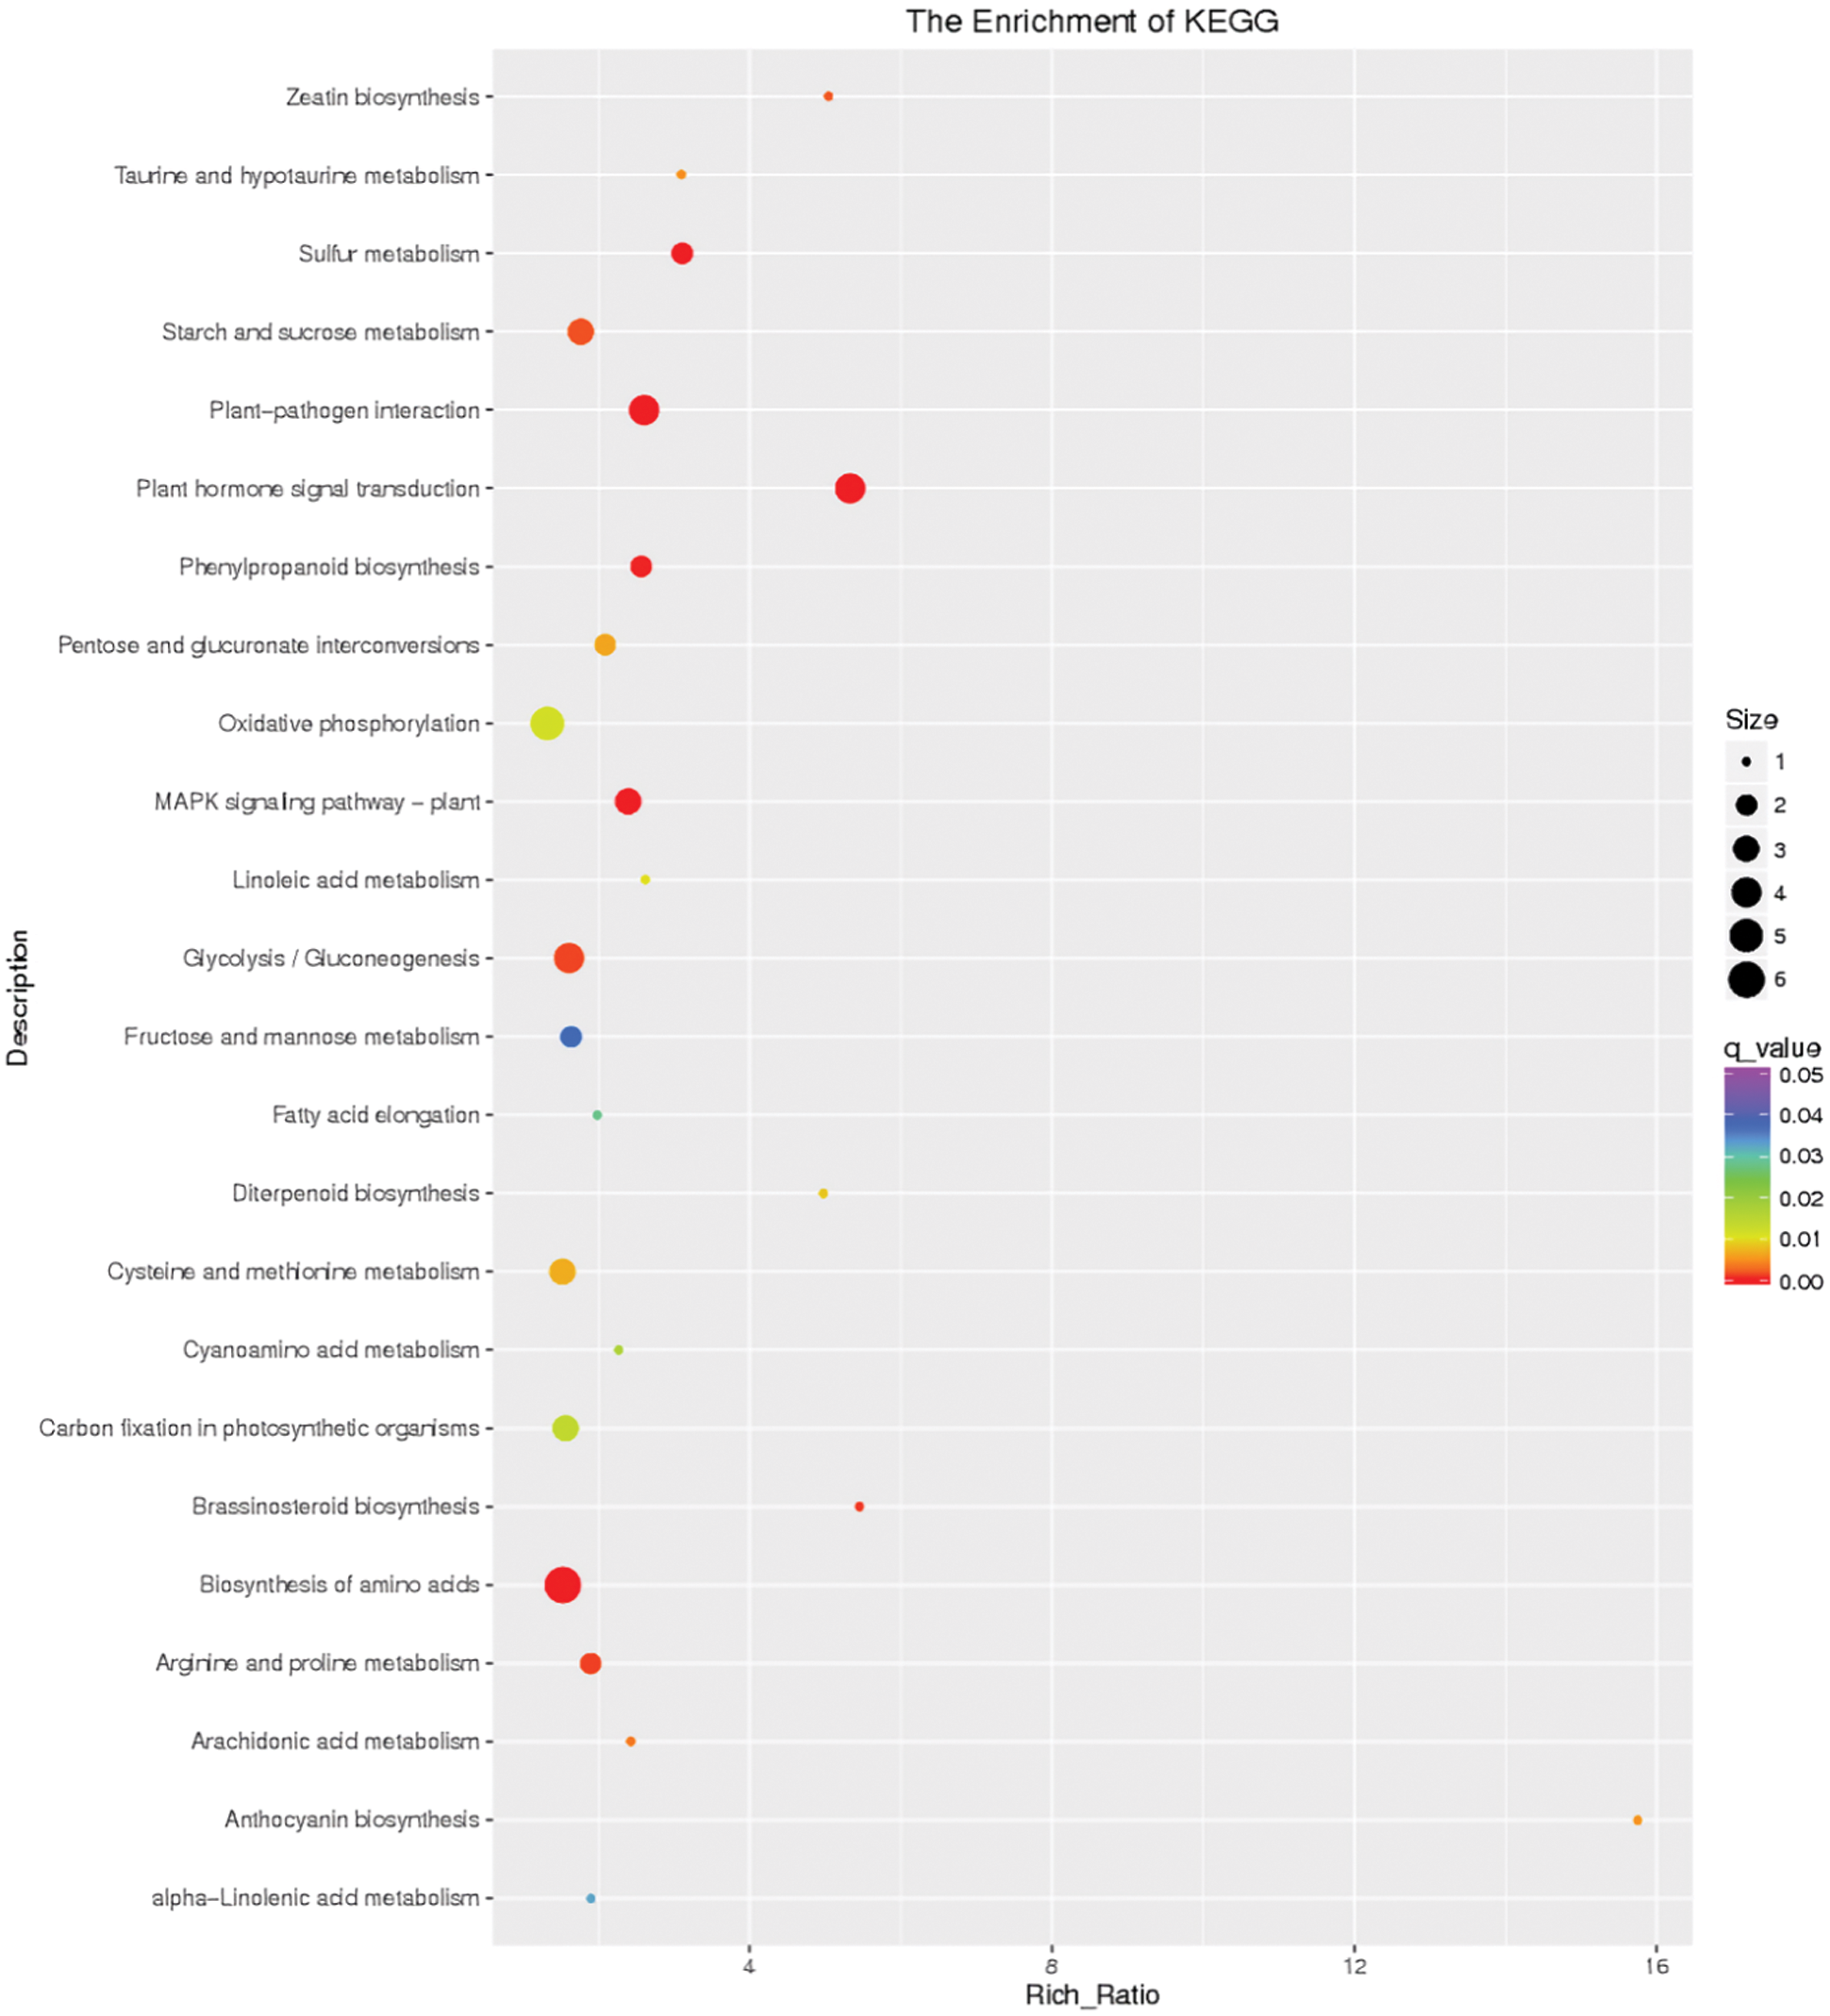
Figure 8: Differential gene KEGG enrichment scatter plot of the control and flooding stress, shows the pathways enriched in comparison between 4 h of flooding stress and 0 h stress
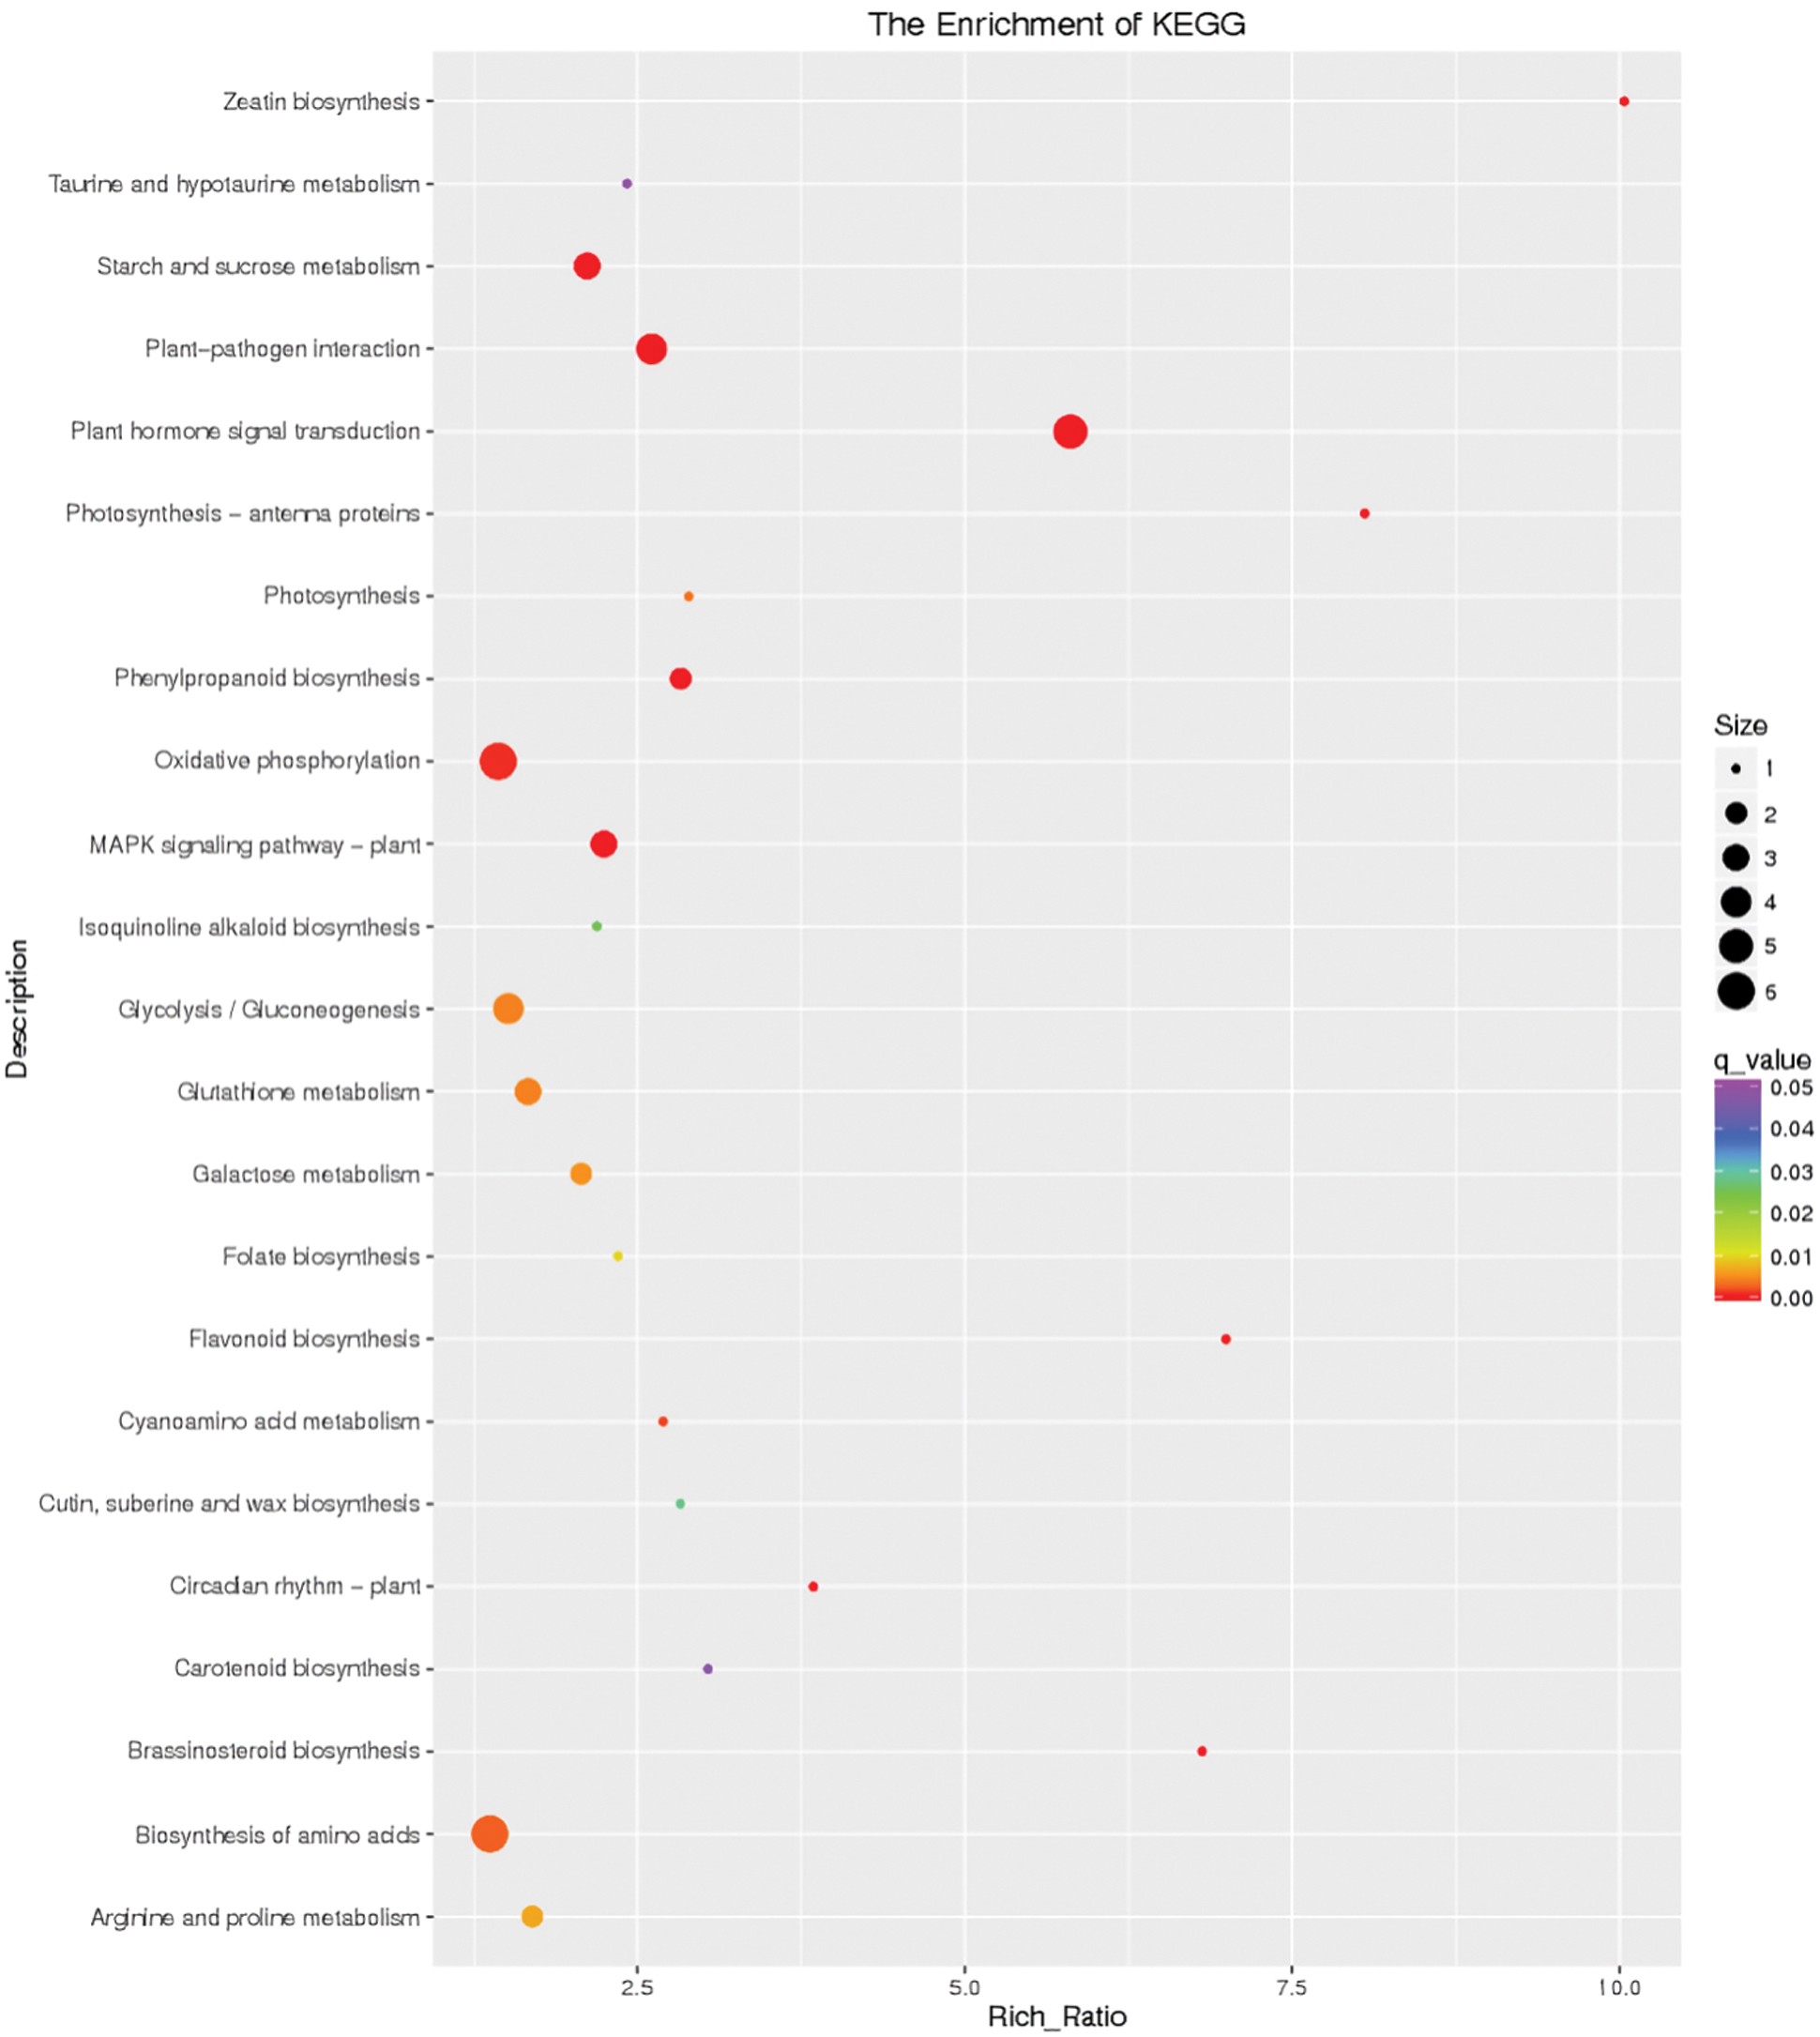
Figure 9: Differential gene KEGG enrichment scatter plot of the control and flooding stress, shows the pathways enriched in comparison between 12 h of flooding stress and 0 h stress
The pivotal pathways in response to 24 h flooding stress included plant hormone signal transduction (map04075), MAPK signaling pathway (map04016), plant-pathogen interaction (map04626), starch and sucrose metabolism (map00500), phenylpropanoid biosynthesis (map00940), arginine and proline metabolism (map00330), alanine, aspartate and glutamate metabolism (map00250) (Fig. 10).
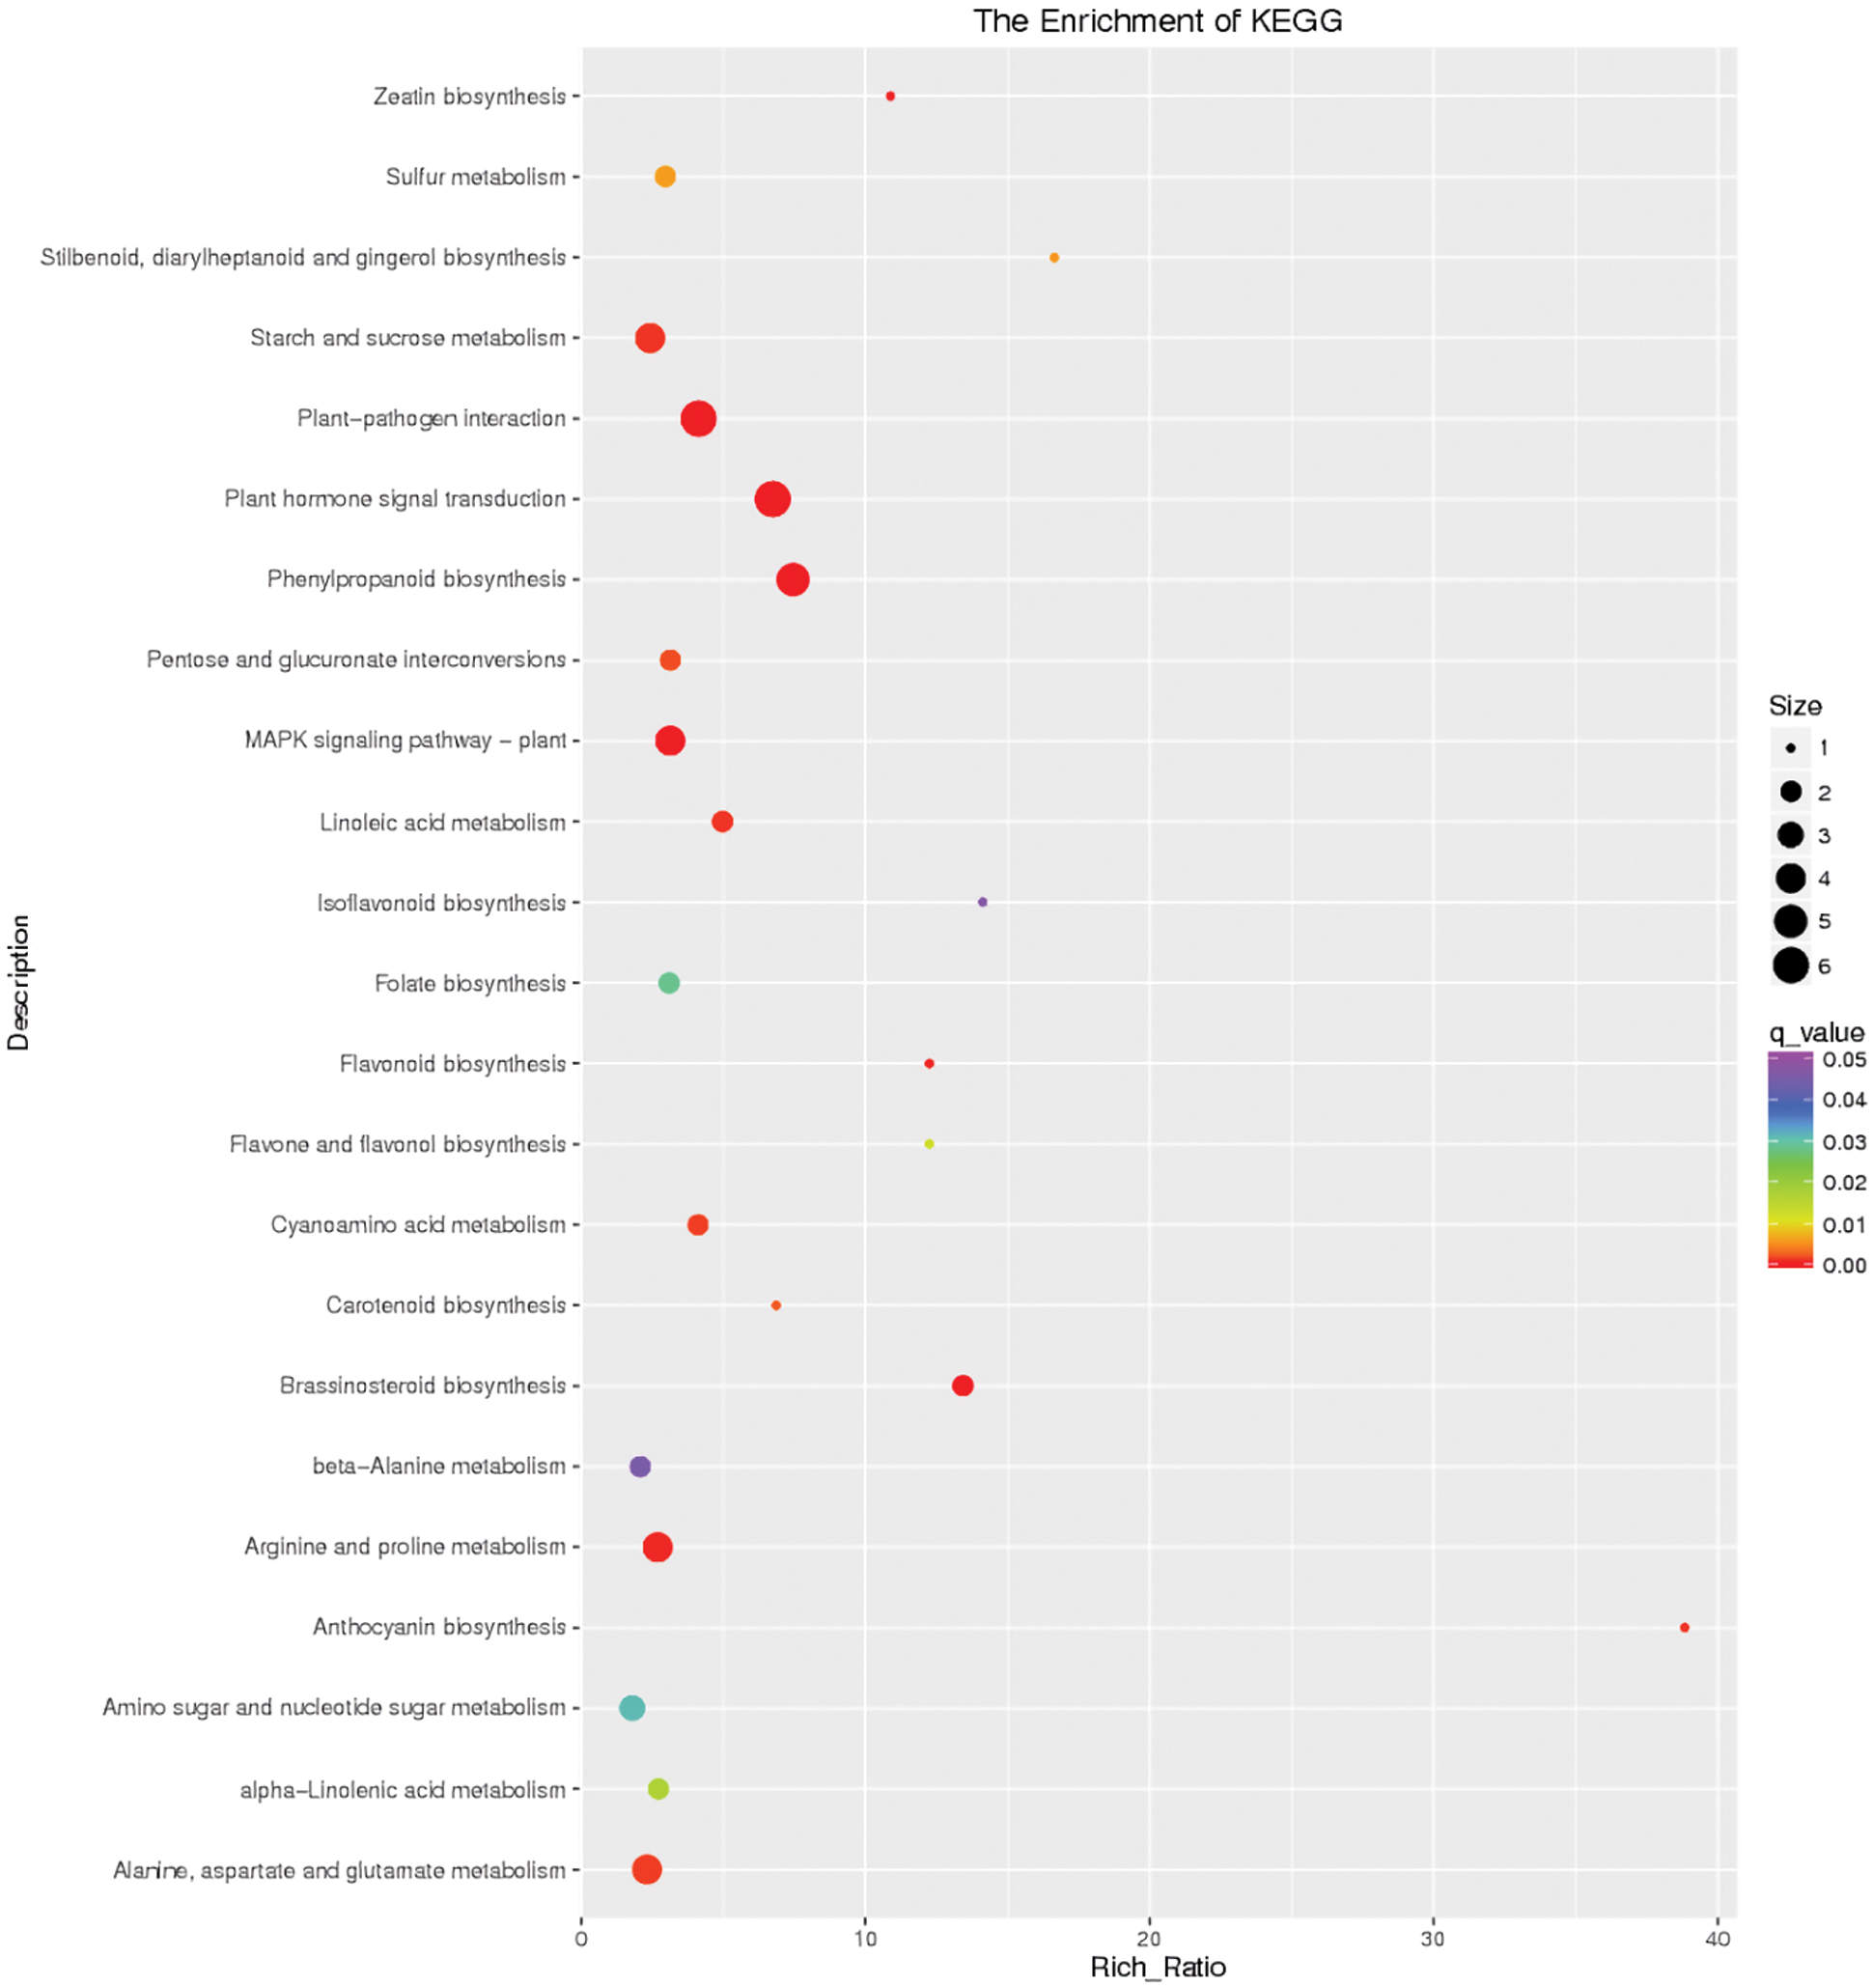
Figure 10: Differential gene KEGG enrichment scatter plot of the control and flooding stress, shows the pathways enriched in comparison between 24 h of flooding stress and 0 h stress
It is evident that pathways, including plant hormone signal transduction (map04075), plant-pathogen interaction (map04626), and starch and sucrose metabolism (map00500), were significantly enriched pathways at each time point. Interestingly, the glycolysis/gluconeogenesis (map00010) pathway was significantly enriched except after 24 h of waterlogging stress. Moreover, pathways related to amino acid metabolism (map01230, map00330, map00250) and synthesis also began to be enriched from 12 h of waterlogging stress. In addition, the number of enriched DEGs at 4 h and 12 h was higher than at 2 h and 24 h (Table S2).
3.7 Gene Expression in Plant Hormone Signal Transduction Pathway
Under 2 h of flooding stress, auxin-responsive protein, IAA-related genes and abscisic acid receptor PYR/PYL family-related genes were highly expressed. However, under the same treatment, auxin-responsive GH3 gene family, protein phosphatase 2C, xyloglucan xyloglucosyl transferase TCH4 and jasmonate ZIM domain-containing protein were repressed in the waterlogged I. pseudacorus roots. Notably, two genes (ethylene receptors) associated with ethylene signaling pathway and closely related to plant aerenchyma formation [23] were downregulated (Fig. 11, Table S3).
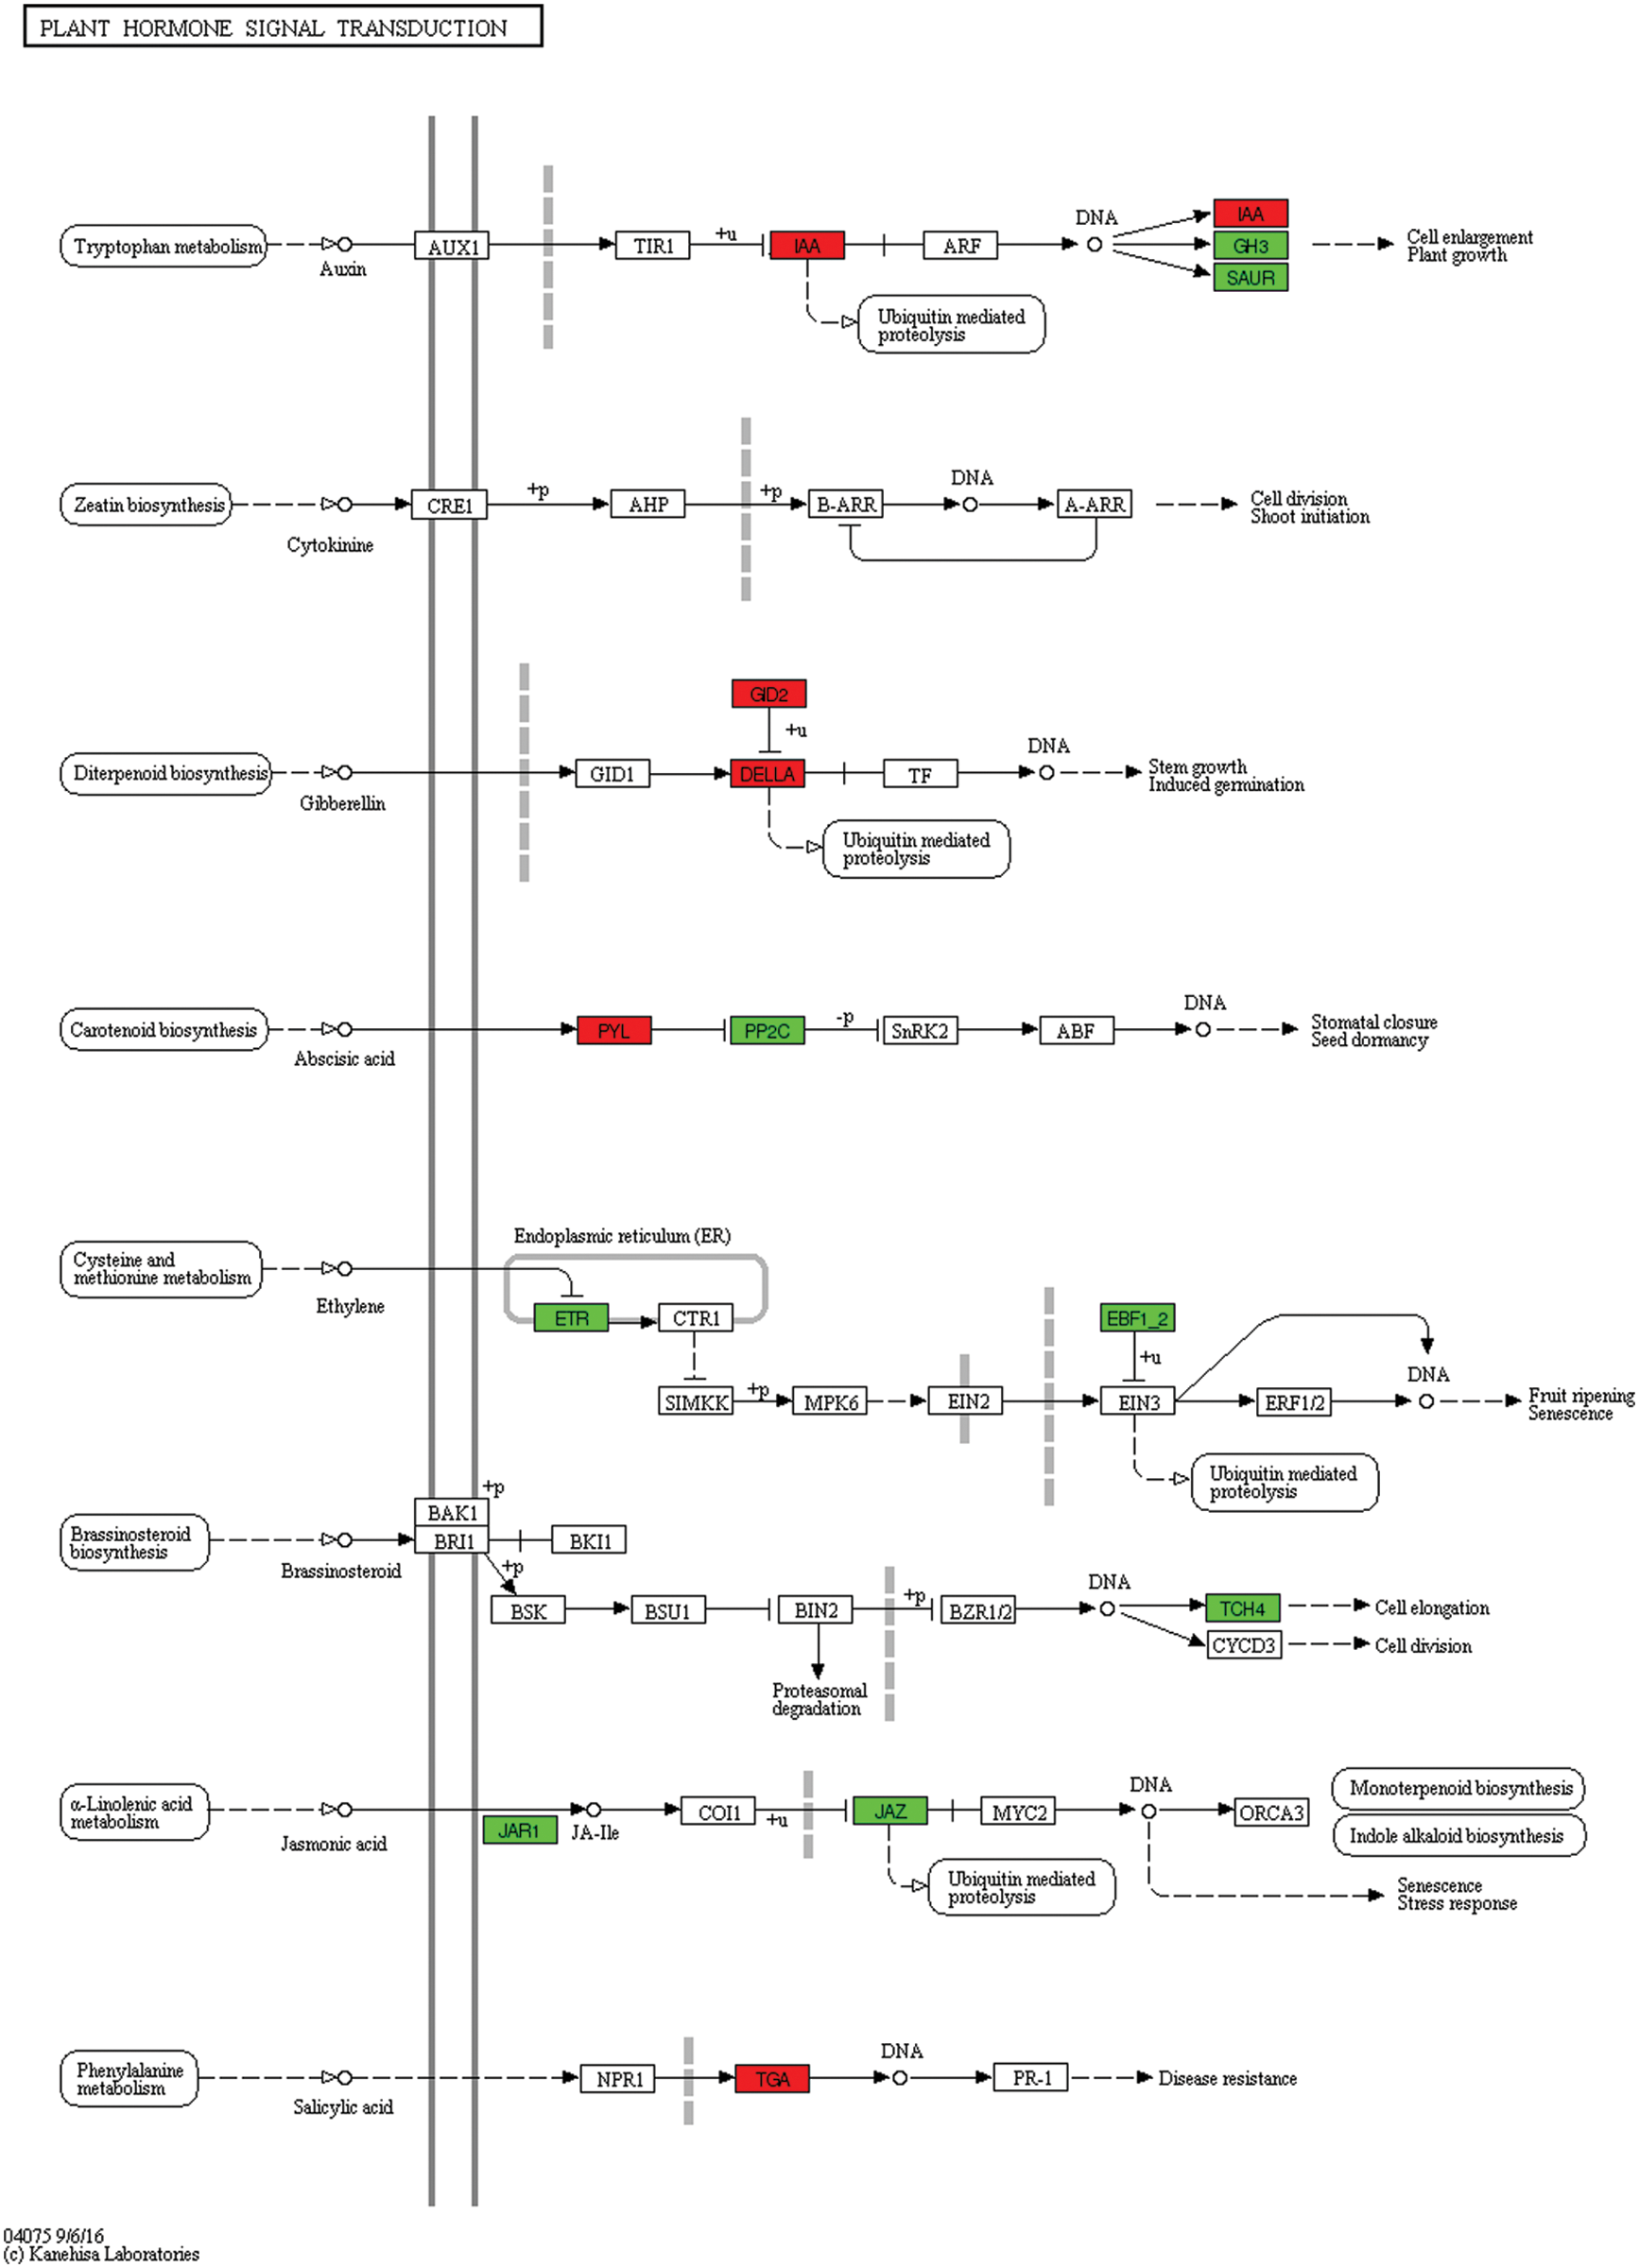
Figure 11: Unigenes predicted to be involved in the plant hormone signal transduction pathway (0 h/2 h)
Subsequently, more DEGs, including transcription factors and those found expressed in roots after 2 h waterlogging stress, were regulated in response to 4 h of flooding stress. For example, gibberellin receptor GID1 and ethylene-responsive transcription factor 1 were downregulated while brassinosteroid resistant 1/2 and transcription factor TGA were upregulated (Fig. 12, Table S3).
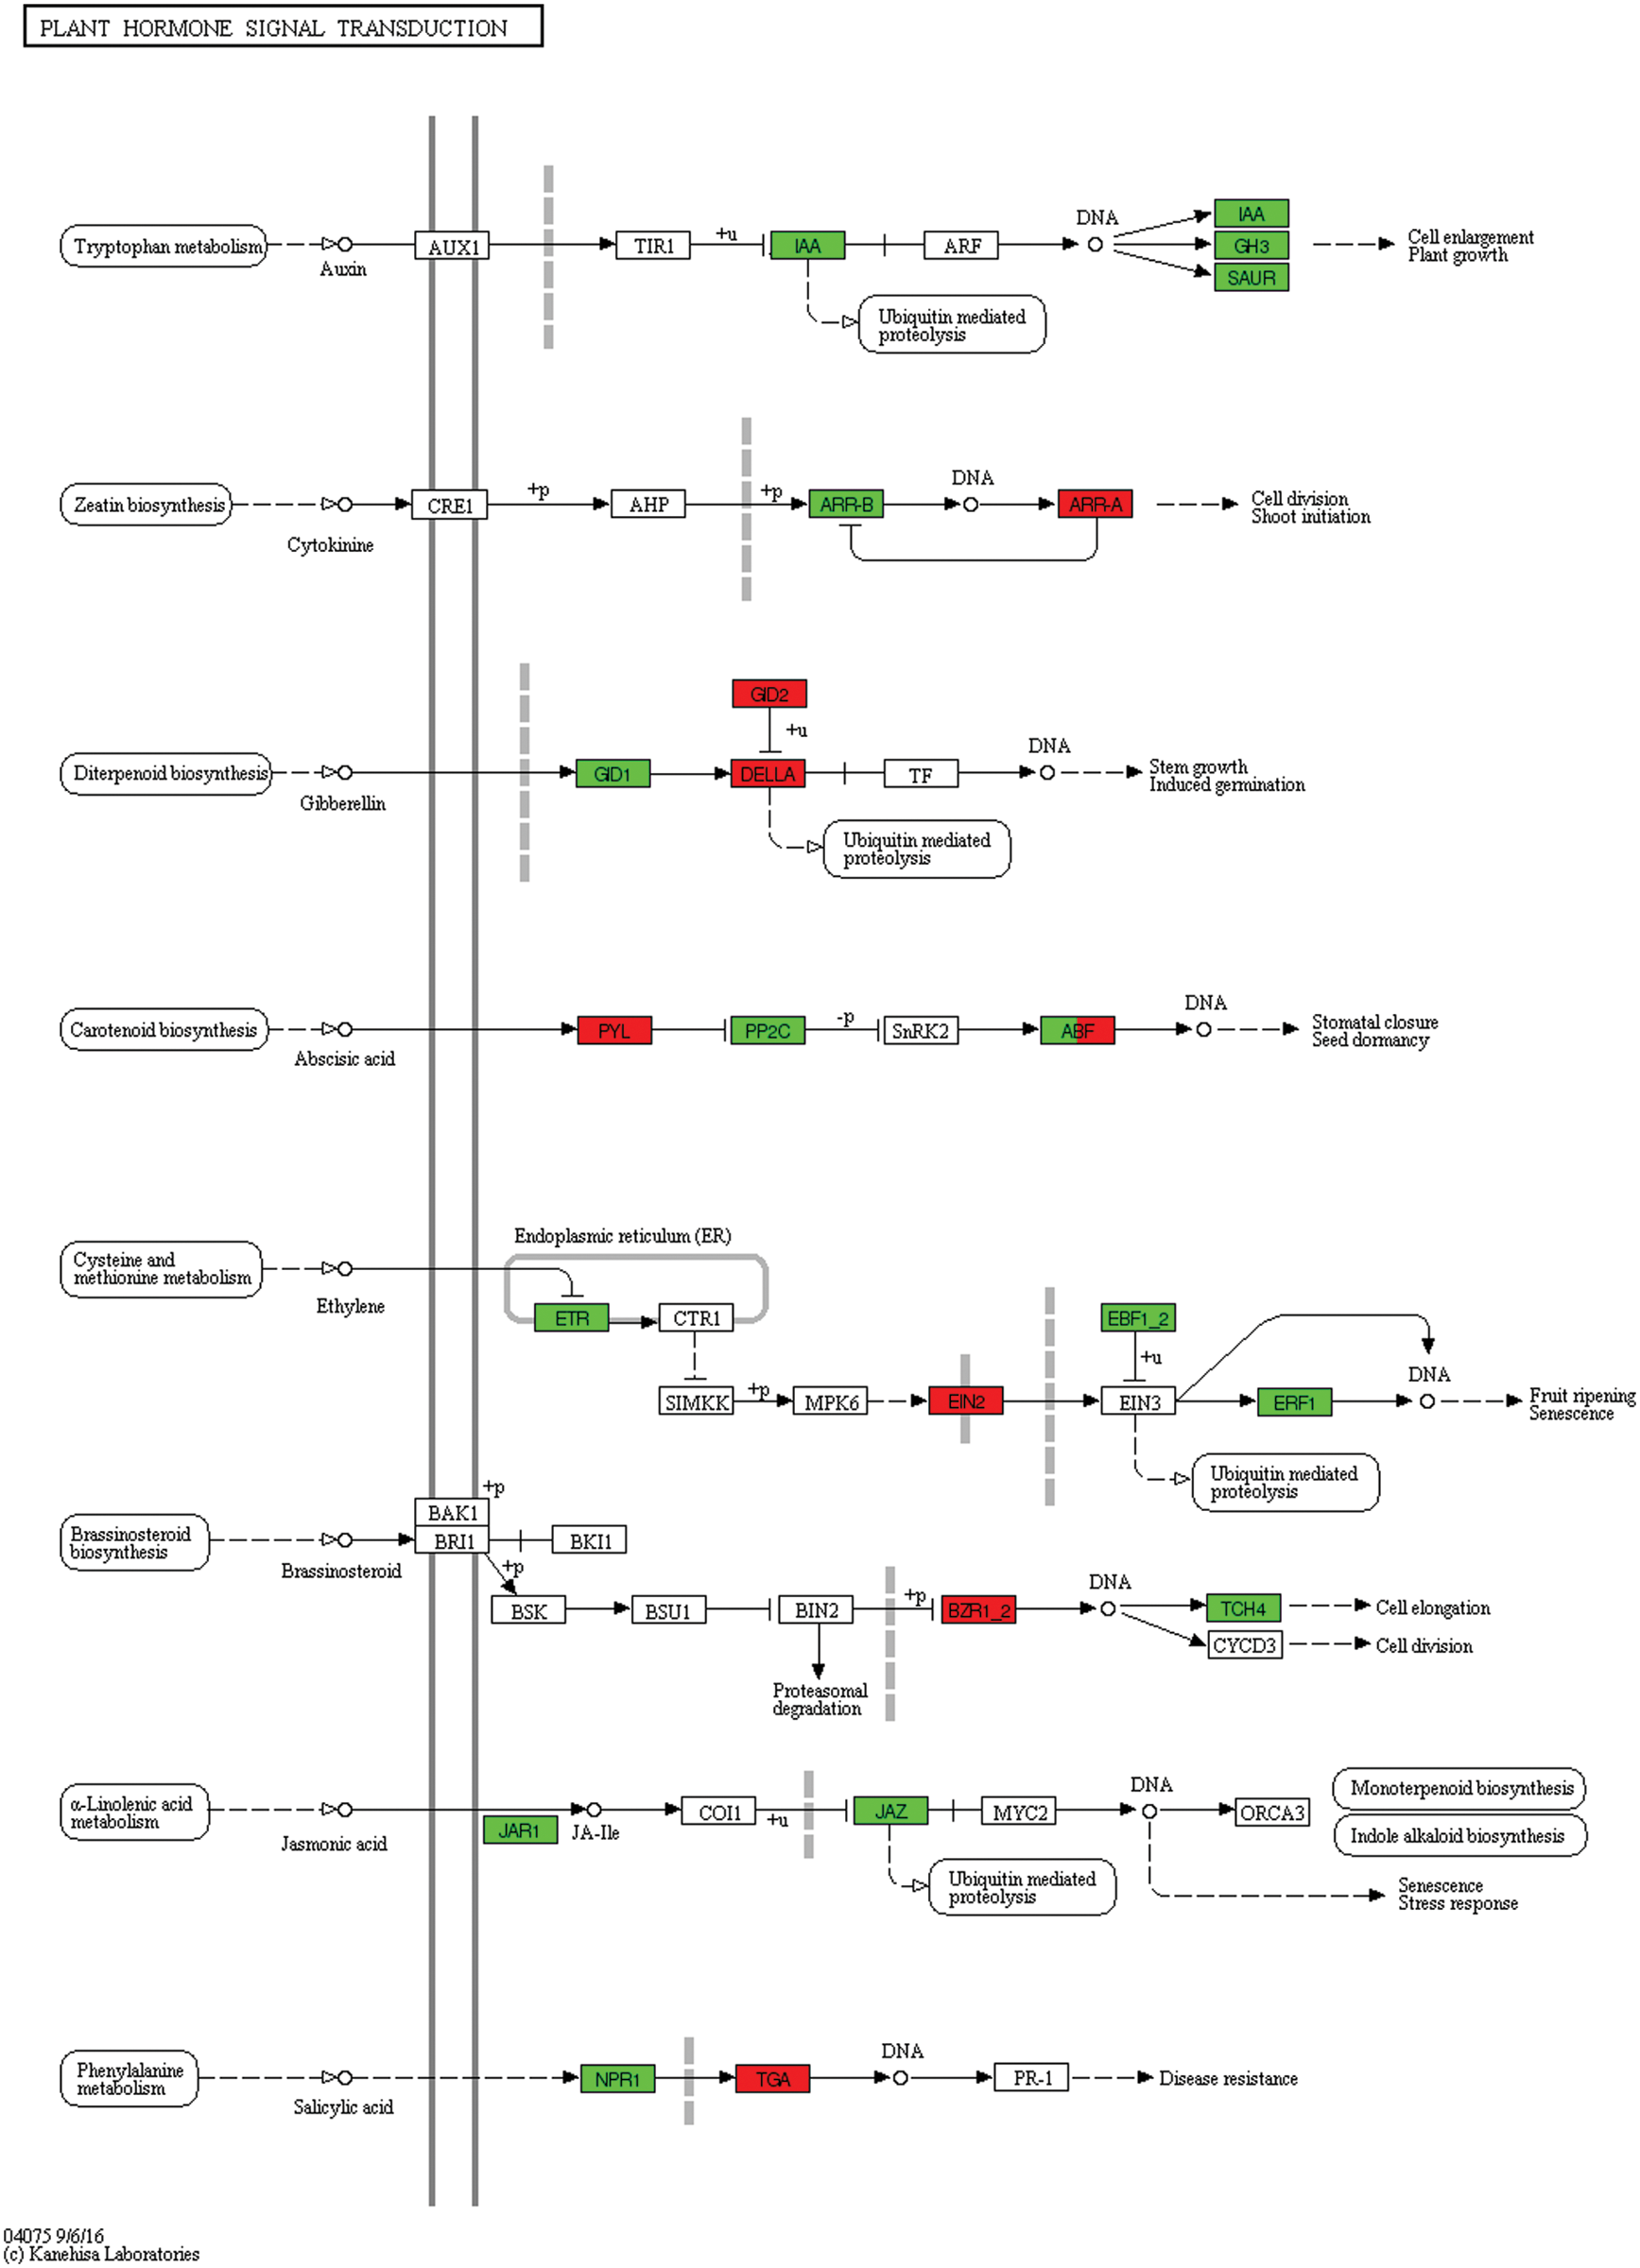
Figure 12: Unigenes predicted to be involved in the plant hormone signal transduction pathway (0 h/4 h)
In response to 12 h of flooding stress, compared to 0 h, auxin influx carrier (AUX1 LAX family), transport inhibitor response 1, two-component response regulator ARR-B family, and phytochrome-interacting factor 3, were differentially expressed (Fig. 13, Table S3).
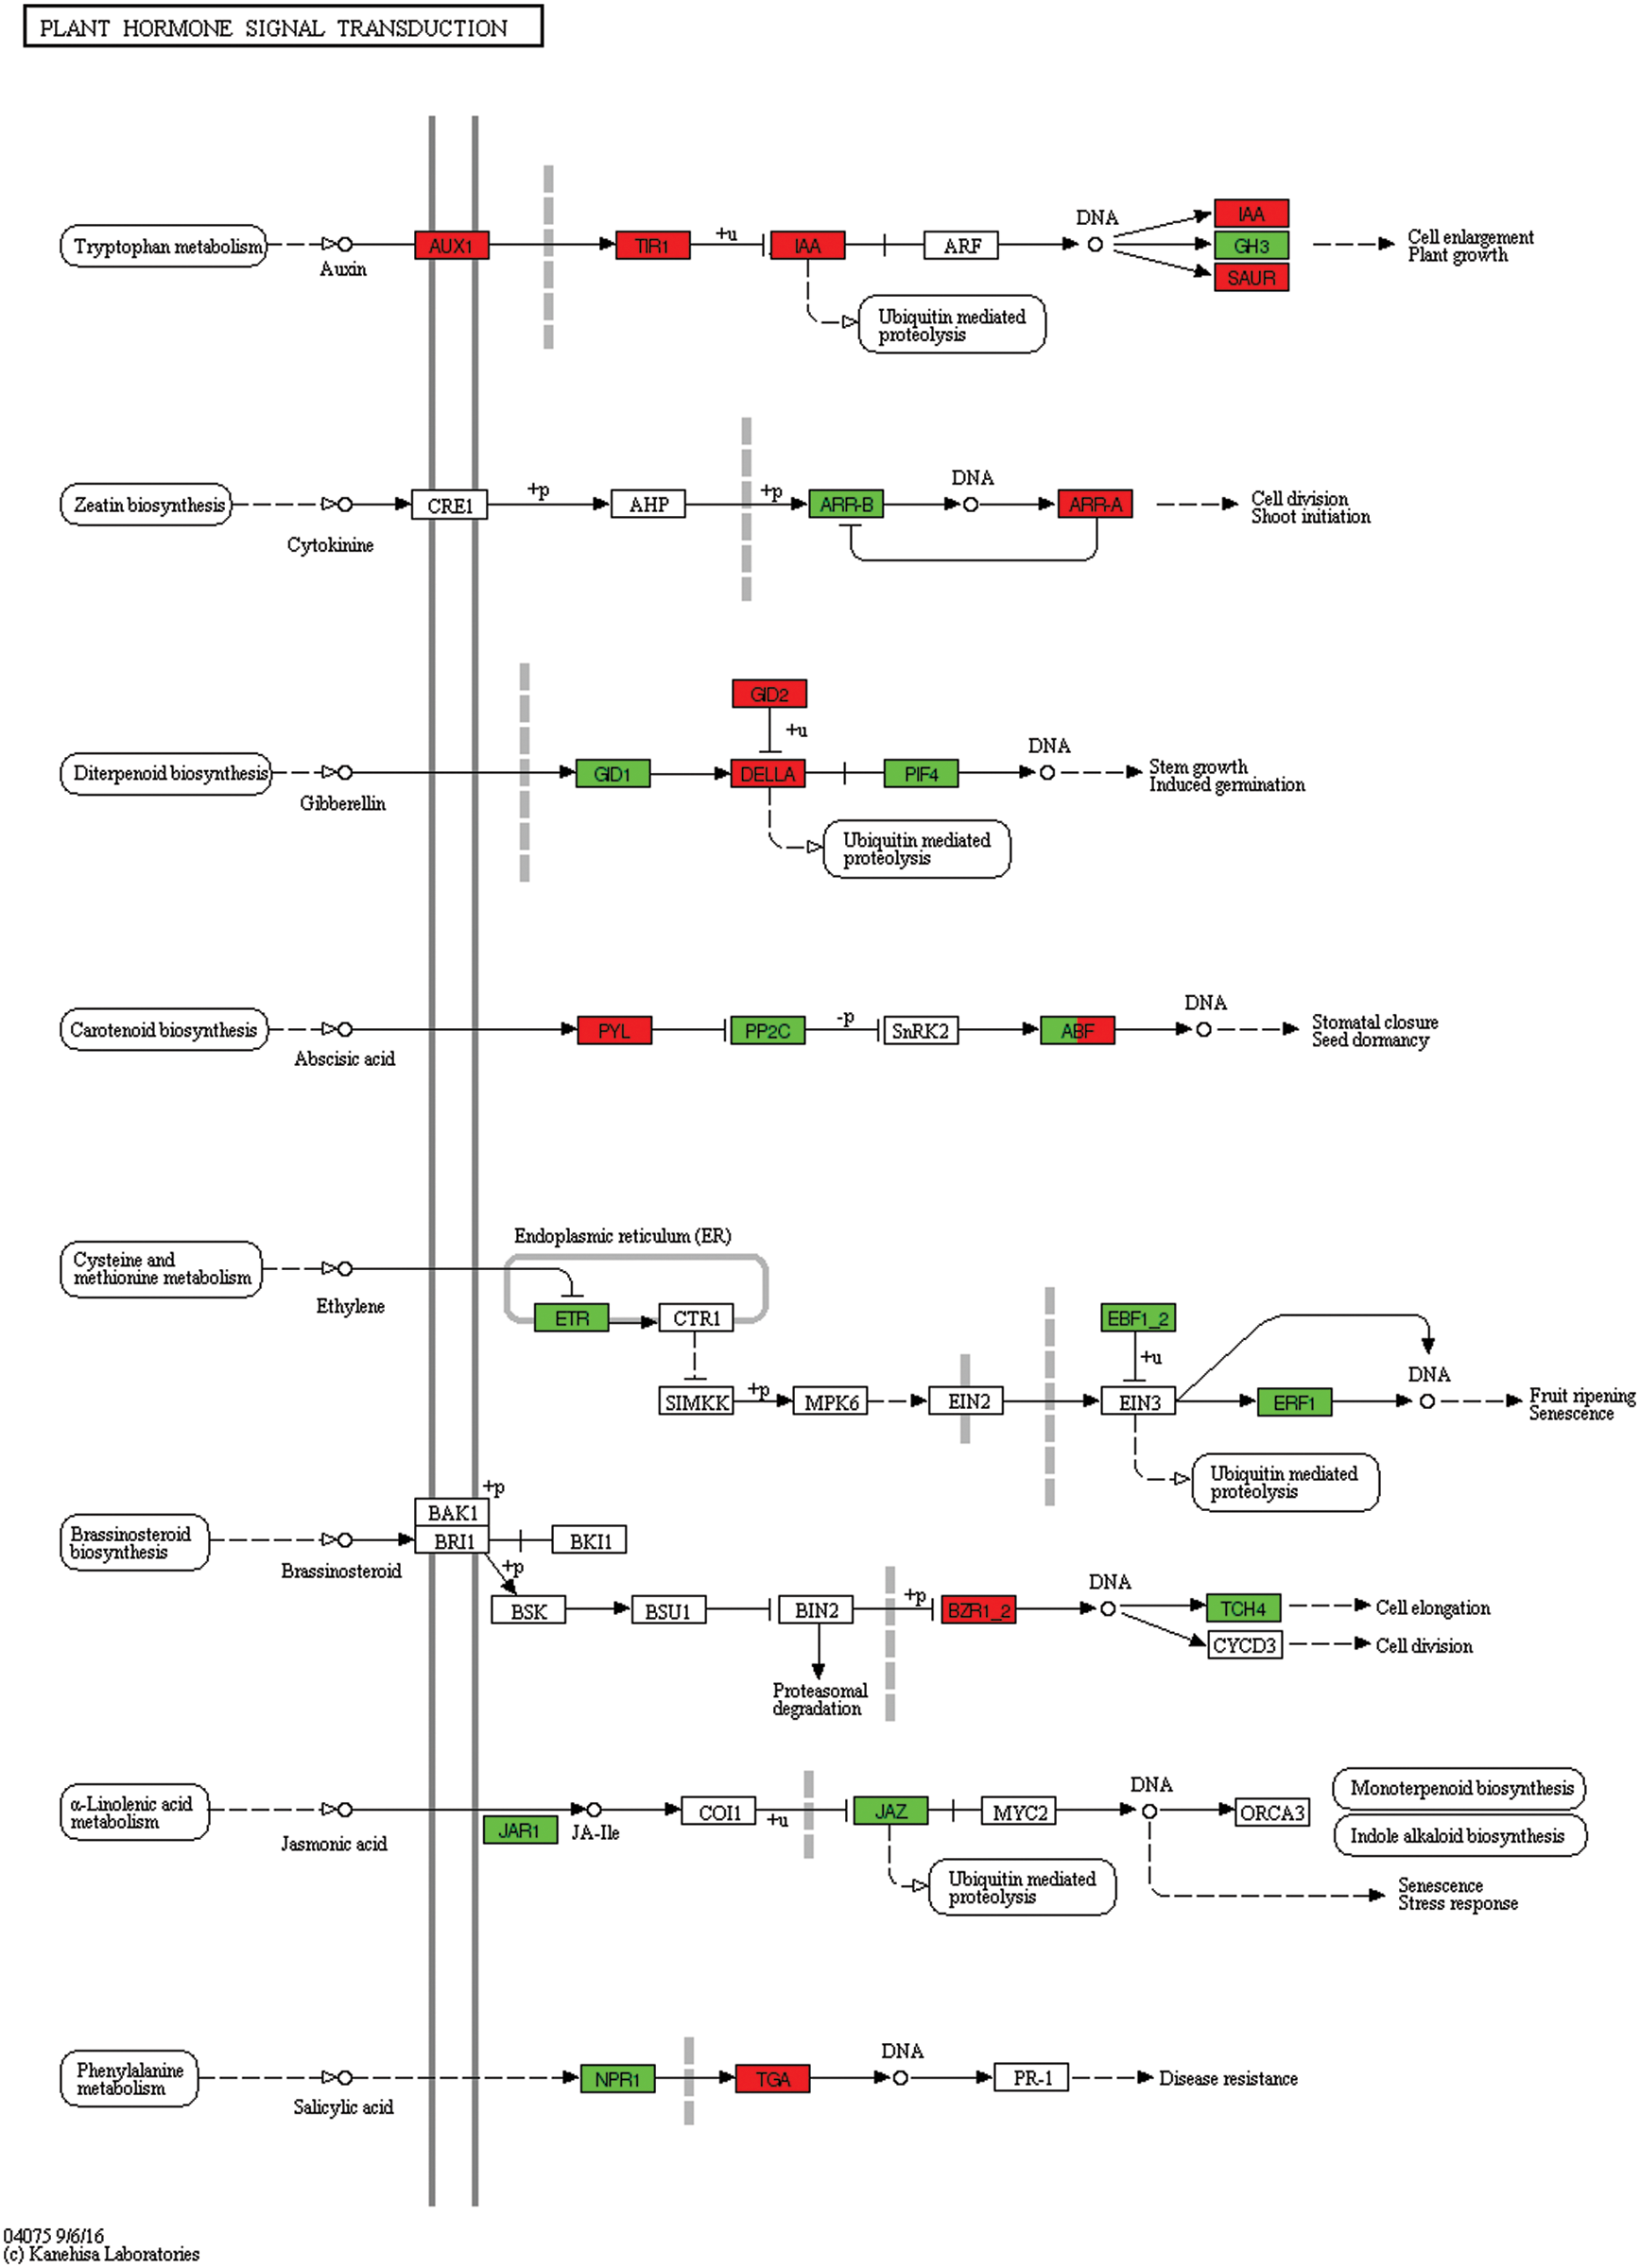
Figure 13: Unigenes predicted to be involved in the plant hormone signal transduction pathway (0 h/12 h)
Under 24 h of flooding stress, DEGs were significantly reduced. However, the pathway mediated by auxin and gibberellin had many different genes (Fig. 14, Table S3).
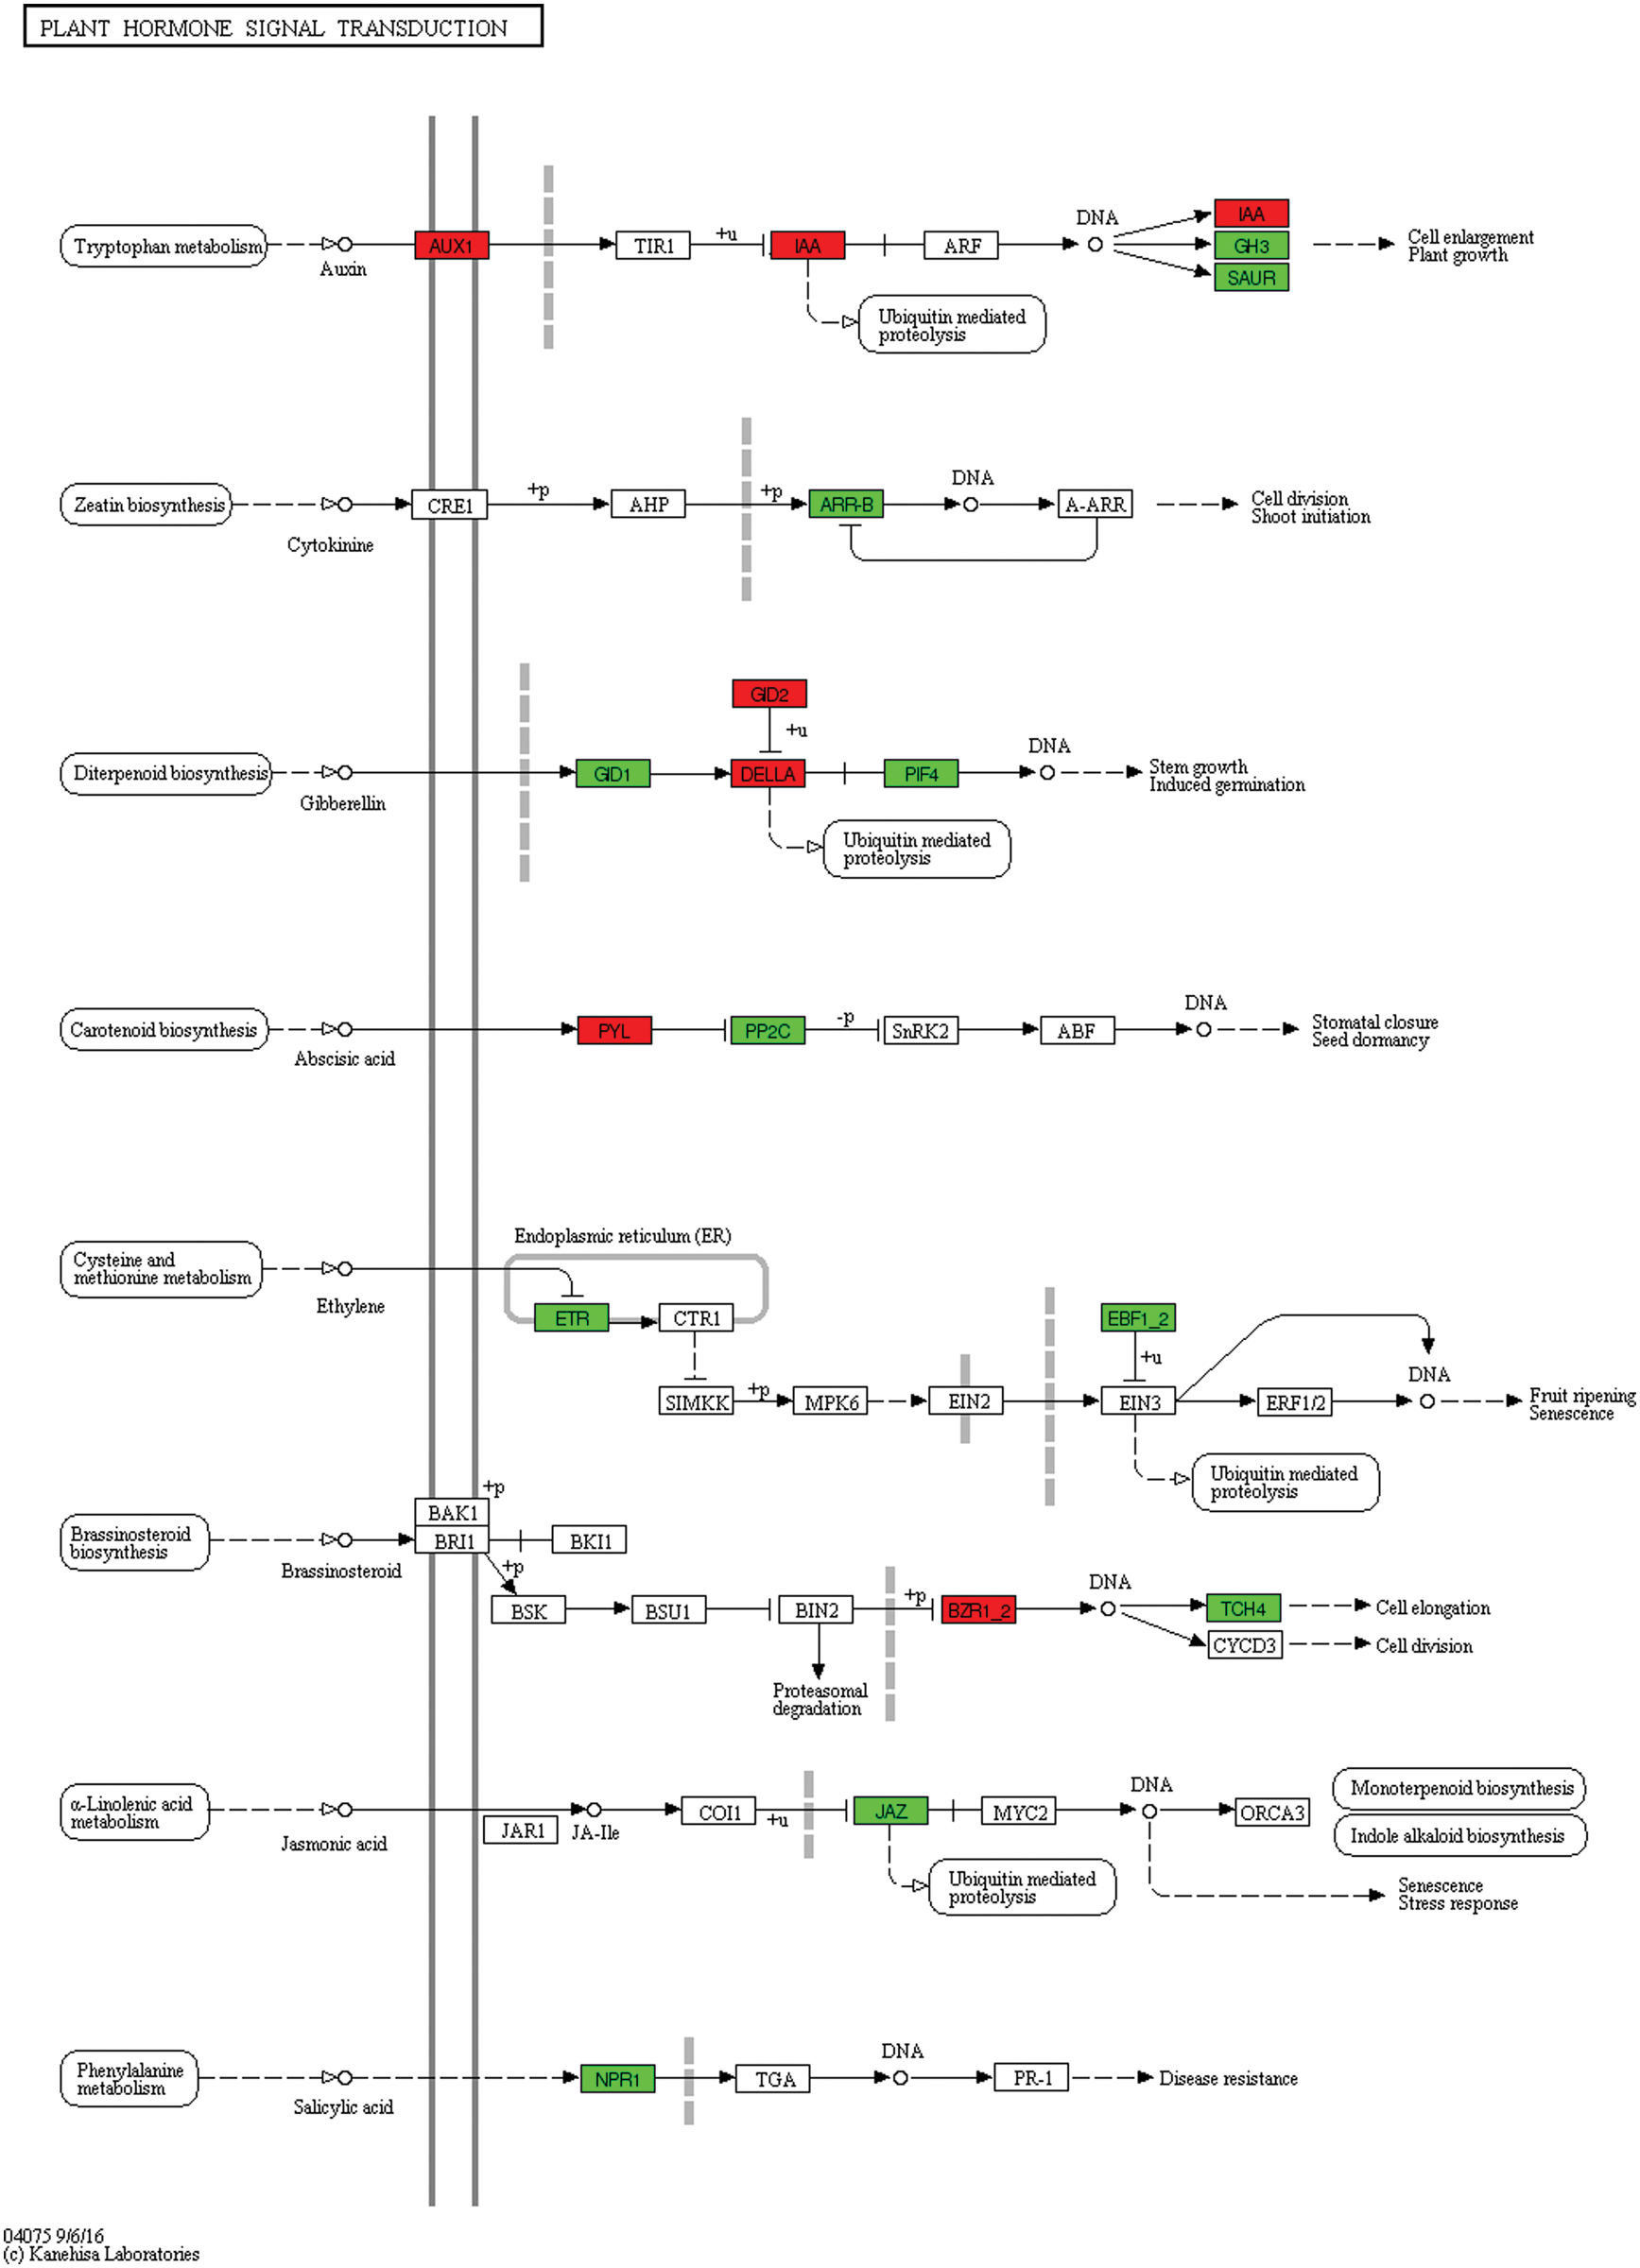
Figure 14: Unigenes predicted to be involved in the plant hormone signal transduction pathway (0 h/24 h)
3.8 Glycolysis-Fermentation Pathway is Involved in the Stress of Plants on Flooding Stress
When plants are exposed to flood water, it leads directly to hypoxia, which causes rapid changes in gene transcription, protein synthesis and degradation, and cellular metabolism [35]. Under hypoxic conditions, glycolysis is mainly through the fermentation pathway, which is necessary for cell survival to generate energy and recover carbon for other pathways [36]. Alcohol dehydrogenase (ADH) accelerates ethanol fermentation and allows glycolysis to provide ATP to plants during flooding, thereby improving the adaptation of the plant to stress [37].
There were 22, 68, 68, and 20 different genes in the glycolytic fermentation pathway after 2 h, 4 h, 12 h and 24 h waterlogged I. pseudacorus roots, respectively. Most of these genes were down regulated (Table S4).
The process of glycolysis and ethanol fermentation in I. pseudacorus roots under waterlogging stress is shown as follows: Sucrose is converted to glucose by sucrose synthetase (SUS) encoded by the down regulated TRINITY_DN167247_c3_g2, TRINITY_DN167247_c3_g1 and TRINITY_DN174661_c1_g3 genes at all four time periods of waterlogging. Glucose is transformed into glucose-1-phosphate through hexokinase (HXK) and phosphoglucomutase (PSL) to form glucose-6-phosphate. The glucose 6-phosphate is then catalyzed into the fructose 6-phosphate by the enzyme glucose isomerase (GLI). Phosphofructokinase (PFK) catalyzes Fructose 6-phosphate to fructose 1,6-diphosphate, and three genes (TRINITY_DN177296_c0_g2, TRINITY_DN161947_c1_g1, TRINITY_DN170536_c6_g4) controlling PFK enzyme synthesis were differentially expressed at each time of waterlogging of the I. pseudacorus roots. Fructose 1, 6-diphosphate is then converted to glyceraldehyde 3-phosphate in the presence of aldolase (ALD TRINITY_DN168027_c0_g3 aldol), which was increasingly down-regulated by 1.89, 2.31, 2.06, and 2.08 times after 2, 4, 12 and 24 h of waterlogging stress, respectively. The enzyme glyceraldehyde 3-phosphate dehydrogenase (GAPDH) then converts glyceraldehyde 3-phosphate into 1,3-diphosphate glycerate (glycerate-1,3P2). Phosphoglycerate kinase (PGK) catalyses 1,3-diphosphoglycerate into 3-phosphoglycerate (glycerate-3P). The expression of gene TRINITY_DN160404_c1_g7 encoding phosphoglycerate kinase was decreasingly down-regulated by 1.49, 1.28, 1.25, 0.75 times after 2, 4, 12 and 24 h of waterlogging stress, respectively. The 2,3-bisphosphoglycerate-dependent phosphoglycerate mutase was then converted to glycerate-2-phosphate (glycerate-2P), followed by enolase into phosphoenolpyruvate. The expression of gene TRINITY_DN158182_c2_g1 encoding enolase (ENO) was upregulated by 2.05, 2.26, 1.38, 0.61 times at the four time points, respectively. Finally, pyruvate is catalyzed by pyruvate kinase forming pyruvate as the end product of glycolysis (Fig. 15, Table S4).
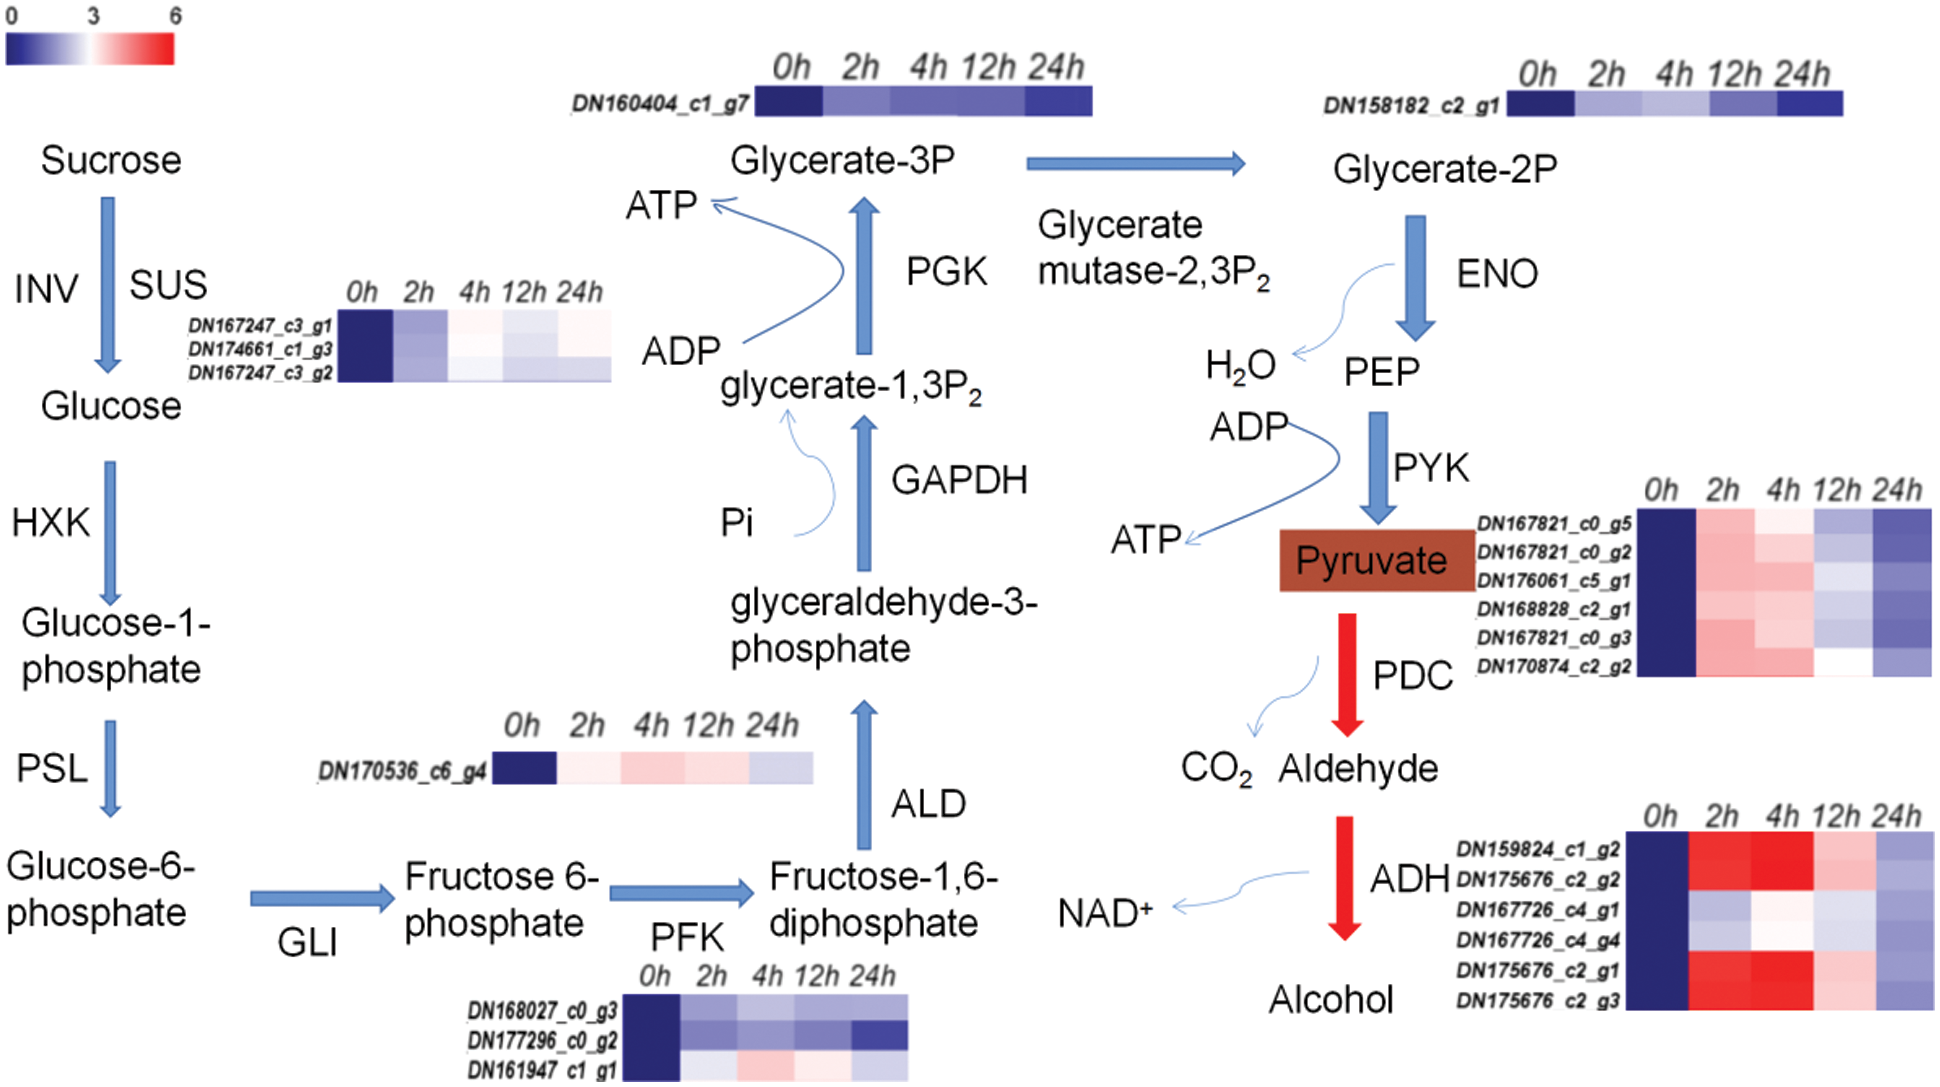
Figure 15: Glycolysis-ethanol fermentation pathway and significantly different gene expression heat map. Note: RPKM values of 0 h for each gene were normalized to 1; expression ratios are based on log2 RPKM values. Colors indicate the normalized signal intensity, as defined in the sidebar
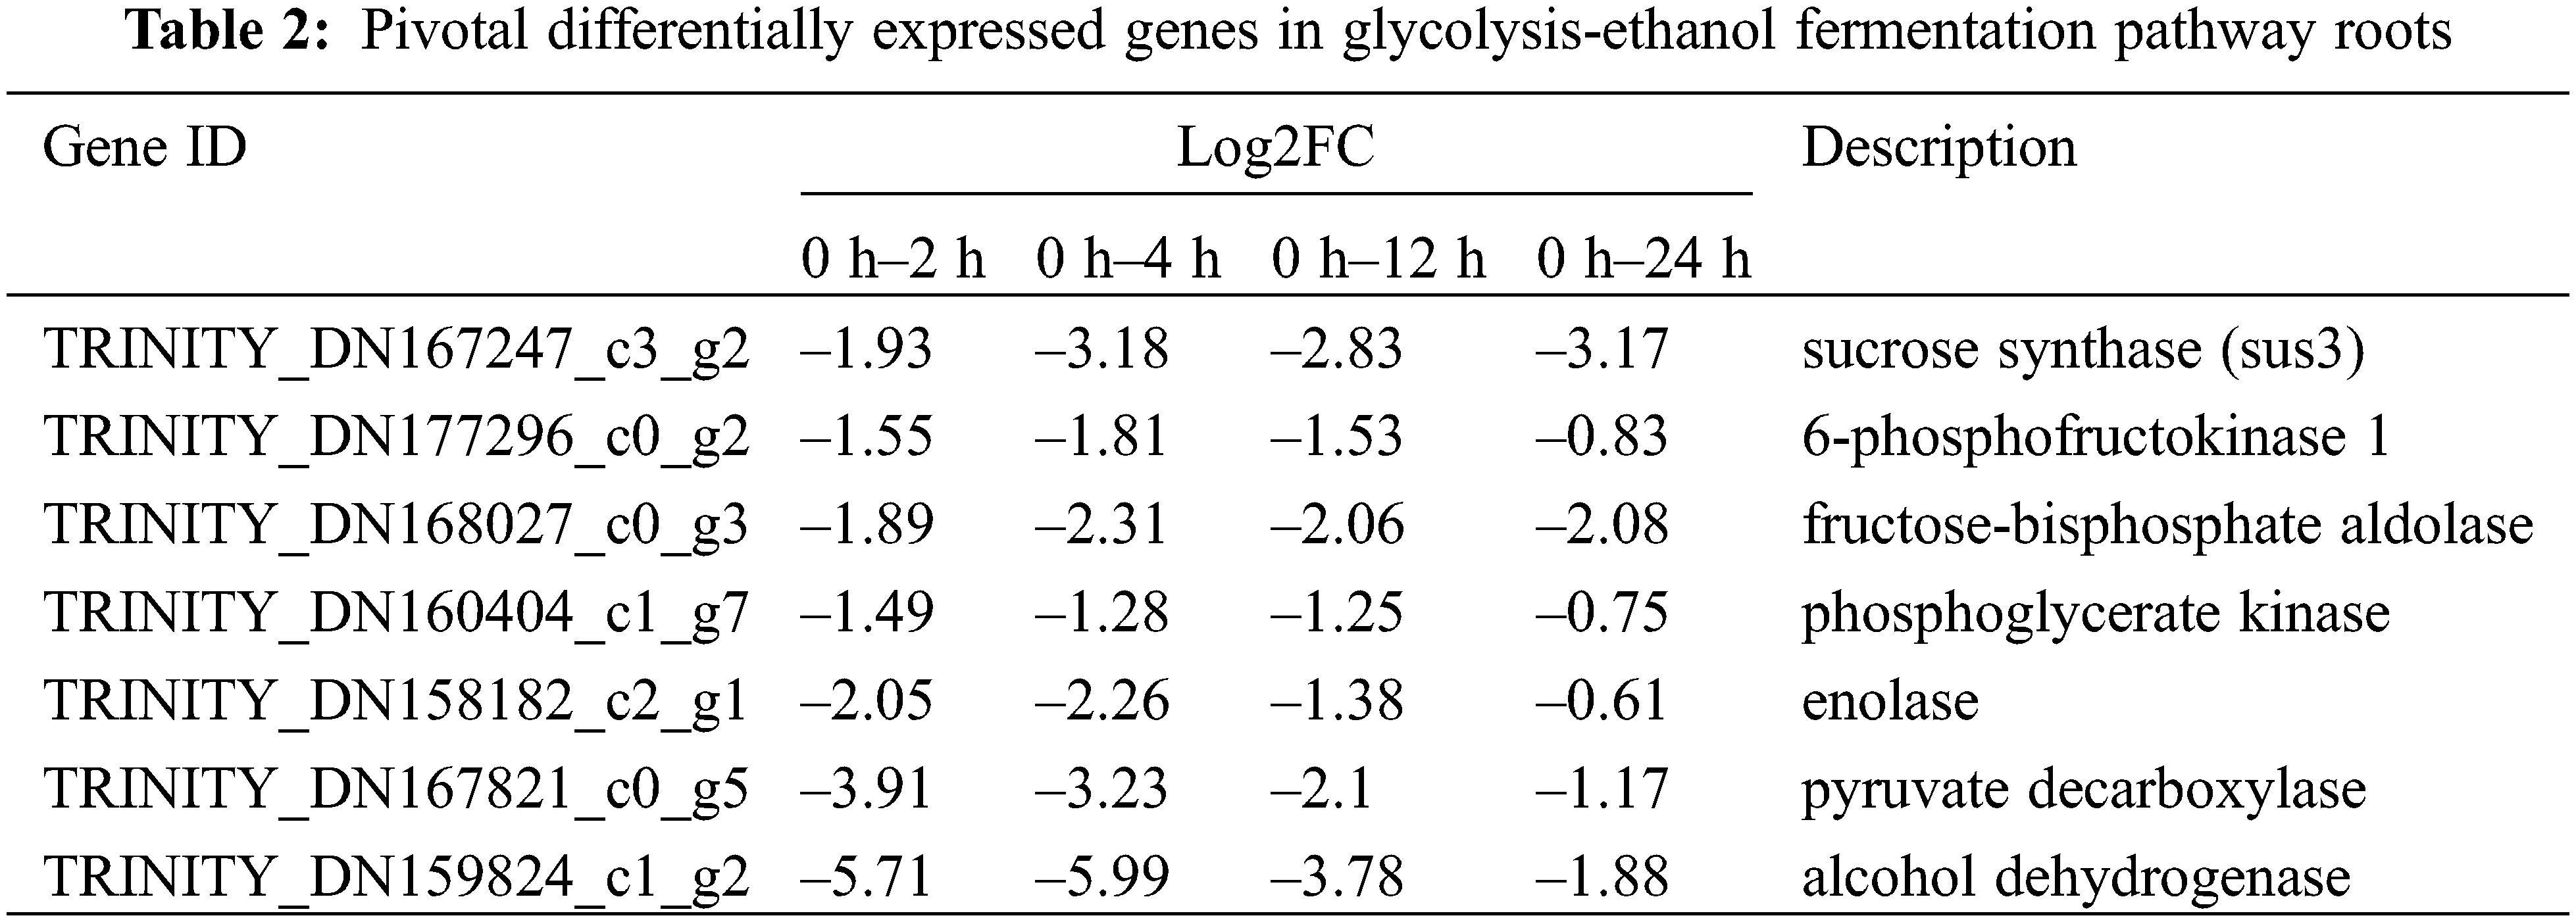
Pyruvate decarboxylase (PDC) also converts pyruvate to aldehyde. There were six down regulated genes encoding PDC at the four-time points, namely TRINITY_DN167821_c0_g5, TRINITY_DN167821_c0_g2, TRINITY_DN176061_c5_g1, TRINITY_DN168828_c2_g1, TRINITY_DN167821_c0_g3 and TRINITY_DN170874_c2_g2. Moreover, it can be seen that the up-regulation ratio of these genes decreased gradually with the passage of stress time. The ADH is used to produce ethanol from aldehyde to complete ethanol fermentation, providing ATP supply to plants under submerged conditions. The ADH gene here also has the same trend as PDC (Fig. 15, Table S4).
3.9 Validation of the DEGs by qRT-PCR Analysis
To validate the reliability of the transcriptome data analysis, nine genes associated mainly with glycolysis and ethanol fermentation process were selected for qRT-PCR analysis over the time-course of the waterlogging treatment from 0 to 24 h. Gene-specific qRT-PCR primers were designed using Oligo7 software (Table S5). In our study, qRT-PCR results showed that the expression levels of the nine unigenes at 5 time points were mostly consistent with the transcriptome data, with only PFK gene in roots exposed to waterlogging for 2 h, and ENO and SUS3 genes in roots flooded for 12 h deviating from the relative expression levels in RNA-Seq (Fig. 16).
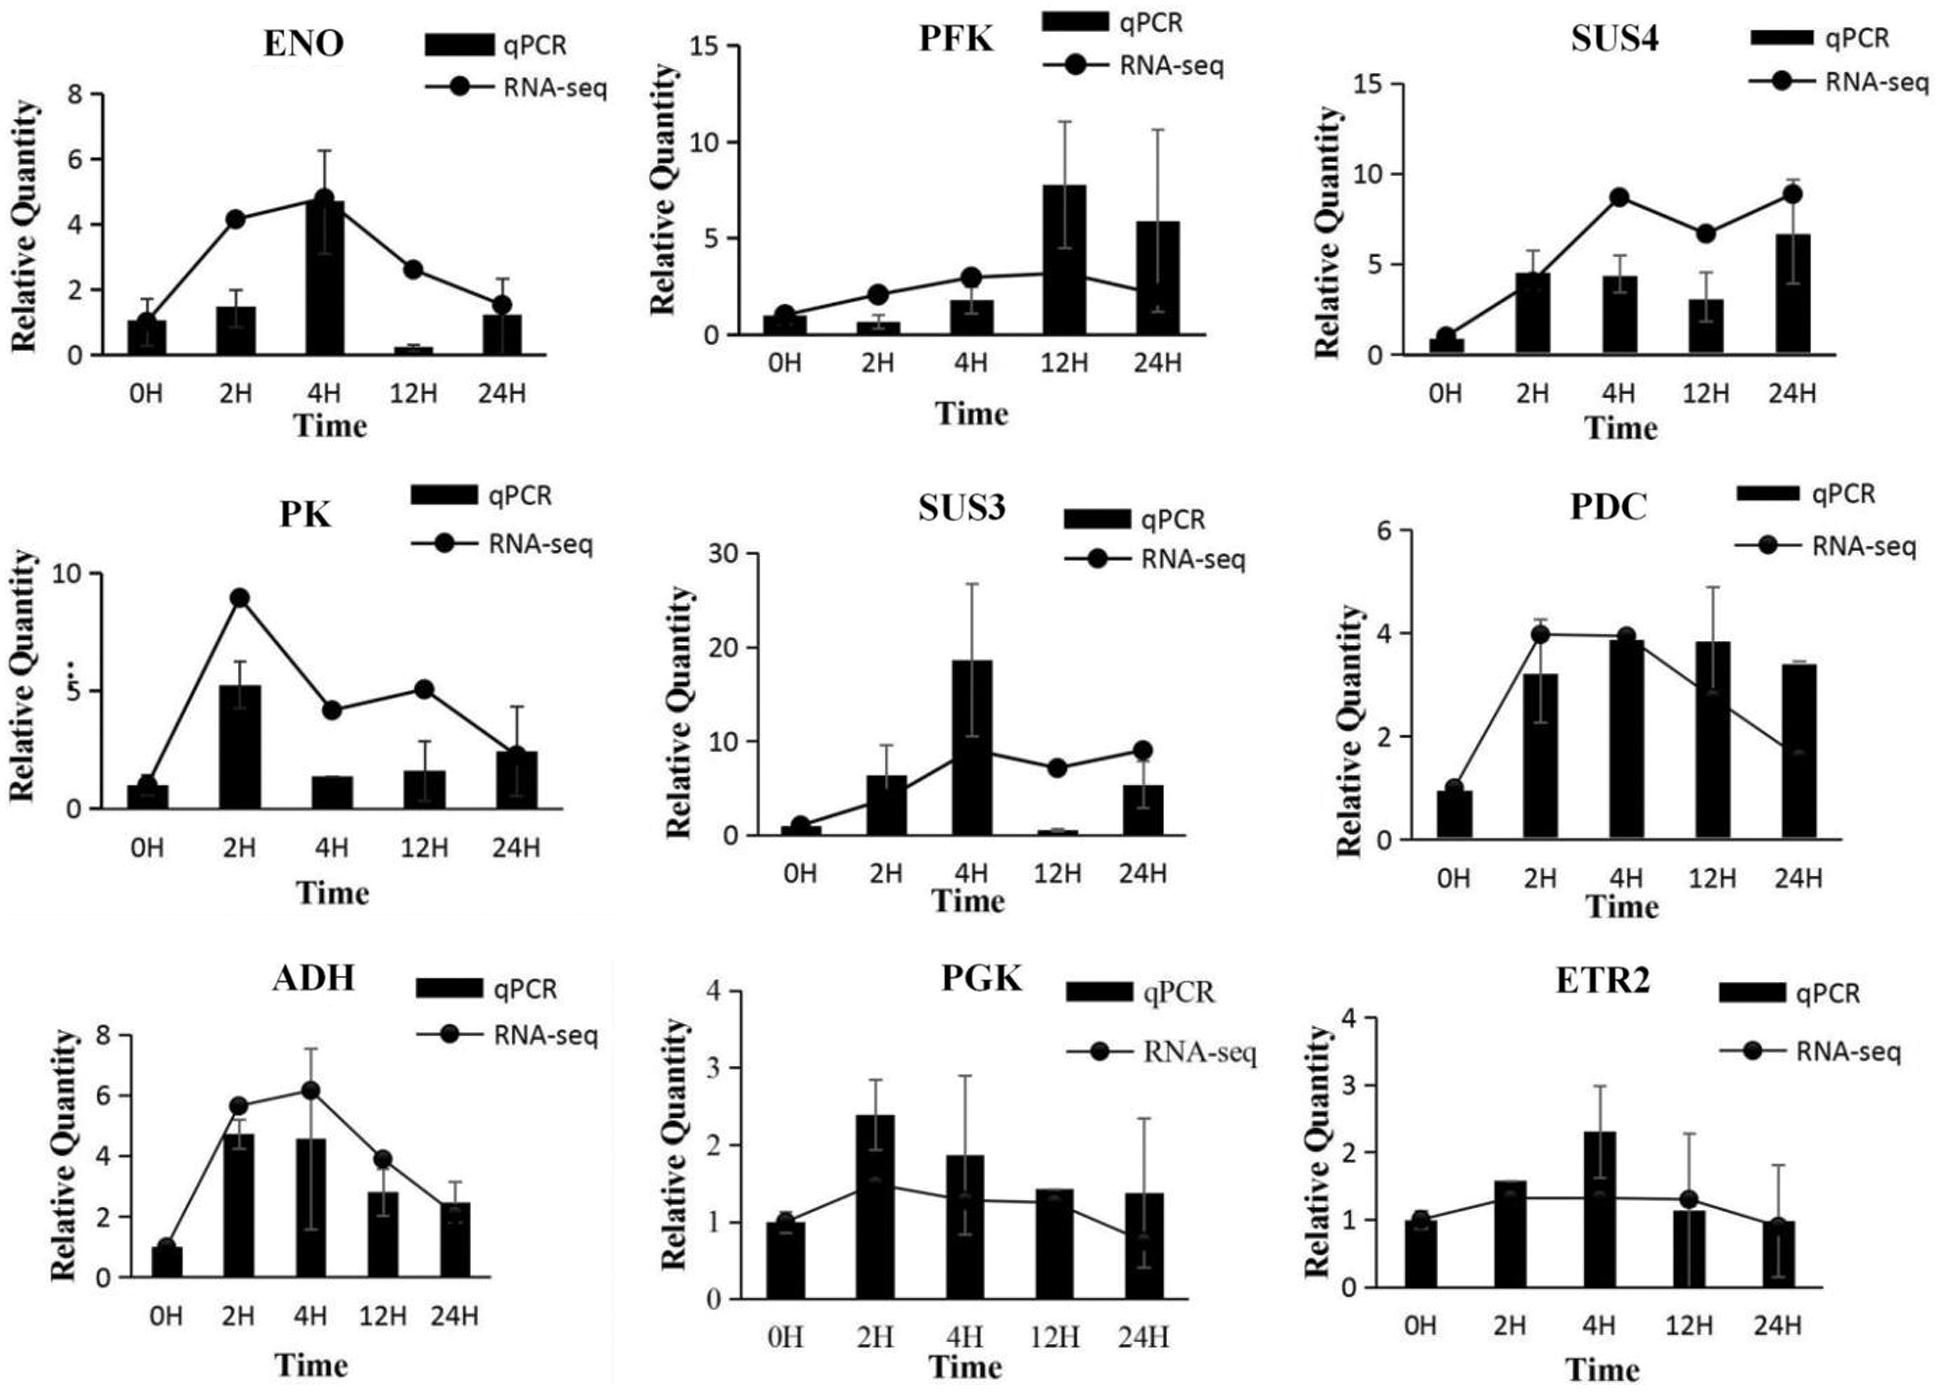
Figure 16: Relative expression of candidate gene expression by RNA-Seq and qRT-PCR
In this study we compared the transcriptome differences between I. pseudacorus roots flooded at different time points. The number of DEGs increased from 3,555 to 10,734 in the roots soaked in water for 2–12 h but decreased to 4,997 in 24 h soaked roots. This indicates that waterlogging increased stress in the plant roots over time, with drastic changes occurring at 12 hours when pressure was at the peak and leveled off after 24 h of flooding. Similar trends of waterlogging stress have been shown in waterlogged Cerasus sachalinensis [11], Dactylis glomerata [38] and Arabidopsis roots [39]. The study showed that the DEGs that were most prominently enriched through the GO terms analysis function consisted of biological regulation in the biological processes, membrane part in the cellular components and transferase activity of the molecular function. In addition, the response to stimuli was enriched with a large number of DEGs at each time point, which was consistent with the change rule of the total number of differentially regulated genes. Both lowland and upland rice were also enriched in these GO entries during hypoxia [40], consistent with our current findings. Though antioxidant activity was significantly enriched under waterlogging stress in Cucumber [41], Dactylis glomerata [38], and in the seeds of Brassica napus [42], our data showed that the enrichment degree was not high, which might be because of the large amount of aerenchyma produced by I. pseudacorus roots. This made them less exposed to hypoxia, thus avoiding the massive production of ROS.
I. pseudacorus is a widely used wetland plant because of its tolerance to flooding. In this study, the flooding did not affect the height of I. pseudacorus plants at either 0, 3, 7, or 14 d after waterlogging. However, the microscopic anatomical observation of the roots showed that the aerenchyma was gradually enlarged with time, and the adventitious root primordium was nearly broken through the cortex at 14 d. These morphological changes are similar to the adaptation reported for Arundo donax and Phragmites australis to aquatic environments [43]. Important traits for survival in flooded environments are those that reduce the resistance for the diffusion of O2 and CO2 from the environment to the plant. Under flooded conditions, sub-ambient O2 concentrations stimulate the production of ethylene, which accumulates in the roots surrounded by water and induces programmed cell death (PCD) in the cortex tissue [23]. The pathway controlling inducible aerenchyma formation in roots is ethylene dependent and is also regulated by ROS [44,45]. Two main types of aerenchyma schizogenous and lysigenous exist in plants [46]. Lysigenous aerenchyma is a gaseous space formed by the death and subsequent dissolution of certain cells in many plants, including maize [23]. Lysigenous aerenchyma is also created by the ethylene-mediated PCD. On the other hand, schizogenous aerenchyma is formed by the gas space between cells caused by highly regulated cell separation and differential expansion, with no cell death. In our experiment, the transcriptome data showed no overexpression of ethylene biosynthetic enzymes (ACO), which laterally proved that the aerenchyma in the roots of I. pseudacorus was not lysigenous.
The phenomenon of adventitious roots inserting into the soil, along the surface, or into the floodwater is a common feature of water-tolerant plants [47]. This characteristic has been reported in Cleistocalyx operculatus [4], rumex [48], and barley [49]. In this study, I. pseudacorus seedlings also developed adventitious roots under water flooding. The adventitious root can quickly replace the primary root asphyxiated due to hypoxia.
Plant hormones play a key role in plant resistance to stress, and aerenchyma expansion and adventitious root formation are closely related to hormonal signaling. Transcriptome analysis showed that hormone signaling was the most significantly enriched pathway with the most significant number of up-regulated genes at each flooding time point, although the schizogenous aerenchyma in I. pseudacorus was not directly stimulated by ethylene. This suggests that aerenchyma expansion is regulated by other hormonal signals. Under aerobic conditions, constitutive and inductive aerenchyma are structurally formed in the root system in ventilated tissues and promoted under anoxic conditions. In rice roots, constitutive aerenchyma is formed in the absence of hypoxia stress, while inductive aerenchyma is formed under hypoxia [50] through ethylene signaling [51]. The effects of flooding in I. pseudacorus are different from rice because there was no obvious ethylene transduction in the process of aerenchyma and adventitious root formation. We, therefore, suggest that the morphological adaptation of I. pseudacorus roots under waterlogging stress is regulated by AUX/IAA and ARF-dependent auxin signals [52]. In Arabidopsis thaliana, ERFVII transcription factors promoted the establishment of an AR system under negative control by ethylene [53,54]. These results are similar to our transcriptional data.
Under hypoxic conditions, maintaining the energy status in roots is crucial. Hypoxia and anoxia can suppress respiration, causing an energy crisis. Many plants rely on glycolysis and fermentation to provide essential ATP [55]. I. pseudacorus rely on the fermentation pathway to regenerate nicotinamide adenine dinucleotide (NAD+) to maintain the glycolytic pathway [56]. Plants possess two independent routes for the catabolism of sucrose, the bidirectional UDP-dependent sucrose synthase (SUS) and the unidirectional invertase (INV) pathways. Since the former consumes less ATP than the latter, the SUS route is positively regulated under O2 deprivation through opposing increases in SUS and the repression of INV gene expression and enzymatic activity [57–60]. In our transcriptional data, the SUS gene was overexpressed, which is consistent with those observed in cucumber [21,61], maize [62] and kiwifruit [25] under waterlogging stress. After the conversion of stored starch to glucose, the plant has an adequate source of carbon to produce energy in the absence of O2 continuously.
In our study, PFK, ALD, PGK, ENO, and other genes were up-regulated to varying degrees during glycolysis. In addition, glycolysis showed a unimodal change in time, reaching a peak at 4 and 12 h. This is similar to genes differentially expressed during glycolysis in maize [23]. The end product of glycolysis, pyruvate, is fermented into lactate and ethanol through catalyzation of pyruvate into lactate through lactate dehydrogenase (LDH), followed by the conversion into ethanol by PDC and ADH to alleviate the plant’s energy shortage [63].
Although most plant anaerobic respiration is mainly alcoholic fermentation, in studies using Dendranthema spp. [64], A. thaliana [65] and cucumber [66], LDH was up-regulated in addition to ADH. Other studies have shown that the lactic acid fermentation pathway is activated first during anoxia [67,68], but this is not common. In our study, the up-regulated expression of LDH was found only at 4 and 12 h of flooding of I. pseudacorus roots. In other words, ethanol fermentation fails to meet the plant’s demand for capacity during the most intense waterlogging response, thus activating the lactic acid metabolic pathway.
The qRT-PCR analysis showed that the expression of genes encoding SUS3, SUS4 PFK1, PGK, ENO, PK, PDC, ADH and ETR2 was significantly increased under flooding stress, indicating that the energy balance system plays a pivotal role in the flood resistance of I. pseudacorus.
We compared transcriptome differences among roots of I. pseudacorus that were waterlogged for varying durations and showed the different amounts of genes differentially expressed at different time points. The study indicates that the submerging tolerance of I. pseudacorus can be divided into three stages; the initial stimulus stage of 0–4 h, peak response stage (4–12 h), and the stable adaptation stage of 12–24 h. Aerenchyma and adventitious roots are formed mainly through IAA and other accompanying hormonal signals. Energy production was the primary coping mechanism of I. pseudacorus when aerenchyma was not sufficiently enlarged under water flooding, while ethanol fermentation was the main part of the whole response process but is accompanied by a small amount of lactic acid fermentation at the peak of the response. Through microscopy, we revealed that I. pseudacorus tolerates waterlogging by forming aerenchyma and adventitious roots. These results have laid a foundation for further study on the mechanism of submerging tolerance of I. pseudacorus and other aquatic plants.
Funding Statement: The research was funded by a project supported by the Ph.D. Program of Sichuan Agricultural University (Grant No. 63670010).
Conflicts of Interest: The authors declare that they have no conflicts of interest to report regarding the present study.
1. Armstrong, A. C. (1978). The effect of drainage treatments on cereal yields: Results from experiments on clay lands. Journal of Agricultural Science, 91(1), 229–235. DOI 10.1017/S002185960005680X. [Google Scholar] [CrossRef]
2. Drew, M. C. (1997). Oxygen deficiency and root metabolism: Injury and acclimation under hypoxia and anoxia. Annual Review of Plant Physiology and Plant Molecular Biology, 48(1), 223–250. DOI 10.1146/annurev.arplant.48.1.223. [Google Scholar] [CrossRef]
3. Subbaiah, C. C. (2003). Molecular and cellular adaptations of maize to flooding stress. Annals of Botany, 91(2), 119–127. DOI 10.1093/aob/mcf210. [Google Scholar] [CrossRef]
4. Li, D., Cisse, E. M., Guo, L., Zhang, J., Miao, L. et al. (2021). Comparable and adaptable strategies to waterlogging stress regulated by adventitious roots between two contrasting species. Tree Physiology, 118, 675. DOI 10.1093/treephys/tpab165. [Google Scholar] [CrossRef]
5. Yin, D., Chen, S., Chen, F., Fang, W., Guan, Z. (2009). Morphological and physiological responses of two chrysanthemum cultivars differing in their tolerance to waterlogging. Environmental and Experimental Botany, 67(1), 87–93. DOI 10.1016/j.envexpbot.2009.06.006. [Google Scholar] [CrossRef]
6. Novo, F. G., Crawford, R. M. M. (1973). Soil aeration, nitrate reduction and flooding tolerance in higher plants. New Phytologist, 72(5), 1031–1039. DOI 10.1111/j.1469-8137.1973.tb02079.x. [Google Scholar] [CrossRef]
7. Colmer, T. D. (2003). Long-distance transport of gases in plants: A perspective on internal aeration and radial oxygen loss from roots. Plant, Cell and Environment, 26(1), 17–36. DOI 10.1046/j.1365-3040.2003.00846.x. [Google Scholar] [CrossRef]
8. Rajhi, I., Yamauchi, T., Takahashi, H., Nishiuchi, S., Shiono, K. et al. (2011). Identification of genes expressed in maize root cortical cells during lysigenous aerenchyma formation using laser microdissection and microarray analyses. New Phytologist, 190(2), 351–368. DOI 10.1111/j.1469-8137.2010.03535.x. [Google Scholar] [CrossRef]
9. Salah, A., Nwafor, C. C., Han, Y., Liu, L., Rashid, M. et al. (2022). Spermidine and brassinosteroid regulate root anatomical structure, photosynthetic traits and antioxidant defense systems to alleviate waterlogging stress in maize seedlings. South African Journal of Botany, 144, 389–402. DOI 10.1016/j.sajb.2021.08.012. [Google Scholar] [CrossRef]
10. He, C. J., Morgan, P. W., Drew, M. C. (1996). Transduction of an ethylene signal is required for cell death and lysis in the root cortex of maize during aerenchyma formation induced by hypoxia. Plant Physiology, 112(2), 463–472. DOI 10.1104/pp.112.2.463. [Google Scholar] [CrossRef]
11. Zhang, P., Lyu, D., Jia, L., He, J., Qin, S. (2017). Physiological and de novo transcriptome analysis of the fermentation mechanism of Cerasus sachalinensis roots in response to short-term waterlogging. BMC Genomics, 18(1), 649. DOI 10.1186/s12864-017-4055-1. [Google Scholar] [CrossRef]
12. Pierik, R., Aken, J. M., Voesenek, L. A. (2009). Is elongation-induced leaf emergence beneficial for submerged Rumex species? Annals of Botany, 103(2), 353–357. DOI 10.1093/aob/mcn143. [Google Scholar] [CrossRef]
13. Voesenek, L. A. C. J., Rijnders, J. H. G. M., Peeters, A. J. M., Steeg, H. M. V. D., Kroon, R. D. (2004). Special feature--phytohormonal ecology-plant hormones regulate fast shoot elongation under water: From genes to communities. Ecology, 85(1), 16–27. DOI 10.1890/02-740. [Google Scholar] [CrossRef]
14. Liu, J., Chen, Y., Wang, W. Q., Liu, J. H., Zhu, C. Q. et al. (2022). Transcription factors AcERF74/75 respond to waterlogging stress and trigger alcoholic fermentation-related genes in kiwifruit. Plant Science, 314, 111115. DOI 10.1016/j.plantsci.2021.111115. [Google Scholar] [CrossRef]
15. Minami, A. M. A., Yano, K. Y. K., Gamuyao, R. G. R., Nagai, K. N. K., Kuroha, T. K. T. et al. (2018). Time-course transcriptomics analysis reveals key responses of submerged deepwater rice to flooding. Plant Physiology, 176(4), 3081–3102. DOI 10.1104/pp.17.00858. [Google Scholar] [CrossRef]
16. Yan, H., Bombarely, A., Xu, B., Frazier, T. P., Wang, C. et al. (2018). siRNAs regulate DNA methylation and interfere with gene and lncRNA expression in the heterozygous polyploid switchgrass. Biotechnology for Biofuels, 11(1), 208. DOI 10.1186/s13068-018-1202-0. [Google Scholar] [CrossRef]
17. Yan, H., Bombarely, A., Xu, B., Wu, B., Frazier, T. P. et al. (2019). Autopolyploidization in switchgrass alters phenotype and flowering time via epigenetic and transcription regulation. Journal of Experimental Botany, 70(20), 5673–5686. DOI 10.1093/jxb/erz325. [Google Scholar] [CrossRef]
18. Zhou, S., Wang, C., Frazier, T. P., Yan, H., Chen, P. et al. (2018). The first Illumina-based de novo transcriptome analysis and molecular marker development in napier grass (Pennisetum purpureum). Molecular Breeding, 38(7), 1. DOI 10.1007/s11032-018-0852-8. [Google Scholar] [CrossRef]
19. Narsai, R., Rocha, M., Geigenberger, P., Whelan, J., van Dongen, J. T. et al. (2011). Comparative analysis between plant species of transcriptional and metabolic responses to hypoxia. New Phytologist, 190(2), 472–487. DOI 10.1111/j.1469-8137.2010.0358.x. [Google Scholar] [CrossRef]
20. Qi, X. H., Xu, X. W., Lin, X. J., Zhang, W. J., Chen, X. H. (2012). Identification of differentially expressed genes in cucumber (Cucumis sativus L.) root under waterlogging stress by digital gene expression profile. Genomics, 99(3), 160–168. DOI 10.1016/j.ygeno.2011.12.008. [Google Scholar] [CrossRef]
21. Xu, X., Chen, M., Ji, J., Xu, Q., Qi, X. et al. (2017). Comparative RNA-seq based transcriptome profiling of waterlogging response in cucumber hypocotyls reveals novel insights into the de novo adventitious root primordia initiation. BMC Plant Biology, 17(1), 1–13. DOI 10.1186/s12870-017-1081-8. [Google Scholar] [CrossRef]
22. Campbell, M. T., Proctor, C. A., Dou, Y., Schmitz, A. J., Phansak, P. et al. (2015). Genetic and molecular characterization of submergence response identifies Subtol6 as a major submergence tolerance locus in maize. PLoS One, 10(3), e0120385. DOI 10.1371/journal.pone.0120385. [Google Scholar] [CrossRef]
23. Arora, K., Panda, K. K., Mittal, S., Mallikarjuna, M. G., Rao, A. R. et al. (2017). RNAseq revealed the important gene pathways controlling adaptive mechanisms under waterlogged stress in maize. Scientific Reports, 7(1), 10950. DOI 10.1038/s41598-017-10561-1. [Google Scholar] [CrossRef]
24. Lee, Y., Kim, K., Jang, Y., Choi, I. (2014). Nitric oxide production and scavenging in waterlogged roots of rape seedlings. Genes and Genomics, 36(6), 691–699. DOI 10.1007/s13258-014-0202-0. [Google Scholar] [CrossRef]
25. Zhang, J., Huang, S., Mo, Z., Xuan, J., Jia, X. et al. (2015). De novo transcriptome sequencing and comparative analysis of differentially expressed genes in kiwifruit under waterlogging stress. Molecular Breeding, 35(11), 208. DOI 10.1007/s11032-015-0408-0. [Google Scholar] [CrossRef]
26. Ruperti, B., Botton, A., Populin, F., Eccher, G., Brilli, M. et al. (2019). Flooding responses on grapevine: A physiological, transcriptional, and metabolic perspective. Frontiers in Plant Science, 10, 339. DOI 10.3389/fpls.2019.00339. [Google Scholar] [CrossRef]
27. Arismendi, M. J., Almada, R., Pimentel, P., Bastias, A., Salvatierra, A. et al. (2015). Transcriptome sequencing of Prunus sp. rootstocks roots to identify candidate genes involved in the response to root hypoxia. Tree Genetics & Genomes, 11(1), 1–16. DOI 10.1007/s11295-015-0838-1. [Google Scholar] [CrossRef]
28. Zhou, Y. Q., Huang, S. Z., Yu, S. L., Gu, J. G., Zhao, J. Z. et al. (2010). The physiological response and sub-cellular localization of lead and cadmium in Iris pseudacorus L. Ecotoxicology, 19(1), 69–76. DOI 10.1007/s10646-009-0389-z. [Google Scholar] [CrossRef]
29. Han, Y. L., Yuan, H. Y., Huang, S. Z., Guo, Z., Xia, B. et al. (2007). Cadmium tolerance and accumulation by two species of Iris. Ecotoxicology, 16(8), 557–563. DOI 10.1007/s10646-007-0162-0. [Google Scholar] [CrossRef]
30. Manceau, A., Nagy, K. L., Marcus, M. A., Lanson, M., Geoffroy, N. et al. (2008). Formation of metallic copper nanoparticles at the soil-root interface. Environmental Science & Technology, 42(5), 1766–1772. DOI 10.1021/es072017o. [Google Scholar] [CrossRef]
31. Narsai, R., Rocha, M., Geigenberger, P., Whelan, J., van Dongen, J. T. (2011). Full-length transcriptome assembly from RNA-Seq data without a reference genome. Nature Biotechnology, 29(7), 644–652. DOI 10.1038/nbt.1883. [Google Scholar] [CrossRef]
32. Langmead, B., Trapnell, C., Pop, M., Salzberg, S. L. (2009). Ultrafast and memory-efficient alignment of short DNA sequences to the human genome. Genome Biology, 10(3), 25–34. DOI 10.1186/gb-2009-10-3-r25. [Google Scholar] [CrossRef]
33. Mortazavi, A., Williams, B. A., McCue, K., Schaeffer, L., Wold, B. (2008). Mapping and quantifying mammalian transcriptomes by RNA-Seq. Nature Methods, 5(7), 621–628. DOI 10.1038/nmeth.1226. [Google Scholar] [CrossRef]
34. Livak, K. J., Schmittgen, T. D. (2001). Analysis of relative gene expression data using real-time quantitative PCR and the 2(-Delta Delta C(T)) Method. Methods, 25(4), 402–408. DOI 10.1006/meth.2001. [Google Scholar] [CrossRef]
35. Christianson, J. A., Llewellyn, D. J., Dennis, E. S., Wilson, I. W. (2010). Global gene expression responses to waterlogging in roots and leaves of cotton (Gossypium hirsutum L.). Plant & Cell Physiology, 1(1), 21–37. DOI 10.1093/pcp/pcp163. [Google Scholar] [CrossRef]
36. Locato, V., Cimini, S., de Gara, L. (2018). ROS and redox balance as multifaceted players of cross-tolerance: Epigenetic and retrograde control of gene expression. Journal of Experimental Botany, 69(14), 3373–3391. DOI 10.1093/jxb/ery168. [Google Scholar] [CrossRef]
37. Ismond, K. P., Dolferus, R., de Pauw, M., Dennis, E. S., Good, A. G. (2003). Enhanced low oxygen survival in Arabidopsis through increased metabolic flux in the fermentative pathway. Plant Physiology, 132(3), 1292–1302. DOI 10.2307/4281209. [Google Scholar] [CrossRef]
38. Qiao, D., Zhang, Y., Xiong, X., Li, M., Cai, K. et al. (2020). Transcriptome analysis on responses of orchardgrass (Dactylis glomerata L.) leaves to a short term flooding. Hereditas, 157(1), 20–35. DOI 10.1186/s41065-020-00134-0. [Google Scholar] [CrossRef]
39. Liu, F. L., Vantoai, T. Moy, L., P., Bock, G., Linford, L. D. (2005). Global transcription profiling reveals comprehensive insights into hypoxic response in Arabidopsis. Plant Physiology, 137(3), 1115–1129. DOI 10.1104/pp.104.055475. [Google Scholar] [CrossRef]
40. Liu, J., Hasanuzzaman, M., Sun, H., Zhang, J., Peng, T. et al. (2020). Comparative morphological and transcriptomic responses of lowland and upland rice to root-zone hypoxia. Environmental & Experimental Botany, 169, 103916. DOI 10.1016/j.envexpbot.2019.103916. [Google Scholar] [CrossRef]
41. Fan, H. F., Du, C. X., Ding, L., Xu, Y. L. (2014). Exogenous nitric oxide promotes waterlogging tolerance as related to the activities of antioxidant enzymes in cucumber seedlings. Russian Journal of Plant Physiology, 61(3), 366–373. DOI 10.1134/s1021443714030042. [Google Scholar] [CrossRef]
42. Li, J. J., Iqbal, S., Zhang, Y. T., Chen, Y. H., Tan, Z. D. et al. (2021). Transcriptome analysis reveals genes of flooding-tolerant and flooding-sensitive rape seeds differentially respond to flooding at the germination stage. Plants, 10(4), 693. DOI 10.3390/plants10040693. [Google Scholar] [CrossRef]
43. Tshapa, L., Naidoo, K., Naidoo, G. (2021). Morphological and physiological responses of Arundo donax and Phragmites australis to waterlogging stress. Flora, 279, 151816. DOI 10.1016/j.flora.2021.151816. [Google Scholar] [CrossRef]
44. Yamauchi, T., Yoshioka, M., Fukazawa, A., Mori, H., Nishizawa, N. K. et al. (2017). An NADPH oxidase RBOH functions in rice roots during lysigenous aerenchyma formation under oxygen-deficient conditions. Plant Cell, 29(4), 775–790. DOI 10.1105/tpc.16.00976. [Google Scholar] [CrossRef]
45. Yamauchi, T., Colmer, T., Pedersen, O., Nakazono, M. (2018). Regulation of root traits for internal aeration and tolerance to soil waterlogging-flooding stress. Plant Physiology, 176(2), 1118–1130. DOI 10.1104/pp.17.01157. [Google Scholar] [CrossRef]
46. Seago, J. J., Marsh, L. C., Stevens, K. J., Soukup, A., Votrubova, O. et al. (2005). A re-examination of the root cortex in wetland flowering plants with respect to aerenchyma. Annals of Botany, 96(4), 565–579. DOI 10.1093/aob/mci211. [Google Scholar] [CrossRef]
47. Ole, P., Margret, S., Timothy, D. C., Mikio, N. (2021). Regulation of root adaptive anatomical and morphological traits during low soil oxygen. New Phytologist, 229(1), 42–49. DOI 10.1111/nph.16375. [Google Scholar] [CrossRef]
48. Blom, C. W. P. M., Voesenek, L. A. C. J., Bang, M., Engelaar, W. M. H. G., Rijnders, J. H. G. M. et al. (1994). Physiological ecology of riverside species: Adaptive responses of plants to submergence. Annals of Botany, 74(3), 253–263. DOI 10.1006/anbo.1994.1116. [Google Scholar] [CrossRef]
49. Michele Stanca, A., Romagosa, I., Takeda, K., Lundborg, T., Terzi, V. (2003). Chapter 9–Diversity in abiotic stress tolerances. Developments in Plant Genetics and Breeding, 7(suppl. 2), 179–199. DOI 10.1016/S0168-7972(03)80011-7. [Google Scholar] [CrossRef]
50. Yamauchi, T., Tanaka, A., Inahashi, H., Nishizawa, N. K., Tsutsumi, N. et al. (2019). Fine control of aerenchyma and lateral root development through AUX/IAA- and ARF-dependent auxin signaling. Proceedings of the National Academy of Sciences of the United States of America, 116(41), 20770–20775. DOI 10.1073/pnas.1907181116. [Google Scholar] [CrossRef]
51. Armstrong, S. H. F. W., Armstrong, W. (2010). Evidence for the involvement of ethene in aerenchyma formation in adventitious roots of rice (Oryza sativa L.). New Phytologist, 118(1), 49–62. DOI 10.1111/j.1469-8137.1991.tb00564.x. [Google Scholar] [CrossRef]
52. Xie, R., Zheng, L., Jiao, Y., Huang, X. (2021). Understanding physiological and molecular mechanisms of citrus rootstock seedlings in response to root zone hypoxia by RNA-Seq. Environmental and Experimental Botany, 192, 104647. DOI 10.1016/j.envexpbot.2021.104647. [Google Scholar] [CrossRef]
53. Sauter, M., Eysholdt-Derzso, E. (2019). Hypoxia and the group VII ethylene response transcription factor HRE2 promote adventitious root elongation in Arabidopsis. Wiley-Blackwell Online Open, 21(S1), 103–108. DOI 10.1111/plb.12873. [Google Scholar] [CrossRef]
54. Kumar, A., Nayak, A. K., Hanjagi, P. S., Kumari, K., Vijayakumar, S. et al. (2021). Submergence stress in rice: Adaptive mechanisms, coping strategies and future research needs. Environmental and Experimental Botany, 186(5), 104448. DOI 10.1016/J.ENVEXPBOT.2021.104448. [Google Scholar] [CrossRef]
55. Crawford, R. M. M., Braendle, R. (1996). Oxygen deprivation stress in a changing environment. Journal of Experimental Botany, 47(2), 145–459. DOI 10.1145/1066677.1066820. [Google Scholar] [CrossRef]
56. Paola, C., Elena, B., Monica, M., Paolo, P., Genga, D. et al. (2012). Annamaria Ectopic expression of a rice transcription factor, mybleu, enhances tolerance of transgenic plants of carrizo citrange to low oxygen stress. Plant Cell Tissue and Organ Culture, 109(2), 327–329. DOI 10.1007/s11240-011-0098-1. [Google Scholar] [CrossRef]
57. Kumutha, D., Sairam, R. K., Ezhilmathi, K., Chinnusamy, V., Meena, R. C. (2008). Effect of waterlogging on carbohydrate metabolism in pigeon pea (Cajanus cajan L.Upregulation of sucrose synthase and alcohol dehydrogenase. Plant Science, 175(5), 706–716. DOI 10.1016/j.plantsci.2008.07.013. [Google Scholar] [CrossRef]
58. Bieniawska, Z., Paul, B. D., Garlick, A. P., Thole, V., Kruger, N. J. et al. (2007). Analysis of the sucrose synthase gene family in Arabidopsis. Plant Journal, 49(5), 810–828. DOI 10.1111/j.1365-313X.2006.03011.x. [Google Scholar] [CrossRef]
59. Bologa, K. L., Fernie, A. R., Leisse, A., Loureiro, M. E., Geigenberger, P. (2003). A bypass of sucrose synthase leads to low internal oxygen and impaired metabolic performance in growing potato tubers. Plant Physiologist, 132(4), 2058–2072. DOI 10.1104/pp.103.022236. [Google Scholar] [CrossRef]
60. Koch, K. (2004). Sucrose metabolism: Regulatory mechanisms and pivotal roles in sugar sensing and plant development. Current Opinion in Plant Biology, 7(3), 235–246. DOI 10.1016/j.pbi.2004.03.014. [Google Scholar] [CrossRef]
61. Wang, H. Y., Sui, X. L., Guo, J. J., Wang, Z. Y., Cheng, J. T. et al. (2014). Antisense suppression of cucumber (Cucumis sativus L.) sucrose synthase 3 (csSUS3) reduces hypoxic stress tolerance. Plant, Cell and Environment, 37(3), 795–810. DOI 10.1111/pce.12200. [Google Scholar] [CrossRef]
62. Kaur, G., Vikal, Y., Kaur, L., Kalia, A., Mittal, A. et al. (2021). Elucidating the morpho-physiological adaptations and molecular responses under long-term waterlogging stress in maize through gene expression analysis. Plant Science, 304, 110823. DOI 10.1016/j.plantsci.2021.110823. [Google Scholar] [CrossRef]
63. Yu, F., Liang, K., Fang, T., Zhao, H. L., Han, X. S. et al. (2019). A group VII ethylene response factor gene, ZmEREB180, coordinates waterlogging tolerance in maize seedlings. Plant Biotechnology Journal, 17(12), 2286–2298. DOI 10.1111/pbi.13140. [Google Scholar] [CrossRef]
64. Kuersteiner, O., Dupuis, I., Kuhlemeier, C. (2003). The Pyruvate decarboxylase1 gene of Arabidopsis is required during anoxia but not other environmental stresses. Plant Physiology, 132(2), 968–978. DOI 10.1104/pp.102.016907. [Google Scholar] [CrossRef]
65. Baxter-Burrell, A., Chang, R., Springer, P., Bailey-Serres, J. (2003). Gene and enhancer trap transposable elements reveal oxygen deprivation-regulated genes and their complex patterns of expression in Arabidopsis. Annals of Botany, 91(2), 129–141. DOI 10.1093/aob/mcf119. [Google Scholar] [CrossRef]
66. Xu, X. W., Wang, H. H., Qi, X. H., Xu, Q., Chen, X. H. (2014). Waterlogging-induced increase in fermentation and related gene expression in the root of cucumber (Cucumis sativus L.). Scientia Horticulturae, 179, 388–395. DOI 10.1016/j.scienta.2014.10.001. [Google Scholar] [CrossRef]
67. Qi, B. Y., Yang, Y., Yin, Y. L., Xu, M., Li, H. G. (2014). De novo sequencing, assembly, and analysis of the Taxodium ‘Zhongshansa’ roots and shoots transcriptome in response to short-term waterlogging. BMC Plant Biology, 14(1), 201. DOI 10.1186/s12870-014-0201-y. [Google Scholar] [CrossRef]
68. Kreuzwieser, J., Rennenberg, H. (2015). Molecular and physiological responses of trees to waterlogging stress. Plant Cell & Environment, 37(10), 2245–2259. DOI 10.1111/pce.12310. [Google Scholar] [CrossRef]
Appendix
Table S1: Summary of annotations of the Iris pseudacorus variegate transcriptome
Table S2: KEGG enrichment statistical table
Table S3: Plant hormone signal transduction
Table S4: Glycolysis/Starch and sucrose metabolism
Table S5: Nucleotide sequences of primers used for qRT-PCR
Figure S1: Length distribution of unigene
Figure S2: Gene ontology classifications of 137,542 orthologous unigenes
Figure S3: KOG function classification of the unigenes
Figure S4: GO classifications of the genes differentially expressed in different comparison groups (0h–2h)
Figure S5: GO classifications of the genes differentially expressed in different comparison groups (0h–4h)
Figure S6: GO classifications of the genes differentially expressed in different comparison groups (0h–12h)
Figure S7: GO classifications of the genes differentially expressed in different comparison groups (0h–24h)
Figure S8: The ten GO entries with the highest enrichment significance for different genes in each comparison group, biological process (BP) of DEGs enriched in roots waterlogged for 4 hours
Figure S9: The ten GO entries with the highest enrichment significance for different genes in each comparison group, cellular component (CC) of DEGs enriched in roots waterlogged for 4 hours
Figure S10: The ten GO entries with the highest enrichment significance for different genes in each comparison group, molecular function (MF) of DEGs enriched in roots waterlogged for 4 hours
Figure S11: The ten GO entries with the highest enrichment significance for different genes in each comparison group, biological process (BP) of DEGs enriched in roots waterlogged for 12 hours
Figure S12: The ten GO entries with the highest enrichment significance for different genes in each comparison group, cellular component (CC) of DEGs enriched in roots waterlogged for 12 hours
Figure S13: The ten GO entries with the highest enrichment significance for different genes in each comparison group, molecular function (MF) of DEGs enriched in roots waterlogged for 12 hours
Figure S14: The ten GO entries with the highest enrichment significance for different genes in each comparison group, biological process (BP) of DEGs enriched in roots waterlogged for 24 hours
Figure S15: The ten GO entries with the highest enrichment significance for different genes in each comparison group, cellular component (CC) of DEGs enriched in roots waterlogged for 24 hours
Figure S16: The ten GO entries with the highest enrichment significance for different genes in each comparison group, molecular function (MF) of DEGs enriched in roots waterlogged for 24 hours
 | This work is licensed under a Creative Commons Attribution 4.0 International License, which permits unrestricted use, distribution, and reproduction in any medium, provided the original work is properly cited. |