| Phyton-International Journal of Experimental Botany |
DOI: 10.32604/phyton.2022.017251
ARTICLE
Breeding Potential of Some Exotic Tomato Lines: A Combined Study of Morphological Variability, Genetic Divergence, and Association of Traits
Department of Genetics and Plant Breeding, Bangladesh Agricultural University, Mymensingh, 2202, Bangladesh
*Corresponding Author: Mohammad Anwar Hossain. Email: anwargpb@bau.edu.bd
Received: 26 April 2021; Accepted: 30 June 2021
Abstract: Tomato (Solanum lycopersicum L.) is called ‘the poor man’s orange’ due to its low price and improved nutritional values. An experiment was conducted to study the breeding potential of some exotic tomato lines by assessing various qualitative and quantitative traits conferring yield and quality attributes. Among the qualitative traits, greater variability was observed for growth type, stem hairiness, and fruit shape and size. A determinate growth habit was observed in the genotype AVTO9802 while the genotype AVTO0102 produced yellow color fruits. A significant (p ≤ 0.01) variation was also observed for the studied quantitative traits. Based on yield and traits attributed to yield, the genotypes AVTO0314, GPB0107, GPB0120 and AVTO9802 were selected as promising genotypes. The differences between the genotypic and phenotypic coefficients of variation (GCV and PCV) of the studied quantitative traits were very low. This suggests that the apparent variation was mainly due to the genotypes. The higher GCV and PCV values were observed for the number of primary branches plant−1 (NPB), number of fruits cluster−1 (NFC), individual fruit weight (IFW) and total soluble solids (TSS). High heritability was recorded for all quantitative traits in a broad sense. However, the individual fruit diameter showed the highest heritability (99.56). The highest (102.75) genetic advance (GA) was observed for the number of fruits plant−1 (NFP). High heritability coupled with high GA as percentage of mean were recorded for the traits NFP, NFC, fruit yield plant−1 (FYP) and IFW. FYP showed a significant positive correlation with NFC (0.714***) and a negative correlation with days to the first harvest (−0.539***) and plant height (−0.492**). Principal component analysis revealed that the first four components explained 78.5% of the total variation among the genotypes. Thus, the promising genotypes (AVTO0314, GPB0107, GPB0120, AVTO9802 and AVTO0102) isolated from this study can be used for developing high-yielding and high-quality tomato varieties.
Keywords: Tomato; yield and quality traits; genetic advance; heritability; correlation coefficient; principal component analysis
Tomato (Solanum lycopersicum L.) is one of the world’s largest cultivated and most widely consumed vegetable fruit crops [1]. It showed an annual production of 182 million tonnes globally in 2017 [2]. It belongs to the Solanaceae family with a chromosome number 2n = 2x = 24, and is native to South America [3]. Tomato fruit is highly rich in nutritional values with a well-balanced amount of β-carotene, ascorbic acid (AsA), phenolics, flavonoids, vitamin E, minerals, and fibers [4,5]. It is generally considered as a “Protective Food” as it is the main source of lycopene and other antioxidants in the human diet that reduces cancer incidence [6]. Lycopene present in tomato is a strong antioxidant and exhibits 2 to 10 times higher single oxygen quenching capacity than β-carotene and α-tocopherol [7]. Tomato is a crop of multipurpose use both as fresh and in processed food industries. Green fruits are mostly used for pickles, preserves, and are consumed after cooking, while ripe tomato fruits are consumed fresh and used in the agro-processing industry to manufacture sauce, paste, ketchup, powder, soup, and canned whole fruits [8]. As a result, the commercial importance of tomato has increased in recent decades.
The development of high-yielding and high-quality tomato varieties that are resistant/tolerant to various abiotic and biotic stresses is the main goal of plant breeders to ensure global food security and food quality. Breeders and scientists around the world created a wide range of morphologically diverse cultivars from the single species S. lycopersicum to modern tomato varieties. These varieties have a high variation in fruit weight and size, shape and color through intensive activities of breeding [5,9]. In Bangladesh we have nearly 35 inbreed tomato varieties developed by the Bangladesh Agricultural Research Institute (BARI) and the Bangladesh Institute of Nuclear Agriculture (BINA) [10]. Importantly, the yield of tomato is very low in Bangladesh as compared to the yield in other developed countries, stressing the importance of developing hybrid varieties with higher yield and quality [11]. Recently, a large number of hybrid varieties has been imported or developed by BARI and different private seed companies [12]. However, farmers have to pay a substantial amount of money to buy the hybrid seeds from the multinational companies. Sometimes, the imported hybrid varieties do not perform well under the agro-climatic conditions of Bangladesh. Therefore, there is a great need to develop new inbreed tomato varieties that produce higher yields along with desirable qualitative attributes. Additionally, inbred development is one of the prerequisites to obtain hybrid varieties. To meet the increasing demand for tomato, it is important to study the morphological and genetic variability of exotic and local tomato germplasm. Variability assessment among tomato genotypes helps to maintain and utilize germplasm resources for the improvement of the cultivars [13].
The low diversity among commercial tomato varieties, coupled with numerous pests and diseases, are a serious threat to tomato production [14]. Genetic advancement for yield and quality of cultivated tomato can generally be attained by selecting genotypes that exist in nature or through hybridization with a desirable trait combination. Morphological or agro-morphological characteristics are key determinants to identify and estimate the genetic diversity among genotypes [15]. Genetic variation of the morphological features has been the focus of many kinds of research in tomato [15–20]. Morphological markers are easier, more direct, and less expensive than molecular and biochemical markers [21]. Besides, heritability and genetic advance (GA) are also important indications for the breeding plan. The environmental influence and possible improvement of a trait can be estimated by heritability and GA [22]. High heritability along with a substantial amount of GA are necessary to make an efficient selection in breeding programs [23]. Moreover, analyzing correlation coefficients among characters is also helpful for the selection of important traits associated with yield. Therefore, the collective information of tomato genotypes can help to formulate a comprehensive breeding plan for their improvement [24]. Additionally, previous researchers working with tomato germplasm have suggested to use multivariate analysis as a valid tool to deal with germplasm collection and characterization [25]. Considering the above facts, the objectives of this study were: (i) to assess the variability for qualitative and quantitative attributes in a set of tomato genotypes, (ii) to estimate the breeding potential of these quantitative attributes, (iii) to select the most promising genotypes for variety development.
2.1 Experimental Site, Soils, and Season
The field study was carried out at the Experimental Farm of the Department of Genetics and Plant Breeding, Bangladesh Agricultural University, Mymensingh, Bangladesh, during the winter season (October 2020 to March 2021). The land of the experimental area was medium high land which belonged to the Agro-Ecological Zone-9 (Old Brahmaputra Flood Plain). The pH of the soil ranged from 6.5–6.7, and the texture was sandy loam.
A total of 12 tomato genotypes were used in the study. They consisted of (i) seven exotic lines (AVTO0102, AVTO0314, AVTO1219, AVTO1424, AVTO1429, AVTO1464 and AVTO9802) collected from the Asian Vegetable Research and Development Center (AVRDC), Taiwan, (ii) two advanced breeding lines (GPB0107 and GPB0120, collected from the Department of Genetics and Plant Breeding, Bangladesh Agricultural University, Mymensingh, and (iii) three indigenously developed varieties (Binatomato-10, BARI Tomato-14, and BARI Tomato-17) collected from the Bangladesh Institute of Nuclear Agriculture (BINA), Mymensingh and the Bangladesh Agricultural Research Institute (BARI), Gazipur.
2.3 Seedlings Raising and Transplanting
At first, the tomato seedlings were raised in a nursery bed. One-month-old seedlings were transplanted to the experimental field on November 15, 2020. Transplanting was done in the late afternoon, and irrigation was given by water can just after transplanting for a better establishment of plants.
2.4 Design and Layout of the Experiment
The experiment was conducted following a randomized complete block design (RCBD) with three replications. Each block consisted of twelve experimental units. Plot size was 5 m2 (2.5 m
2.5 Land Preparation and Fertilization
The experimental field was prepared through plowing and cross plowing with a power tiller. Weeds and debris were removed during land preparation. Proper laddering was done to bring the soil to a proper tilth and leveling. Fertilizer doses were Urea-TSP-MP-Gypsum-Boron at 200-150-80-25 and 3 kg/ha, respectively, and cowdung at 10 t/ha. Whole amount of decomposed cowdung, TSP and MP, Gypmsum, and Boron, and half amounts of Urea, were given at the time of final land preparation. The rest of the Urea was applied 15 days after transplanting and a week before flowering.
To protect lay down on the soil each plant was given a bamboo stick. Agronomic practices like weeding and irrigation were performed to provide adequate growing conditions. Other intercultural operations were done whenever necessary.
Data on ten qualitative traits (i.e., stem color, SC; flower color, FC; growth type, GT; foliage density, FD; stem hairiness, SH; the presence of green shoulder, GS; exterior fruit color, EFC; fruit shape, FS; fruit cross-section shape, FCS; and fruit size) were recorded according to the IPGRI (International Plant Genetic Resources Institute) tomato descriptor. Additionally, a total of fourteen quantitative traits (days to first flowering, DFF; days to first harvest, DFH; days to last harvest, DLH; plant height, PH; number of primary branches plant−1, NPB; number of fruit clusters plant−1, NFC; number of fruits cluster−1, NFPC; number of fruits plant−1, NFP; individual fruit weight, IFW; individual fruit diameter, IFD; fruit yield plant−1, FYP; dry matter, DM; total soluble solids, TSS (% brix), and ascorbic acid (AsA) concentration (mg/100 g) were recorded from ten randomly selected plants from each replicate. NFPC, NFP, IFW, and IFD were recorded by counting and considering all fruits of each genotype from each replicate. DM, TSS and AsA contents were estimated from five randomly selected fruits of each genotype for each replication. For TSS estimation, a drop of tomato juice squeezed from the fruit was placed on the prism of the refrectometer and the soluble solid concentration was recorded. AsA content was estimated by the method described by Plummer [26] through visual titration methods. For estimating dry matter percentage (DM%), the weight of whole fresh fruits was taken from the sample plants and cut into two halves. The chopped sample fruit was oven-dried at 70°C for 2 days until constant weight. The dried samples were re-weighted to calculate the percent dry weight. Percent DM content was calculated using the following formula:
Statistical analysis of the collected data was performed by using Minitab 18 Statistical Software. The analysis of variance (ANOVA) was performed for each trait to test the variations among the genotypes. The separation of means was done following the Tukey’s test at a 5% level of probability. Additionally, the following genetic parameters were estimated to determine the genetic variability among genotypes and evaluate the genetic and environmental effects on the studied variables.
(i)
where, GMS = Genotypic mean square, EMS = Error mean square, r = Number of replications
(ii) Phenotypic variance, σ2p = σ2g + EMS
where, σ2g = Genotypic variance, EMS = Error mean square
(iii) Heritability in broad sense, h2b
where, h2b = Heritability in broad sense, σ2g = Genotypic variance; and σ2p = Phenotypic variance.
(iv)
where, σ2g = Genotypic variance; and
(v)
where, σ2p = Phenotypic variance; and
(vi) Genetic advance, GA = h2b.K.σp
where, h2b = Heritability in broad sense; K = Selection differential, the value of which is 2.06 at 5% selection intensity; σp = Phenotypic standard deviation
(vii)
where, GA = Genetic advance and
These formulae were taken from Singh et al. [27] and Fehr [28]. Pearson correlation coefficients were computed to evaluate the relationship between yield and different traits. Principal component analysis (PCA) was made using Minitab 18 statistical software to determine the patterns of quantitative variation with the eigenvectors and eigenvalues.
A large variation was observed among the genotypes for the studied qualitative traits (Tab. 1). The stem color of all the studied genotypes was green and the flower color was yellow. Most of the genotypes showed an indeterminate growth habit; a few genotypes showed semi-determinate growth habit, and only one genotype (AVTO9802) showed a determinate growth habit. Out of the 12 genotypes, 9 genotypes showed an intermediate foliage density whereas three genotypes showed (AVTO0314, BARI Tomato-14, and BARI Tomato-17) a dense foliage density (Tab. 1). Regarding the stem hairiness, 6 genotypes showed intermediate, 5 genotypes showed dense and one genotype (AVTO1464) showed a sparse pubescence density (Tab. 1; Fig. 1). Green shoulder was only present in two genotypes (AVTO1464 and Binatomato-10) (Tab. 1; Fig. 1). The exterior fruit color was red for most of the genotypes. However, fruit color of one genotype (AVTO0102) was yellow (Tab. 1; Fig. 2). Oval fruit shape was observed in four genotypes, round fruit shape was shown in 7 genotypes, and the fruit shape of Binatomato-10 was long oblong. Cross-section shape of the fruit was round for all of the genotypes but AVTO1429 whose fruit cross section was irregular. A large variation was found among the studied genotypes for fruit size: large fruit size was observed in 5 genotypes, medium fruit size was determined on 6 genotypes, whereas one genotype (Binatomato-10) produced a small fruit size (Tab. 1; Fig. 2).
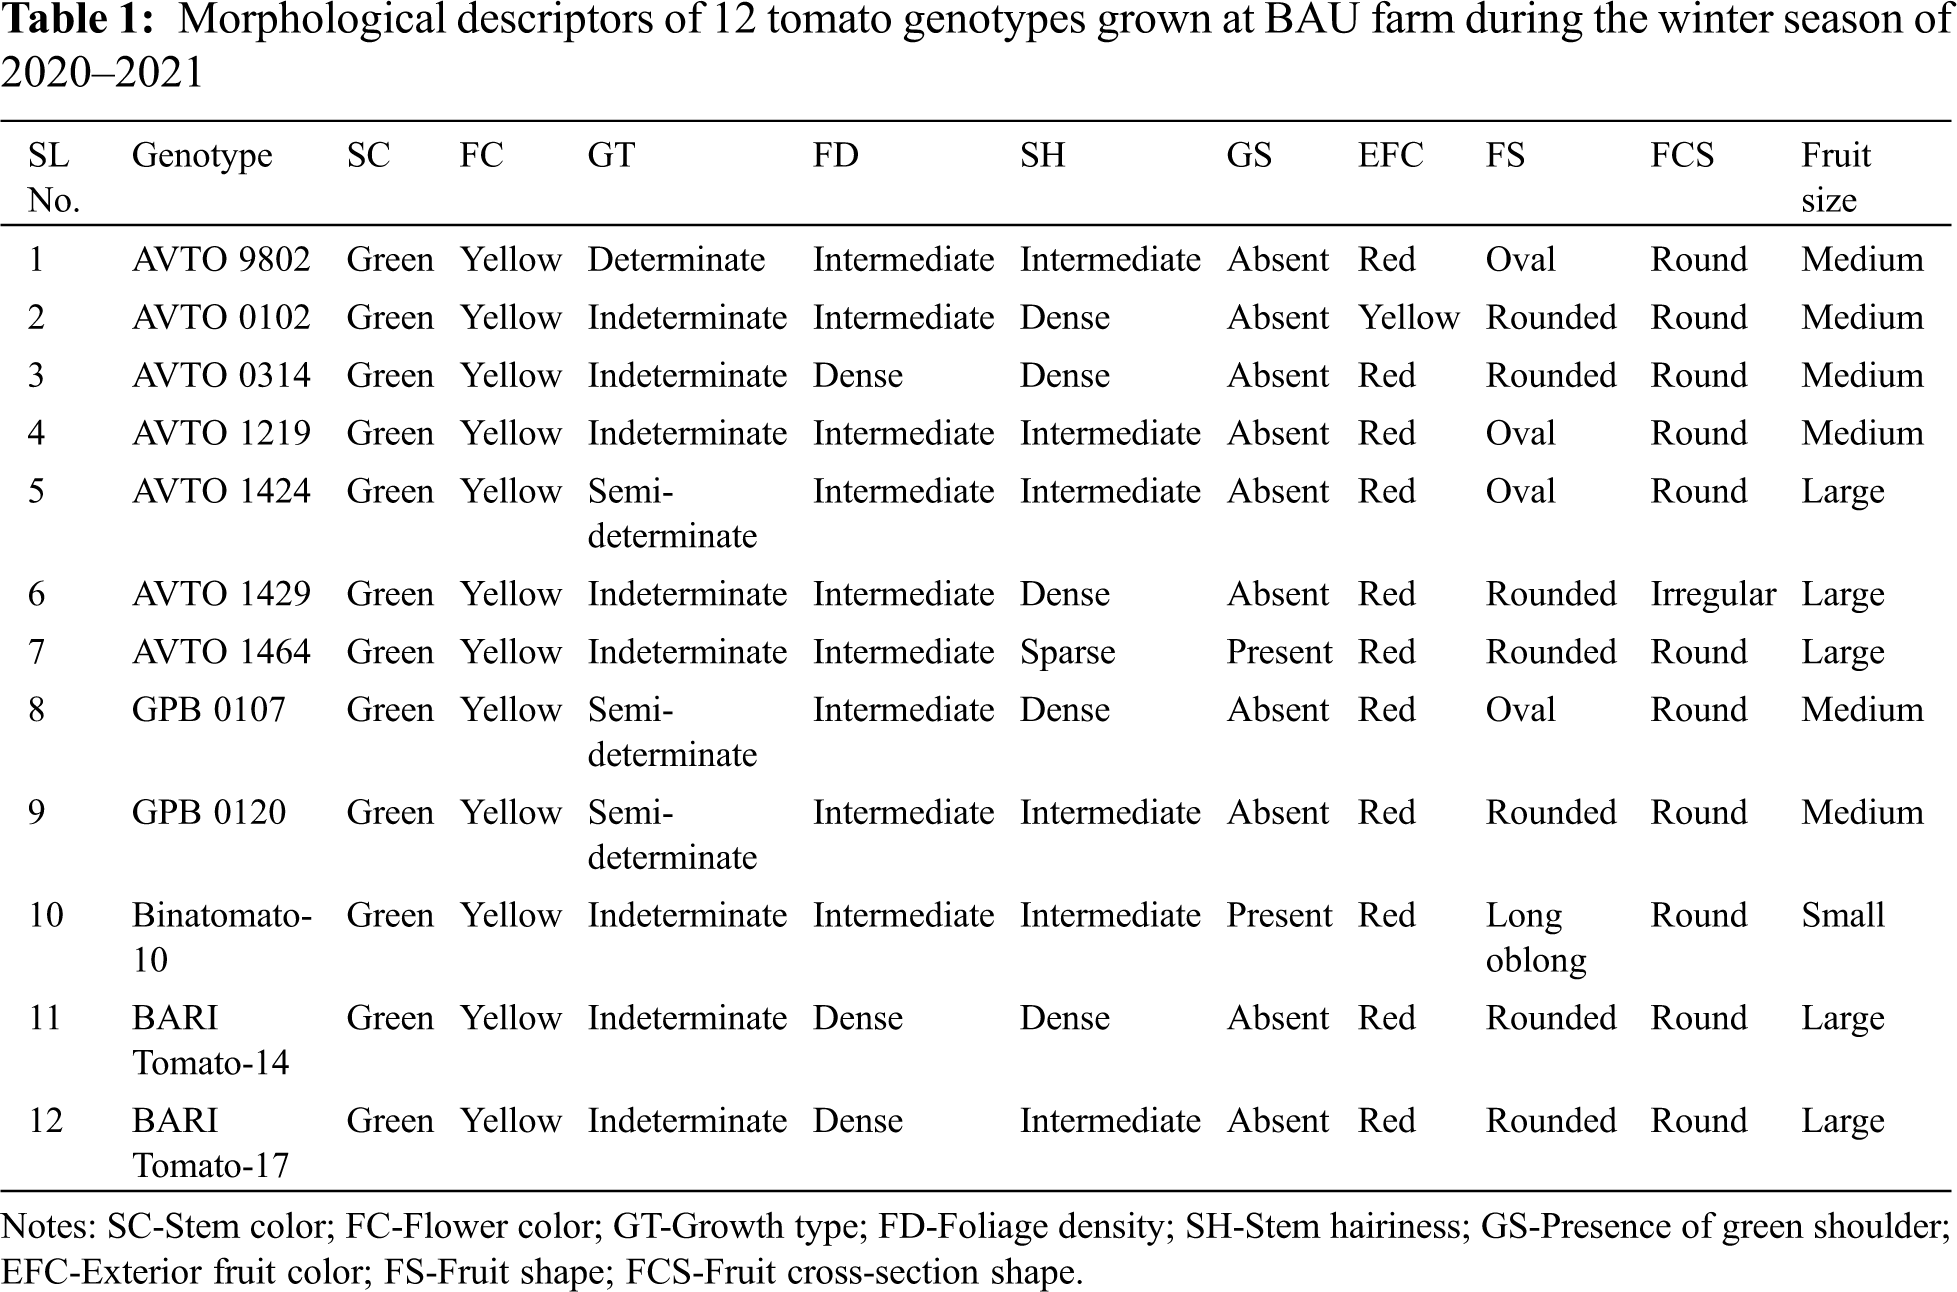
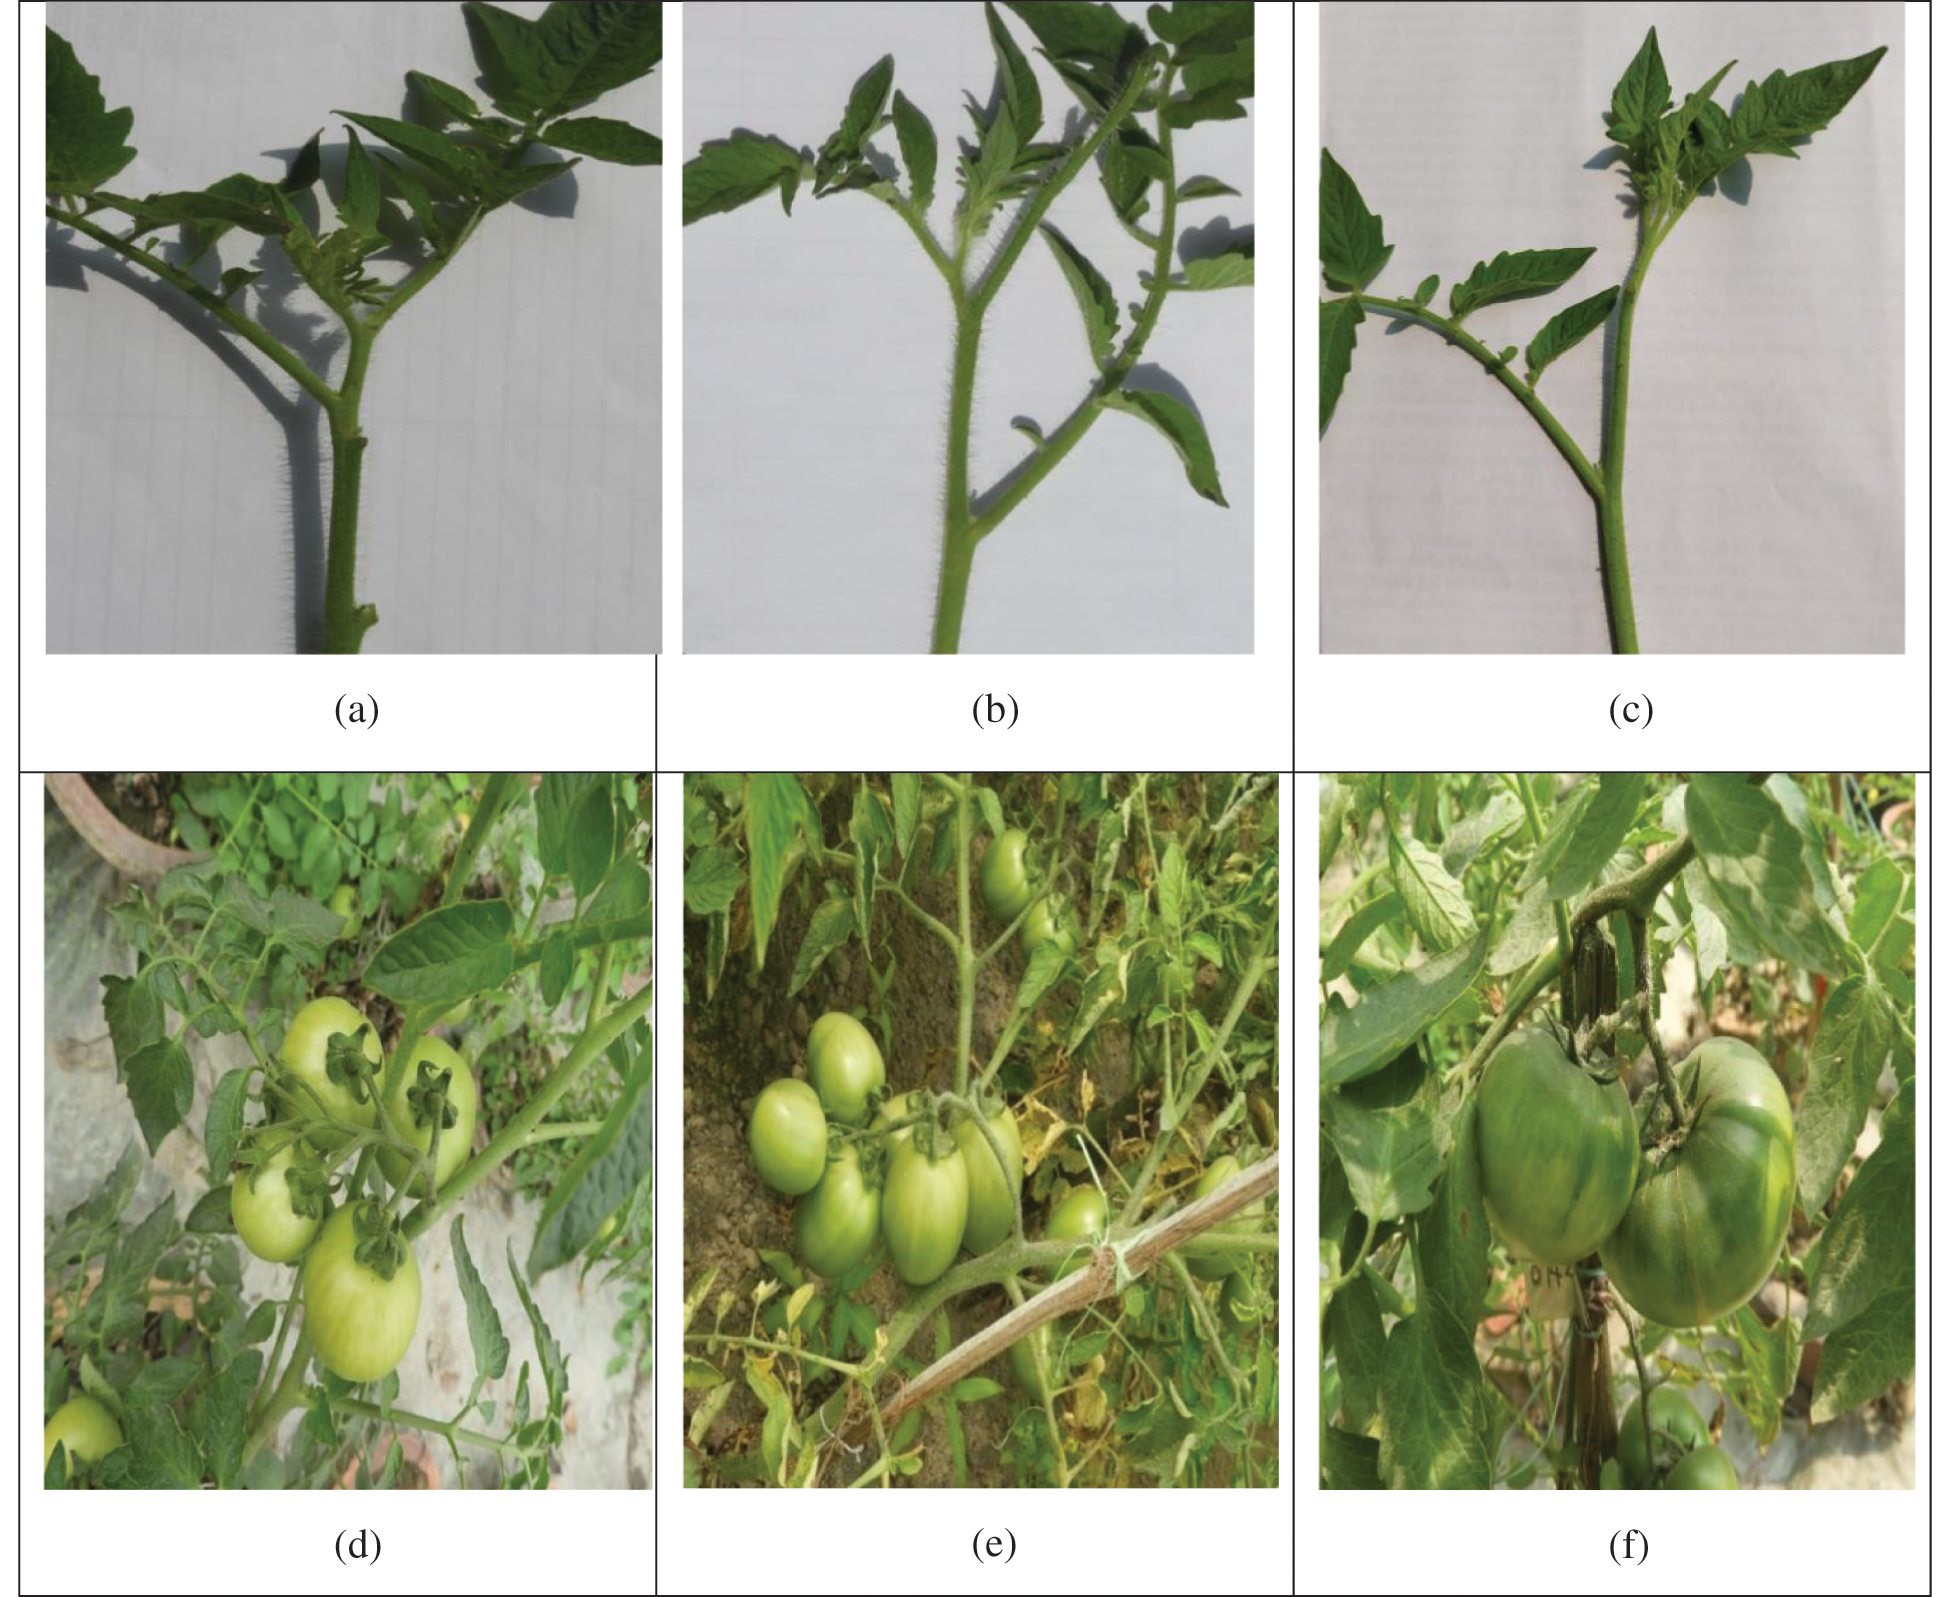
Figure 1: Variation on stem hairiness and presence/absence of green shoulder (a) genotype AVTO 1429: dense stem hairiness; (b) genotype AVTO 0314: intermediate stem hairiness density; (c) genotype AVTO 1464: sparse stem hairiness density; (d) genotype BARI Tomato 14: absence of green shoulder; (e) genotype AVTO9802: absence of green shoulder and (f) genotype AVTO1464: presence of green shoulder
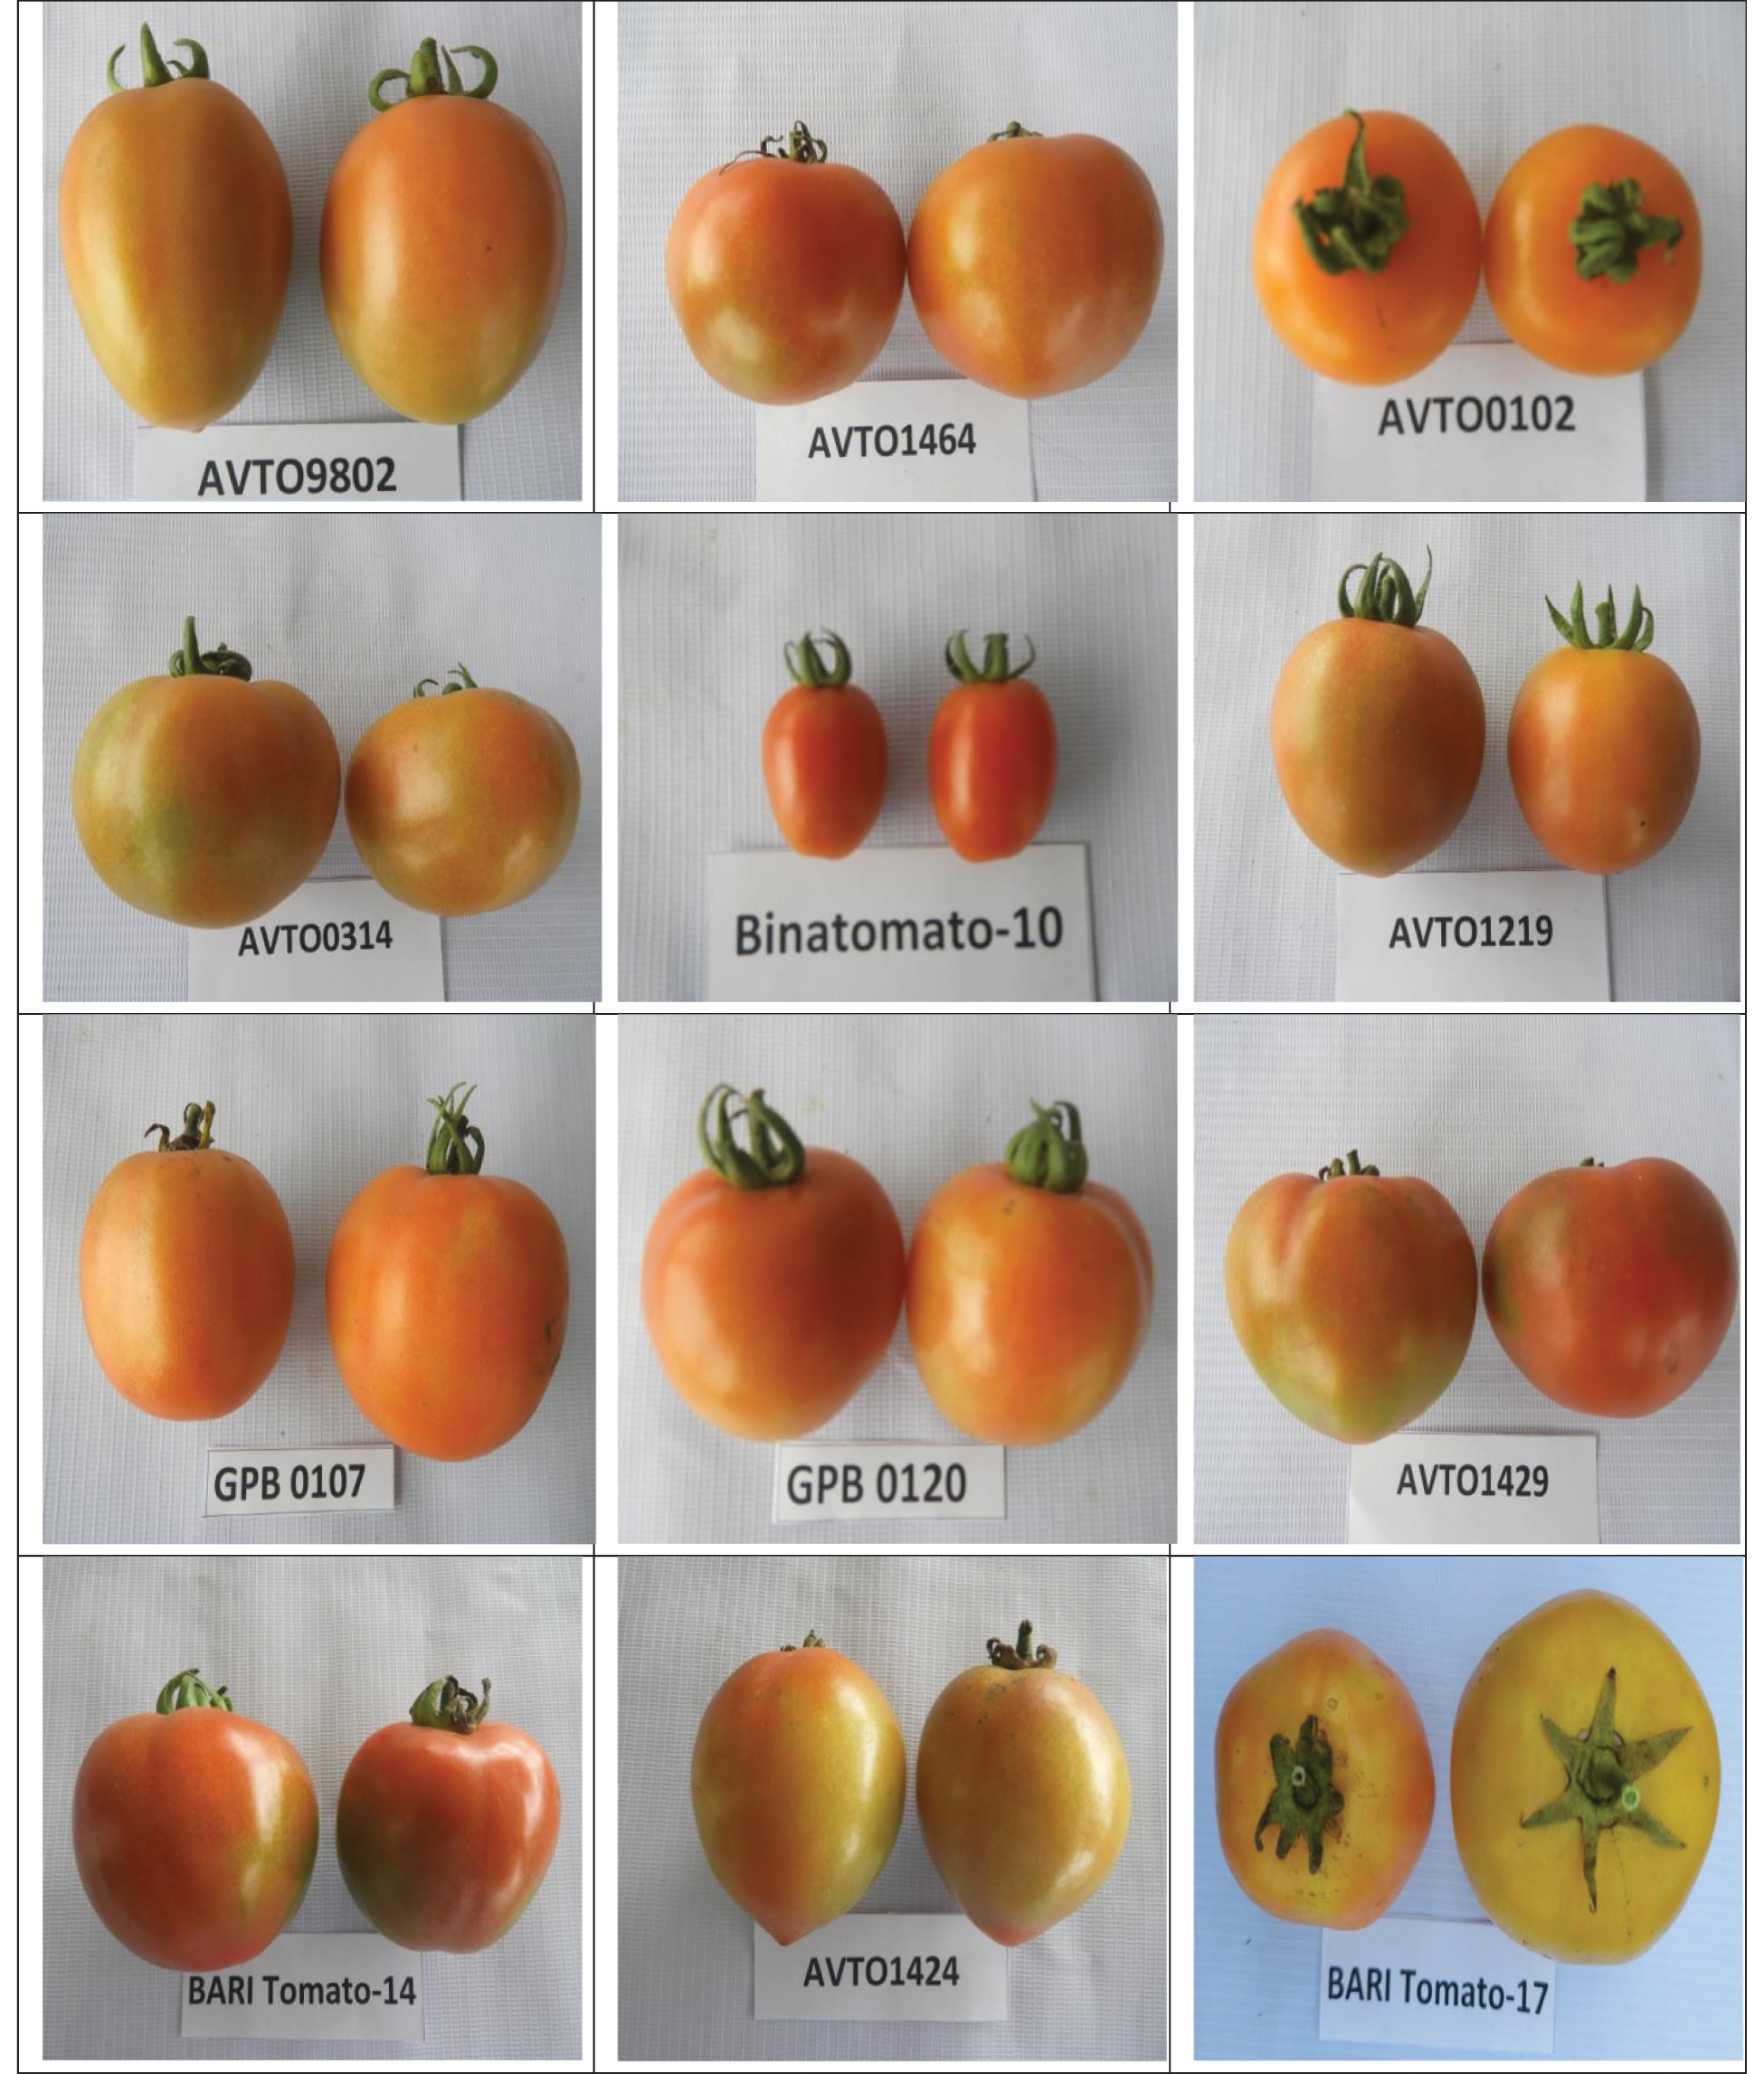
Figure 2: Variation in fruit size, shape and color of the studied tomato genotypes grown at BAU farm during the winter season of 2020–2021
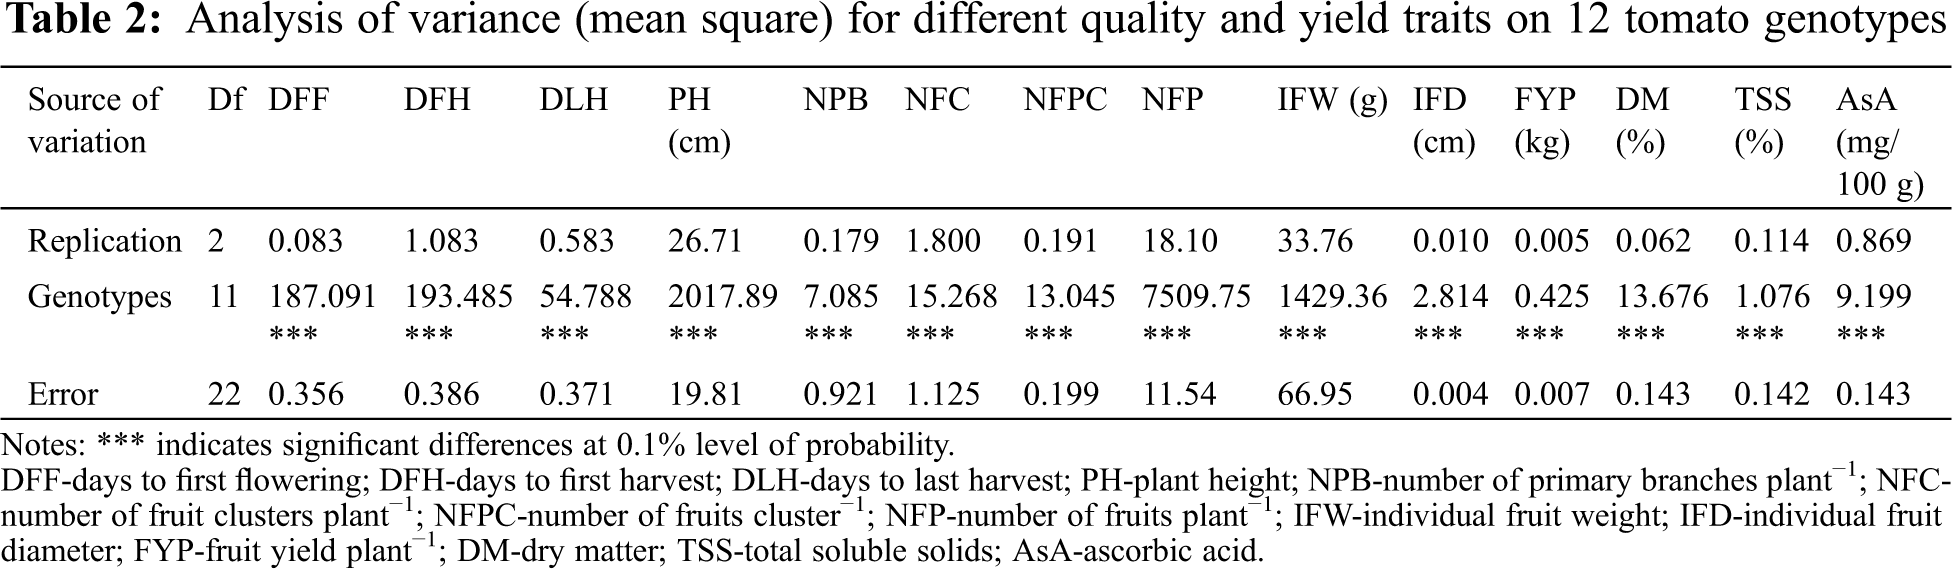
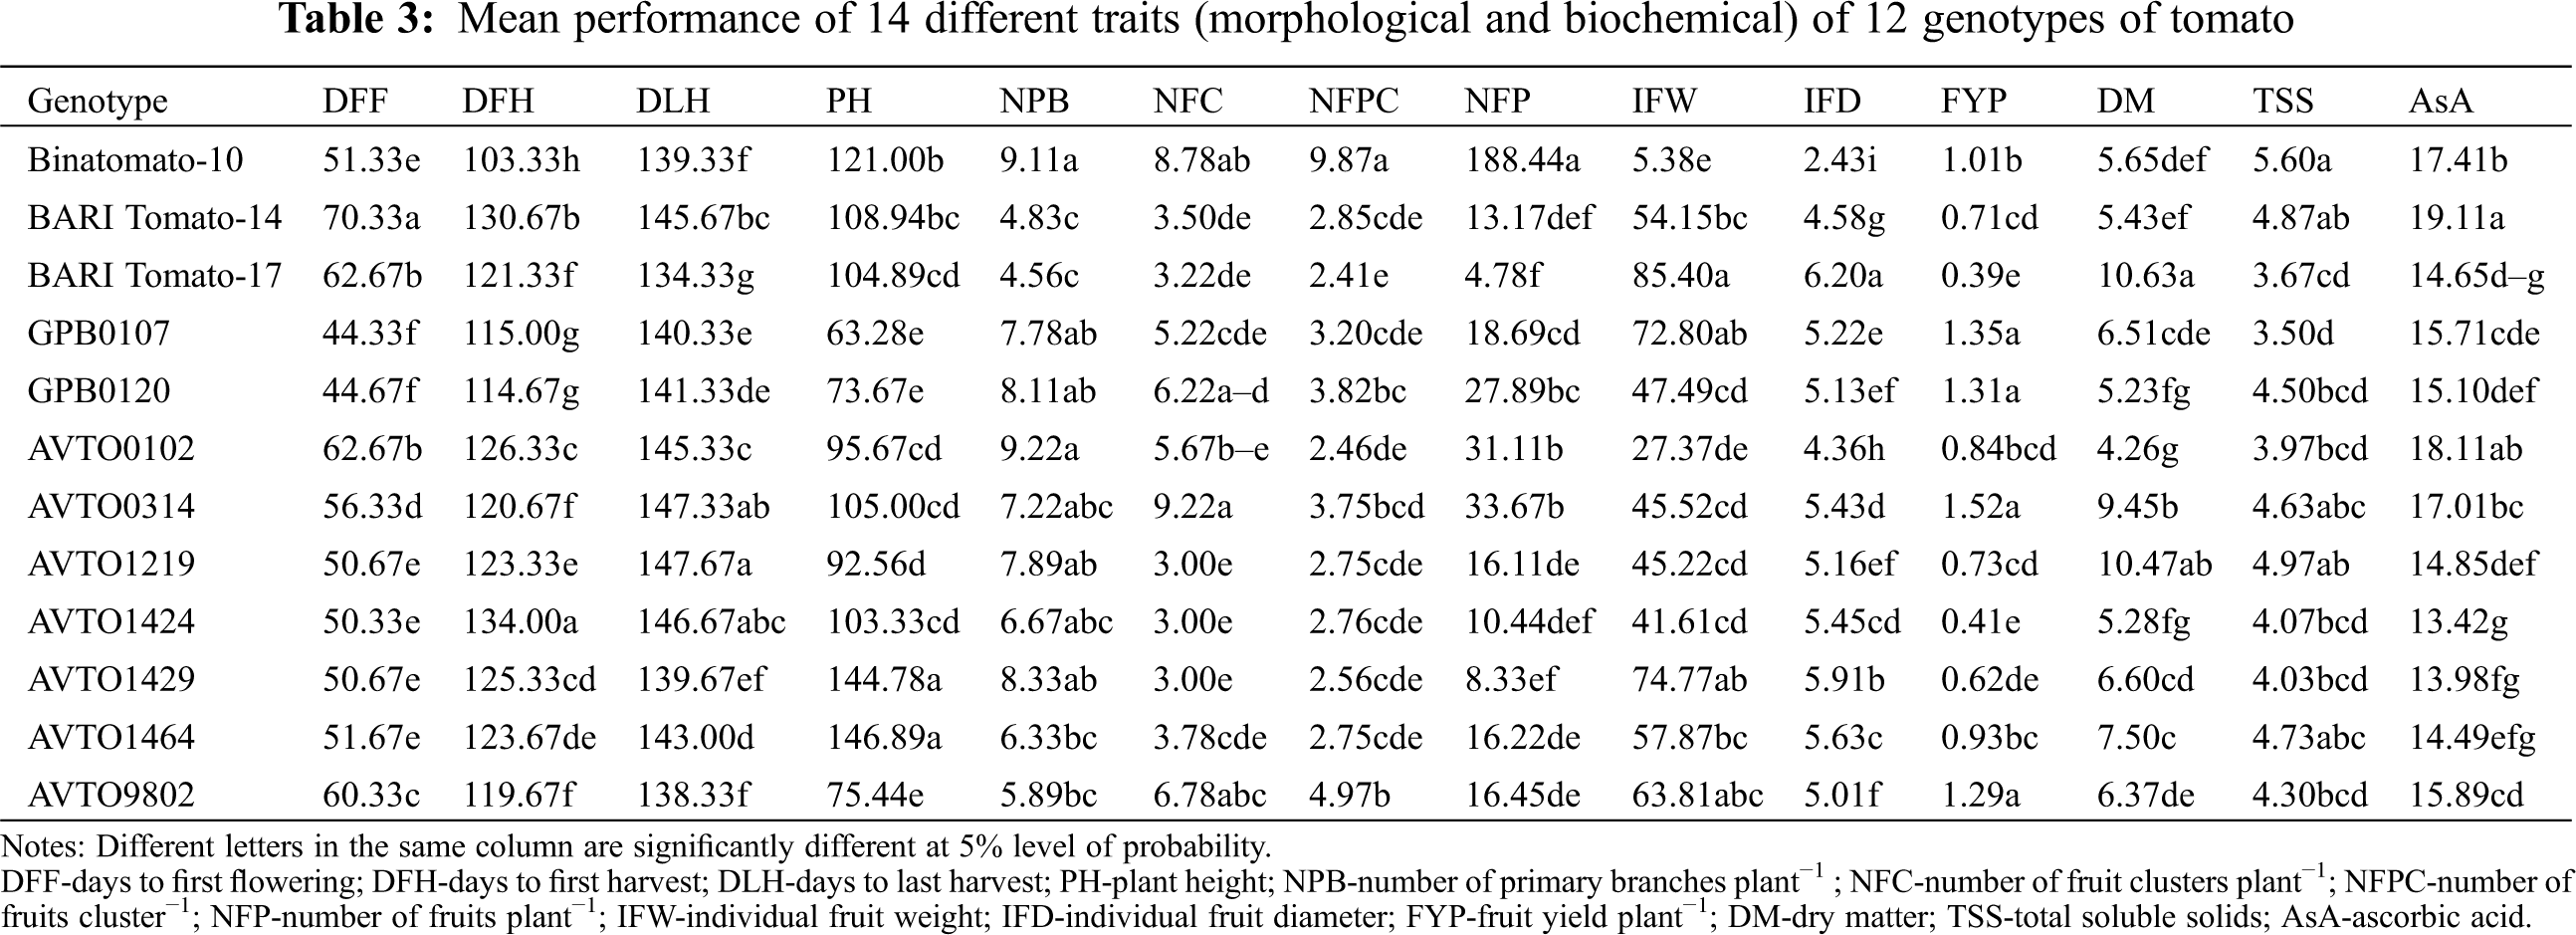
The results of the analysis of variance for all of the quantitative characters studied showed highly significant (p < 0.001) variation among the genotypes (Tab. 3). The results of the mean variation of fourteen quantitative traits among the genotypes under study are described below.
3.2.1 Yield and Yield-Contributing Traits
Among the studied genotypes, the genotypes GPB0107 and GPB0120 were the earliest flowering genotypes as they required the minimum days to flowering (44.33 and 44.67 days, respectively) whereas the genotype BARI Tomato-14 required the maximum days (70.33 days) for flowering (Tab. 3). The genotypes GPB0120 and GPB0107 were the earliest maturing genotypes as they required the minimum days to harvest the first mature fruits (114.67 and 115 days, respectively); the genotype AVTO1424 required the maximum days (134 days) to produce the first mature fruits (Tab. 4). Maximum fruit harvesting duration (147.33 days) was recorded for AVTO1219, whereas AVTO9802 required the minimum days (138.33 days) to harvest the last mature fruits (Tab. 3). The genotype AVTO1464 showed the tallest plants (PH = 146.89 cm); it was followed by the AVTO1429 (144.78 cm) and Binatomato-10 (121.00 cm). The lowest PH (63.28 cm) was recorded for the genotype GPB0107; however, it did not show significant difference with the genotype GPB0120 (Tab. 3). The maximum NPB was found in the genotypes AVTO0102 and Binatomato-10 (9.22 and 9.11, respectively), which did not show significant differences between them. The varieties BARI Tomato-17 and BARI Tomato-14 showed the minimum number of primary branches (4.56 and 4.83, respectively) per plant (Tab. 3). The highest NFC (9.22) was recorded for the genotype AVTO0314, while the least NFC (3.00) was recorded for the genotypes AVT01219, AVTO1424 and AVTO1429 (Tab. 4). The variety Binatomato-10 was found to bear the maximum NFPC (9.87) followed by AVTO9802 (4.97), while the variety BARI Tomato-17 was found to bear the least NFPC (2.41) (Tab. 3). A highly significant variation was observed for the character NFP among the studied genotypes. The highest NFP (188.4) was recorded for the variety Binatomato-10 followed by the genotypes AVTO0314 (33.67) and AVTO0102 (31.11). The lowest NFP (4.78) was recorded for the variety BARI Tomato-17 (Tab. 3). BARI Tomato-17 showed the highest value for IFW (85.40 g) followed by AVTO1429 (74.77 g), GPB 0107 (72.80 g), and AVTO9802 (63.81 g); however, the differences among the genotypes were non-significant. The lowest value (5.38 g) of IFW was recorded for the variety Binatomato-10 (Tab. 3). The highest IFD (6.20 cm) was found on BARI Tomato-17, whereas Binatomato-10 showed the lowest IFD (2.43 cm) (Tab. 3). The studied genotypes showed a highly significant variation among themselves for the trait FYP. The highest amount of FYP (1.52 kg) was recorded for the genotype AVTO0314 followed by GPB0107 (1.35 kg), GPB0120 (1.31 kg), and AVTO9802 (1.29 kg); however, the differences among these genotypes were not statistically different. The lowest FYP (0.39 kg) was recorded for the variety BARI Tomato-17 (Tab. 3).
The maximum DM content (10.63%) was recorded in the genotype BARI Tomato-17, followed by AVTO1219, AVTO0314, AVTO1464, AVTO1429, GPB107, AVTO9802, Binatomato-14, BARI Tomato-14, AVTO1424, GPB0120, and AVTO0102 (Tab. 3). The mean values of the TSS (%brix) content on the studied genotypes ranged from 5.60% to 3.50%. The genotype Binatomato-10 had the highest amount of TSS (5.60%), followed by AVTO1219, BARI Tomato-14, AVTO1464, AVTO0314, GPB0120, AVTO9802, AVTO1424, AVTO1419, GPB0120, BARI Tomato-17 and GPB0107 (Tab. 3). The highest amount of AsA content (19.11 mg/100 g) was found in the genotype BARI Tomato-14, followed by AVTO0102, Binatomato-10, AVTO0314, AVTO9802, GPB0107, GPB0120, AVTO1219, BARI Tomato-17, AVTO1464, and AVTO1429. The genotype AVTO1424 had the least amount of AsA content (Tab. 3).
3.3 Genetic Parameters Analysis
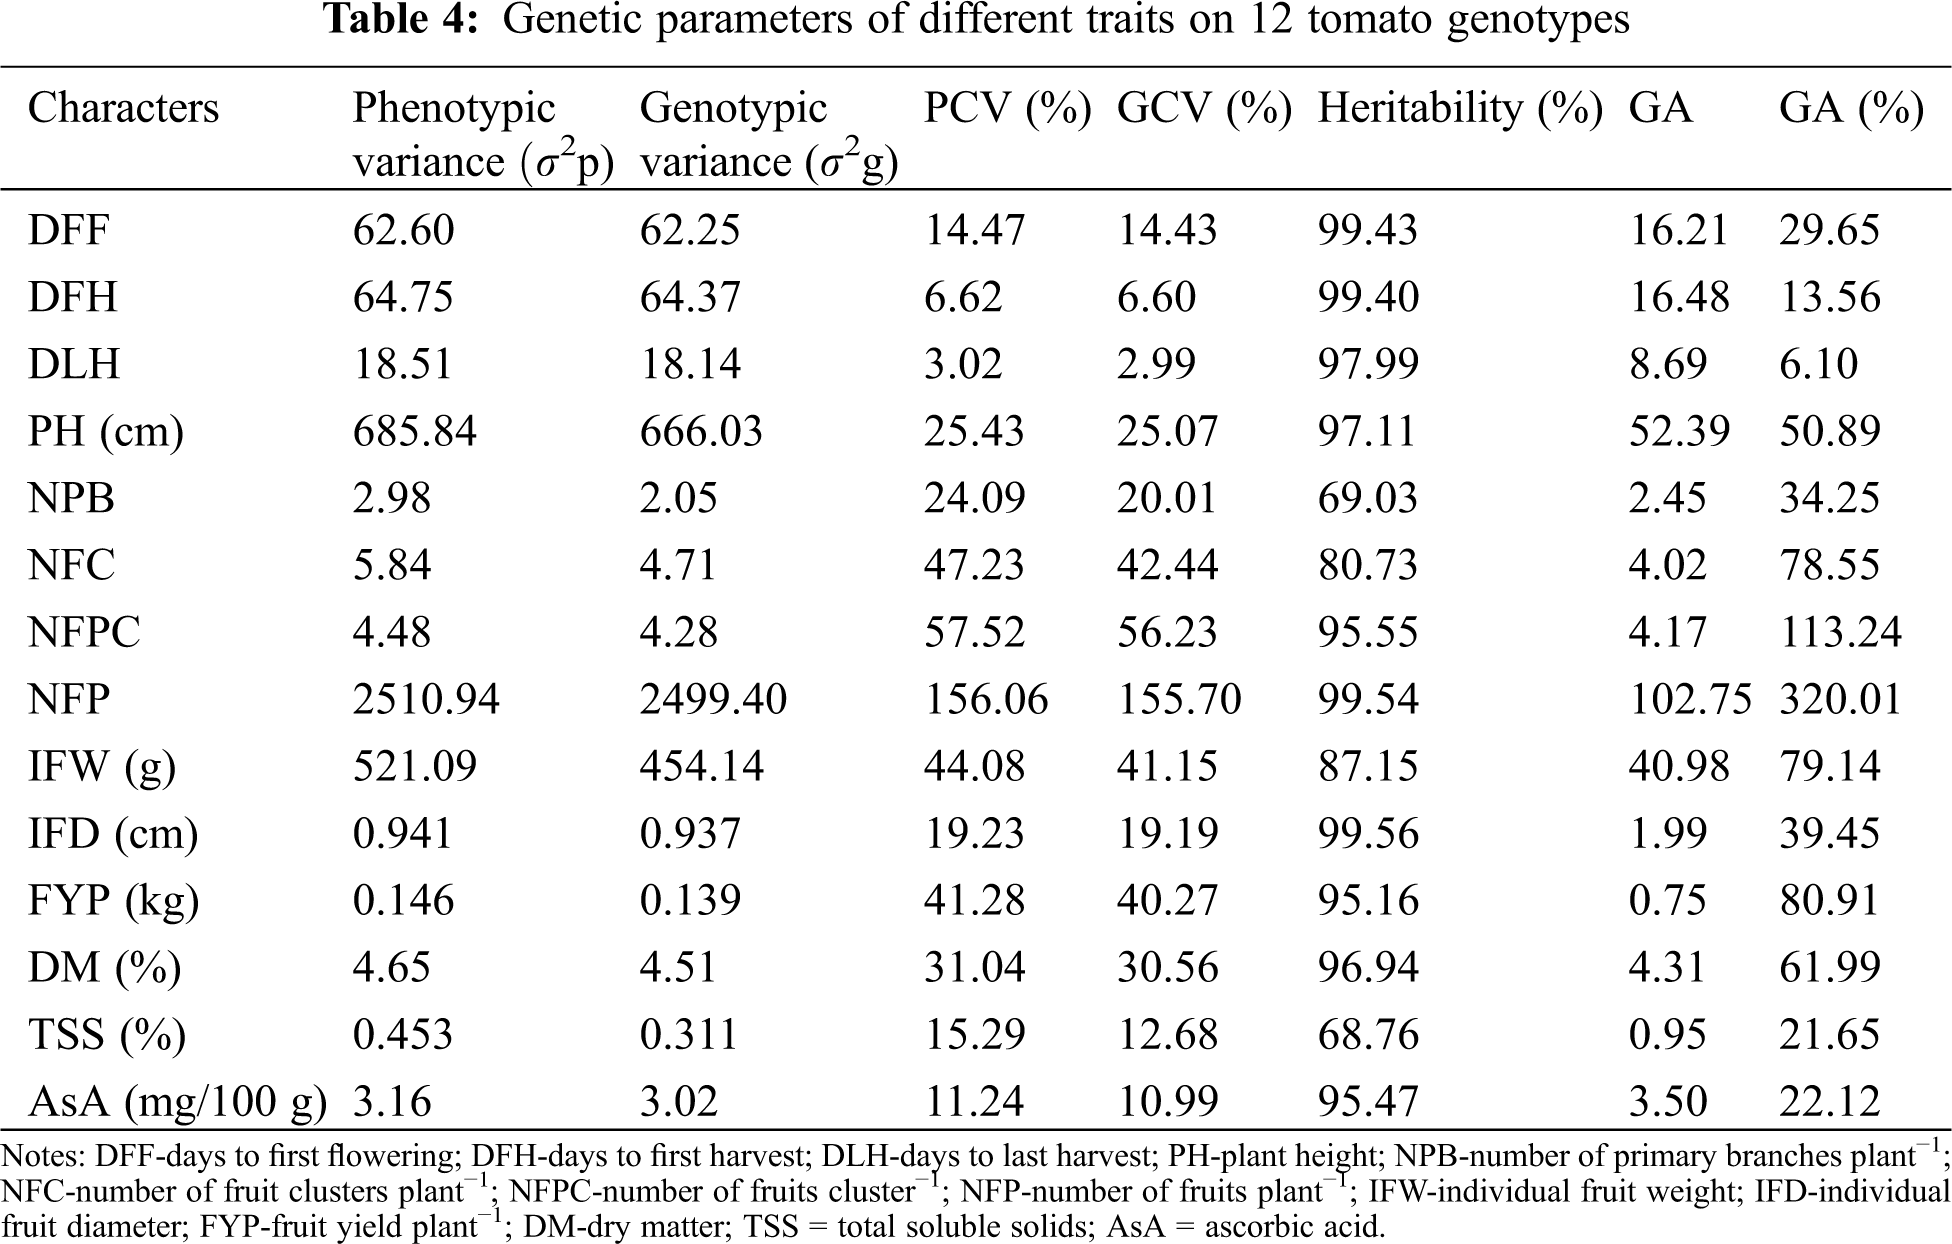
Phenotypic and genotypic variances, PCV and GCV, heritability, GA and GA% of the studied traits are presented in Tab. 4. The characters which showed very high σ2G and σ2P were NFP (2499.40 and 2510.94, respectively), PH (666.03 and 685.84, respectively) and IFW (454.14 and 521.09, respectively). The rest of the traits showed a low magnitude of σ2G and σ2P. The values of PCV were higher than those of the GCV for all traits. The highest differences between GCV and PCV values were recorded for the traits NPB (24.09% and 20.01%), NFC (47.23% and 42.44%), IFW (44.08% and 41.15%) and TSS (15.29% and 12.68%) whereas the rest of the traits showed lower differences between GCV and PCV. In general, a high broad sense heritability (>90%) was recorded for most of the studied traits. Individual fruit diameter showed the highest heritability (99.56%) while the lowest heritability (69.03%) was observed for NPB. The highest GA (102.75) was observed for the trait NFP. Genetic advance as a percentage of the mean ranged from 6.10% (DLH) to 320.01% (NFP); however, around 80% of GA was recorded for the traits NFC, NFPC, FYP and IFW (Tab. 4). Importantly, high heritability and high GA% were observed for the traits NFP, NFPC, FYP and IFW.
3.4 Correlation Coefficient Analysis
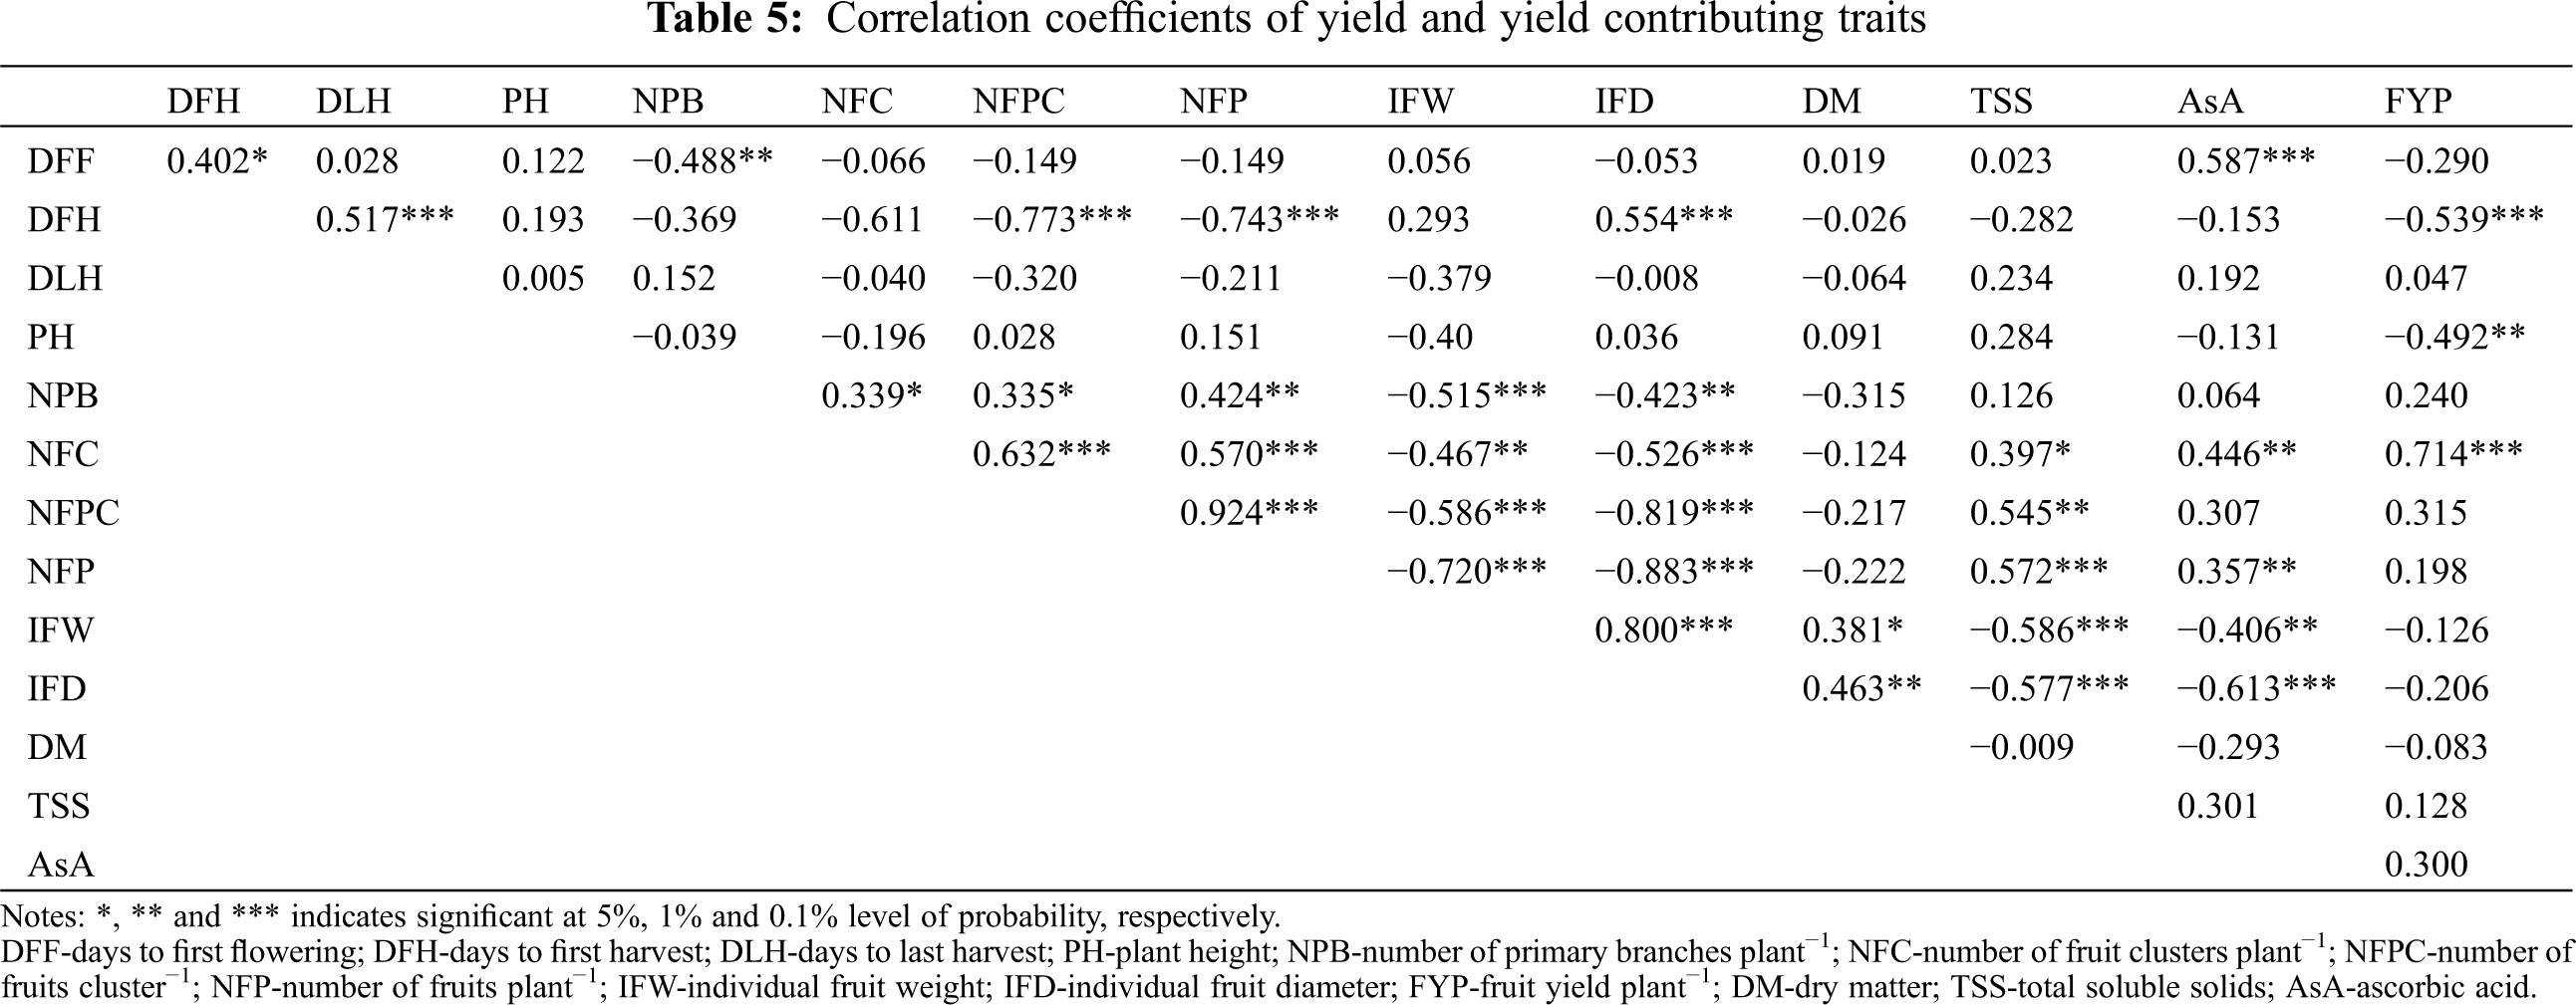
Days to first flowering showed a significant positive correlation with DFH (0.402*) and AsA content (0.587***) whereas it showed a significant negative correlation with NPB (−0.488**) (Tab. 5). Days to first harvest showed a significant positive correlation with DLH (0.587***) and IFD (0.554***), whereas it showed a significant negative correlation with NFPC (−0.743***), NFP (−0.773***), and FYP (−0.539***).Plant height showed a significant negative correlation with FYP (−0492**). Number of primary braches plant−1 showed a significant positive correlation with NFC (0.339*), NFPC (0.335*), and NFP (0.424***), whereas it showed a significant negative correlation with IFW9 (−0.515***) and IFD (−0.423**). Number of fruit clusters plant−1 showed a significant positive correlation with NFPC (0.632***), NFP (0.57***), TSS (0.397*), AsA content (0.446**), and FYP (0.714***), whereas it showed a significant negative correlation with IFW (−0.467**) and IFD (−0.526***). Similarly, the number of fruits cluster−1 showed a significant positive correlation with NFP (0.924***) and TSS (0.545**), whereas it showed a significant negative correlation with IFW (−0.586**) and IFD (−0.819***). The number of fruit plant−1 showed a significant negative correlation with IFW (−0.72***) and IFD (−0.883***), but it showed a significant positive correlation with TSS (0.572***) and AsA (0.357**). Consequently, IFW showed a significant positive correlation with IFD (0.8***) and DM (0.381*), whereas it showed a significant negative correlation with TSS (−0.586***) and AsA (−0.406**). Individual fruit diameter showed a significant positive correlation with DM (0.463**) whereas it showed a significant negative correlation with TSS (−0.577***) and AsA (−0.613***). Importantly, FYP did not show a significant positive correlation with DLH, NPB, NFC, NFPC, NFP, TSS and AsA; however, it showed a significant positive correlation with NFC (0.714***). In contrast, FYP showed a significant negative correlation with DFH (−0.539***) and PH (−0.492**) (Tab. 5).
3.5 Principal Component Analysis
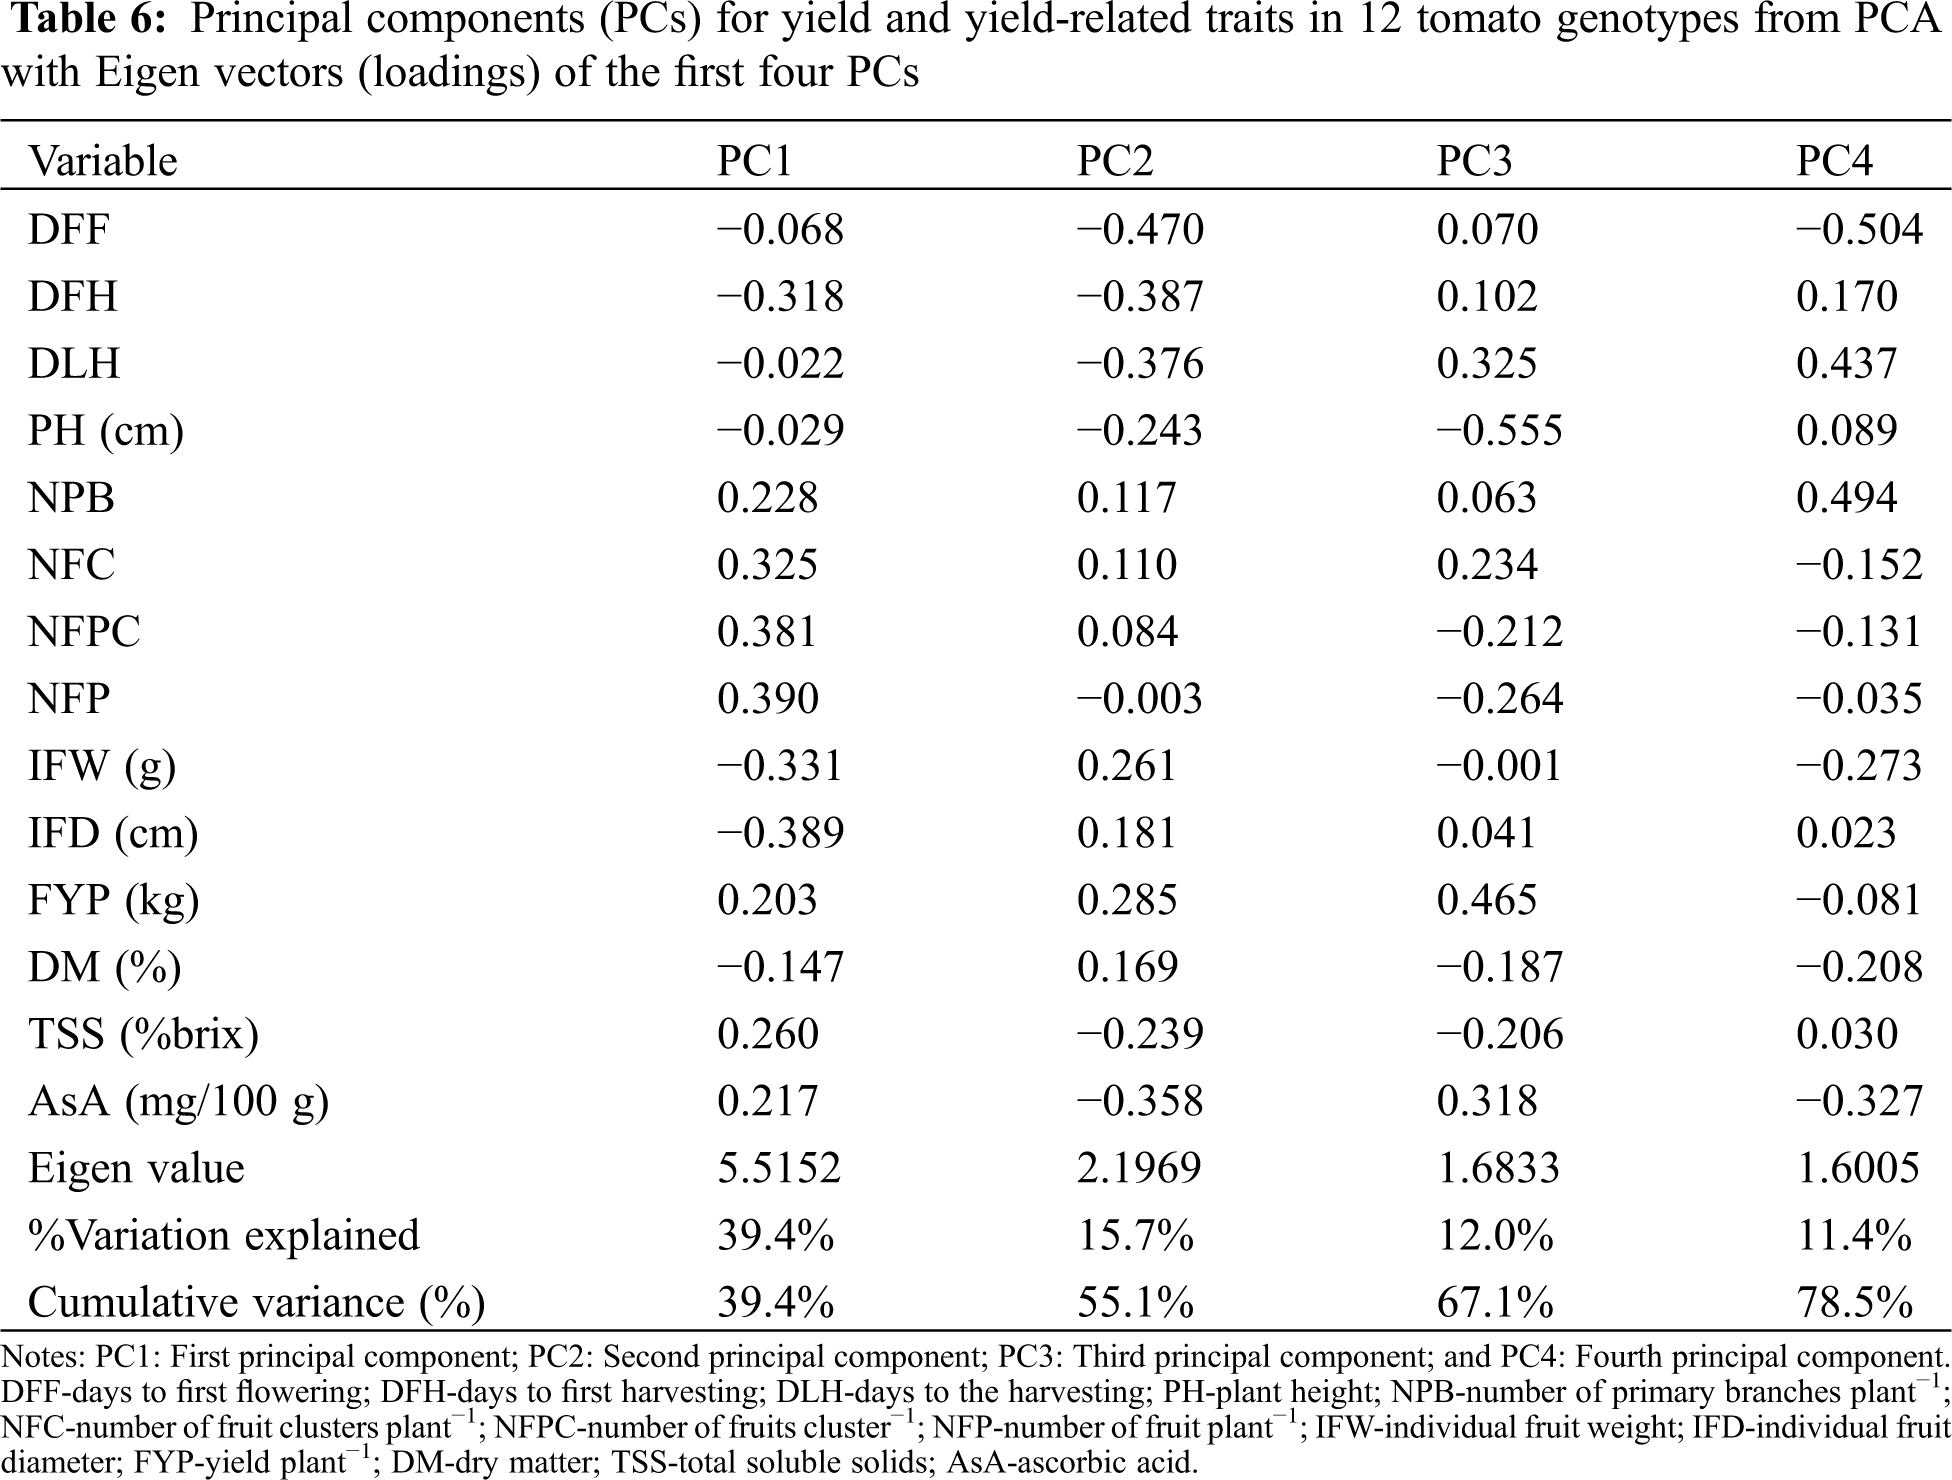
The PCA was carried out considering all the quantitative traits presented in Tab. 6. In the present study, four components indicated Eigen values greater than one which cumulatively explained 78.5% of the total variation among the 12 tomato genotypes for the 14 quantitative traits studied (Tab. 6). Principal component analysis revealed that the first PC accounted for 39.4% of the total variation where NFP had the highest positive loading (0.39) followed by the NFPC (0.381), NFC (0.325), TSS (0.26), NPB (0.228) and AsA content (0.217). The second component accounted for 15.7% of the total variation explained mostly by DFF, DFH, DLH, AsA, and IFW. The third and four-components of the PCA accounted for only 12.0% and 11.4% of the total variation, respectively (Tab. 6).
The increasing demand for high-quality tomato products has resulted in the urgency of continuous collection, characterization and evaluation of unknown tomato genotypes. Additionally, the modern tomato breeding programs have emphasized yield, resistance to biotic and abiotic stresses, and quality attributes [29]. Measurements of morphological traits provide a simple practice of assessing the genetic variation with simultaneous evaluation of genotypes performance under specific growing conditions [30–32]. In the present study, only one genotype showed yellow color fruits. According to Khachik et al. [33], various pigments such as chlorophyll, carotenoids and anthocyanins, etc. are the source of color variations in stems, flowers and fruits. In the current study, most of the genotypes showed indeterminate and semi-determinate growth habits; however, one genotype showed determinate growth habit. Green shoulder was present on immature fruits in two genotypes, whereas it was absent in the rest of the ten genotypes (Tab. 1; Fig. 1). Two types of foliage density were found among the studied genotypes. Green shoulder is also known as the green back; it is a disorder in the tomato fruit often characterized by a persistent, firm green area around the calyx end due to undegraded chlorophyll, while the rest of the fruit is ripe. The disorder is genetically controlled and can be abolished by incorporating the ‘uniform ripening’ gene [34]. Variation was observed among the genotypes for stem hairiness; it ranged from sparse, intermediate to dense (Tab. 1; Fig. 1). Hairiness provides a coating on leaves, stems and fruits. It thus reduces transpiration and reflects sunlight, protecting the more delicate tissues underneath in hot, dry and open habitats [35]. Shape and size constitute integral quality parameters in fruits. The current study revealed variations in fruit shape, fruit cross-section shape and fruit size (Tab. 1). Three different (rounded, oval, long oblong) fruit shapes were recorded in the studied genotypes. On the other hand, two shapes of fruit cross-sections were observed. Fruit size varied from small and medium to large. However, intermediate and large fruit sizes dominated among the accessions studied. This could be attributed to preferential selection where most of the farmers prefer intermediate and large fruit tomatoes as opposed to those that are small sized.
To utilize a specific trait in a tomato breeding program, variation in that specific trait among the available germplasm is required. Analysis of variance revealed significant differences (Tab. 2) among the studied genotypes for all the characters studied including fruit yield, NFP and IFW. Development of early tomato varieties is one of the most important breeding targets in Bangladesh as the tomato price usually decreases during the pick or late harvesting period. Among the studied genotypes, GPB0107 and GPB0120 showed the early flowering and early fruiting characteristics. Therefore, these genotypes can be used in variety development programs to develop early maturing varieties. In case of indeterminate growth, PH is increased with the advancement of time; however, PH ceased in those plants that have determinate growth. PH of the studied tomato genotypes ranged from 63.28–147-67 cm (Tab. 3). Haque et al. [36] also reported similar ranges of PH (47.6–116.6 cm) during the evaluation of tomato genotypes. NPB varied significantly among the studied genotypes ranging from 4.56 to 9.22. Significant variation in NPB was also reported by Sharma et al. [37]. While studying tomato germplasm, Kouam et al. [19] also reported that the NPB ranges from 3.10 to 8.97.
NFC and NFPC showed significant differences in the studied genotypes (Tab. 3). The genotype AVTO0314 produced the highest NFC (9.22) whereas the highest NFPC (9.87) was found in the cherry type tomato Binatomato-10. In the studied genotypes, significant variation was also found for the trait NFP. NFP ranged from 4.78 to 188.44. The highest NFP was found in the cherry type genotype Binatomato-10 whereas the lowest one was found in the genotype BARI Tomato-17. Kouam et al. [19] reported that NFP ranges from 9.17 to 51.53 (Tab. 3). However, the difference among the NFP was probably due to including the cherry tomato (Binatomato-10) in the studied genotypes. In support to our statement, Saha et al. [38] reported that the NFP in cherry type tomato ranges from 113 to 292.
IFW and IFD are the most important determinants in conferring higher yield. In the studied genotypes, a significant variation was observed for IFW and IFD. However, higher IFW and IFD were observed in the genotype BARI Tomato-17, AVTO1429, GPB0107 and AVTO9802. Kouam et al. [19] also reported significant differences in IFW and IFD. Most importantly, the analysis of variance of this study revealed significant differences for FYP. A significant difference in FYP in tomato was also reported by other studies [19,39]. In this experiment, the higher FYP was found in the genotype AVTO0314 (1.52 kg) followed by GPB0107 (1.35 kg), GPB0120 (1.31 kg) and AVTO9802 (1.29 kg) (Tab. 3). Our results are in accordance with the results of Kouam et al. [19] who reported that the FYP in tomato germplasm ranges from 0.422 to 1.98 kg.
DM is the solid contents of a fruit or a plant minus its water content. It is made of structural and non-structural carbohydrates, starch, sugars, oil, pigments, and minerals. Nevertheless, it is important to highlight that the increase of DM% can be evaluated as marginal considering the long-term storage period. A similar range of DM% was also reported by Brezeanu et al. [40] in tomato. The percentage of solids in tomato varies over a wide range due to a number of reasons, especially the cultivar, soil characteristics and water management, and also the amount of rainfall and irrigation during the cultivation period [41]. TSS content is one of the most important traits in terms of the processing industry and selection of fermentation methods/duration during the seed extraction. In the present study, TSS content ranged from 3.67 to 5.60 and the highest value was recorded for Binatomato-10 (Tab. 3). Our results are similar to those of other studies [4,42] where they reported TSS ranging from 4.37% to 5.67% in winter tomato. High levels of AsA content in tomato fruits play a significant role in many aspects of plant life and are also beneficial to human health [43]. In the present study, AsA content ranged from 13.42 to 19.11 mg 100 g−1 with BARI Tomato-14 being the highest. Our findings are within the range of AsA reported by Twomey et al. [44] where they reported that the AsA content in imported tomato ranged from 6.82 to 31.2 mg 100 g−1.
The successful crop breeding mostly depends on the presence of genetic variation along with the inheritance of traits under consideration. The σ2P is the cumulative effect of the σ2G and σ2E. Therefore, generally the σ2P is larger than σ2G. Low differences between σ2P and σ2G suggest higher heritability and a lower influence of the environment on the expression of any specific trait. In the current study, the PCV was not much higher than the corresponding GCV for most of the studied characters (Tab. 4). This suggests that the apparent variation was mainly due to genotypes. The traits NPB, NFC, IFW and TSS showed a very high GCV and PCV (Tab. 4). These findings agree with earlier findings reported in tomato [19,45–47]. As a result, these traits can be improved in an effective way through selection based on phenotypic performance.
Heritability estimates assist breeders to choose plants based on phenotypic performance. A high heritability indicates a high genetic control of aspecific trait. This which helps to select effectively a particular trait for further improvement [48,49]. The estimated h2b in the present study was high for most of the traits (Tab. 4), which suggests that the studied traits are mostly governed by genetic control. This finding implies that genetic improvement of these traits is highly expectable, and selection based on phenotypic expression could be an effective way for trait improvement. This is because genetic constitution played the major role in the expression of these characters.
High h2b and GA together provide the best indication of the degree of improvement that can be achieved through phenotypic selection. High h2b with high GA was found for NFP, NFPC, FYP and IFW. This indicates that the improvement of fruit yield, fruit weight, NFP and NFPC and can be attained through simple selection process. On the other, high h2b along with low GA was observed for DFF, DFH, NPB, IFW and AsA content. This indicates non-additive genetic effects. It also implies that there is an inadequate scope for the advancement of these traits through a simple selection process, however, hybridization followed by selection of progeny can be an effective way [50,51].
Yield is the sum of the many component traits which contributed to it either directly or indirectly. Correlation studies give an idea about the positive and negative associations of different characters with yield, and also among themselves. In the present study, FYP showed a strong positive significant correlation with NFC (Tab. 5). Plant height had a significant negative correlation with FYP (Tab. 5). This indicates that shorter plants have better yield performances because of their determinate growth type. These findings are in harmony with earlier reports by Kumar et al. [52] and Maurya et al. [53]. A highly significant negative correlation was observed between DFH and FYP (Tab. 5). As a result, the yield per plant decreases with an increasing maturity date. This implies that early maturing genotypes have more yields. This is probable because they have a lower exposure to diseases resulting in a higher yields. Similar observations were found for days to maturity by Henareh et al. [54] and Kouam et al. [19]. The above findings suggest that genotypes with higher NFC, shorter PH with determinant growth type and early maturity should be selected for achieving higher yields in tomato.
PCA analysis has been used in different crops including tomato [21,55] to evaluate morphological variation and establish genetic relationships among germplasms. In our study, we found that four PCs explained 78.5% of the total variance; the first two components were responsible for more than 50% of the variability (Tab. 6). PC1 and PC2 revealed that DFF, DFH, DLF, NPB, NFC, NEPC, NFP, FYP, TSS and AsA content were the most important traits responsible for the variation. This implies that the study accessions were highly diverse in most of the evaluated quantitative traits. However, this finding disagrees with that of Agong et al. [56]. These authors reported that the first three PCs were adequate in explaining more than 70% of the phenotypic variation in tomato germplasm.
A considerable variation for the studied traits was observed among the tomato genotypes. Co-efficient of variation studies indicated that the values of the PCV were higher than those of the GCV for all studied traits. High σ2G and σ2P were found for the traits NFP, PH and IFW. The highest h2b was recorded for IFD whereas the highest GA was found for NFP among the studied traits. High GA as a percentage of the mean in connection with high h2b was recorded for the traits NFP, NFC, FYT and IFW. NFC showed a significant positive correlation with FYP. The first four components explained 78.5% of the total variation among the genotypes as revealed through PCA. Our result suggests that NFP, NFC, FYP and IFW could be considered as an important criteria for yield improvement in tomato. Additionally, the promising genotypes (AVTO0314, GPB0107, GPB0120, AVTO9802 and AVTO0102) isolated from this study can be directly used in variety development programs for developing high-yielding tomato varieties.
Acknowledgement: We specially thank Dr. Poly Karmoker and Dr. Md. Anisur Rahman Mazumder (Department of Food Technology and Rural Industries, BAU, Bangladesh) for providing facilities to estimate vitamin-C. We also gratefully acknowledge AVRDC, BARI and BINA personnel for providing the seed materials.
Funding Statement: The authors received no specific funding for this study.
Conflicts of Interest: The authors declare that they have no conflicts of interest to report regarding the present study.
1. Kanski, L., Naumann, M., Pawelzik, E. (2020). Flavor-related quality attributes of ripe tomatoes are not significantly affected under two common household conditions. Frontiers in Plant Science, 11, 472. DOI 10.3389/fpls.2020.00472. [Google Scholar] [CrossRef]
2. FAOSTAT (2019). Food and Agriculture Organization of the United Nations, Statistics Division. Rome, Italy. [Google Scholar]
3. Belew, J., Belew, D., Bantte, K. (2012). Genetic association analysis among some traits of tomato (Lycopersicon esculentum Mill.) genotypes in West Showa. Ethiopia International Journal of Plant Breeding and Genetics, 6, 129–139. DOI 10.3923/ijpbg.2012.129.139. [Google Scholar] [CrossRef]
4. Thapa, R. P., Jha, A. K., Deka, B. C., Reddy, A. N. K., Verma, V. K. et al. (2014). Genetic divergence in tomato grown in subtropical mid-hills of Meghalaya. Indian Journal of Horticulture, 71, 123–125. [Google Scholar]
5. Erika, C., Griebel, S., Naumann, M., Pawelzik, E. (2020). Biodiversity in tomatoes: Is it reflected in nutrient density and nutritional yields under organic outdoor production? Frontiers in Plant Science, 11, 589692. DOI 10.3389/fpls.2020.589692. [Google Scholar] [CrossRef]
6. Singh, S., Singh, N. (2013). Text book of vegetable, tuber crops and spices, pp. 10–28. New Delhi: ICAR. [Google Scholar]
7. Di Mascio, P., Kaiser, S., Sies, H. (1989). Lycopene as the most effective biological carotenoid singlet oxygen quencher. Achieves of Biochemistry and Biophysics, 274, 532–538. DOI 10.1016/0003-9861(89)90467-0. [Google Scholar] [CrossRef]
8. Salim, M. M., Rashid, M., Hossain, M., Zakaria, M. (2020). Morphological characterization of tomato (Solanum lycopersicum L.) genotypes. Journal of the Saudi Society of Agricultural Sciences, 19, 233–240. DOI 10.1016/j.jssas.2018.11.001. [Google Scholar] [CrossRef]
9. Bai, Y., Lindhout, P. (2007). Domestication and breeding of tomatoes: what have we gained and what can we gain in the future? Annals of Botany, 100, 1085–1094. DOI 10.1093/aob/mcm150. [Google Scholar]
10. Hasan, M. M., Bari, M. A. A., Hossain, M. A. (2016). Genetic variability and traits association analysis of tomato (Lycopersicon esculentum L.) genotypes for yield and quality attributes. Universal Journal of Plant Science, 4, 23–34. DOI 10.13189/ujps.2016.040301. [Google Scholar] [CrossRef]
11. Karim, M. R., Rahman, M. S., Alam, M. S. (2009). Profitability of summer BARI hybrid tomato cultivation in jessore district of Bangladesh. Journal of Agriculture and Rural Development, 7(1&2), 73–79. DOI 10.3329/JARD.V7I1.4424. [Google Scholar] [CrossRef]
12. Ali, A. S. M. Y., Reza, M. H., Ali, M., Hossain, M. D., Mahabub, S. T. et al. (2014). Performance of local and exotic hybrid tomato varieties in Bangladesh. International Journal of Natural and Social Sciences, 1, 100–105. [Google Scholar]
13. Reddy, B. R., Reddy, M. P., Begum, H., Sunil, N. (2013). Genetic diversity studies in tomato (Solanum lycopersicum L.). Journal of Agriculture and Veterinary Sciences, 4, 53–55. DOI 10.9790/2380-0445355. [Google Scholar]
14. Osei, M. K., Akromah, R., Shilh, S. L., Green, S. K. (2010). Evaluation of some tomato germplasm for resistance to tomato yellow leaf curls virus disease (TYLCV) in Ghana. Aspects of Applied Biology Journal, 96, 315–323. [Google Scholar]
15. Osei, M. K., Bonsu, K. O., Agyeman, A., Choi, H. S. (2014). Genetic diversity of tomato germplasmin Ghana using morphological characters. International Journal of Plant and Soil Science, 3(3), 220–231. DOI 10.9734/IJPSS/2014/6466. [Google Scholar] [CrossRef]
16. Al-Aysh, F., Al-Serhan, M., Adnan, A. S., Mohammad, A. N., Kutma, H. (2012). Study of genetic parameters and character interrelationship of yield and some yield components in tomato (Solanum lycopersicum L.). International Journal of Genetics, 2, 29–33. [Google Scholar]
17. Chime, A. O., Aiwansoba, R. O., Osawaru, M. E., Ogwu, M. C. (2017). Morphological evaluation of tomato (Solanum lycopersicum Linn.) cultivars. Makara Journal of Science, 21(2), 97–106. DOI 10.7454/mss.v21i2.7421. [Google Scholar]
18. Yadav, A., Tandan, N., Singh, R. (2017). Morphological based genetic variability analysis and clustering of tomato. World Journal of Pharmaceutical and Medical Research, 3(6), 255–261. [Google Scholar]
19. Kouam, E. B., Dongmo, J. R., Djeugap, J. F. (2018). Exploring morphological variation in tomato (Solanum lycopersicumA combined study of disease resistance, genetic divergence and association of characters. Agricultura Tropica et Subtropica, 51(2), 71–82. DOI 10.1515/ats-2018-0008. [Google Scholar] [CrossRef]
20. Ngezahayo, F., Ngendakuriyo, J. C., Bizindavyi, E., Mbonihankuye, C. (2019). Short Communication: Agro-morphological diversity among four tomato cultivars in western Burundi. Biodiversitas, 20, 436–441. DOI 10.13057/biodiv/d200219. [Google Scholar] [CrossRef]
21. Bernousi, I., Emami, A., Tajbakhsh, M., Darvishzadeh, R., Henareh, M. (2011). Studies on genetic variability and correlation among the different traits in Solanum lycopersicum L. Notulae Botanicae Horti Agrobotanici Cluj-Napoca, 39, 152–158. DOI 10.15835/nbha3915859. [Google Scholar]
22. Robinson, H., Comstock, R. E., Harvey, P. (1949). Estimates of heritability and the degree of dominance in corn. Agronomy Journal, 20, 125–131. DOI 10.2134/agronj1949.00021962004100080005x. [Google Scholar]
23. Johnson, H. W., Robinson, H. F., Comstock, R. E. (1955). Estimation of genetic and environmental variability in soybean. Agronomy Journal, 47, 314–318. DOI 10.2134/agronj1955.00021962004700070009x. [Google Scholar] [CrossRef]
24. Narolia, R. K., Reddy, R. V. S. K. (2010). Genetic diversity among tomato [Solanum lycopersicon (Mill.) Wettsd.] genotypes–A review. Agricultural Reviews, 31, 217–223. [Google Scholar]
25. Ghafoor, A., Ahmad, Z., Qureshi, A. S., Bashir, M. (2002). Genetic relationship in Vigna mungo (L.) Hepper and V. radiata (L.) R. Wilczek based on morphological traits and SDS-PAGE. Euphytica, 123, 367–378. DOI 10.1023/A:1015092502466. [Google Scholar]
26. Plummer, D. T. (1971). An introduction to practical biochemistry. New Delhi: Tata McGraw-Hill Pub. Com: Ltd. [Google Scholar]
27. Singh, R. K., Chaudhary, B. D. (1977). Biometrical methods in quantitative genetic analysis. New Delhi: Kalyani Publishers. [Google Scholar]
28. Fehr, W. I. (1987). Principles of cultivar development, pp. 548. New York, USA: Macmillan. [Google Scholar]
29. Foolad, M. R. (2007). Genome mapping and molecular breeding of tomato. International Journal of Plant Genomics, 2007, 1–52. DOI 10.1155/2007/64358. [Google Scholar] [CrossRef]
30. Garcia, E., Jamilena, M., Alvarez, J. I., Arnedo, T., Oliver, J. L. et al. (1998). Genetic relationships among melon breeding lines revealed by RAPD markers and agronomic traits. Theoretical and Applied Genetics, 96, 878–885. DOI 10.1007/s001220050815. [Google Scholar] [CrossRef]
31. Fufa, H., Baenziger, P. S., , Beecher, B. S., Dweikat, I., Graybosch, R. A. et al. (2005). Comparison of phenotypic and molecular marker‐based classifications of hard red winter wheat cultivars. Euphytica, 145, 133–146. DOI 10.1007/s10681-005-0626-3. [Google Scholar] [CrossRef]
32. Shuaib, M., Alam, Z., Zahir, A., Waqar, A., Taufiq, A. et al. (2007). Characterization of wheat varieties by seed storage protein electrophoresis. African Journal of Biotechnology, 6, 497–500. DOI 10.4314/ajb.v6i5.56863. [Google Scholar] [CrossRef]
33. Khachik, F. L., Carvalho, P. S., Bernstein, G. J., Muir, D. Y., Zhao, N. B. K. et al. (2002). Chemistry distribution, and metabolism of tomato carotenoids and their impact on human health. International symposium on the role of tomato products and carotenoids in disease prevention. Experimental Biology and Medicine, 227(10), 845–851. DOI 10.1177/153537020222701002. [Google Scholar] [CrossRef]
34. Grierson, D., Kader, A. A. (1986). Fruit ripening and quality. in Atherton, J. G., Rudich, J. (Eds.The tomato crop, pp. 241–280. New York, London: Chapman and Hall. [Google Scholar]
35. Subhash, C. (2010). Plant physiology, pp. 618. Delhi, India: New Age International (P) Publishers. [Google Scholar]
36. Haque, M. M., Rehman, A. K. M., Hossain, S. M. M. (1998). Physiological and yield potential of some promising tomato lines at different planting times. Pakistan Journal of Agricultural Research, 9(3), 359–362. [Google Scholar]
37. Sharma, S. K., Rastogi, K. B. (1993). Evaluation of some tomato cultivars for seed production under mid hill conditions of Himachal Pardesh. Annals of Agricultural Research, India, 14(4), 494–496. [Google Scholar]
38. Saha, R., Rashid, M. A. R. (2020). Effects of variety and organic manures on growth, yield and quality of cherry tomato under vertical farming. Journal of Bangladesh Agricultural University, 18, 982–992. DOI 10.5455/JBAU.137032. [Google Scholar] [CrossRef]
39. Ali, A., Hussain, I., Khan, A., Khan, J., Rehman, M. U. et al. (2016). Evaluation of various tomato (Lycopersicon esculentum Mill.) cultivars for quality, yield and yield component under agro-climatic condition of Peshawar. ARPN Journal of Agriculture and Biological Sciences, 11, 59–62. [Google Scholar]
40. Brezeanu, P. M., Brezeanu, C., Ambarus, S., Calin, M., Cristea, T. O. et al. (2016). Identification and study of useful germplasm resources for tomato breeding. Acta Horticulture, 1127, 331–338. DOI 10.17660/ActaHortic.2016.1127.52. [Google Scholar] [CrossRef]
41. Jongen, W. (2002). Fruit and vegetable processing, pp. 350. Cambridge, UK: Woodhead Publishing. [Google Scholar]
42. Patwary, M. M. A., Rahman, M. M., Ahmad, S., Miah, M. A. K., Barua, H. (2013). Study of heterosis in heat tolerant tomato (Solanum lycopersicum L.) during summer. Bangladesh Journal of Agricultural Research, 38, 531–544. DOI 10.3329/bjar.v38i3.16980. [Google Scholar] [CrossRef]
43. di Matteo, A., Sacco, A., Anacleria, M., Pezzotti, M., Delledonne, M. et al. (2010). The ascorbic acid content of tomato fruits is associated with the expression of genes involved in pectin degradation. BMC Plant Biology, 10, 163. DOI 10.1186/1471-2229-10-163. [Google Scholar] [CrossRef]
44. Twomey, D. G., Goodchild, J. (1970). Variations in the vitamin C content of imported tomatoes. Journal of the Science of Food and Agriculture, 26(6), 313. DOI 10.1002/jsfa.2740210610. [Google Scholar]
45. Tasisa, J., Belew, D., Bantte, K., Gebreselassie, W. (2011). Variability, heritability and genetic advance in tomato (Lycopersicon esculentum Mill.) genotypes in West Shoa. Ethiopia American–Eurasian Journal of Agricultural & Environmental Sciences, 11, 87–94. [Google Scholar]
46. Meena, O. P., Bahadur, V., Jagtap, A. B., Saini, P., Meena, Y. K. (2015). Genetic variability studies of fruit yield and its traits among indeterminate tomato genotypes under open field condition. African Journal of Agricultural Research, 10, 3170–3177. DOI 10.5897/AJAR2015.9614. [Google Scholar]
47. Dutta, P., Hazari, S., Karak, C., Talukdar, S. (2018). Study on genetic variability of different tomato (Solanum lycopersicum) cultivars grown under open field condition. International Journal of Chemical Studies, 6(5), 1706–1709. [Google Scholar]
48. Dhanwani, R. K., Sarawgi, A. K., Solanki, A., Tiwari, J. K. (2013). Genetic variability analysis for various yield attributing and quality traits in rice (O. sativa L.). The Bioscan: An International Quarterly Journal of Life Science, 8(4), 1403–1407. DOI 10.3329/jbau.v15i1.33525. [Google Scholar]
49. Islam, M. A., Raffi, S. A., Hossain, M. A., Hasan, A. K. (2015). Analysis of genetic variability, heritability and genetic advance for yield and yield associated traits in some promising advanced lines of rice. Progressive Agriculture, 26, 26–31. DOI 10.3329/pa.v26i1.24511. [Google Scholar] [CrossRef]
50. Meitei, K. M., Bora, G. C., Singh, J. S., Sinha, K. A. (2014). Morphology based genetic variability analysis and identification of important characters for tomato (Solanum lycopersicum L.) crop improvement. American-Eurasian Journal of Agricultural & Environmental Sciences, 14(10), 1105–1111. DOI 10.5829/idosi.aejaes.2014.14.10.12434. [Google Scholar] [CrossRef]
51. Meena, O. P., Bahadur, V. (2014). Assessment of genetic variability, heritability and genetic advance among tomato (Solanum lycopersicum L.) germplasm. Agricultural Science Digest, 27, 185–192. [Google Scholar]
52. Kumar, R., Ram, C. N., Yadav, G. C., Deo, C., Vimal, S. C. et al. (2014). Studies on correlation and path coefficient analysis in tomato (Solanum lycopersicon L.). Plant Archives, 14(1), 443–447. [Google Scholar]
53. Maurya, S., Singh, A., Singh, S., Kumawat, O. M. (2020). Traits association analysis for yield and quality attributes of tomato (Lycopersicon esculentum L.). Journal of Pharmacognosy and Phytochemistry, 9, 1019–1023. [Google Scholar]
54. Henareh, M., Dursun, A., Mandoulakani, B. A. (2015). Genetic diversity in tomato landraces collected from Turkey and Iran revealed by morphological characters. Acta Scientiarum Polonorum-Hortorum Cultus, 14, 87–96. [Google Scholar]
55. Gerrano, A. S., Adebola, P. O., van Rensburg, W. S. J., Laurie, S. M. (2015). Genetic variability in cowpea (Vigna unguiculata L. Walp.) genotypes. South African Journal of Plant and Soil, 32, 165–174. DOI 10.1080/02571862.2015.1014435. [Google Scholar] [CrossRef]
56. Agong, S. G., Schittenhelm, S., Friedt, W. (2001). Genotypic variation of Kenyan tomato (Lycopersicon esculentum L.) germplasm. Plant Genetic Resources Newsletter, 123, 61–67. DOI 10.4314/jfta.v6i1.19277. [Google Scholar] [CrossRef]
 | This work is licensed under a Creative Commons Attribution 4.0 International License, which permits unrestricted use, distribution, and reproduction in any medium, provided the original work is properly cited. |