International Journal of
Experimental Botany
| Phyton- International Journal of Experimental Botany |
DOI: 10.32604/phyton.2021.015295
ARTICLE
Identification of Single Nucleotide Polymorphisms and Analysis of Linkage Disequilibrium in Different Bamboo Species Using the Candidate Gene Approach
1Fujian Provincial Key Laboratory of Resources and Environment Monitoring & Sustainable Management and Utilization, Sanming University, Sanming, 36504, China
2Research Institute of Forestry, Chinese Academy of Forestry, Key Laboratory of Tree Breeding and Cultivation, State Forestry Administration, Beijing, 100091, China
*Corresponding Author: Changjun Ding. Email: changjund@126.com
Received: 07 December 2020; Accepted: 02 March 2021
Abstract: Bamboos are one of the most beautiful and useful plants on Earth. The genetic background and population structure of bamboos are well known, which helps accelerate the process of artificial domestication of bamboo. Partial sequences of six genes involved in nitrogen use efficiency in 32 different bamboo species were analyzed for occurrence of single nucleotide polymorphisms (SNPs). The nucleotide diversity θw and total nucleotide polymorphisms πT of the sequenced DNA regions was 0.05137 and 0.03332, respectively. Both πnonsyn /πsyn and Ka/Ks values were <1. The nucleotide sequences of these six genes were inferred to be relatively conserved, and the haplotype diversity was relatively high. The results of evolutionary neutrality tests showed that the six genes were in line with neutral evolution, and that the NRT2.1 and AMT2.1 gene sequences may have experienced negative selection. An inter-SNP recombination event at the NRT2.1 gene in the all pooled sample, of all 32 bamboo species was the lowest at 0.0645, whereas the AMT gene recombination events were all >0.1. Estimation and analysis of linkage disequilibrium of five genes revealed that with the increase in nucleotide sequence length, the degree of SNP linkage disequilibrium decreased rapidly. We inferred the population genetic structure of 32 bamboo species based on the SNP loci of six genes with frequencies >18%. 32 bamboo species were divided into five categories, which indicated that the combined population of all bamboo species had obvious multivariate characteristics and was heterogeneous; red (Group 1) and green (Group 2) were the main groups.
Keywords: Bamboo; nitrogen use efficiency; single nucleotide polymorphism; linkage disequilibrium
Bamboos are in the subfamily Bambusoideae in the family Poaceae, and they are perennial, evergreen, monocotyledonous plants. It is a group with a unique morphology and structure within the grass family, and they are special evolutionarily. Their stems (stalk) are highly lignified, and their vegetative growth cycle is long. Bamboos rely mainly on vegetative reproduction, and after bamboo flowers, the entire bamboo forest dies, which results in difficulties in obtaining reproductive organs. The external forming characteristics like leaves and stems, which are often used for classification, are highly variable due to the environment, which makes the study of the classification and genetic evolution of bamboos more difficult. There is immense scope for studying the genetic evolution of bamboos at the molecular level and the inherent differences in their genetic material.
To increase crop yield, large amounts of nitrogen fertilizer are applied. Nevertheless, the use of N fertilizers is rather inefficient. Approximately 50–70% of the applied N vanishes from the plant-soil system, which results in enrichment of the reactive N compounds in the atmosphere that pollutes the ground and surface waters. The environmental damage associated with the use of N-based fertilizers is becoming more significant on a local, regional, and global scale [1,2]. The effect of the negative environmental and economic impact could be reduced through better agronomic practices and the utilization of N-efficient cultivars with improved nitrogen use efficiency (NUE) [3]. Because NUE is determined by multiple genetic factors and is heavily influenced by the environment, its genetic dissection in plants is quite challenging [4]. In addition, the diverse genotypes combined with the environmental interaction factor make the investigation even more difficult. The identification of a major gene (i.e., has a big effect size) that controls NUE by itself is quite unlikely. Rather, investigation of many genes or quantitative trait loci (QTLs) with minor or moderate effects will lead us to understand the complexity of NUE [5].
Genes are essential for controlling the expression of important agronomic traits, and they usually harbor complex, multiple, quantitative trait loci that can be identified by genetic mapping and molecular identification of the functional loci. Gene families of ammonium (AMT) and nitrate (NRT) transporters in poplar have considerable effect on the efficiency of nitrogen uptake and utilization [6,7]. Molecular markers that were not affected in the genome by environmental and genetic variations were used to identify plant varieties for use as genetic resources [8].
Understanding the patterns of linkage disequilibrium (LD) in germplasm and breeding collections is relevant for applied genetic studies that screen for genomic regions or QTLs that underlie traits of agronomic interest. In particular, the scale at which LD decays is a main factor to be considered for evaluation of the density of markers necessary to achieve sufficient power in association mapping or genomic selection approaches [9]. Bamboos are outcrossing species with a large and complex genome, high genetic heterozygosity, and low LD. LD mapping has higher accuracy than traditional QTL mapping [10]. This is particularly important in species such as bamboo and other long-lived outcrossing species [5]. Although genetic diversity and genetic structure have been investigated in various collections of bamboos, investigations into LD patterns have been scarce to date.
There is significant genetic variation in NUE among bamboos, which indicates that there is genetic potential for NUE in bamboos [4]. Genetic diversity is a fundamental aspect of crop improvement. Therefore, effective utilization of genetic resources in breeding programs is essential as long as this diversification integrates functionally useful genes [11]. Population genetics is a discipline that studies the genetic structure and changes in populations, and its main research tool is the identification of polymorphisms in DNA sequences. The outcomes of genetic diversity and population stratification accelerate the effective protection and reproduction of useful species. Further, such inferences expedite effective conservation, breeding, and genetic improvement efforts [12]. Little is known about the genetic diversity or population structure of bamboo germplasms [13]. With their low rate of molecular evolution, the predominant obstacle for population genetic studies in Bambusoideae is the lack of genetic identification of sufficiently variable molecular markers [14]. Single nucleotide polymorphisms (SNPs) are an endless resource of polymorphic markers that can be used to construct high-resolution genetic maps and maps that are based on the correlation of candidate genes or the entire genome. For direct analysis of LD mapping of SNP markers and target markers with high resolution, especially for outcrossing plants with high genetic heterozygosis and a low LD value and LD mapping ratio, such as bamboo, LD mapping of SNP markers has higher accuracy than LD mapping of target markers [10].
Many scholars use SSR, SRAP, RAPD, and ISSR to analyze the genetic diversity of bamboo plants [13,15–20]. According to previous analyses, bamboos have greater genetic diversity between species, whereas there is lower genetic diversity within species. Wang et al. collected the homologous RADs of two Arundinaria faberi populations and Yushania brevipaniculata populations to study phylogenetic relationships among temperate woody bamboos [14]. We sequenced these 6 genes to identify single nucleotide polymorphisms and analyzed the relationships between SNPs and nitrogen use efficiency to identify genetic resources resulting from high N application. This study could enhance nitrogen absorption and utilization abilities of the bamboo.
The 32 bamboo species used in this study are listed in Tab. 1, the species were morphologically identified and young leaves were collected from the Fuzhou Botanical Garden.

2.2.1 Genomic DNA Extraction and Amplification of the Homologous Sequences of AMT and NRT Genes
DNA was extracted from tender leaves using a plant genomic DNA extraction kit (Beijing TIANGEN, China), which followed the manufacturer’s instructions.
The nucleic acid sequences of AMT and NRT genes that have been cloned were searched in the nucleic acid database at the National Center for Biotechnology Information (https://www.ncbi.nlm.nih.gov). The sequences were aligned, and primers were designed based on the conserved regions of AMT and NRT genes. The primers were synthesized by Shanghai Biotechnology Service Co., Ltd., Shanghai, China (Tab. 2).

2.2.2 Polymorphismin the Homologous Sequences of AMT and NRT Genes
Polymorphic sites were identified and counted by visually inspecting sequence alignments for each locus. The corresponding chromatogram files were assessed to confirm the absence of overlapping peaks and to evaluate each polymorphic site.
DnaSP 6.0 (http://www.ub.es/dnasp/) software was used to analyze the six sequences and to calculate SNP frequency, to evaluate the number of SNPs converted and transposed, and to estimate the level of nucleotide diversity and evolution of each gene.
Sequence analysis of six genes was performed using DnaSP 6.0. Nucleotide diversity was estimated by Watterson’s θw, π, and the average number of pairwise nucleotide differences among sequences in a sample. The number of haplotypes (h) and the haplotype diversity (Hd) for each gene were also estimated as described by Nei et al. [21]. The minimum number of historical recombination events (RM) was also computed using a four-gamete test in DnaSP 6.0.
2.2.3 Estimation of Linkage Disequilibrium
The LD descriptive statistic (r2) value between pairs of informative SNP sites in candidate genes was calculated using Tassel software and by fitting the equation obtained using pooled r2 values with the Origin 8 package.
2.2.4 Population Structure and Association Analysis
SNP loci with a frequency of >18% in the six genes were selected, and a total of 65 SNP loci was used. The model-based program STRUCTURE 2.3.4 was used to infer subgroups with distinctive allelic frequencies using a burn-in of 1,000 and a run length of 1,000. An individual was assigned to a group if >60% of its genome fraction was derived from that group. Five runs of the structure program were performed, and the average likelihood value L(K) was calculated for each K across all runs. The model criterion for detecting the most probable value of K was DK, which was an ad hoc quantity related to the second-order change in the log probability of data with respect to the number of clusters inferred by the structure program [22]. The population structure matrix (Q) identified at K = 4 was used as the number of model-based populations (Fig. 1).
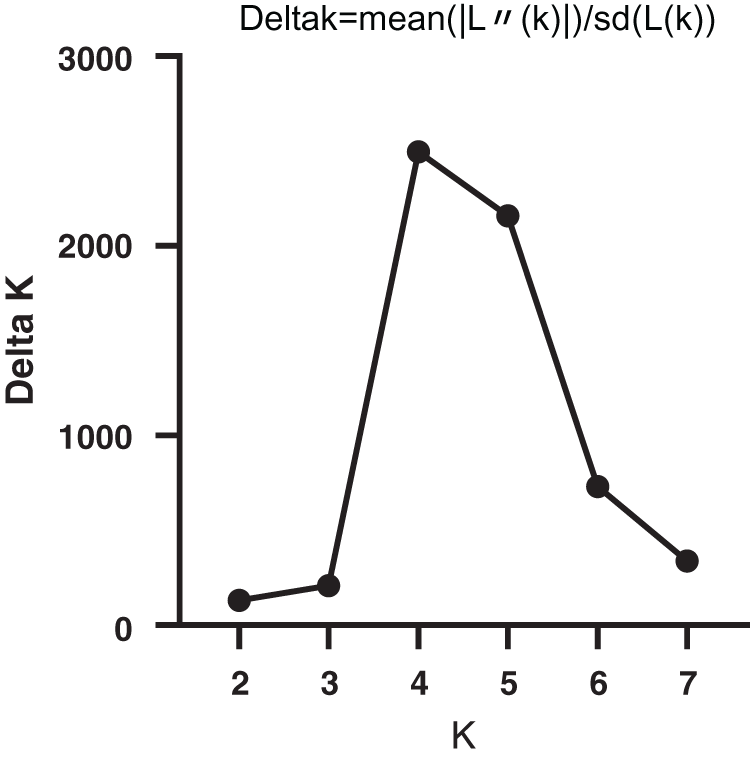
Figure 1: Relationship between K and ΔΚ based on STRUCTURE analysis of bamboos genotypes based on SNPmarker data
Nucleotide diversity (π) refers to the possibility that each nucleotide in a gene sequence is replaced randomly in the population, and it reflects the degree of genetic variation. Six gene sequences were analyzed using DnaSP 6.0 to calculate the correlation coefficient of nucleotide diversity of each candidate gene (Tab. 3). The nucleotide levels of these six genes were not the same. In general, a high level of DNA polymorphisms was found in bamboo. Genetic variation at the nucleotide level was estimated from the mean nucleotide diversity (πT = 0.03332) and from the number of segregating sites (θw = 0.05137), but the nucleotide diversity of each gene was different. Synonymous mutation diversity (πsyn = 0.06379) was higher than non-synonymous mutation diversity (πnonsyn = 0.02286), which indicated that the degree of genetic variation in the detected synonymous mutations was slightly greater than that of non-synonymous mutations.
We calculated the non-synonymous substitution and synonymous substitution ratio (Ka/Ks) of a protein-coding gene to determine whether this gene was positively selected. The Ka/Ks values of the six candidate genes were all <0.5, which suggested that these genes were affected by negative selection, and their nucleotide sequences were relatively conserved.
Haplotype diversity refers to the frequency of two different haplotypes that are selected randomly in a sample. High haplotype diversity in a population indicates that the population has high genetic diversity and rich genetic resources. Haplotype diversity of the six candidate genes was high. In the process of species evolution, genetic recombination is an important driving force for breaking LD, improving heterozygosity, and increasing genetic diversity. Estimation of the smallest historical recombination event (RM) using the four gamete test showed that the RM values of the six candidate genes were between 2 and 19, AMT3.1 had the largest value, and NRT1.2 had the smallest value.

3.2 Detection of Evolutionary Neutrality
Calculations of Tajima’s D, Fu and Li’s test, and Fay and Wu’s H were used to analyze the intraspecific polymorphisms of the 32 bamboo species (Tab. 4). Testing the six candidate genes by calculating Tajima’s D showed that all Tajima’s D values were negative, which indicated that purifying selection or slightly harmful mutations must have occurred in the 32 different bamboo species tested. For genes NRT2.1 and AMTT2.1, Tajima’s D and Fu and Li’s test resulted only in significant negative values. Tajima’s D could have been significantly negative because of deleterious mutations that occurred in bamboo. These mutations were subject to negative selection, so the ratio of these mutations was kept low in the population. At the same time, the results of Fay and Wu’s H for these two genes were not significant, so a negative selection effect was possible [20].
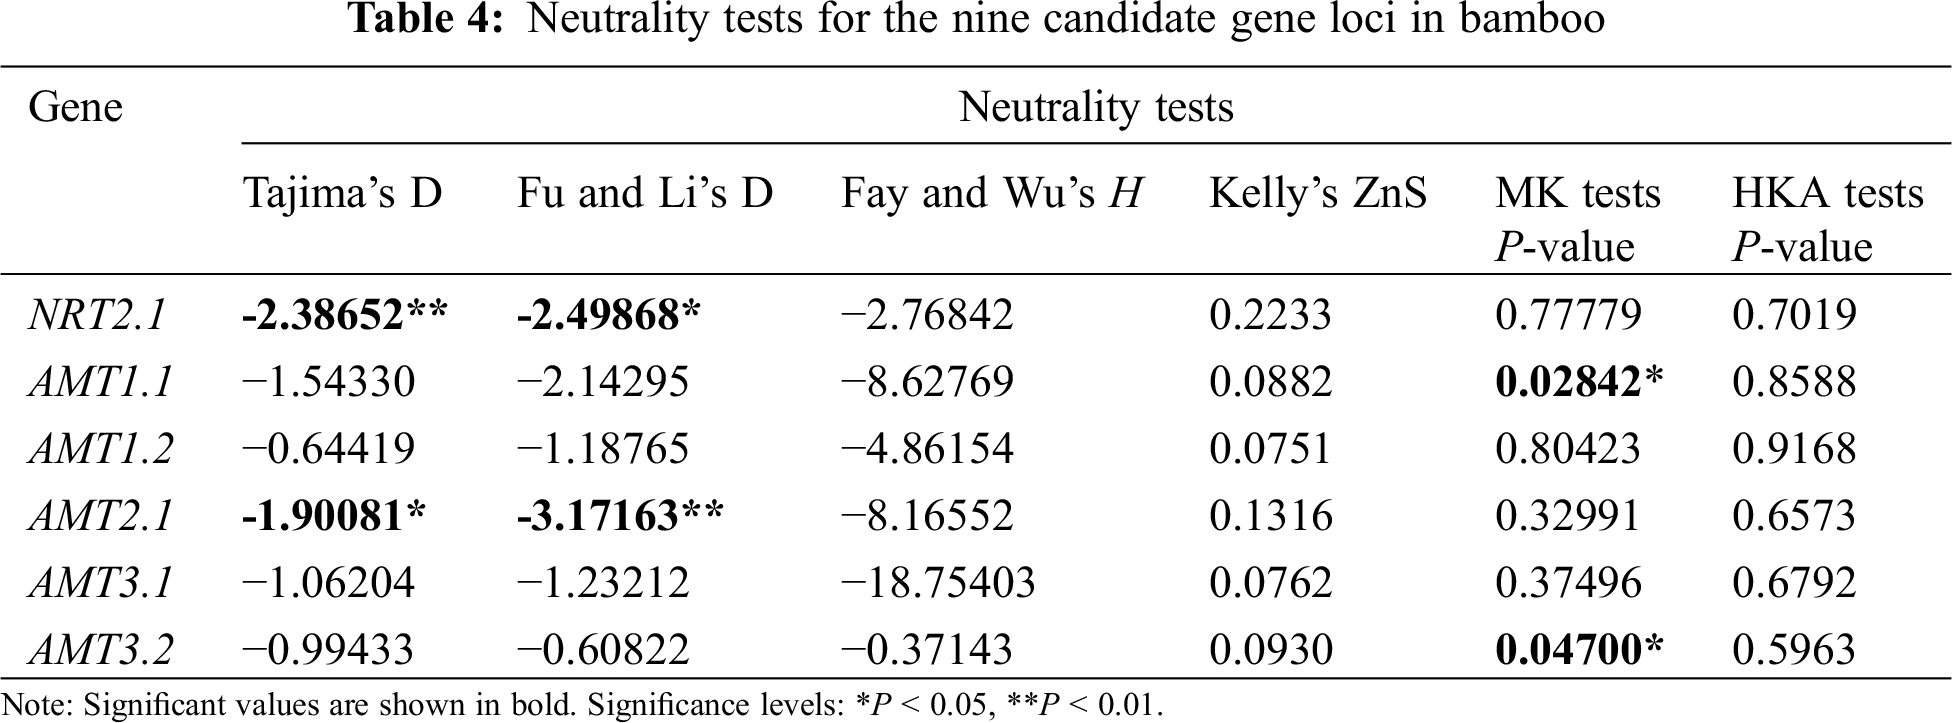
MK test values of AMTT1.1 and AMT3.2 were significantly different. This indicated that the number of missense mutations between the two genes was greater than the expected value based on intraspecies polymorphisms, so it can be inferred that the species harbored the gene. There was a selection effect between ZnS and HKA. The results of the six genes were not significant. The sequence variation in these six genes was consistent with the neutral model, which suggested that these six genes were under selection [20].
3.3 Decay of Linkage Disequilibrium
To estimate LD decay, 8379 informative sites were evaluated using the r2 measure. Significance testing using Fisher’s exact test showed that 554 sites were significant at the 0.05 level (Fig. 2). Because only seven sites were significant at the 0.05 level in the NRT2.1 gene, LD estimation was performed on the remaining five genes in this study (Fig. 3). A low level of LD was observed within the five genes. LD decayed rapidly within genes, with r2 dropping below 0.1 within 100 bp in the AMT2.1 gene. r2 was also reduced for the other four genes. To minimize the deviation of estimated results that may be caused by small experimental samples and low-frequency, rare SNP sites, this study used LD data (r2 value) from all six genes for comprehensive analysis. The goal was to understand the linkage disequilibrium landscape in the bamboo genome as a whole (Fig. 3F). We inferred that the degree of LD in the DNA region detected in bamboo species was very low, and LD disappeared within 500 bp (Fig. 3).
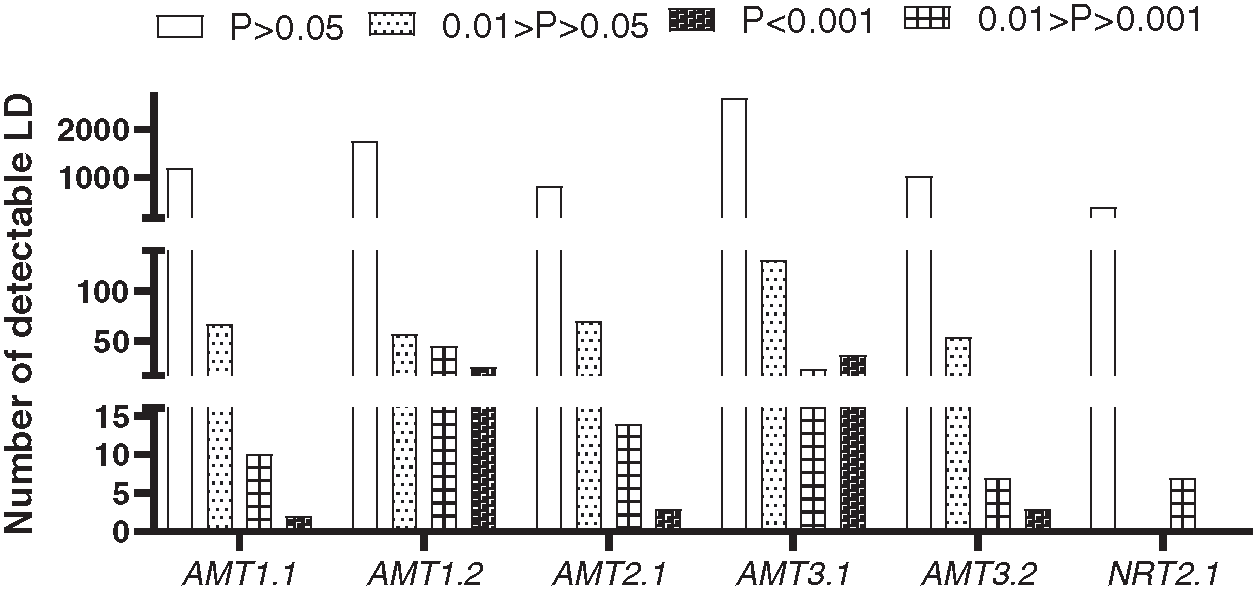
Figure 2: Histogram of r2 values based on the significance of linkage disequilibrium among genes in 32 species of bamboo
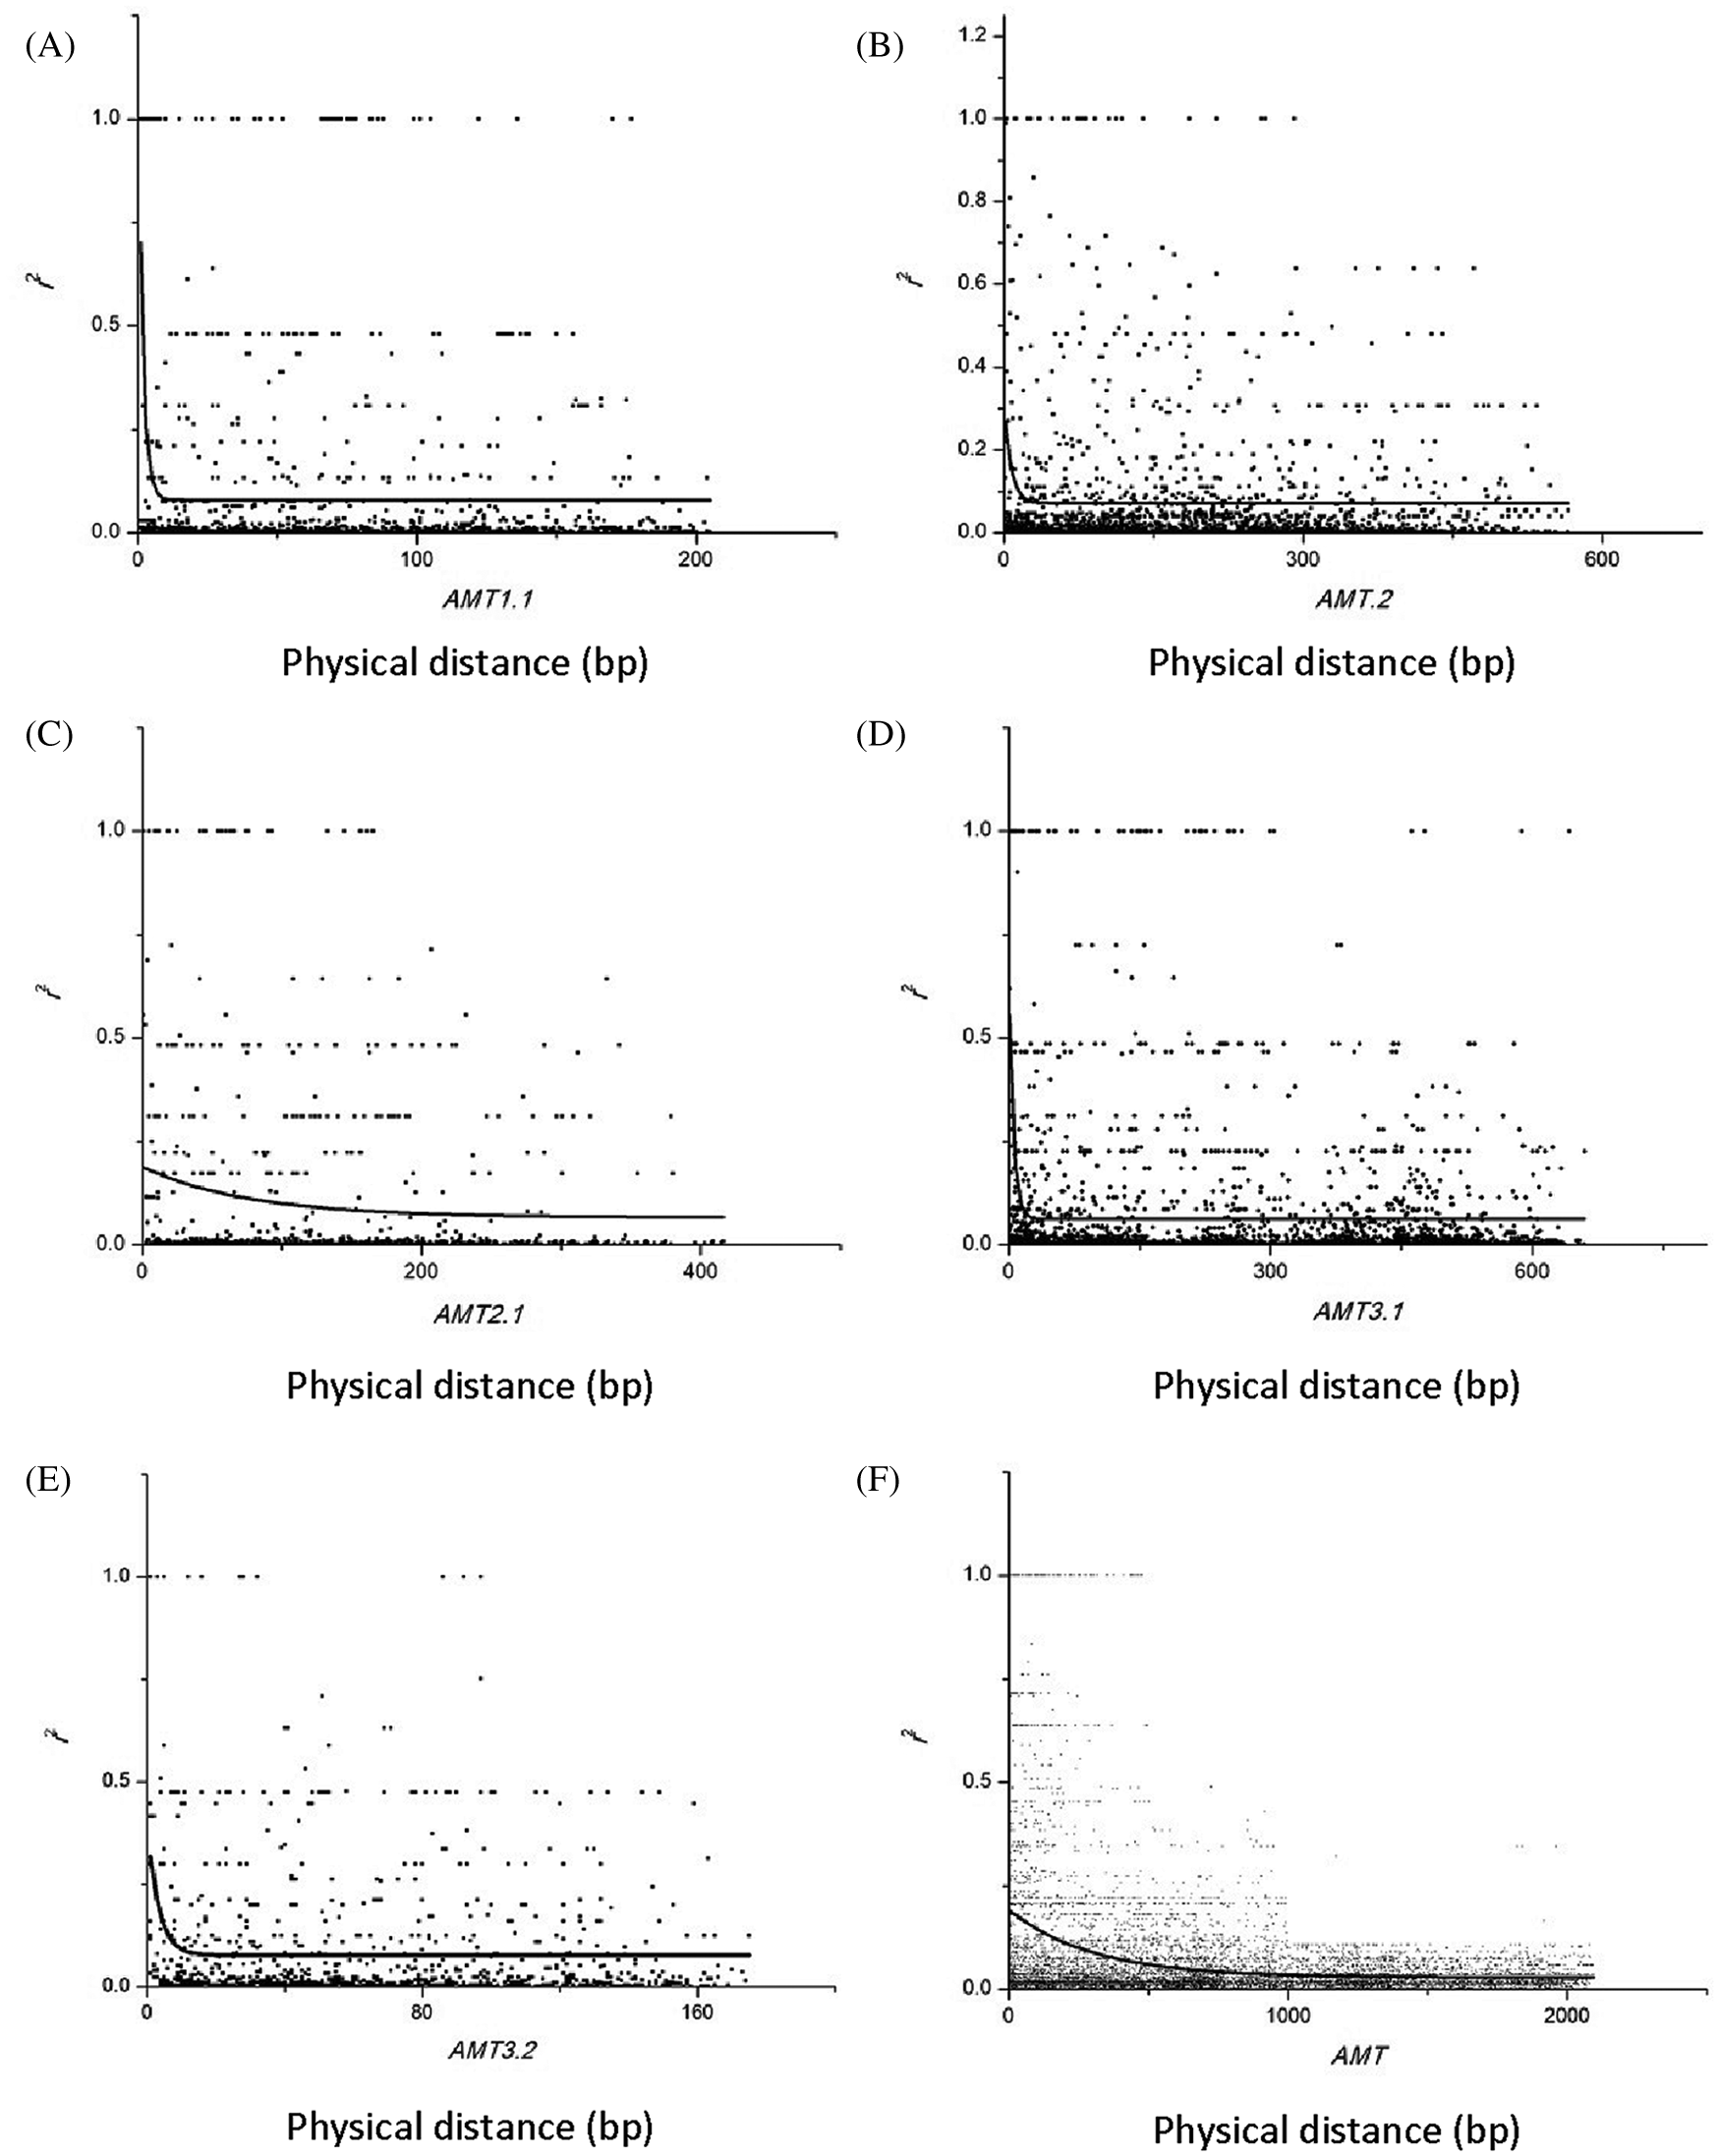
Figure 3: Decay of linkage disequilibrium with distance in the base pairs between sites in five candidate genes. (A) Decay of linkage disequilibrium with distance in the base pairs between sites in AMT1.1. (B) Decay of linkage disequilibrium with distance in the base pairs between sites in AMT1.2. (C) Decay of linkage disequilibrium with distance in the base pairs between sites in AMT2.1. (D) Decay of linkage disequilibrium with distance in the base pairs between sites in AMT3.1. (E) Decay of linkage disequilibrium with distance in the base pairs between sites in AMT3.2. (F) Decay of linkage disequilibrium with distance in the base pairs between sites in AMT gene
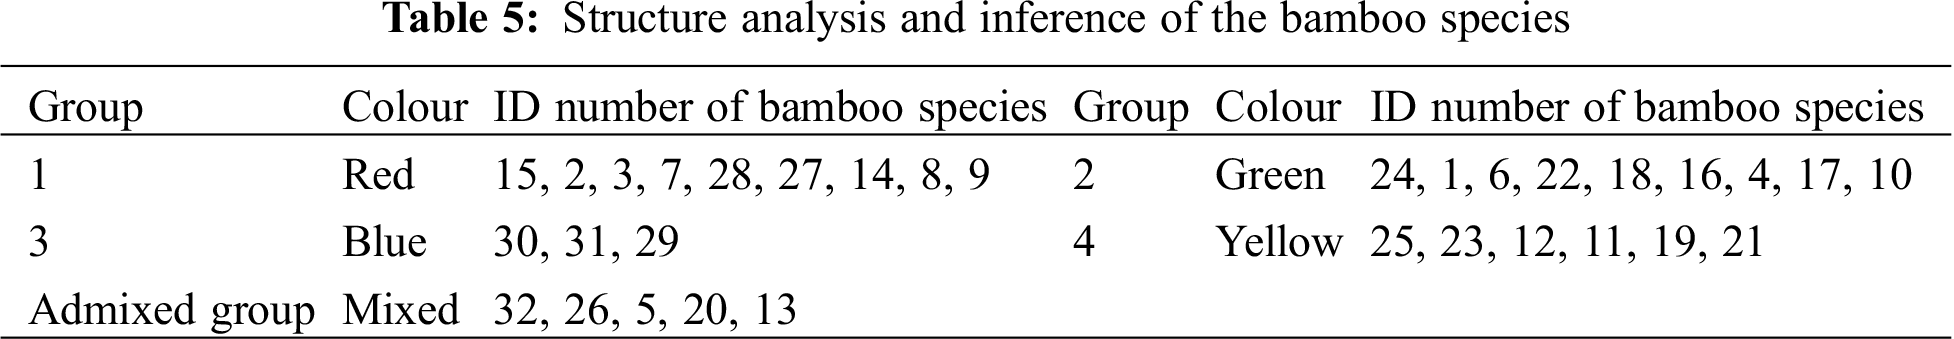
The population structure of the 32 bamboo species was inferred initially using STRUCTURE 2.3.4 [22], and the peak of delta K was observed at K = 4, which indicated the presence of the four main populations (clusters Q1–Q4) in the 32 bamboo species (Fig. 3). The five populations (Group 1, Group 2, Group 3, Group 4, and the admixed group) represented nine (28.1%), nine (28.1%), three (9.4%), six (18.8%), and five (15.6%) of the 32 bamboo species (Fig. 4a), respectively, based on the standard q-value of 60% (Fig. 4b). The yellow groups of germplasm (Group 4) were all Bambusa. According to available bamboo categorization literature [16,18], blue (Group 3) and yellow (Group 4) were temperate woody bamboos, and red (Group 1) were tropical woody bamboos (Tab. 5).
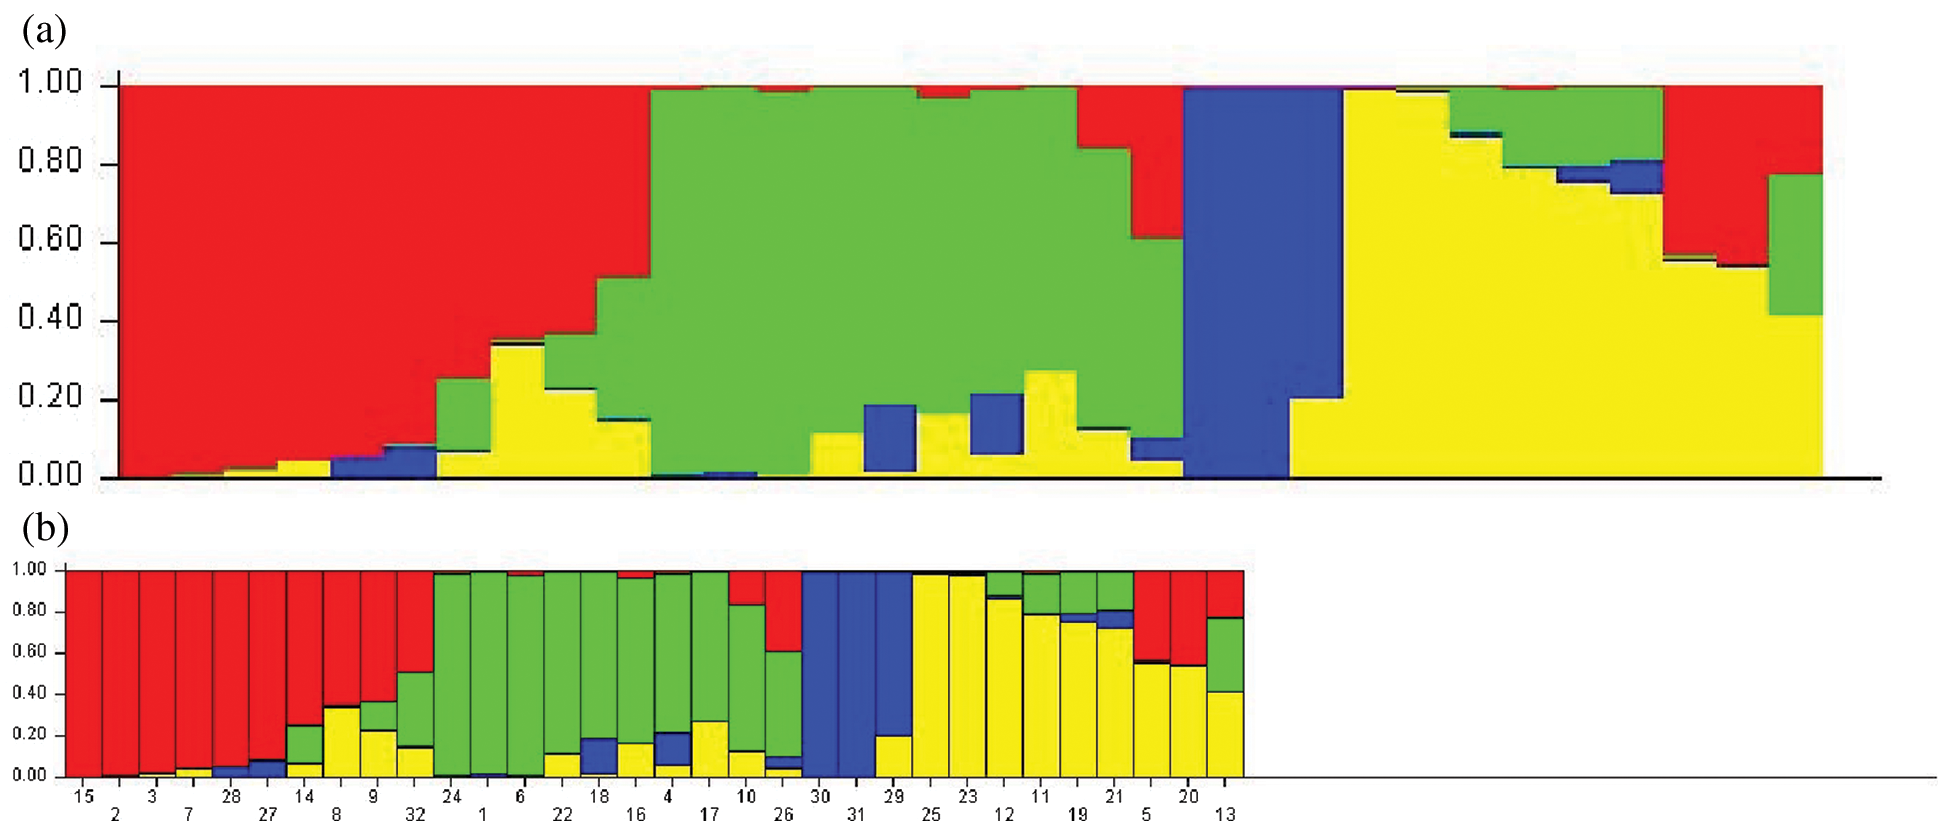
Figure 4: a: Inferred population structure of 32 bamboo accessions with different geographical origins. Each sample is marked by a single vertical line. Each color represents a genetic cluster. b: Vertical bars represent individual baboo lines. The area of different colors illustrates the proportion of each subpopulation based on these SNPs markers
Genetic diversity contributes to evolutionary potential, disease tolerance, adaptation to changing environments, and even ecosystem function [23]. Generally, long-lived outcrossing species with a wide geographical distribution tend to maintain a high level of genetic diversity with lower genetic differentiation [24]. However, despite the outcrossing nature and wide distribution range of bamboo, populations can differentiate genetically overtime due to several factors, such as flowering and breeding behavior, population size, habitat fragmentation, and gene flow [25]. Among the 32 bamboo species tested, although 19 were Bambusa plants, nucleic acid sequences related to NUE genes had a high degree of nucleotide diversity, perhaps because of the longevity of Bambusa plants, outcrossing, or self-incompatibility, which results in higher genetic variation at the species level and lower differentiation among populations [26,27]. The high genetic variation within the population of M. baccifera was expected because it is a long-lived woody bamboo with a prolonged vegetative phase [28]. Self-incompatibility is another important factor that can maintain high genetic variability within a population [29].
The evolutionary neutrality test showed that sequence variation in the six genes was in line with the neutral model, which suggested that these six genes experienced positive selection, especially the two gene sequences of NRT2.1 and AMT2.1, which may have been subjected to negative selection. The extent of pollen and seed dispersal to distant locations determines the flow of genes from one population to another [30]. Long-lived bamboo species are in the vegetative stage and undergo widespread asynchronous flowering events throughout their life cycle, which results in a flowering population that is less likely to mate with a flowering population in another year or later. This temporal reproductive isolation hinders the flow of genes between populations. The long distances, long flowering intervals (30–40 y), and highly outcrossing populations of bamboo species are the causes of low gene flow among populations [12].
Mutations can lead to new polymorphisms, and recombination can weaken LD within the chromosome through recombination of mutated sequences. The degree of LD is inversely proportional to the recombination rate. During evolution, genetic recombination is an important driver to break LD and increase the heterozygosity and diversity [31]. In the current study, with the exception of the relatively low recombination rate of the NRT2.1 gene, genes had a high recombination rate. With the increase in nucleotide sequence length, the degree of SNP linkage disequilibrium decreased rapidly. This observation might be due to the evolutionary history, distribution range, mating system, and reproductive capacity of the population. Pinus sylvestris is an outcrossing species with a very wide distribution, which has resulted in a high recombination rate [32]. Arabidopsis thaliana is known to be extremely easily inbred, which has resulted in low effective recombination rates [33]. According to the latest genomic analysis, gramineous crops, such as rice, have undergone whole genome duplication. Through sequence analysis, clear traces of the genomic doublet can be seen in the rice genome. At the same time, rice experienced a recent chromosomal segment duplication [34,35]. Whether these major genetic events have increased the recombination events in the bamboo genome remains to be further studied and confirmed.
The evolutionary process for bamboo species also leads to different nitrogen utilization efficiencies. To avoid false positives at SNP functional sites, we screened SNP sites with a high frequency and analyzed the genetic structure for 32 bamboo species using structure software. Thirty-two bamboo species were divided into five categories; blue (Group 3) and yellow (Group 4) were temperate woody bamboos, and red (Group 1) were tropical woody bamboos (Fig. 4a). The differentiation of these two groups could be due to the genetic distance. Phyllostachys species belong to the temperate woody bamboo group, and Dendrocalamus is affiliated with tropical woody bamboos [36]. These two genera diversified at the beginning of bamboo evolutionary history and preserved distinct genetic elements [37]. Temperate woody bamboos are notorious for being a taxonomically difficult group with a low rate of molecular evolution [38].
Interestingly, Bambusa eutuldoides var. basistriata McClure and Bambusa eutuldoides McClure were relatively close, yet they were divided into two different groups. The same was true for Bambusa vulgaris ‘Wamin’ and Bambusa vulgaris Schrader ex Wendland ‘Vittata’. This observation is presumed to be the result of intervention by artificial selection. Regardless of the true level of genetic diversity in the wild material, the high genetic diversity in the cultivated material could indicate a scenario that involved a weak bottleneck at domestication, possibly complemented by the diversity of uses and the contrasting environmental conditions experienced in the production areas worldwide [39]. Therefore, we should understand the genetic diversity and population structure of different bamboo species to select the hybrid parent bamboo species effectively and to opt for the best genetic differentiation in the process of artificial breeding of bamboo species.
Based on analysis of single nucleotide polymorphisms of the homologous sequences from six genes of 32 bamboo species, the total nucleotide diversity θw and πT were 0.05137 and 0.03332, respectively. πnonsyn/πsyn and Ka/Ks values were <1. The nucleotide sequences of these six genes were relatively conserved, and haplotype diversity was relatively high. Except for NRT2.1 and AMT2.1, for which the number of recombination events was lower at two and six, respectively, the number of recombinations of the other four genes was >10.
The evolutionary neutrality test showed that Tajima’s D and Fu and Li’s test results for genes NRT2.1 and AMT2.1 were significant negative values, although Fay and Wu’s H, the MK test, and HKA test values were not significant. Therefore, the two gene sequences may have been subject to a selection effect. MK test values of the AMT1.1 and AMT3.2 genes were significantly different, which indicated that the number of missense mutations of these genes between species was greater than the expected value that was obtained by intraspecies analysis. Therefore, we inferred that these genes were under selection pressure among species. The results of ZnS and HKA tests were not significant. The sequence variations in these six genes were consistent with the neutral model, which suggested that these six genes underwent selection among species.
By estimating the linkage disequilibrium of six genes, a total of 8379 r2 values between SNP sites was obtained, of which 554 sites had significant linkage disequilibrium. LD estimation analysis of five genes showed that, with the increase in length in nucleotide sequences, the degree of SNP linkage disequilibrium was reduced rapidly. In the current study, the genetic structure of the population was inferred from the SNP site frequency that the occurrence of six genes was >18% in bamboo populations. The bamboo species were divided into five groups, which indicated that the germplasm sources for bamboo populations had obvious diversity and heterogeneity, and red first (Group 1) and green (Group 2) were the main groups (Fig. 4a). Blue (Group 3) and yellow (Group 4) were temperate woody bamboo, and red (Group 1) was tropical woody bamboo (Fig. 4a).
Funding Statement: This study was financially supported by the National Natural Science Foundation of China (41301346), the Natural Science Foundation of Fujian Province (2020J01375), and the Natural Science Foundation of Fujian Province (2015N0034).
Conflicts of Interest: The authors declare that they have no conflicts of interest to report regarding the present study.
1. Good, A. G., Shrawat, A. K., Muench, D. G. (2004). Can less yield more? Is reducing nutrient input into the environment compatible with maintaining crop production? Trends in Plant Science, 9(12), 597–605. DOI 10.1016/j.tplants.2004.10.008. [Google Scholar] [CrossRef]
2. Dobermann, A., Cassman, K. G. (2005). Cereal area and nitrogen use efficiency are drivers of future nitrogen fertilizer consumption. Science in China Series C: Life Sciences, 48(2), 745–758. [Google Scholar]
3. An, D., Su, J., Liu, Q., Zhu, Y., Tong, Y. et al. (2006). Mapping QTLs for nitrogen uptake in relation to the early growth of wheat (Triticum aestivum L.). Plant and Soil, 284(1), 73–84. DOI 10.1007/s11104-006-0030-3. [Google Scholar] [CrossRef]
4. Xu, G., Fan, X., Miller, A. J. (2012). Plant nitrogen assimilation and use efficiency. Annual Review of Plant Biology, 63(1), 153–182. DOI 10.1146/annurev-arplant-042811-105532. [Google Scholar] [CrossRef]
5. Han, M., Okamoto, M., Beatty, P. H., Rothstein, S. J., Good, A. G. (2015). The genetics of nitrogen use efficiency in crop plants. Annual Review of Genetics, 49(1), 269–289. DOI 10.1146/annurev-genet-112414-055037. [Google Scholar] [CrossRef]
6. Wu, X. Y., Yang, H., Qu, C. P., Xu, Z. R., Li, W. et al. (2015). Sequence and expression analysis of the AMT gene family in poplar. Frontiers in Plant Science, 6, 337. [Google Scholar]
7. Bai, H., Euring, D., Volmer, K., Janz, D., Polle, A. (2013). The nitrate transporter (NRT) gene family in poplar. PLoS One, 8(8), e72126. DOI 10.1371/journal.pone.0072126. [Google Scholar] [CrossRef]
8. Liu, X., Ding, C., Su, X. (2019). Association analysis of the growth of black poplar (Populus Nigra L.) under contrasting nitrogen levels. Phyton–International Journal of Experimental Botany, 88(4), 425–433. DOI 10.32604/phyton.2019.08285. [Google Scholar] [CrossRef]
9. Remington, D. L., Thornsberry, J. M., Matsuoka, Y. (2001). Structure of linkage disequilibrium and phenotypic associations in the maize genome. Proceedings of the National Academy of Sciences of the United States of America, 98(20), 11479–11484. DOI 10.1073/pnas.201394398. [Google Scholar] [CrossRef]
10. Ingvarsson, P. (2005). Nucleotide polymorphism and linkage disequilibrium within and among natural populations of European aspen (Populus tremula L., Salicaceae). Genetics, 169(2), 945–953. DOI 10.1534/genetics.104.034959. [Google Scholar] [CrossRef]
11. Lopes, M. S., Dreisigacker, S., Pena, R. J., Sukumaran, S., Reynolds, M. P. (2015). Genetic characterization of the wheat association mapping initiative (WAMI) panel for dissection of complex traits in spring wheat. Theoretical and Applied Genetics, 128(3), 453–464. DOI 10.1007/s00122-014-2444-2. [Google Scholar] [CrossRef]
12. Bhandawat, A., Sharma, V., Singh, P., Seth, R., Nag, A. et al. (2019). Discovery and utilization of EST-SSR marker resource for genetic diversity and population structure analyses of a subtropical bamboo, Dendrocalamus hamiltonii. Biochemical Genetics, 57(5), 652–672. DOI 10.1007/s10528-019-09914-4. [Google Scholar] [CrossRef]
13. Barkley, N. A., Newman, M. L., Wang, M. L., Hotchkiss, M. W., Pederson, G. A. (2005). Assessment of the genetic diversity and phylogenetic relationships of a temperate bamboo collection by using transferred EST-SSR markers. Genome, 48(4), 731–737. DOI 10.1139/g05-022. [Google Scholar] [CrossRef]
14. Wang, X., Zhao, L., Eaton, D., Li, D.Z., Guo, Z. (2013). Identification of SNP markers for inferring phylogeny in temperate bamboos (Poaceae: Bambusoideae) using RAD sequencing. Molecular Ecology Resources, 13(5), 938–945. DOI 10.1111/1755-0998.12136. [Google Scholar] [CrossRef]
15. Nayak, S., Rout, G. R. (2005). Characterization of microsatellites in Bambusa arundinacea and cross species amplification in other bamboos. African Journal of Biotechnology, 4(2), 151–156. [Google Scholar]
16. Cai, K., Zhu, L., Zhang, K., Li, L., Zhao, Z. et al. (2019). Development and characterization of EST-SSR markers from RNA-Seq data in Phyllostachys violascens. Frontiers in Plant Science, 10, 179. DOI 10.3389/fpls.2019.00050. [Google Scholar] [CrossRef]
17. Sharma, R. K., Gupta, P., Sharma, V., Sood, A., Mohapatra, T. et al. (2008). Evaluation of rice and sugarcane SSR markers for phylogenetic and genetic diversity analyses in bambooIHBT Publication No. 0732. Genome, 51(2), 91–103. DOI 10.1139/G07-101. [Google Scholar] [CrossRef]
18. Zhu, S., Liu, T., Tang, Q., Fu, L., Tang, S. (2014). Evaluation of bamboo genetic diversity using morphological and SRAP analyses. Russian Journal of Genetics, 50(3), 267–273. DOI 10.1134/S1022795414030132. [Google Scholar] [CrossRef]
19. Yeasmin, L., Ali, M. N., Gantait, S., Chakraborty, S. (2015). Bamboo: an overview on its genetic diversity and characterization. 3 Biotech, 5(1), 1–11. DOI 10.1007/s13205-014-0201-5. [Google Scholar] [CrossRef]
20. Desai, P., Gajera, B., Mankad, M., Shah, S., Patel, A. et al. (2015). Comparative assessment of genetic diversity among Indian bamboo genotypes using RAPD and ISSR markers. Molecular Biology Reports, 42(8), 1265–1273. DOI 10.1007/s11033-015-3867-9. [Google Scholar] [CrossRef]
21. Nei, M., Li, W. H. (1979). Mathematical model for studying genetic variation in terms of restriction endonucleases. Proceedings of the National Academy of Sciences, 76(10), 5269–5273. DOI 10.1073/pnas.76.10.5269. [Google Scholar] [CrossRef]
22. Evanno, G., Regnaut, S., Goudet, J. (2005). Detecting the number of clusters of individuals using the software STRUCTURE: a simulation study. Molecular Ecology, 14(8), 2611–2620. DOI 10.1111/j.1365-294X.2005.02553.x. [Google Scholar] [CrossRef]
23. Isagi, Y., Oda, T., Fukushima, K., Lian, C., Yokogawa, M. et al. (2016). Predominance of a single clone of the most widely distributed bamboo species Phyllostachys edulis in East Asia. Journal of Plant Research, 129(1), 21–27. DOI 10.1007/s10265-015-0766-z. [Google Scholar] [CrossRef]
24. Karnosky, D., Brown, A., Clegg, M., Kahler, A., Weir, B. (1991). Plant population genetics, breeding, and genetic resources. Bioscience, 41(1), 53. DOI 10.2307/1311547. [Google Scholar] [CrossRef]
25. George, S., Sharma, J., Yadon, V. L. (2009). Genetic diversity of the endangered and narrow endemic Piperia yadonii (Orchidaceae) assessed with ISSR polymorphisms. American Journal of Botany, 96(11), 2022–2030. DOI 10.3732/ajb.0800368. [Google Scholar] [CrossRef]
26. Hamrick, J. L., Godt, M. J. W. (1996). Effects of life history traits on genetic diversity in plant species, 351(1345), 1291–1298. [Google Scholar]
27. Zawko, G., Krauss, S. L., Dixon, K. W., Sivasithamparam, K. (2001). Conservation genetics of the rare and endangered Leucopogon obtectus (Ericaceae). Molecular Ecology, 10(10), 2389–2396. DOI 10.1046/j.0962-1083.2001.01378.x. [Google Scholar] [CrossRef]
28. Sarma, V. (2009). Flowering of Melocanna baccifera (Bambusaceae) in northeastern India. Current Science, 96, 1165–1166. [Google Scholar]
29. Borba, E. L., Semir, J., Shepherd, G. J. (2001). Self-incompatibility, inbreeding depression and crossing potential in five Brazilian Pleurothallis (Orchidaceae) species. Annals of Botany, 88(1), 89–99. DOI 10.1006/anbo.2001.1435. [Google Scholar] [CrossRef]
30. Loveless, M. D., Hamrick, J. L. (1984). Annual review of ecology and systematics. Ecological Determinants of Genetic Structure in Plant Populations, 15(1), 65–95. [Google Scholar]
31. Nachman, M. W. (2002). Variation in recombination rate across the genome: evidence and implications. Current Opinion in Genetics & Development, 12(6), 657–663. DOI 10.1016/S0959-437X(02)00358-1. [Google Scholar] [CrossRef]
32. Dvornyk, V., Sirvio, A., Mikkonen, M., Savolainen, O. (2002). Low nucleotide diversity at the pal1 locus in the widely distributed Pinus sylvestris. Molecular Biology and Evolution, 19(2), 179–188. DOI 10.1093/oxfordjournals.molbev.a004070. [Google Scholar] [CrossRef]
33. Kuittinen, H., Aguade, M. (2000). Nucleotide variation at the CHALCONE ISOMERASE locus in Arabidopsis thaliana. Genetics, 155(2), 863–872. [Google Scholar]
34. Paterson, A. H., Bowers, J. E., Chapman, B. A. (2004). Ancient polyploidization predating divergence of the cereals, and its consequences for comparative genomics. Proceedings of the National Academy of Sciences of the United States of America, 101(26), 9903–9908. DOI 10.1073/pnas.0307901101. [Google Scholar] [CrossRef]
35. Zhang, Y., Xu, G. H., Guo, X. Y., Fan, L. J. (2005). Two ancient rounds of polyploidy in rice genome. Journal of Zhejiang University Science, 6(2), 87–93. DOI 10.1631/jzus.2005.AS0087. [Google Scholar] [CrossRef]
36. Soreng, R. J., Peterson, P. M., Romaschenko, K., Davidse, G., Zuloaga, F. O. et al. (2015). A worldwide phylogenetic classification of the Poaceae (Gramineae), 53(2), 117–137. [Google Scholar]
37. Zhang, X. Z., Zeng, C. X., Ma, P. F., Haevermans, T., Zhang, Y. X. et al. (2016). Multi-locus plastid phylogenetic biogeography supports the Asian hypothesis of the temperate woody bamboos (Poaceae: Bambusoideae). Molecular Phylogenetics and Evolution, 96, 118–129. DOI 10.1016/j.ympev.2015.11.025. [Google Scholar] [CrossRef]
38. Gaut, B. S., Clark, L. G., Wendel, J. F., Muse, S. V. (1997). Comparisons of the molecular evolutionary process at rbcL and ndhF in the grass family (Poaceae). Molecular Biology and Evolution, 14(7), 769–777. DOI 10.1093/oxfordjournals.molbev.a025817. [Google Scholar] [CrossRef]
39. Siol, M., Jacquin, F., Chabert-Martinello, M., Smykal, P., Le Paslier, M. C. et al. (2017). Patterns of genetic structure and linkage disequilibrium in a large collection of pea germplasm. G3: Genes, Genomes, Genetics, 7(8), 2461–2471. [Google Scholar]
 | This work is licensed under a Creative Commons Attribution 4.0 International License, which permits unrestricted use, distribution, and reproduction in any medium, provided the original work is properly cited. |