International Journal of
Experimental Botany
| Phyton- International Journal of Experimental Botany |
DOI: 10.32604/phyton.2021.016514
ARTICLE
Physiologic and Transcriptomic Insights into the High Alkali Response of Dunaliella salina
Shanghai Key Laboratory of Bio-Energy Crops, School of Life Sciences, Shanghai University, Shanghai, 200444, China
*Corresponding Author: Ping Li. Email: liping80@shu.edu.cn
Received: 14 March 2021; Accepted: 29 March 2021
Abstract: The halophilic unicellular green alga Dunaliella salina is characterized as the distinct tolerance to high salt in the field. Normally the organism is concurrently subjected with salt and alkali stress, but the feature of D. salina in response to high alkali stress was not investigated before. In this study, we used high pH stress to simulate high alkali stress and found D. salina also showed tolerance to high alkali stress, even grown under pH at 11.0, with high cell density and chlorophyll biosynthesis. High-throughput transcriptome analysis revealed the dramatically different expression of genes associated with nitrogen metabolism, lipid and β-carotene biosynthesis after high alkali treatment. Furthermore, physiologic analysis showed that high alkali treatment induced the expression and activity of nitrate reductase (NR), which generated nitric oxide (NO) as the messenger, and ultimately induced the accumulation of lipid and β-carotene biosynthesis. Suppressing NR activity or NO generation also reduced high-alkali-induced lipid and β-carotene biosynthesis, as well as attenuated the tolerance of D. salina to high alkali stress. Thus, our physiologic and transcriptomic data reveal the novel function of NR-dependent NO signal during the adaptation of D. salina to high alkali stress, through inducing the biosynthesis of lipid and β-carotene biosynthesis.
Keywords: Alkali stress; transcriptome; nitrate reductase; lipid biosynthesis; β-carotene biosynthesis
Dunaliella salina is a unicellular green alga with extremely tolerance to high salt stress, it still survives well in the media containing NaCl at wide range from 0.05 to 5.5 M, and such extreme character attracts our attention to use it as a good model organism to study the salt tolerance mechanism [1–3]. Using D. salina as the best-known biological sources, most evidence demonstrates that a high level of intracellular glycerol antagonizes the osmotic pressure across the plasma membrane under salt stress [3]. For glycerol biosynthesis, dihydroxyacetone phosphate (DHAP) from glycolysis is converted as glycerol-3-phosphate through glycerol-3-phosphate dehydrogenase (GPDH), then gycerol-3-phosphate is converted as through glycerol by glycerol-3-phosphate phosphatase; For glycerol dissimilation, dihydroxyacetone is generated by glycerol dehydrogenase, and then generated as DHAP by dihydroxyacetone kinase, thus GPDH is regarded as the critical enzyme to control glycerol homeostasis [4–8]. Like other organisms, the Na+/H+ antiporter also play the important role in the exclusion of Na+ to sustain the intracellular low Na+ level [2,7–9]. Proteomic analysis reveals other components, including triacylglycerols (TAGs), fatty acid elongase, GTP-binding protein. Tubulin was upregulated after salt stress [8]. High salt stress always induced the oxidative stress, while carotenoids are light-harvesting pigments that act as antioxidant molecules, it is reported that an increase of intracellular β-carotene content is often companied with a high level of reactive oxygen species ROS in microalgal cells suffering from environment stress, such as high light, high salt or nutrient deprivation et al. ROS, mainly including hydrogen peroxide (H2O2) and superoxide (O2−) acts as the signal to trigger various cellular process and activate many metabolic biosynthesis, however, overaccumulation of ROS also show damage to DNA, protein and photosynthesis pigment in microalgae [1–9]. As a result, D. salina also generated more β-carotene to attenuate the damage of ROS, and Dunaliella salina is a best-known biological source of natural β-carotene production. It has been reported that D. salina can accumulate β-carotene up to 10% of its dry cell weight (DCW) when exposed to environmental stress conditions. Several enzymes including geranylgeranyl pyrophosphate synthase (GGPS), phytoene synthase (PSY), phytoene desaturase (PDS), 15-cis-zeta-carotene isomerase (ZISO), zeta-carotene desaturase (ZDS), prolycopene isomerase (CRTISO) and lycopene beta-cyclase (LCYb) are involved in carotene biosynthesis in plant. Among these enzymes, GGPS is an essential branch point enzyme in terpenoid biosynthesis for catalyzing the generation of geranylgeranyl pyrophosphate (GGPP), which is the limited first step in carotenoid biosynthesis. Then, phytoene is converted into colored lycopene by desaturases and isomerases, including PDS, ZISO, ZDS and CRTISO [6,10,11]. Hereafter, LCYb catalyzes lycopene into β-carotene, which is another key step in the pathway of β-carotene biosynthesis [6,12,13]. Compared with the studies on higher plants, research into β-carotene biosynthesis is limited in microalgae.
Nitric oxide acts as the critical signal to regulate plant growth and development. It also enhances plant tolerance to different environmental stress [14–16]. Recently, NO is also reported playing function in microalgae adaptation to environmental stress. NO also trigger the secondary metabolism biosynthesis in plant [17–19]. In plant, nitrate reductase and NOS are reported as the main enzyme responsible for NO biosynthesis [20–22], however, whether or how NO regulate the biosynthesis of lipid or β-carotene in D. salina remains elusive.
Beside high salt, the effect of other stress, such as heavy metal, high light or nutrient deficiency on the growth in D. salina was also investigated before [5,12,11,23]. Under natural field, high salt is normally companied with high alkali stress, but how the response of D. salina to high alkali stress and underlying adaptation mechanism was not studied before. In this study, we first tested the effect of high alkali on the growth of D. salina and found D. salina also showed obviously tolerance to high salt stress, furthermore, we performed high-throughput transcriptome analysis and found several DEGs associated with lipid, carotene and nitrogen metabolism was regulated by high alkali stress, physiological analysis also validate that high alkali alter lipid and carotene metabolism during high alkali stress, among this process, NR-dependent nitric oxide signal play the necessary role. Together, our study revealed the adaption of D. salina to high alkali through lipid and carotene, during this process, NR-dependent NO signal play as the important signal to mediate its adaptation.
2.1 D. salina Culture and High Alkali Treatment
The algae D. salina strain and C. reinhardtii strain were obtained from the Freshwater Algae Culture Collection at the Institute of Hydrobiology (FACHB-collection), Chinese Academy of Sciences. D. salina cells were grown in a Dunaliella medium with 1.5 M NaCl. C. reinhardtii cells were cultured in a Tris-Acetate-Phosphate (TAP) medium supplemented with sodium acetate (pH 7.0). The alga cells were grown in the greenhouse at 25°C with 8000 lx under cool-white fluorescence lamps with 16 h light and 8 h dark. For high alkali treatment, the TAP medium was adjusted to indicate pH degree using sodium hydrate. The cell density of alga culture was calculated by a Zeiss Axioplan microscope (Germany) equipped with the hemocytometer.
2.2 Total RNA Extracts for RNA-seq Analysis
The D. salina cells sampled from control at pH7.5 and high alkali treatment at pH10.0 for 6, 12 or 24 h were collected for RNA extraction [24,25]. Total RNA was extracted using Trizol reagent kit (Invitrogen, Carlsbad, CA, USA) according to the manufacturer’s protocol. RNA quality was assessed on an Agilent 2100 Bioanalyzer (Agilent Technologies, Palo Alto, CA, USA) and checked using RNase free agarose gel electrophoresis. After total RNA was extracted, eukaryotic mRNA was enriched by Oligo (dT) beads, while prokaryotic mRNA was enriched by removing rRNA by Ribo-ZeroTM Magnetic Kit (Epicentre, Madison, WI, USA). Then the enriched mRNA was fragmented into short fragments using fragmentation buffer and reverse transcribed into cDNA with random primers. Second-strand cDNA was synthesized by DNA polymerase I, RNase H, dNTP and buffer. Then the cDNA fragments were purified with QiaQuick PCR extraction kit (Qiagen, Venlo, The Netherlands), end repaired, A base added, and ligated to Illumina sequencing adapters. The ligation products were size selected by agarose gel electrophoresis, PCR amplified, and sequenced using Illumina novaseq 6000 by Gene Denovo Biotechnology Co., Guangzhou, China.
Raw Data were first processed to filter low-quality reads. Transcriptome denovo assembly was carried out with short reads assembling Trinity program. The unigene expression was calculated and normalized to RPKM (Reads Per kb per Million reads). Basic annotation of unigenes includes protein functional annotation, pathway annotation, COG/KOG functional annotation and Gene Ontology (GO) annotation. To annotate the unigenes, we used BLASTx program (http://www.ncbi.nlm.nih.gov/BLAST/) with an E-value threshold of 1e-5 to NCBI non-redundant protein (Nr) database (http://www.ncbi.nlm.nih.gov), the Swiss-Prot protein database (http://www.expasy.ch/sprot), the Kyoto Encyclopedia of Genes and Genomes (KEGG) database (http://www.genome.jp/kegg), and the COG/KOG database (http://www.ncbi.nlm.nih.gov/COG). Protein functional annotations could then be obtained according to the best alignment results. Principal component analysis (PCA) was performed with R package models (http://www.r-project.org/) in this experience. PCA is a statistical procedure that converts hundreds of thousands of correlated variables (gene expression) into a set of values of linearly uncorrelated variables called principal components. PCA is largely used to reveal the structure/relationship of the samples/datas.
Total RNA was extracted from D. salina after high-alkali treatment at pH10 for different time using the RNA extraction kit (Qiagen) [24,25]. The qPCR reactions were performed with a 9600 Real-Time PCR System (Roche) using cDNA templates produced with the PrimeScript RT Reagent Kit with gDNA Eraser (Takara) and the SYBR Green PCR Kit (Roche). Primers for qPCR analysis were designed according to the contig sequences from RNA-seq data and listed in Supplemental Tab. 1. All PCR reactions were repeated for three times, and each sample was replicated in parallel three times. The qPCR conditions were: 5 min at 95°C, and then 40 cycles of 10 s at 95°C, 30 s at 60°C. Melting curve is 1cycle of 10 s at 95°C. 60 s at 65°C, 1 s at 97°C. The specificity of qPCR primers was monitored by the presence of melting curves with single peaks and sequencing of the corresponding products with unique bands of the expected sizes. All results were normalized to the 18S RNA gene from D. salina.
2.4 Total Lipids Extract and TAG Analysis
Lipids were extracted using chloroform–methanol (2:1) and the total lipids were determined gravimetrically [26]. Neutral lipids and polar lipids were separated on a Silica gel 60 TLC plate (EMD Chemicals, Merck, Germany) with different mobile phases: the former used a mixture of hexane/tert-butylmethyl ether (TBME)/acetic acid (80/20/2, by vol), while the latter used a mixture of chloroform/methanol/acetic acid/water (25/4/0.7/0.3, by vol). Total lipids or individual lipids recovered from TLC plates were transesterified with sulfuric acid in methanol. Fatty acid methyl esters (FAMEs) were analyzed by using a LC-MS (Waters, UPLC; Thermo, Q Exactive) and ACQUITY UPLC BEH C18 capillary column (2.1 mm × 100 mm, 1.7 μm). The column temperature is 40°C, and flow rate is 0.3 mL min−1, the mobile phase A is acetonitrile /water (6 mm: 4, with 10 mM ammonium formate), mobile phase B is iso-propyl alcohol/acetonitrile (9:1, v/v, with 10 mM ammonium formate). Content of TAG and polar lipids was expressed as the content of their corresponding fatty acids. The total lipid was stained with Nile Red as the previous method, and lipid fluorescence was observed using the confocal microscope.
NO content of alga was measure using Griess Reagent Kit [27,28]. In brief, about 5 mL of alga medium was collected and centrifugated at 12,000 g for 5 min, the alga pellet was ground in 50 mM phosphate buffer, pH 7.0, in dark. The supernatant was incubated with sulfanilamide solution for 10 min in dark. 50 μL of the N-(1-naphthyl) ethylendiamine dihydrochloride solution was added followed by another 10 min of incubation in dark. The absorbance was measured at 520 nm using the DTX 880 multimode detector (Beckman Coulter).
NR activity was assayed as previous method with some modifications [28,29]. About 1 g of alga cell was ground with liquid N2 and then resuspended in extraction buffer containing 100 mM HEPES-KOH (pH 7.5), 1 mM EDTA, 10% (v/v) glycerol, 5 mM dithiothreitol, 0.1% Triton X-100, 0.5 mM phenylmethylsulfonyl fluoride, 20 μM FAD, 1 μM leupeptin, 5 μM Na2MoO4, and 1% polyvinylpyrrolidone. After centrifuging at 10,000 g for 20 min at 4°C, the supernatant was used for NR determination. NR activity was measured by mixing 1 volume of extract with 5 volumes of prewarmed (25°C) assay buffer (100 mM HEPES-KOH, pH 7.5, 5 mM KNO3, and 0.25 mM NADH). The reaction was started with the addition of assay buffer, incubated at 25°C for 30 min, and then stopped by adding 0.1 M zinc acetate. After 15 min, the tubes were centrifuged at 13,000 g for 5 min. Nitrite produced was measured colorimetrically at 520 nm by adding 1 mL of 1% (w/v) sulfenilamide in 3 M HCl plus 1 mL of 0.02% (v/v) N-(1-naphthyl)-ethylenediamine in distilled water.
2.7 β-Carotene Content Measurement
The lyophilized cell samples after high-alkali treatment were homogenized vigorously in the presence of liquid nitrogen and extracted with acetone for three times under dim light [1,6]. The carotenoid extracts were then separated on a LC-20 (Jap, Shimadzu, Prominence LC-20A) liquid chromatograph system, equipped with a 5SPD-20A UV detector and a Shim-pack GIST C18 column (4.6 * 250 mm, 50 μm). The gradient was as below: the gradient was started from 100% solvent B (acetonitrile/methanol/water, 84:2:14, by volume); from 0 to 15 min, solvent A (ethyl acetate) and solvent C (methanol) linearly increased from 0% to 20% and from 0% to 80%, respectively, followed by a linear gradient to 32% solvent A and 68% solvent C from 15 to 20 min; and hold on this gradient for 10 min, then linearly to 80% solvent A and 20% solvent C from 30 to 50 min; finally turned back to 100% solvent B and hold on for 5 min. The flow rate was 0.8 mL min−1. Carotenoids were identified and quantified by comparing with authentic standards regarding the retention time, absorption spectra and peak area.
3.1 The Physiological Response of D. salina to High Alkali Stress
To explore the underlying mechanism of D. salina tolerance to high-alkali stress, we compared the cell viability of D. salina and common green alga (Chlamydomonas reinhardtii), subjected with different alkali stress at gradient pH medium. D. salina grew well with normal green color in the medium with pH8.0, increasing pH slightly suppressed its growth, even D. salina sustained high alkali stress at pH over 11.0 (Fig. 1A). In contrast to D. salina, C. reinhardtii showed more sensitive to high alkali stress, though it could grow on the medium at pH8.0, it presented the yellow color, and could not grow once pH over 10 (Fig. 1A). This data suggests that D. salina showed more tolerance to high alkali stress. Consistently, we then checked the cell density of D. salina under gradient alkali stress, and found increasing pH gradually suppressed the cell growth of D. salina, but still slowly grow under high alkali condition (Fig. 1B). Compared with the chlorophyll content of C. reinhardtii at different pH stress, the total chlorophyll content of D. salina at different pH stress was always more than that of C. reinhardtii. Especially at high alkali stress (pH9.0, pH10.0 and pH11.0), the total chlorophyll content of D. salina still remained at a high level, while C. reinhardtii could hardly be detected (data is not shown) (Fig. 1D). We also measured the cell numbers of D. salina under different pH stress, the cell numbers of D. salina remained high under different pH stress, even under pH11.0 (Fig. 1C). Thus, these data demonstrate that D. salina is more tolerant to high alkali stress.
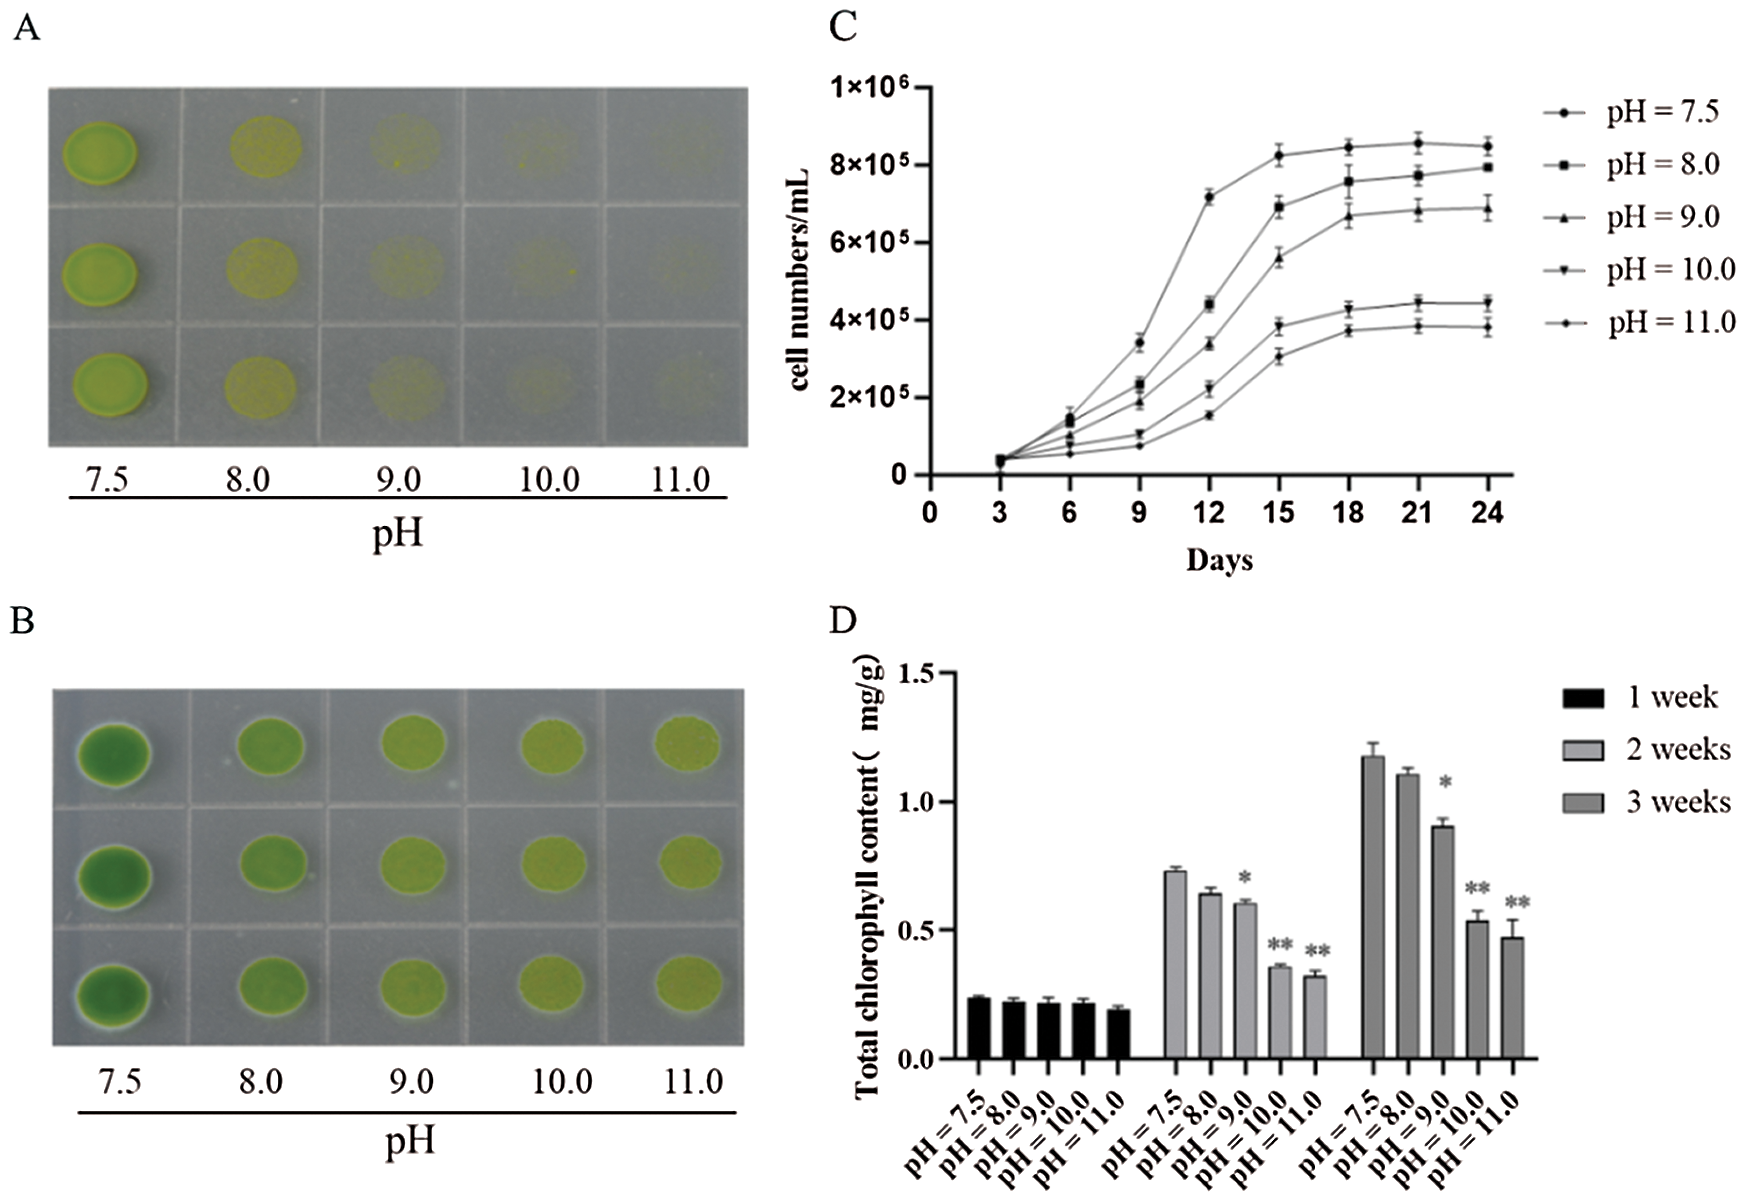
Figure 1: D. salina show more tolerance to high alkali stress. (A&B). The phenotype of C. reinhardtii (A) and D. salina (B) under gradient pH stress. Both of C. reinhardtii and D. salina were grown on the culture medium at different pH degree as indicated for 15 days and the photos were taken. (C) The cell density and the total of D. salina under gradient pH stress. The D. salina was cultivated in the Dunaliella medium at different pH stress for indicating days and the cell number was scored, values were scored from three biological repeat experiments, error bars indicate SD. (D) The total chlorophyll content of D. salina under gradient pH stress. The D. salina was cultivated in the TAP medium at different pH stress for 1, 2 and 3 weeks, respectively, and the total chlorophyll was measured. Values were scored from three biological repeat experiments, error bars indicate SD. Asterisks indicate significant differences (* means P < 0.05, ** means P < 0.01)
3.2 The Cell Structure of D. salina Responses to High Alkali Stress
To further understand the effect of high-alkali stress on cell status, we used transmission electron microscopy to scan the cell structure of D. salina before or after high-alkali stress (Fig. 2). Clean cell organelle was observed in D. salina under normal condition, including the chloroplast, amyloplast and oil body around the nucleus. In contrast to the cell under normal condition, more amyloplast and oil body could be observed after high-alkali stress, suggesting the probable function of starch and lipid metabolism during D. salina response to alkali stress.
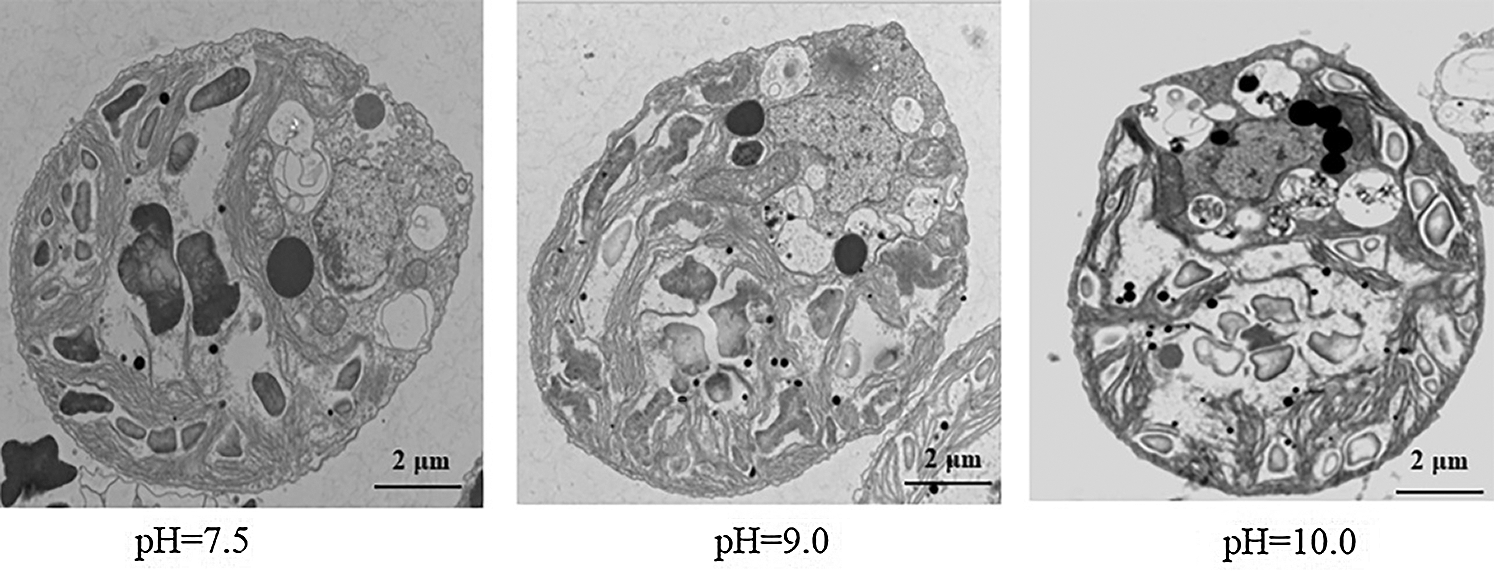
Figure 2: Observing the subcellular structure of D. salina under high alkali stress by transmission electron microscopy analysis. D. salina was cultivated in the Dunaliella medium at pH7.5, pH9.0 and pH10.0 for 15 days and the sample was collected for transmission electron microscopy analysis. Bar = 2 μm
3.3 The Transcriptome Profile of D. salina after High Alkali Stress
To explore the possible mechanism underlying D. salina adaption to high-alkali stress, we constructed and sequined four libraries from D. salina cells with control treatment at pH = 7.0 (CK-0 h) and high-alkali treatment at pH10.0 for 6 h (AK-6 h), 12 h (AK-12 h) and 24 h (AK-24 h). After transcriptome sequencing, approximately 56 million raw reads were generated with the average rate of clean reads 85.6%. The clean reads were successfully assembled into 63,233 unigenes with a mean length of 2,210 bp and an N50 value at 2100 bp. About 26,331(45.44%), 26,331(45.44%), 26,331(45.44%) and 26,331(45.44%), ranging from 200 to 999 bp, 1000 to 1999 bp, 2000 to 2999 bp and over 3000 bp in length, respectively. According to the BLAST results, a total of 34,333(56.55%), 34,333(56.55%), 34,333(56.55%) and 34,333(56.55%) genes respectively were well matched in the Nr, Nt, Swiss-Prot and KEGG databases. Principal components analysis (PCA) was used to analyze the distribution of gene expression profiling in response to high alkali stress. A PCA of our four samples was clearly separated among control and treated sample (Fig. 3A). These samples were displayed into three distinct groups, and two samples were clustered together.
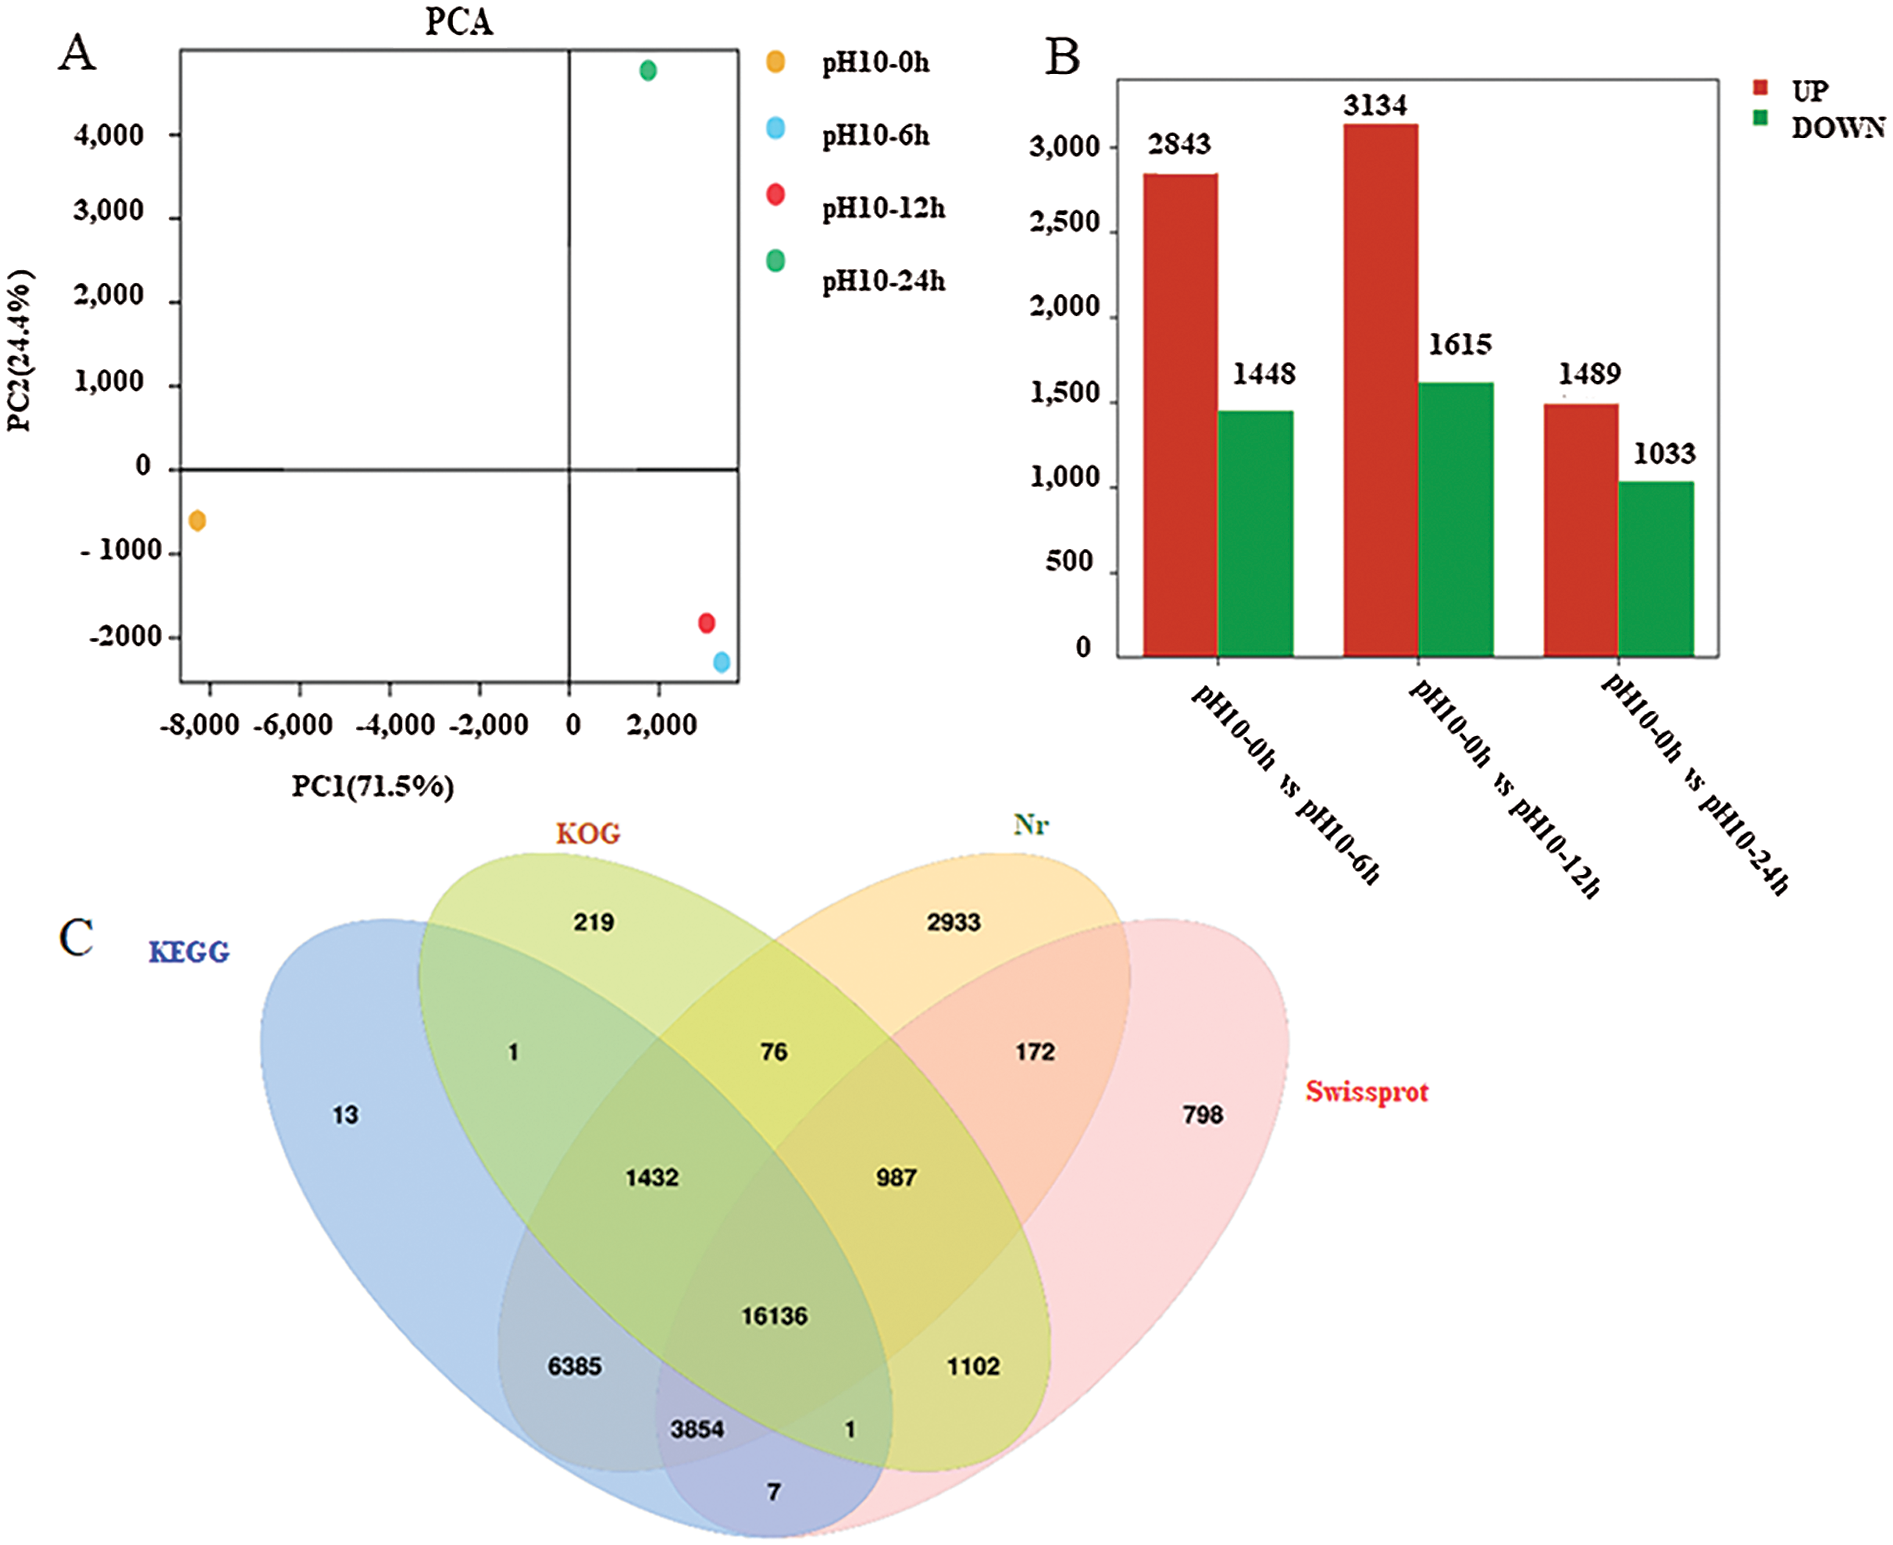
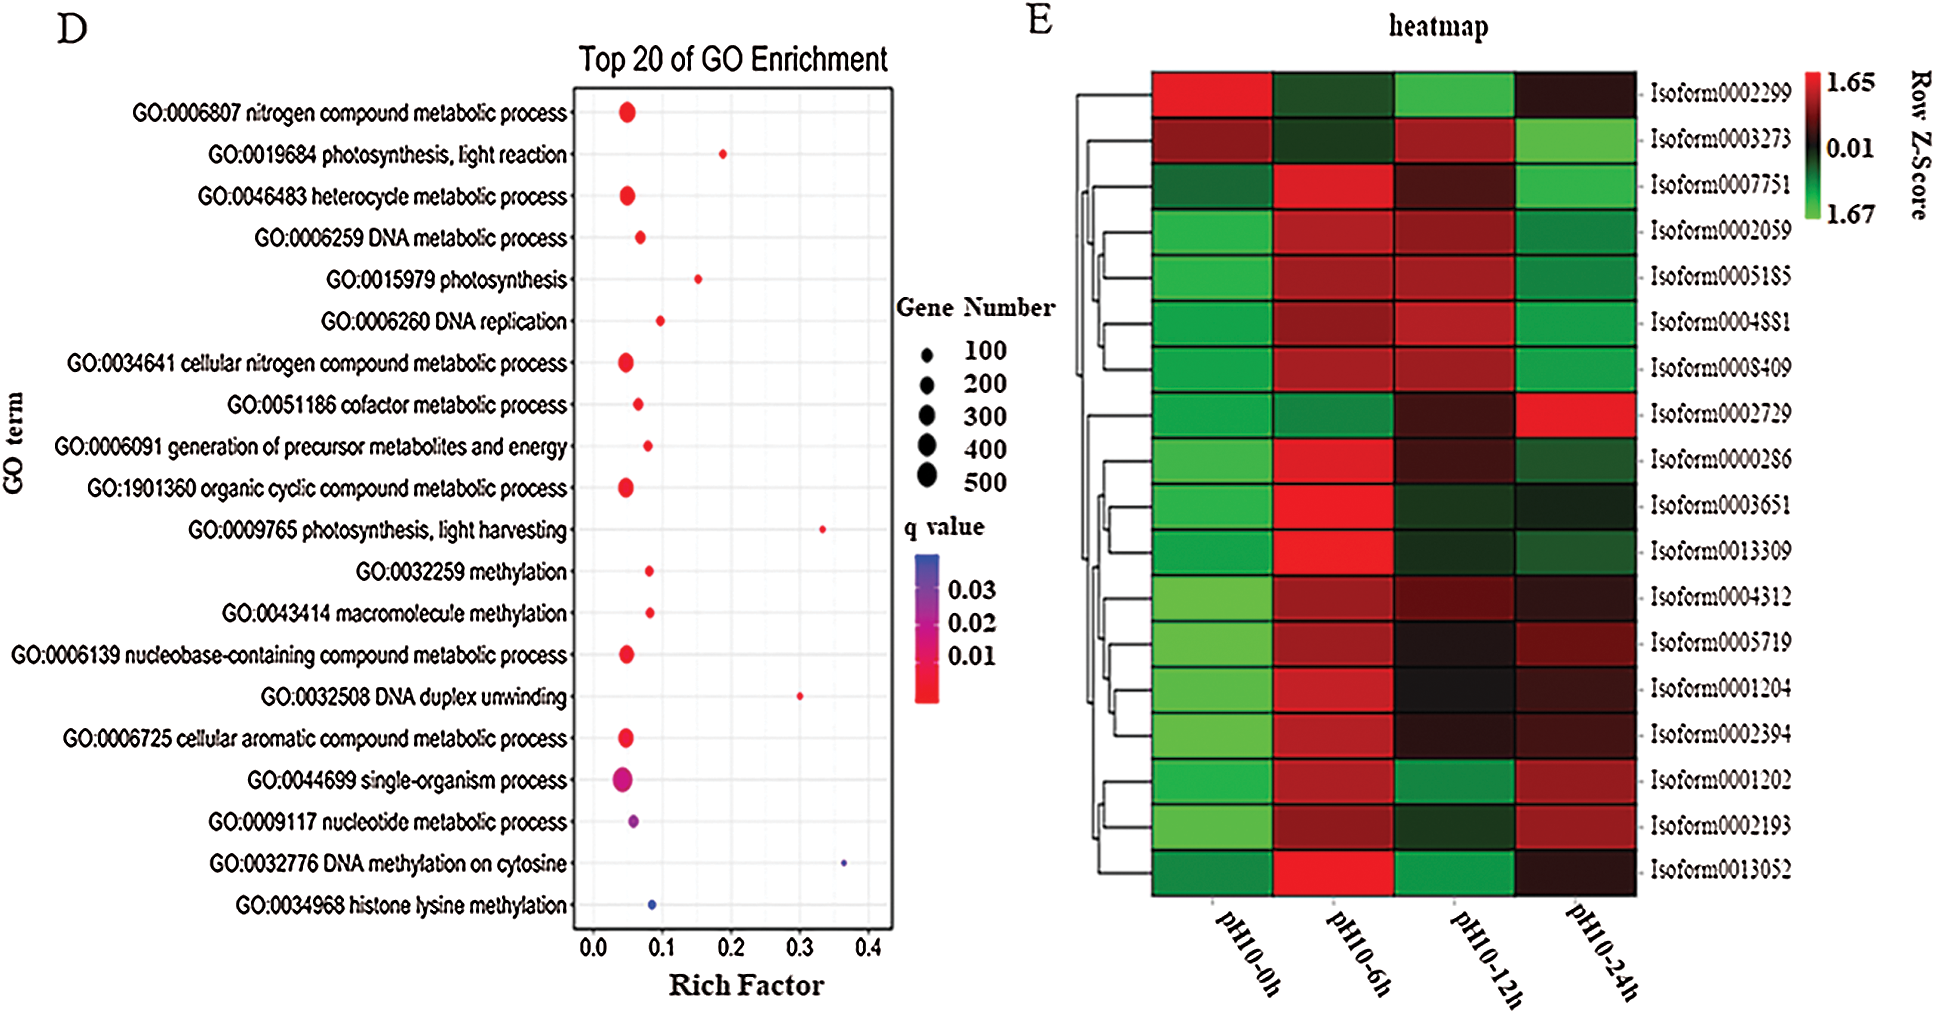
Figure 3: Transcriptome analysis of D. salina in response to high alkali stress (A) PCA analysis of the DEGs from the sample after pH10.0 treatment for 6, 12 and 24 h. The sample under pH7.5 was used as the control. (B) Annotation of DEGs against Nr, KEGG, KOG and Swissport database. (C) The upregulated or downregulated genes number in the sample under pH10.0 treatment for 6, 12 and 24 h. The sample under pH7.5 was used as the control. (D) Different upregulated or downregulated gene numbers in the sample after pH10.0 treatment for 6, 12 and 24 h. The sample under pH7.5 was used as the control. Rich ratio of the DEGs number in specific pathway termed to the number of all genes in specific pathway term. The q value referred to the false discovering rate. Pathway with q value ≤ 0.05 was significantly enriched in DEGs. (E) Heat-map of carotenoids metabolism, nitrogen metabolism and lipid synthesis related genes. The colors from green to red represent the gene express values from low to high. The z-scores represent gene expression values were generated from their FPKMs. The four columns represent the four experimental groups. The sample under pH7.5 was used as the control (pH10–0 h). pH10–6 h, pH10–12 h and pH10–24 h represent the three pH stress groups with 6, 12 and 24 h time duration. Genes IDs are on the right. Genes are also grouped base on their expression patterns
The high-alkali-treated samples were compared with the control to identify DEGs (|log2 (fold change)|>1 and P-value < 0.05), we successfully identified 11,669 (4,863 up- and 5,134 down-regulated) DEGs (Fig. 3B). Among them, 1,905 DEGs was upregulated and 1,271 was down-regulated in the sample after 6 h of high alkali treatment, and 2,825 DEGs was upregulated and 1,153 DEGs was down-regulated after 12 h of high alkali treatment, and 1,805 DEGs was upregulated and 2,710 DEGs was downregulated after 24 h of high alkali treatment. All of these DEGs was searched and annotated by Nr (NCBI non-redundant protein sequence database), KEGG, (Kyoto Encyclopedia of Genes and Genomes database), KOG (Eukaryotic Orthologous Groups of Protein Database) and UniProtKB/Swissport (UniProt Knowledgebase database), and successfully annotated 34,116 genes, including 31, 9975 from Nr, 27,829 from KEGG, 19,954 from KOG and 23,057 from Swissport database (Fig. 3C). Among these annotated proteins, the most significantly enriched pathways were including spliceosome, protein processing to endoplasmic reticulum, ribosome, ABC transporters, photosynthesis and citrate cycle (Fig. 3D). The number of down-regulated DEGs was much more than that of up-regulated DEGs under high-alkali stress, especially in the pathways of membrane transport, energy metabolism, amino acid metabolism and glycerol metabolism, and the biosynthesis of lipid metabolism (Fig. 3D). Most carotenoids metabolism, nitrogen metabolism and lipid synthesis related genes are significantly enriched by GO analysis on up-regulated genes on 6 h under pH10.0 stress, which implies those genes may play an important role in high alkali stress (Fig. 3E). In time course, most genes are highly expressed on 6 h, then maintained a high level of expression after 12 and 24 h of high alkali treatment. However, there are some genes are highly expressed on 6 h, and then decreased on 12 and 24 h (Fig. 3E). In order to have an overall understanding of the key genes under high alkali stress, functional enrichments were performed by GO (gene ontology) (Supplemental Tab. 2).
To further verify the transcriptional level of mRNA detected by RNA-seq analysis, we randomly selected 12 genes from the DEGs of the transcriptome database for qPCR validation. Primers were designed based on the contig sequences. Efficiency of qPCR was confirmed by melting-curve analysis with a single product of all selected genes, suggesting the high reliability of transcriptome assembly. Among selected 12 genes, 8 genes were induced by high alkali treatment, while 4 genes were suppressed. The qPCR results represented similar change trend as those from transcriptomic results, with the linear relationship y = 1.0323x + 0.523 (R2 = 0.9231, P < 0.001). Thus, our RNA-seq results were could be confirmed by the accurate qPCR analysis, indicating the reliability of RNA-seq-based transcriptome analysis.
3.4 The Nitrate Reductase Activity of D. salina Response to Alkali Stress
Among these different DEGs, we noticed several DEGs associated with nitrate metabolism, such as nitrate reductase (NR). To validate whether NR is involved in D. salina response to high alkali stress, we firstly measured the enzyme activity of NR before or after high alkali treatment. In agreement with our transcriptome data, RT-qPCR analysis also showed that alkali treatment increased the transcriptional level of high affinity nitrate transporter (Fig. 4A) and assimilatory nitrate reductase (Fig. 4B). Meanwhile, we also found alkali treatment also increases the enzyme activity of NR (Fig. 4C), and the NR activity reached the maximum level after 48 h of high alkali treatment at pH10.0, and then sustained the high level. To further investigate the possible function of NR during D. salina response to high alkali stress, we treated D. salina with the NR inhibitor tungstate and then check the cell density under high alkali treatment. As shown in Fig. 4D, we found additional tungstate treatment indeed reduced cell growth under high alkali stress, indicating that inhibiting NR activity reduced the adaptation of D. salina tolerance to high alkali treatment.
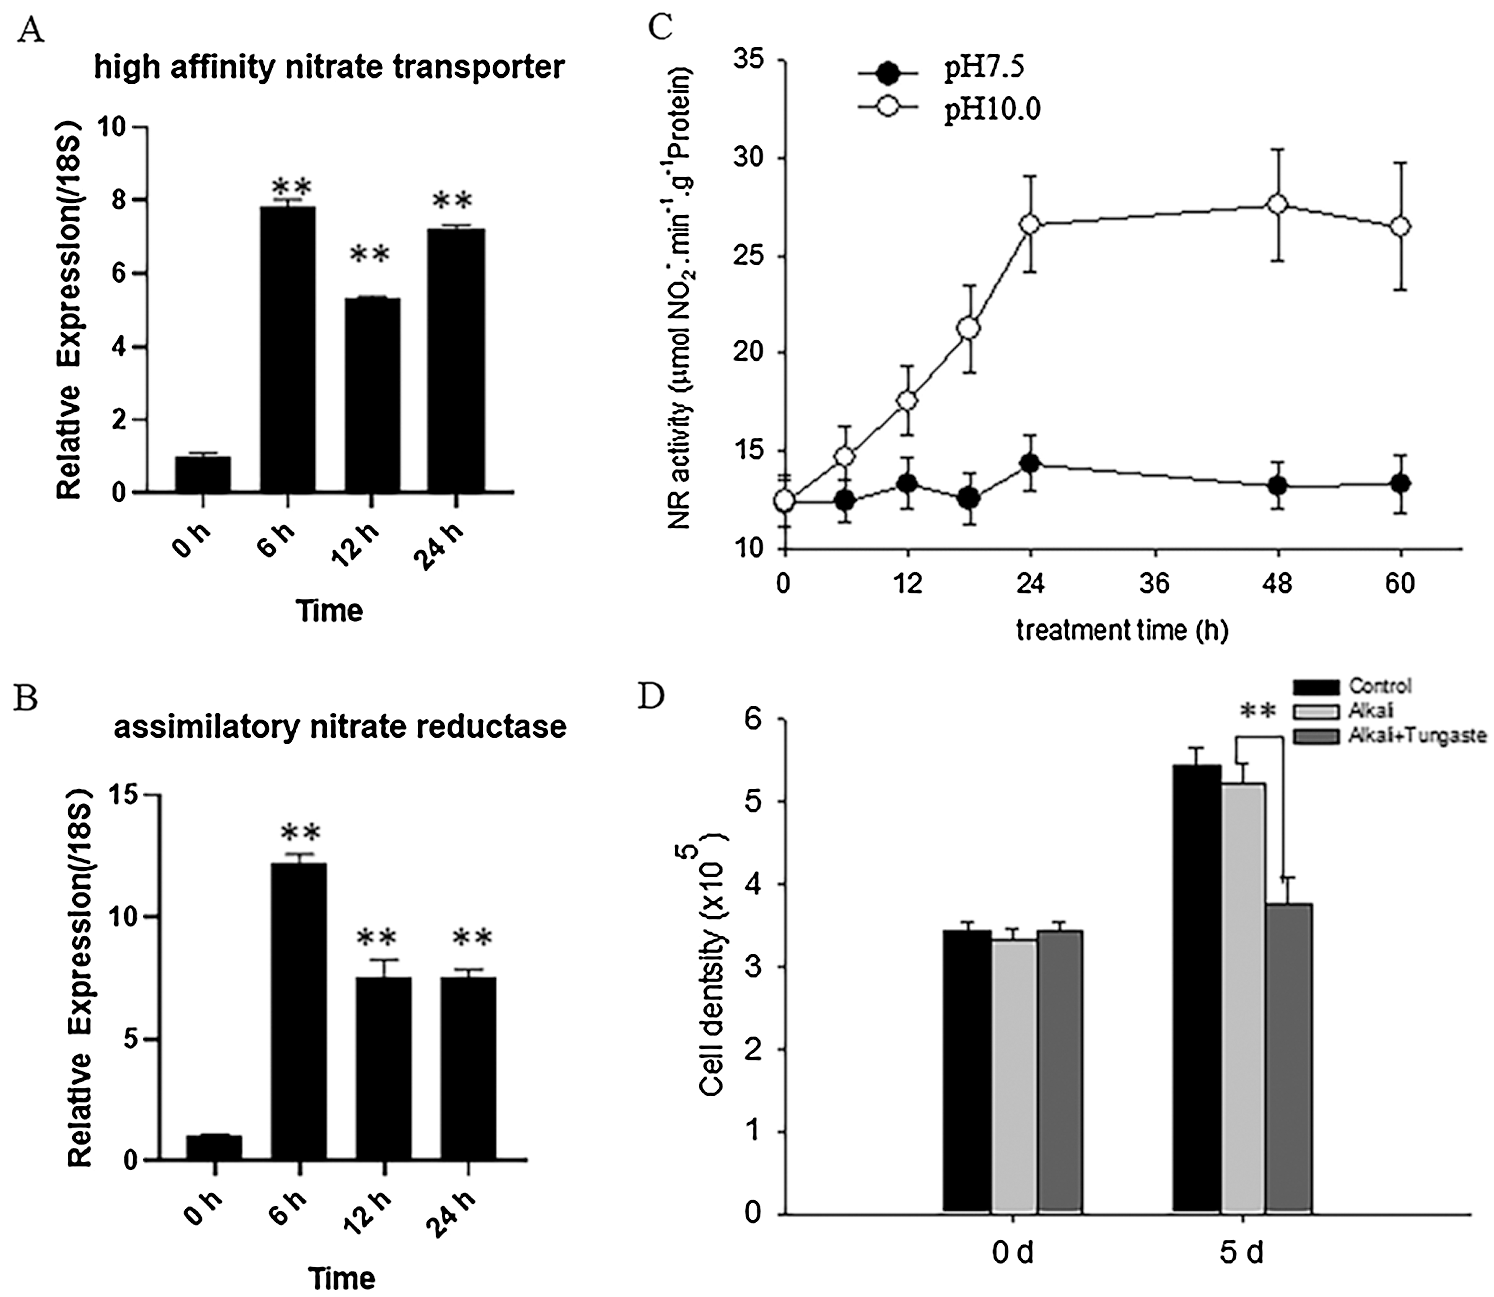
Figure 4: High alkali induced the expression and activity of NR. (A&B) High alkali induced the expression of high affinity nitrate transporter (A) and assimilatory nitrate reductase (B). The sample was treated with high alkali at pH10.0 for 6, 12 or 24 h and the expression level of affinity nitrate transporter (A) and assimilatory nitrate reductase (B) was measured by RT-qPCR analysis. Values were scored from three biological repeat experiments, error bars indicate SD. (C) The sample was treated with pH10.0 for the indicated time and the NR activity was measured. The sample at pH7.5 was used as the control. Values were scored from three biological repeat experiments, error bars indicate SD. Asterisks indicate significant differences. (* means P < 0.05, ** means P < 0.01) (D) The sample was treated with pH10.0 alone or pH10.0 additional NR inhibitor tungstate at 10 μM for 5 days, and the cell density was measured. Values were scored from three biological repeat experiments, error bars indicate SD
3.5 High Alkali Stress Induced the Rapid Accumulation of Nitric Oxide
It is widely reported that NR-dependent NO signal particulate the physiological response from plant response to environmental stress [15–19]. We then wonder whether high alkali induced NR activity also generated NO signal to enhance D. salina tolerance to high alkali stress. To test such possibility, we firstly measured the NO content in D. salina before or after high alkali treatment at pH10.0. As shown in Fig. 5A, high alkali gradually induced the accumulation of NO in the medium, and reached the peak level after 24 h of treatment and sustained the relative level of NO in the medium at pH10.0. We also add the medium with the NO scavenger cPTIO, and found that cPTIO treatment obviously decreased the cell density under high alkali treatment (Fig. 5B), hinting that NO signal is required for cell growth under high alkali treatment.
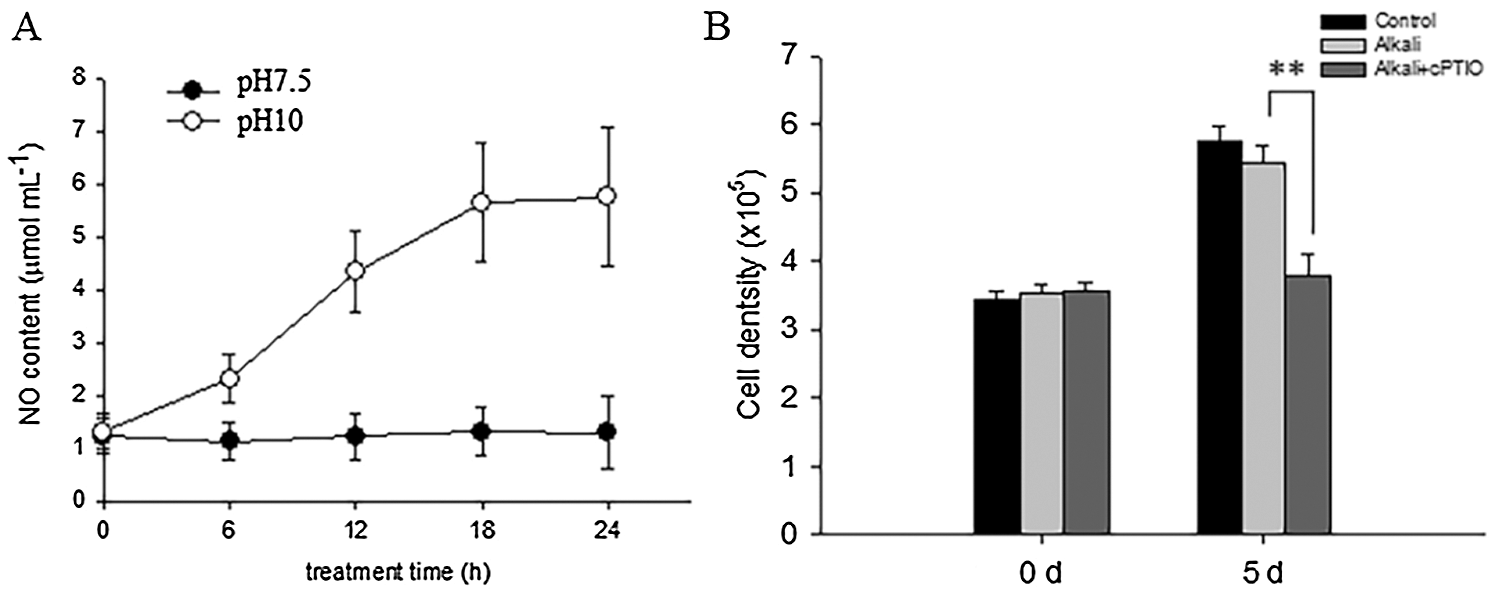
Figure 5: High alkali induced the generation of NO. (A) High alkali induced the accumulation of NO. The sample was treated with high alkali at pH10 for indicated time, and the content of NO was measured. Values were scored from three biological repeat experiments, error bars indicate SD. (B) The sample was treated with pH10.0 alone or pH10.0 additional NO scavenger cPTIO at 1 μM for 5 days, and the cell density was measured. Values were scored from three biological repeat experiments, error bars indicate SD
3.6 Nitric Oxide Signals Mediate the Lipid and β-Carotene Metabolism under High Alkali Stress
Our transcriptome data also showed the DGEs associated with lipid and β-carotene metabolism was also altered after high alkali treatment, including lipid-biosynthesis-related genes, such as long-chain acyl-CoA synthetase 2 and sphingosine-1-phosphate lyase(B), and β-carotene biosynthesis related genes, such as β-carotene biosynthesis including carotene globule protein, carotenoid cleavage dioxygnase 1, chloroplast carotene biosynthesis related protein and carotenoid cleavage protein 2. These data suggest that lipid metabolism is possibly involved the adaptation of D. salina response to high alkali stress. Here we also validated the transcriptional level of these genes after high alkali treatment, and found high alkali treatment indeed induced their expressions (Fig. 6), suggesting the possible function of lipid and β-carotene metabolism during the adaptation of D. salina to high alkali treatment.

Figure 6: High alkali induced the expression of genes associated with lipid and β-carotene biosynthesis. The sample was treated with pH10.0 medium for 6, 12 or 24 h and the gene expression of genes related to lipid biosynthesis including long-chain acyl-CoA synthetase 2 (A) and sphingosine-1-phosphate lyase (B), and β-carotene biosynthesis including carotene globule protein (C), carotenoid cleavage dioxygnase 1 (D), chloroplast carotene biosynthesis related protein (E) and carotenoid cleavage protein 2 (F) was measured by RT-qPCR analysis. Values were scored from three biological repeat experiments, error bars indicate SD
To verify such possibility, we used Nile Red (NR) to specially stain the total lipid content of D. salina. As shown in Fig. 7A, we observed the high green fluorescence in the D. salina after high alkali treatment in contrast to that of the medium at pH7.5, suggesting that high alkali increased the lipid accumulation. We also measured the total TAG content of the D. salina and found that high alkali increased the total TAG content, treatment with the NR inhibitor tungstate or NO scavenger cPTIO also suppressed the accumulation of total TAG (Fig. 7B), confirming the function of NR-dependent NO signal in high-alkali-induced TAG biosynthesis. Similarly, we also measured the content of β-carotene, and found high alkali also induced the increase of β-carotene, which could be partially suppressed by additional tungstate or cPTIO (Fig. 7C), also suggesting the potential function of NO signal in β-carotene during high alkali stress.
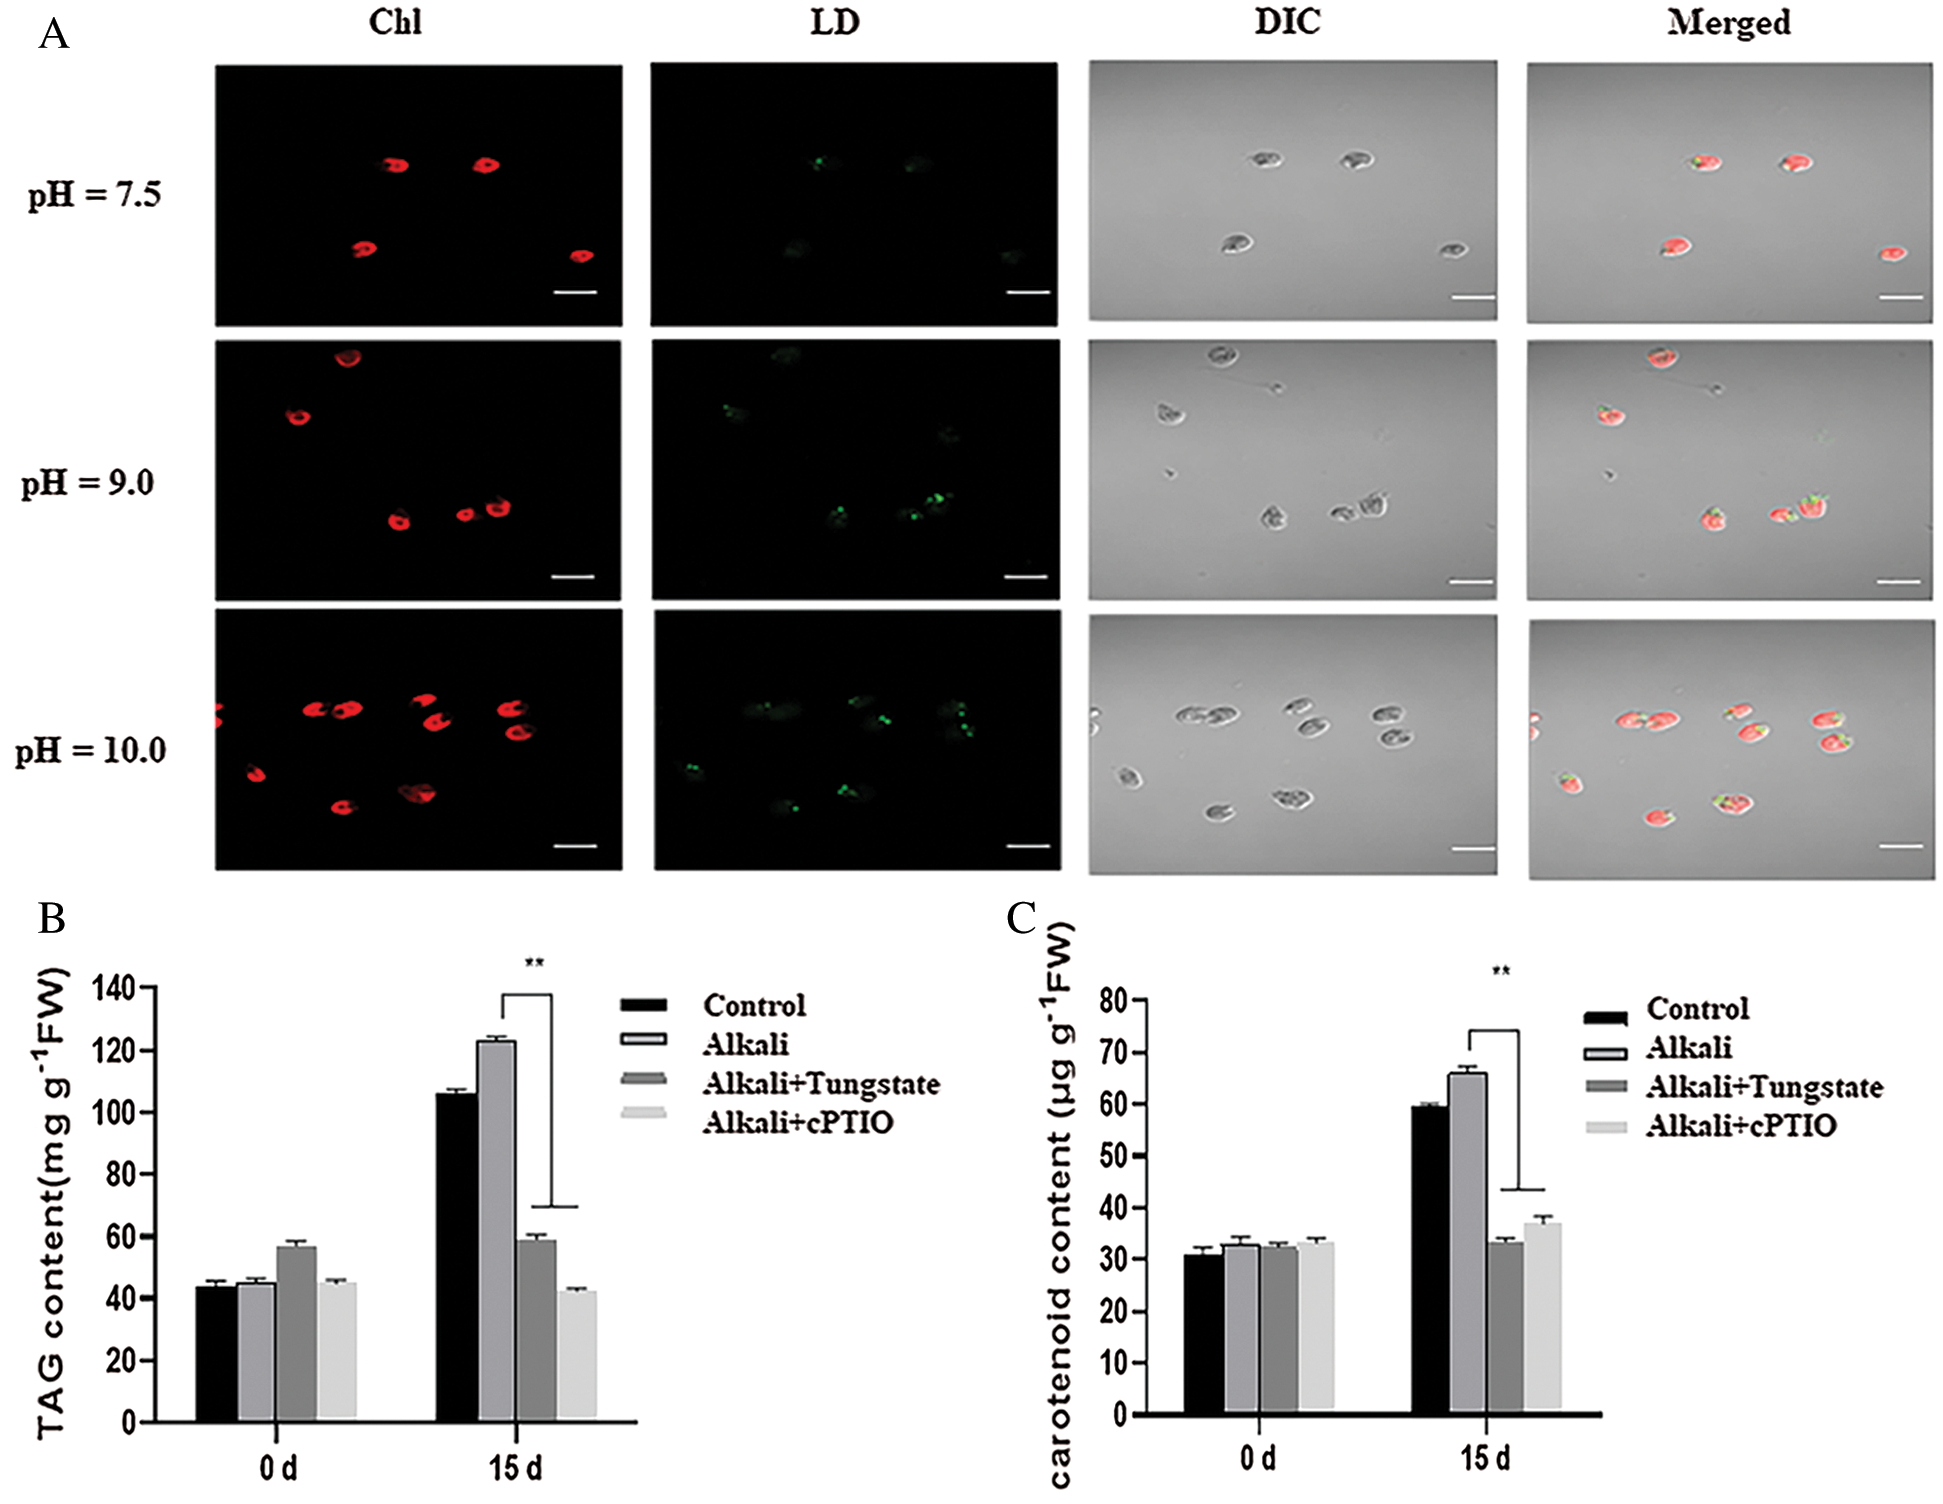
Figure 7: NR-dependent NO signal mediates the lipid and lipid and β-carotene biosynthesis after high alkali stress. (A) Nile red staining of D. salina in the medium at pH7.5, 9.0 and 10.0. The strong green fluorescence indicates the high lipid content. Bar = 10 μm. (B, C) High alkali induced the accumulation of TAG (B) and β-carotene (C). The sample was treated with pH10.0 for 5 days and the total TAG and β-carotene was measured. The sample with 10 μM of tungstate or 1 μM of cPTIO was used for inhibitor experiment. Values were scored from three biological repeat experiments, error bars indicate SD
As a unicellular alga, D. salina is a good organism to study salt tolerance mechanism for its strong tolerance ability to very high salt, even over 5M [2,4,6]. Normally the nature salt-alkali field is simultaneously companied with high salt and high alkali stress. However, the mechanism of D. salina response to high-alkali is neglected. Here we first checked the different response to D. salina to gradient alkali stress. We used the salt solution with gradient pH degree to simulate alkali stress, and found D. salina also showed high tolerance to high gradient alkali. D. salina still even sustained high alkali over pH11.0, still presented high cell growth density. As the control, the unicellular C. reinhardtii showed sensitive to salt, also showed more sensitive to high alkali, phenotypic analysis showed all of C. reinhardtii cell did gown well on the medium over pH9.0, and cannot sustain the high alkali stress over pH11.0. High alkali also did not affect the chlorophyll content of D. salina. Thus, these data confirm the alkali-tolerance feature of D. salina. Meanwhile, we performed the transmission electron microscopy to observe the subcellular structure, and found that the obvious accumulation of starch and lipid after alkali stress, hinting accumulated starch granule and lipid drop possibly provide more energy to enhance D. salina tolerance to high alkali stress. Meanwhile, we also found high alkali stress caused the abnormal chloroplast structure, and more wrinkled and collapsed chloroplast or mitochondrial was observed, suggesting the possible damage of alkali on cell viability of D. salina.
High-throughput omics approaches are widely used to deciphering the molecular mechanism of plant response to environmental stress [1,9]. Here we also adopted the RNA-seq method to investigate the transcriptomic profile after 6, 12 and 24 h of high-alkali treatment at pH10.0, and obtained hundreds of DEGs that showed different expressing among these samples, PCA analysis reveals that all these DEGs was clustered into three groups, and the sample of 6 and 12 h was clustered together, suggesting the similar early response of D. salina response to high alkali stress. Heat-map analysis revealed that the main groups of DEGs belong to nitrogen compounds metabolism, following heterocycle metabolic process, organic cyclic compounds metabolic process, etc. Several DEGs associated with these processes were further validated by RT-qPCR analysis. For example, lipid biosynthesis related genes long-chain acyl-CoA synthetase 2 and sphingosine-1-phosphate lyase(B), and β-carotene biosynthesis related genes including carotene globule protein, carotenoid cleavage dioxygnase 1, chloroplast carotene biosynthesis related protein and carotenoid cleavage protein 2 was obviously altered, such change was also validated by RT-qPCR analysis. In our transcriptome data, most of DEGs belong to nitrogen metabolism. Nitrogen Reductase is mainly responsible for nitrogen metabolism in plant. Here we found high alkali stress obviously increased the activity of NR, further suppressing NR activity by its specific inhibitor distinctly suppressed the photosynthesis ability of alga, suggesting the critical role of NR during D. salina response to high alkali stress. Accumulated evidence demonstrated that NR-dependent NO acted as the messenger to control alga response to environmental stress. In this study we also found that high alkali induced the quick accumulation of NO, and removing NO generation by specific scavenger also reduced cell density and photosynthesis capability, which further propose that NR-dependent NO signal is necessary for D. salina adaptation to high alkali stress.
In summary, our results demonstrated that D. salina only showed more tolerance to high salt stress, but also show strong tolerance high alkali stress. Further the transcriptome analysis revealed the transcriptional event associated with nitrogen metabolism, mainly nitrogen reductase activity, showed main contribution to the high alkali stress. During this process, NR-dependent nitric oxide plays the critical role for such tolerance. After all, our results identified a new mechanism by which NR-dependent NO signal enhanced D. salina adaptation to high alkali stress, extend our understanding of NO signal in alga adaptation to extreme environmental stress.
Funding Statement: This work was supported by the National Natural Science Foundation of China (Grant No. 31970289).
Conflicts of Interest: The authors declare that they have no conflicts of interest to report regarding the present study.
1. Liang, M. H., Jiang, J. G., Wang, L., Zhu, J. H. (2020). Transcriptomic insights into the heat stress response of dunaliella bardawil. Enzyme and Microbial Technology, 132, 109436. DOI 10.1016/j.enzmictec.2019.109436. [Google Scholar] [CrossRef]
2. Zhu, Q. L., Bao, J., Liu, J., Zheng, J. L. (2020). High salinity acclimatization alleviated cadmium toxicity in dunaliella salina: Transcriptomic and physiological evidence. Aquatic Toxicology, 223, 105492. DOI 10.1016/j.aquatox.2020.105492. [Google Scholar] [CrossRef]
3. Wu, Z., Duangmanee, P., Zhao, P., Juntawong, N., Ma, C. (2016). The effects of light, temperature, and nutrition on growth and pigment accumulation of three dunaliella salina strains isolated from saline soil. Jundishapur Journal of Microbiology, 9(1), e26732. DOI 10.5812/jjm. [Google Scholar] [CrossRef]
4. Gilmour, D. J. (2019). Microalgae for biofuel production. Advances in Applied Microbiology, 109, 1–30. DOI 10.1016/bs.aambs.2019.10.001. [Google Scholar] [CrossRef]
5. Almutairi, A. W. (2020). Effects of nitrogen and phosphorus limitations on fatty acid methyl esters and fuel properties of Dunaliella salina. Environmental Science and Pollution Research International, 27(26), 32296–32303. DOI 10.1007/s11356-020-08531-8. [Google Scholar] [CrossRef]
6. Anila, N., Simon, D. P., Chandrashekar, A., Ravishankar, G. A., Sarada, R. (2016). Metabolic engineering of dunaliella salina for production of ketocarotenoids. Photosynthesis Research, 127(3), 321–333. DOI 10.1007/s11120-015-0188-8. [Google Scholar] [CrossRef]
7. Azachi, M., Sadka, A., Fisher, M., Goldshlag, P., Gokhman, I. et al. (2002). Salt induction of fatty acid elongase and membrane lipid modifications in the extreme halotolerant alga Dunaliella salina. Plant Physiology, 129(3), 1320–1329. DOI 10.1104/pp.001909. [Google Scholar] [CrossRef]
8. Chitlaru, E., Pick, U. (1991). Regulation of glycerol synthesis in response to osmotic changes in dunaliella. Plant Physiology, 96(1), 50–60. DOI 10.1104/pp.96.1.50. [Google Scholar] [CrossRef]
9. He, Q., Lin, Y., Tan, H., Zhou, Y., Wen, Y. et al. (2020). Transcriptomic profiles of Dunaliella salina in response to hypersaline stress. BMC Genomics, 21(1), 115. DOI 10.1186/s12864-020-6507-2. [Google Scholar] [CrossRef]
10. Fachet, M., Witte, C., Flassig, R. J., Rihko-Struckmann, L. K., McKie-Krisberg, Z. et al. (2020). Reconstruction and analysis of a carbon-core metabolic network for Dunaliella salina. BMC Bioinformatics, 21(1), 1. DOI 10.1186/s12859-019-3325-0. [Google Scholar] [CrossRef]
11. Singh, P., Baranwal, M., Reddy, S. M. (2016). Antioxidant and cytotoxic activity of carotenes produced by Dunaliella salina under stress. Pharmaceutical Biology, 54(10), 2269–2275. DOI 10.3109/13880209.2016.1153660. [Google Scholar] [CrossRef]
12. Lv, H., Cui, X., Wahid, F., Xia, F., Zhong, C. et al. (2016). Analysis of the physiological and molecular responses of dunaliella salina to macronutrient deprivation. PLoS One, 11(3), e0152226. DOI 10.1371/journal.pone.0152226. [Google Scholar] [CrossRef]
13. Kavitha, M., Doddaiah, A., Narayan, R., Gokare, A., Sarada, R. (2013). Effect of metabolic inhibitors on growth and carotenoid production in dunaliella bardawil. Journal of Food Science and Technology, 50(6), 1130–1136. DOI 10.1007/s13197-011-0429-6. [Google Scholar] [CrossRef]
14. Leon, J., Costa, A., Castillo, M. C. (2016). Nitric oxide triggers a transient metabolic reprogramming in arabidopsis. Science Report, 6, 37945. DOI 10.1038/srep37945. [Google Scholar] [CrossRef]
15. Gupta, K. J., Kolbert, Z., Durner, J., Lindermayr, C., Corpas, F. J. et al. (2020). Regulating the regulator: Nitric oxide control of post-translational modifications. New Phytologist, 227(5), 1319–1325. DOI 10.1111/nph.16622. [Google Scholar] [CrossRef]
16. Corpas, F. J., Gonzalez-Gordo, S., Palma, J. M. (2020). Nitric oxide: A radical molecule with potential biotechnological applications in fruit ripening. Journal of Biotechnology, 324, 211–219. DOI 10.1016/j.jbiotec.2020.10.020. [Google Scholar] [CrossRef]
17. Thalineau, E., Truong, H. N., Berger, A., Fournier, C., Boscari, A. et al. (2016). Cross-regulation between N metabolism and nitric oxide (NO) signaling during plant immunity. Frontiers in Plant Science, 7, 472. DOI 10.3389/fpls.2016.00472. [Google Scholar] [CrossRef]
18. Mata-Perez, C., Sanchez-Calvo, B., Padilla, M. N., Begara-Morales, J. C., Valderrama, R. et al. (2017). Nitro-fatty acids in plant signaling: New key mediators of nitric oxide metabolism. Redox Biology, 11, 554–561. DOI 10.1016/j.redox.2017.01.002. [Google Scholar] [CrossRef]
19. Neill, S., Barros, R., Bright, J., Desikan, R., Hancock, J. et al. (2008). Nitric oxide, stomatal closure, and abiotic stress. Journal of Experimental Botany, 59(2), 165–176. DOI 10.1093/jxb/erm293. [Google Scholar] [CrossRef]
20. Gas, E., Flores-Perez, U., Sauret-Gueto, S., Rodriguez-Concepcion, M. (2009). Hunting for plant nitric oxide synthase provides new evidence of a central role for plastids in nitric oxide metabolism. Plant Cell, 21(1), 18–23. DOI 10.1105/tpc.108.065243. [Google Scholar] [CrossRef]
21. Vidal, A., Cantabella, D., Bernal-Vicente, A., Diaz-Vivancos, P., Hernandez, J. A. (2018). Nitrate- and nitric oxide-induced plant growth in pea seedlings is linked to antioxidative metabolism and the ABA/GA balance. Journal of Plant Physiology, 230, 13–20. DOI 10.1016/j.jplph.2018.08.003. [Google Scholar] [CrossRef]
22. Guo, F. Q., Okamoto, M., Crawford, N. M. (2003). Identification of a plant nitric oxide synthase gene involved in hormonal signaling. Science, 302(5642), 100–103. DOI 10.1126/science.1086770. [Google Scholar] [CrossRef]
23. Zhu, Y. H., Jiang, J. G., Yan, Y., Chen, X. W. (2005). Isolation and characterization of phytoene desaturase cDNA involved in the beta-carotene biosynthetic pathway in Dunaliella salina. Journal of Agricultural and Food Chemistry, 53(14), 5593–5597. DOI 10.1021/jf0506838. [Google Scholar] [CrossRef]
24. He, D., Deng, G., Ying, S., Yang, W., Wei, J. et al. (2020). Carbon monoxide signal breaks primary seed dormancy by transcriptional silence of DOG1 in Arabidopsis thaliana. Phyton-International Journal of Experimental Botany, 89(3), 633–643. DOI 10.32604/phyton.2020.010498. [Google Scholar] [CrossRef]
25. Yu, L., Zhou, W., Zhang, D., Yan, J., Luo, L. (2020). Phytosulfokine-α promotes root growth by repressing expression of pectin methylesterase inhibitor (PMEI) genes in Medicago truncatula. Phyton-International Journal of Experimental Botany, 89(4), 873–881. DOI 10.32604/phyton.2020.011882. [Google Scholar] [CrossRef]
26. Mao, X. M., Zhang, Y., Wang, X. F., Liu, J. (2020). Novel insights into salinity-induced lipogenesis and carotenogenesis in the oleaginous astaxanthin-producing alga chromochloris zofingiensis: A multi-omics study. Biotechnology for Biofuels, 13(1), 13:73. DOI 10.1186/s13068-020-01714-y. [Google Scholar] [CrossRef]
27. Hu, X., Neill, S. J., Cai, W., Tang, Z. (2003). Nitric oxide mediates elicitor-induced saponin synthesis in cell cultures of panax ginseng. Functional Plant Biology, 30(8), 901–907. DOI 10.1071/FP03061. [Google Scholar] [CrossRef]
28. Hu, X., Neill, S. J., Tang, Z., Cai, W. (2005). Nitric oxide mediates gravitropic bending in soybean roots. Plant Physiology, 137(2), 663–670. DOI 10.1104/pp.104.054494. [Google Scholar] [CrossRef]
29. Zhao, M. G., Chen, L., Zhang, L. L., Zhang, W. H. (2009). Nitric reductase-dependent nitric oxide production is involved in cold acclimation and freezing tolerance in arabidopsis. Plant Physiology, 151(2), 755–767. DOI 10.1104/pp.109.140996. [Google Scholar] [CrossRef]
 | This work is licensed under a Creative Commons Attribution 4.0 International License, which permits unrestricted use, distribution, and reproduction in any medium, provided the original work is properly cited. |