International Journal of
Experimental Botany
| Phyton- International Journal of Experimental Botany |
DOI: 10.32604/phyton.2021.015557
ARTICLE
Diversity Analysis of Chlorophyll, Flavonoid, Anthocyanin, and Nitrogen Balance Index of Tea Based on Dualex
1College of Biology and Agriculture Science and Technology, Zunyi Normal University, Zunyi, 563000, China
2Tea Research Institute, Zunyi Normal University, Zunyi, 563000, China
*Corresponding Author: Jiazhen Wang. Email: Jiazhen.wang@zync.edu.cn
Received: 08 December 2020; Accepted: 25 February 2021
Abstract: The chemical compositions of tea (Camellia sinensis) are affected by numerous factors, such as cultivar, climate, leaf position, and cultivation pattern. However, under the same conditions, the chemical compositions are mainly determined by varieties. Therefore, we investigated the genetic diversity of chemical compositions of tea tree resources in China to screen excellent germplasm resources. Three chemical compositions index (including chlorophyll index, flavonoid index, and anthocyanin index) and the nitrogen balance index of tea leaves were measured in 102 tea germplasms planted in Chinese Tea Plants Improved Variety Germplasm Resources Nursery (CTPIVGRN) by Dualex on April 15 2019. Results showed that the chlorophyll, flavonoid, and anthocyanin contents and the nitrogen balance index significantly differed between the 102 tea germplasms. The genetic diversity index values were 2.005, 2.246, 1.599, and 1.838, and the average genetic diversity was 1.922. The 102 tea germplasms can be divided into four categories by cluster analysis under the genetic distance threshold of 11. These results suggest that the genetic diversity of tea germplasm resources in China is rich. This study’s results can serve as a basis for the diversified development and utilization of tea plant.
Keywords: Tea; nitrogen balance index; diversity; chlorophyll; anthocyanin; flavonoid
Tea is a beverage mainly processed from the leaves of Camellia L. The history of tea drinking can be traced back to the Shennong period five or six thousand years ago [1]. As the world’s most commonly consumed beverage besides water [2], tea not only has an important influence in the economy [3,4] and culture [5] but also benefits the human body because of its many chemical components. It has an adjuvant treatment effect on many diseases [6,7]. For example, black tea can decrease peripheral vascular resistance [8]. As the origin centre of tea plant, China has an abundance of wild tea plant varieties and cultivated varieties [9], which provide abundant germplasm resources for selecting and breeding new tea varieties, tea plant production, and utilization and tea plant germplasm innovation. Studying the genetic diversity of the physiochemical components of tea plants helps select new high-quality varieties. Studies on tea tree resources in many provinces in China, such as Shanxi [10], Guangxi [11], Zhejiang [12], Guizhou [13], Sichuan [14], Yunnan [15], and Hunan [16] have shown that the genetic diversity index of tea resources is relatively high in each province. All provinces have selected new high-quality varieties, which have contributed to the local tea industry’s development. Among the many traits of the tea plant, the physiochemical components of fresh leaves play an important role in evaluating tea quality and the selection of tea suitability. Chlorophyll content indicates the nutritional status of tea tree and closely relates to the colors of the tea and the leaf [17,18]. The catechins in the tea flavonoids are related to the bitterness and astringency of tea soup [6], and the high content of anthocyanins in the tea adds bitterness to the tea soup [19]. Nitrogen balance index (NBI) is a ratio about chlorophyll and flavonoids [20]. Using NBI can determine the status of plant nitrogen and forecast crop yields [21,22]. NBI can be quickly and nondestructive determination by Dualex4. This apparatus can avoid delay effect for plant [20]. The time of large enough NBI existing significantly correlated to the forming of grain protein content [23].
Previous studies mainly focused on studying tea polyphenols and amino acids in vitro by chemical methods, but few studies focused on the diversity of chlorophyll, anthocyanin, flavonoid, and nitrogen balance index based on the rapid and nondestructive determination in the field. In this study, chlorophyll index, flavonoid index, anthocyanin index, and nitrogen balance index of tea leaves from 102 domestic tea germplasms were determined in situ by nitrogen balance index measuring instrument-Dualex. The genetic diversity of chlorophyll index, flavonoid index, anthocyanin index, and nitrogen balance index of tea was studied. This study provides a theoretical basis for the development and utilization of tea germplasm resources.
A total of 102 accession tea genetic resources that geographically originated from 12 provinces in China (Fig. 1) and are currently planted in Chinese Tea Plants Improved Variety Germplasm Resources Nursery (CTPIVGRN) were sampled for analyses. The first, second, and third leaves from the top were selected to analyse tea quality components. The leaves were collected from the consistent growth of tea seedlings from the genetics resources planting in the CTPIVGRN.
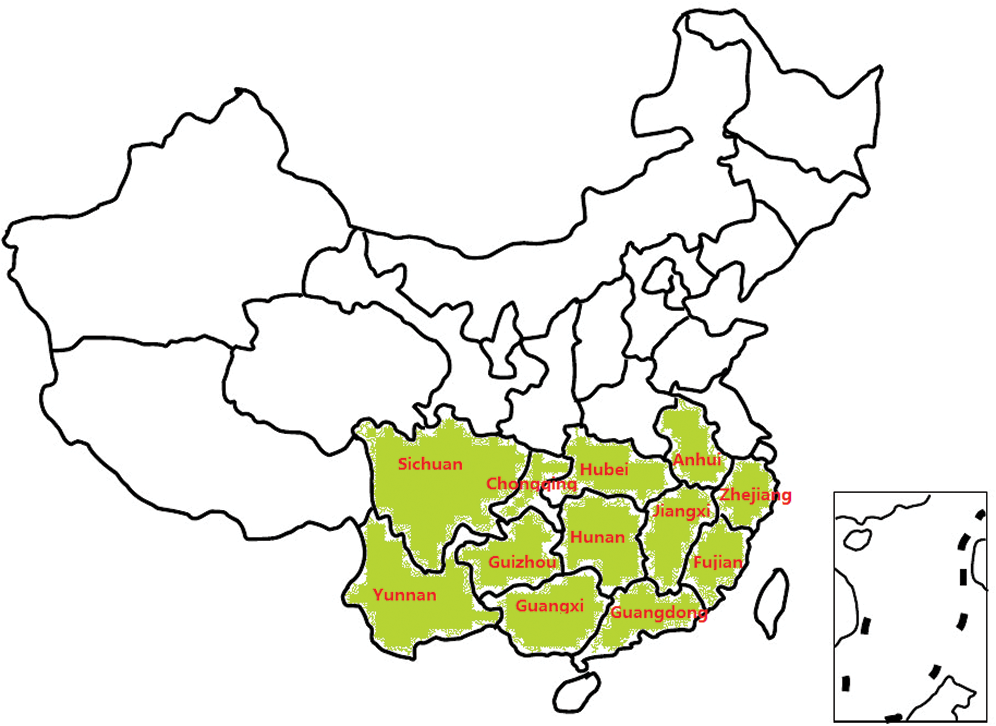
Figure 1: 102 accession tea genetic resources distribution area
The chlorophyll index, flavonoid index, anthocyanin index, and nitrogen balance index (Chl/Flav Ratio) of the first, second, and third leaves from the top of tea plants were measured using a Dualex (ORCE-A, Orsay, France. It is a portable, fast, nondestructive, in-situ apparatus that simultaneously displays the chlorophyll index, anthocyanin index, flavonoid index and nitrogen balance index). On April 15, 2019, five to seven plants per species were randomly selected, delimited by the cultivation range of the 102 species. Three sun-exposed and mature green leaves per plant were used to measure chlorophyll index, flavonoid index, anthocyanin index, and nitrogen balance index (Chl/Flav Ratio). Three leaf chemical content indexes and nitrogen balance index were measured directly on the field on April 15 between 10:00 am and 4:00 pm. Eight record points were taken on the adaxial side of each leaf. Eight values were then averaged to represent the four indexes of the leaf.
Data were analyzed using Excel and SPSS26.0 software. A diagram was drawn in Excel software. The genetic diversity of the four indexes were evaluated using the genetic diversity index [24]. The overall average (X) and standard deviation (σ) of the tested materials were calculated, and then every 0.5σ increment represented one level. The first level was
3.1 Differentiation Description of Physiochemical Composition Content of Tea
3.1.1 Difference Analysis of Physiochemical Composition Contents Among Different Germplasm
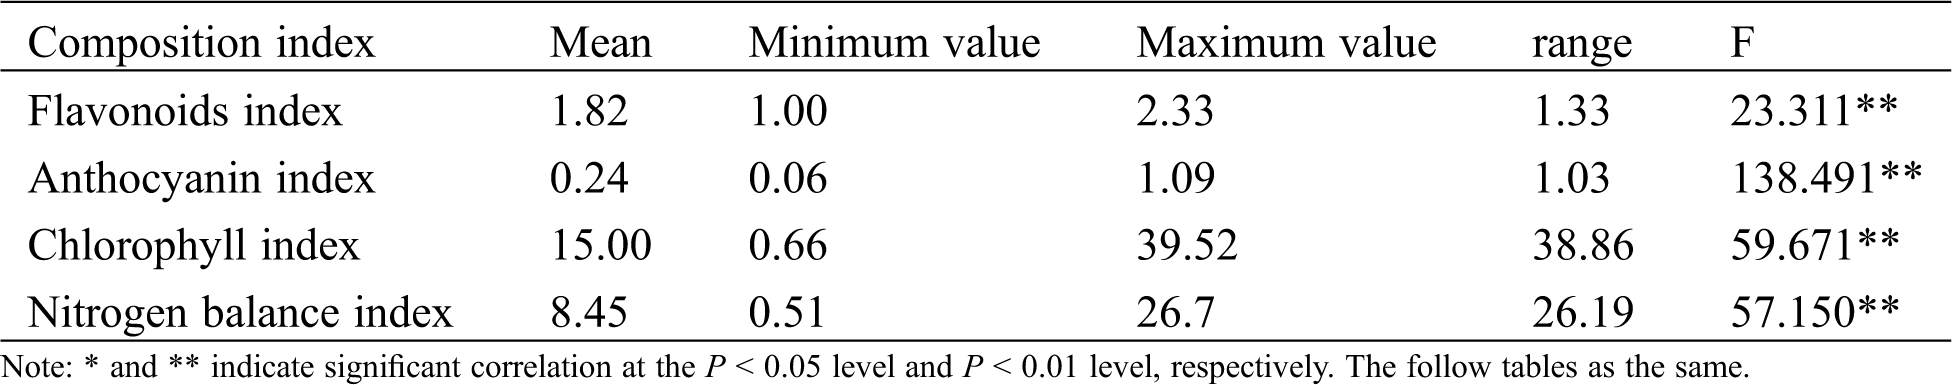
Under the same environmental conditions, the differences of physiochemical components reflect the genetic basis differences of tea germplasm. In this study, the chlorophyll, flavonoid, and anthocyanin indexes were used to represent the three components’ contents and analyze the differences between different varieties. Tab. 1 shows that the physiochemical composition of different tea species varied greatly. The ranges of flavonoids, anthocyanins, chlorophyll, and nitrogen balance index were 1.33, 1.03, 38.86, and 26.19, respectively. Variance analysis showed extremely significant differences in the physiochemical composition contents of the 102 tea species, indicating obvious potential differences in physiochemical properties between different germplasms, which provided a germplasm basis for breeding varieties with different quality traits.
Table 1: ANOVA of physiochemical compositions index in tea varieties
3.1.2 Classification Distribution Characteristics of Physiochemical Composition Contents among Different Germplasms
In accordance with the grading standard calculated by the genetic diversity index, the frequency of samples at all levels of physiochemical composition index and nitrogen balance index showed normal distribution (Fig. 2). The chlorophyll index and nitrogen balance index were at the fourth and sixth levels. The varieties with the nitrogen balance index between 4.6 and 6.5 accounted for 28.0%, and the varieties with the nitrogen balance index between 8.4 and 10.5 accounted for 23.0%. The varieties with the chlorophyll index between 9.04 and 12.02 accounted for 18.0%. The chlorophyll index was between 15.00 and 17.98, accounting for 19.0%. The flavonoid index was mainly concentrated in level 8 that is, mainly distributed between 2.04 and 2.14, accounting for 24.0%. The anthocyanin index reached the highest in level 5, ranging from 0.19 to 0.25, accounting for 33%. The hierarchical distribution of physiochemical component index and nitrogen balance index suggests that the genetic basis of physiochemical component contents is relatively complex. It could be quantitative traits and have multiple gene loci. It also may exist multiple alleles.
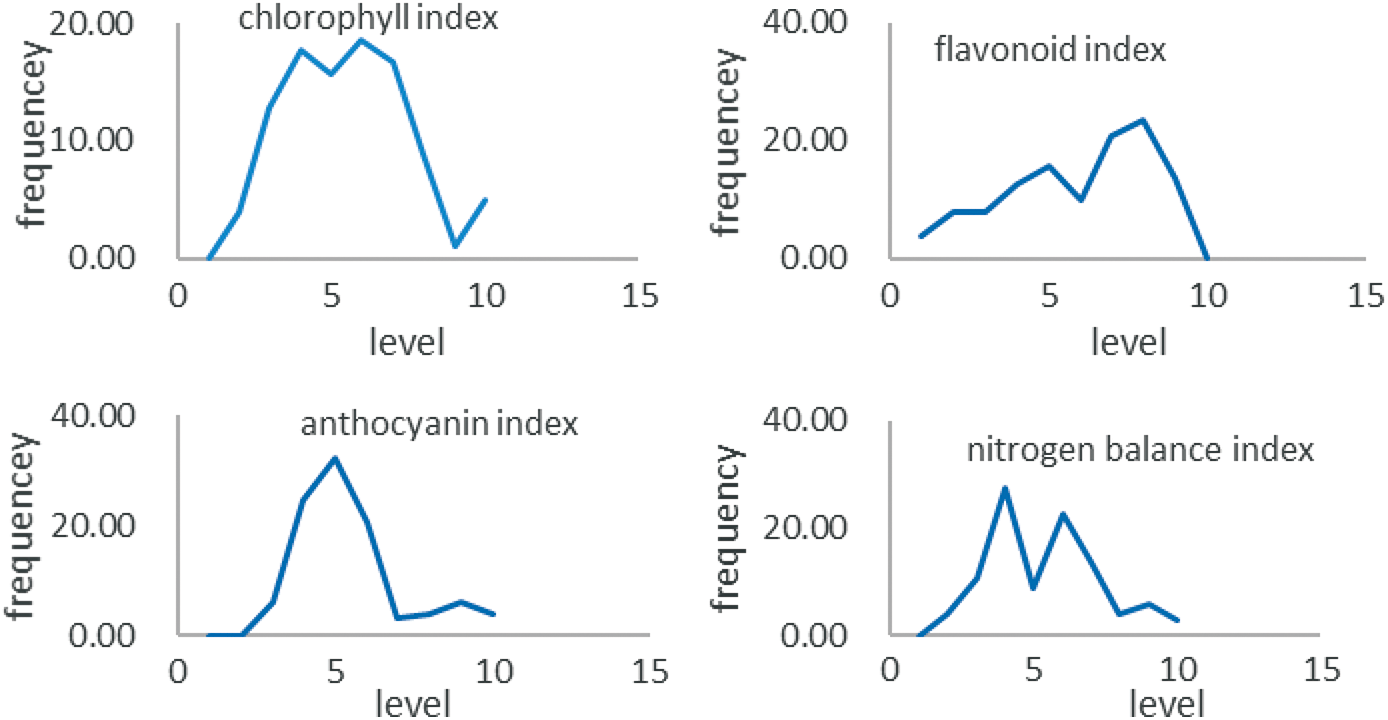
Figure 2: Frequency distribution of different samples of tea physiochemical composition index
3.2 Analysis of Genetic Diversity of Physiochemical Components in Tea Leaves
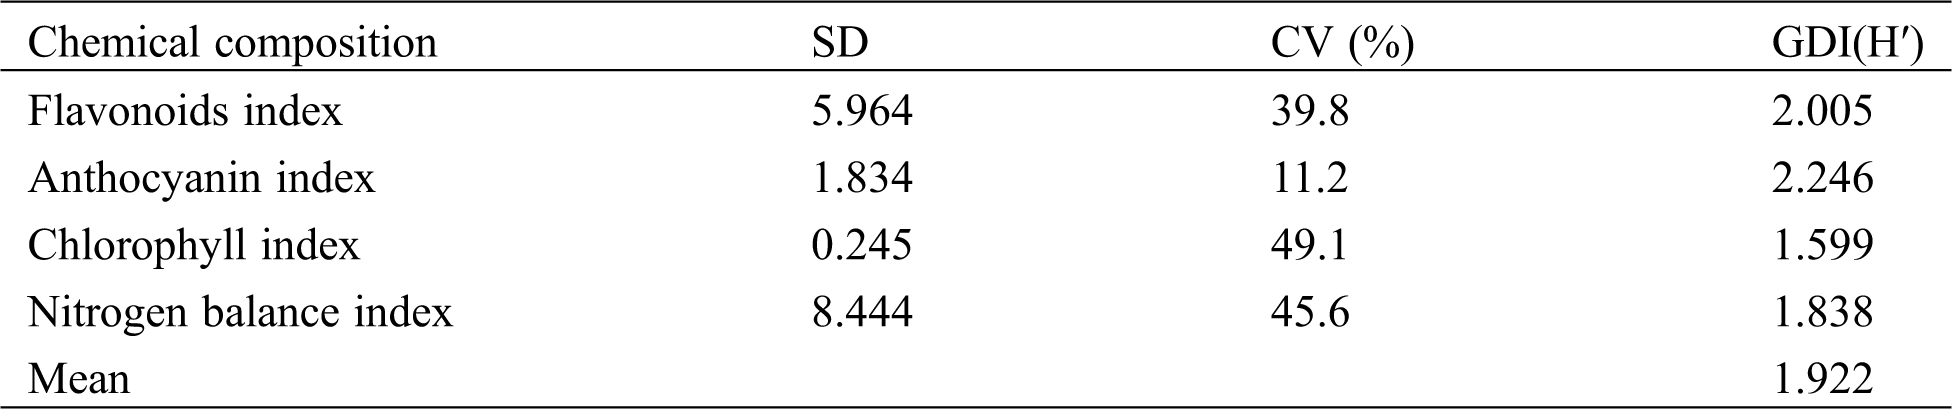
As shown in Tab. 2, the genetic diversity coefficient of the physiochemical composition contents and the nitrogen balance index were all greater than 1, and the genetic diversity index of the flavonoid index was the highest, reaching 2.246. The diversity index of the anthocyanin index was relatively low (1.599). In addition, the average genetic diversity index I of the physiochemical components reached 1.922, indicating that the physiochemical components have high genetic diversity, which provides a basis for the diversified utilization of germplasm resources.
Table 2: Genetic diversity of physiochemical compositions of tea
3.3 Correlation Coefficient of Chlorophyll, Flavonoid, Anthocyanin, and Nitrogen Balance Index
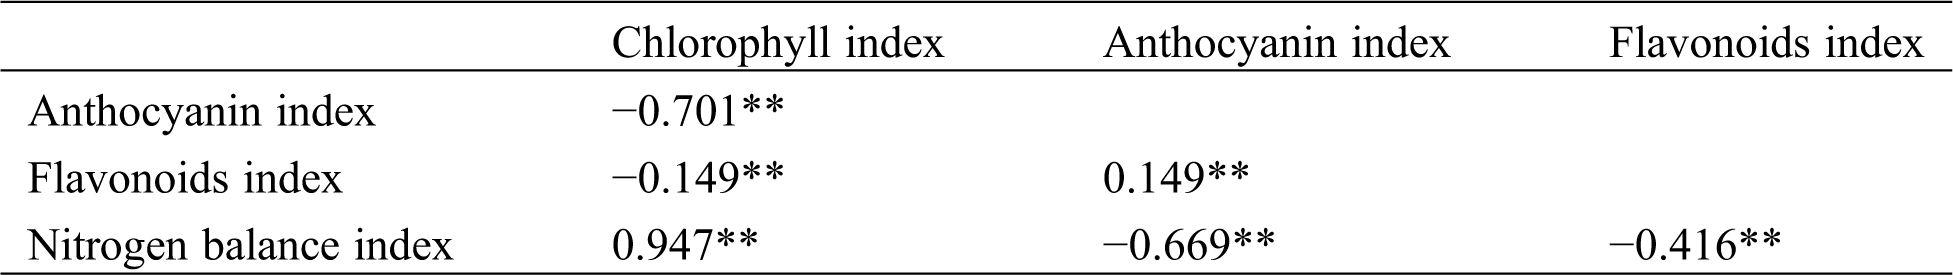
Correlation analysis showed a significant correlation between the indexes of physiochemical compositions (Tab. 3). The chlorophyll index positively correlated with the nitrogen balance index and negatively correlated with the anthocyanin and flavonoid indexes. The chlorophyll index correlates the most with the nitrogen balance index the highest, with r = 0.947**. Previous studies showed that the chlorophyll index and nitrogen balance index reflect the basic characteristics of plant nutrition. The flavonoid and anthocyanin indexes are extremely correlated with the quality of tea taste [25]. The study results can be used as important indicators for tea taste evaluation.
Table 3: Correlation coefficient among physiochemical compositions index
Clustering analysis of the physiochemical components of 102 tea resources was carried out using the systematic clustering method of average connection between groups. Under the threshold of genetic distance of 11, 102 resources can be divided into the following four groups: The first group has 55 tea resources. The chlorophyll index of this type was medium, the flavonoid index was the highest, and the anthocyanin index was high. The second group had 28 tea resources, and the three types of indexes were all at the middle level. The third group included the remaining 17 resources, in which the chlorophyll index was the lowest, the flavonoid index was moderately high, and the anthocyanin index was the highest. The fourth group, including the remaining two resources, had the highest chlorophyll index, and the flavonoid index and anthocyanin index were the lowest (Fig. 3).
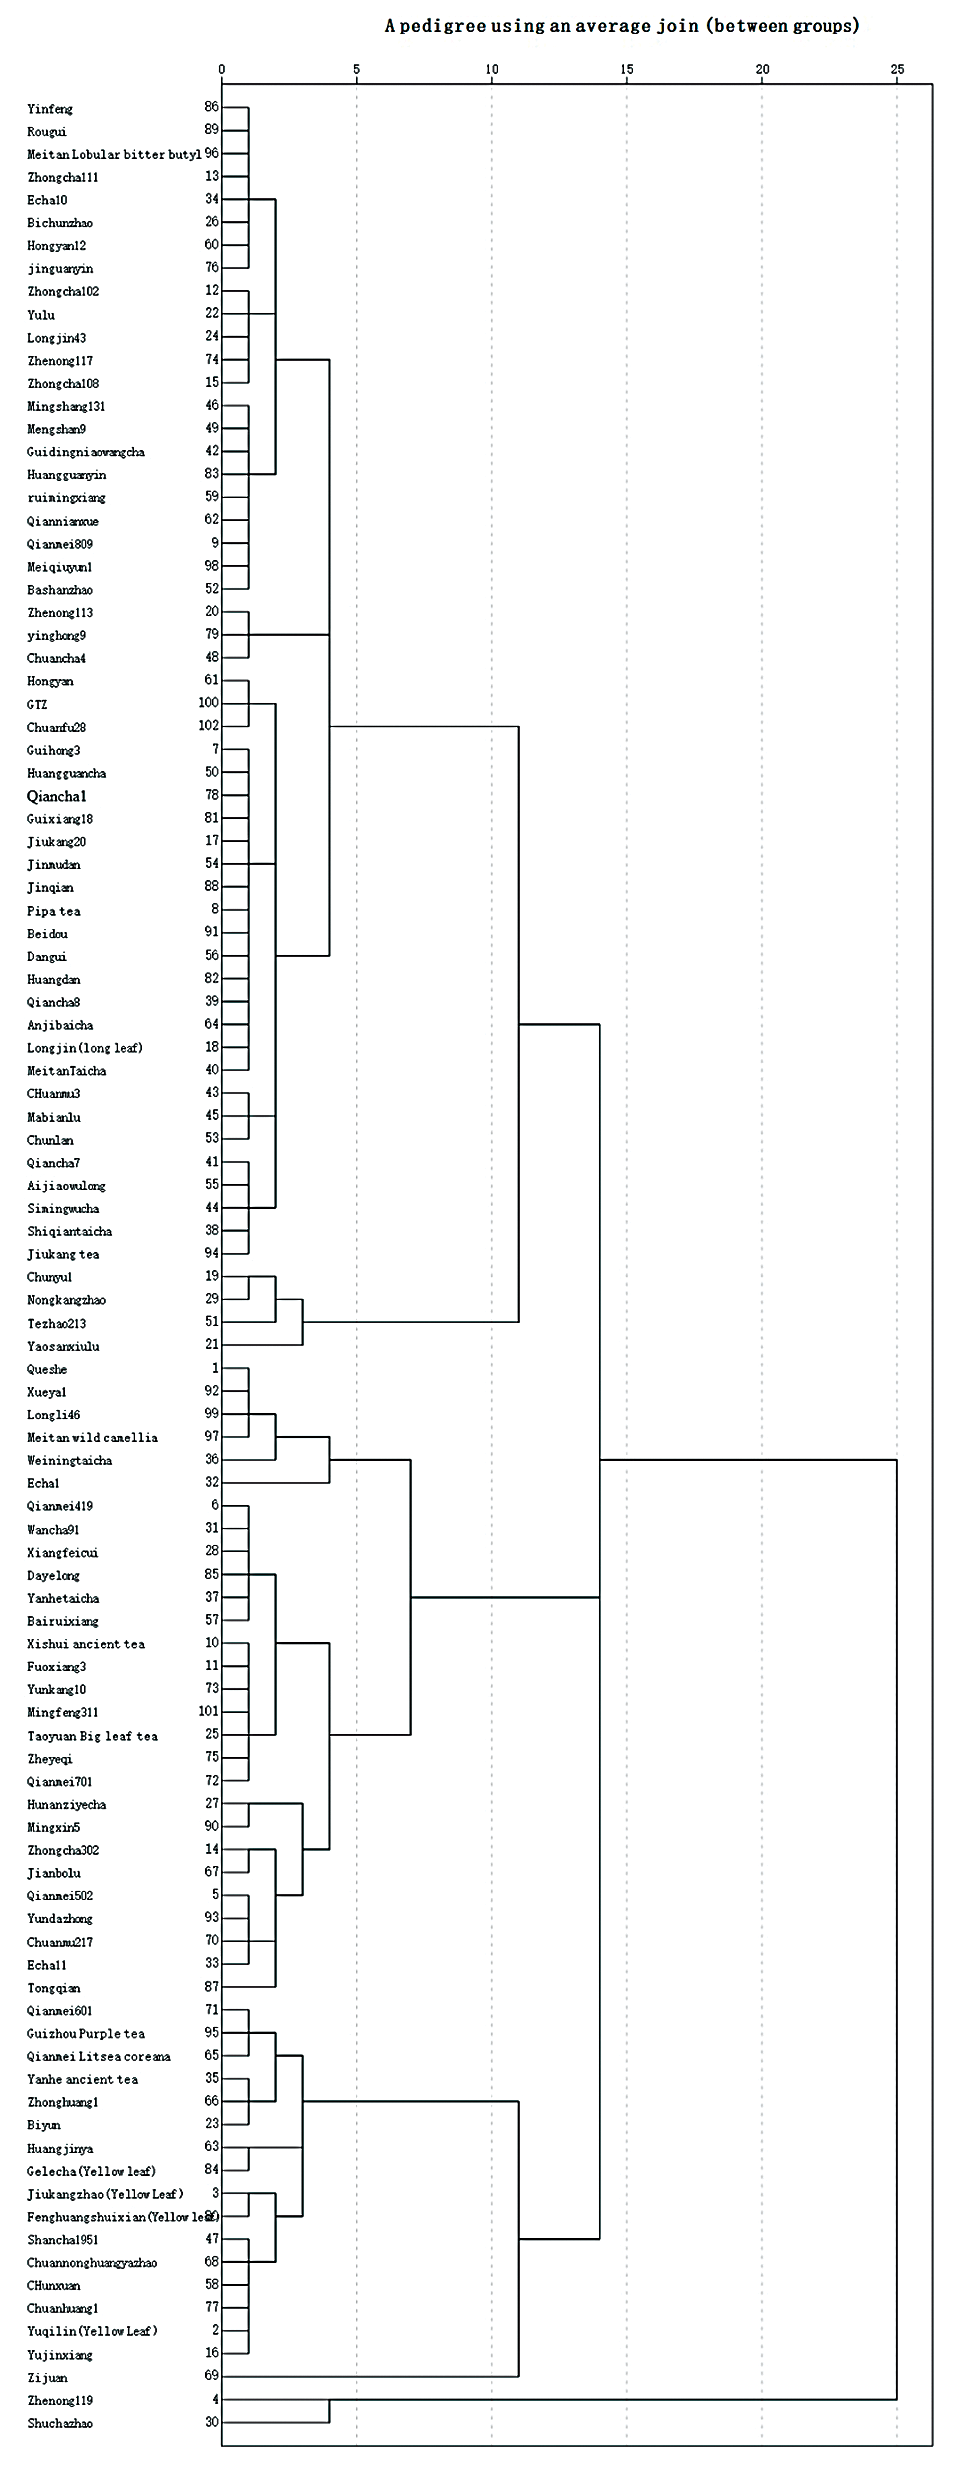
Figure 3: Systematic cluster analysis of 102 varieties
The genetic diversity of tea physiochemical components reflects the genetic structure of tea physiochemical components to a certain extent. Significant differences between the varieties indicate different genetic backgrounds, which provide a choice for new materials. China has abundant germplasm resources of tea trees. The researchers confirmed this conclusion by analyzing the genetic diversity of tea trees in each province using modern biotechnology. Liu et al. [26], Jiang et al. [27], Wu et al. [28] analyzed the genetic diversity of tea plant resources in Fujian using EST-SSR and SSR techniques respectively, and the results all concluded that the genetic diversity of tea plant resources in Fujian was rich. Shen et al. using RAPD markers studied the genetic diversity and genetic variation of 240 tea trees in Hunan and found 226 loci. 201 loci among the total 226 loci were polymorphic [29]. Using RAPD technique, Pan analyzed the genetic diversity of 26 surviving tea plant germplasm from 28 tea cultivars in 7 populations in Shaanxi. of the 335 loci amplified, 323 were polymorphic [30]. Ding et al. used 50 pairs of primers to perform SSR-PCR amplification on 65 local superior population species of tea trees in Anhui, and 244 allelic loci were detected. Genetic diversity analysis showed that 65 population species resources of tea trees had high genetic diversity [31]. Cao collected 51 tea tree varieties from 9 cities and prefectural regions in Guizhou province. Using high-throughput RNA-Seq analysis, he concluded that tea tree resources in Guizhou Province had abundant polymorphism [13]. The same conclusion was obtained from the diversity analysis of the chemical composition of tea plant resources. Wang et al. analyzed the genetic diversity of 17 biochemical indexes of 98 tea tree resources in Guangxi, and the average genetic diversity index reached 1.90, indicating that there was rich diversity in the biochemical components of local tea tree resources in Guangxi [11]. In Jiangxi Province, Wang et al. analyzed 16 chemical components of 45 tea plant resources. The average genetic diversity index and average coefficient of variation of the 45 resources were 1.91 and 31.36%. The results indicated that the genetic diversity of the 45 resources was rich [32]. Ji et al. analyzed the water extracts, caffeine, tea polyphenols and amino acids of 104 Yunnan tea plant resources, which indicated that Yunnan tea plant resources had rich biochemical diversity [33]. Based on the abundant germplasm resources of tea trees in Guangdong, breeders have bred tea varieties with high tea polyphenols, high caffeine, high amino acids [34], high flavor [35,36], and no caffeine variety [37]. The main biochemical components (including water extract, tea polyphenols, amino acids, caffeine, catechin, ester catechin, simple catechin, etc.) of 33 tea plant resources in Sichuan were identified and analyzed. The results showed that there were rich diversity and variation in the biochemical components of tea plant resources tested [38]. In this experiment, 102 tea tree resources were collected from 12 provinces and cities in China, including 19 from Fujian, 5 from Yunnan, 1 from Jiangxi, 21 from Zhejiang, 6 from Hunan, 4 from Guangdong, 2 from Guangxi, 1 from Chongqing, 3 from Anhui, 3 from Hubei, 22 from Guizhou, and 15 from Sichuan. In the selected province, Yunnan [39], Guizhou [40], and Guangxi [41] were the tea plants origin area. The average coefficients of variation of chlorophyll index, flavonoid index, anthocyanin index, and nitrogen balance index of these 102 materials reached 36.4%, the average diversity index was 1.92, and the variation types were relatively abundant. The coefficients of variation of chlorophyll and anthocyanin were relatively high, which provides a rich resource base for breeding different new varieties.
Different from previous studies, the diversity of chlorophyll and nitrogen balance index was analyzed in this experiment. Chlorophyll in green plants has chlorophyll a and chlorophyll b two kinds. They are the important green pigment of photosynthesis. The content of chlorophyll has high diversity among different tea varieties [42]. The level of chlorophyll content in tea fresh leaf decides the quality of tea and the tea type for tea fresh leaf. The high chlorophyll content is suitable for processing into green tea, which gives the tea water a bright green color. However, the degree of chlorophyll degradation into pheophytin and pheophorbide during processing affects the appearance and color of tea leaves [43]. In this study, we divided the 102 tea plant resources into four groups by cluster analysis. Among the four major groups, the fourth group had the highest chlorophyll index. According to previous studies, this kind of tea plant has high value for processing quality green tea. As the ratio of chlorophyll to polyphenol, NBI reflects crop nitrogen deficiencies because chlorophyll and polyphenols are inversely dependent on nitrogen nutrition status [21,44]. Under the same condition, the difference NBI of tea varieties can reflect difference of nitrogen use capacity of tea plants. The higher NBI has the higher nitrogen use capacity. Our experiment result showed that Shuchazhao, Zhenong 119, Tezhao 213, Qianmei 502, Nongkangzhao, Yundazhong, Echa 11, Chuanmu 217, Tongqian et al. have high NBI. All these varieties exhibited high yield and wide adaptability in production. This suggests that NBI may be an important indicator for the breeding of tea varieties with high yield. Flavonoids are major secondary metabolites present in tea plant which synthesized from phenylalanine [45]. It closely related to the rich flavors of tea water. Functional studies found that some components of flavonoids have antioxidant, antimicrobial, anticancer, anti-atherosclerotic, and anti-proliferative properties [46,47], and can reduce risk of degenerative diseases including cancer and heart disease [48]. Anthocyanins belong to the flavonoids [49], and have numerous health beneficial properties [50]. High Anthocyanin content tea cultivars can be used to produce purple teas. In the present study, the first group of the 102 tea plant resources has the highest flavonoid index, the third group has the highest anthocyanin index. Flavonoids are degraded during fermentation to give black tea a special flavor, so a high flavonoid content is conducive to the formation of black tea flavor. The first group has a higher flavonoid index, which means its flavonoid content is high and conducive to the processing of high quality black tea. Anthocyanins can give tea its unique color, and they have health function, so the third group is suitable for processing into characteristic tea.
The coefficients of variation of chlorophyll index, flavonoid index, anthocyanin index and nitrogen balance index were 49.1%, 39.8%, 11.2% and 45.6%, respectively. There has abundant variation among them. Further analysis of the genetic diversity showed that the genetic diversity indexes were all greater than 1, the average index reached 1.922, indicating a rich diversity of China tea plant resources. This provides material guarantee for the breeding of tea varieties with different characteristics. Cluster analysis divided the 102 resources into four major groups, and the physiochemical components of each group were different. The first group has the highest flavonoid index, indicating that it is suitable for black tea. The second group and the third group are in the middle and suitable for black and green concurrent systems. The fourth group has the highest chlorophyll index and lowest flavonoid index. Some studies believe that the chlorophyll content in tea is excessively high to be suitable for black tea [51]. Varieties with low flavonoid content are suitable for green tea, whereas varieties with high content are suitable for black tea [52,53]. The suggesting for the fourth group is suitable processing into green tea.
Funding Statement: The study was funded by supporting Project No. Qian ke he [2020] 1Y71; PhD Fund Project No. Zunshi 138 [2019] 22; Education Department of Guizhou Province Scientific Research Project No. Qianjiaohe KY word 2017-023; Zunyi City Science and Technology Bureau Project (Zunshike rencai 2020-2; Zunshikehe HZ word 2020-15).
Conflicts of Interest: The authors declare that they have no conflicts of interest to report regarding the present study.
1. Yu, M. (2015). History of tea talk at random. Shanghai: Shanghai Ancient Books Publishing House. [Google Scholar]
2. Liu, Z. H. (2018). Update on tea science research. Journal of Food Safety and Quality Inspection, 9(2), 221–222. [Google Scholar]
3. Li, T. (2017). The development course and current situation of Guizhou tea industry. Journal of Henan Mechanical and Electrical Engineering College, 25(5), 48–51. [Google Scholar]
4. Wang, K. M., Huang, Y., Liu, Z. H. (2020). Empirical analysis of the international competitiveness of China’s tea industry. Research of Agricultural Modernization, 41(1), 45–54. [Google Scholar]
5. Ding, Y. S. (2011). The culture of Chinese tea. Hefei: Anhui Education Press. [Google Scholar]
6. Jia, X. D. (2001). Function and application of tea flavonoids. Foreign Medical Hygiene Section, 28(6), 369–371. [Google Scholar]
7. Zhong, J., Cao, J. (2007). The effect of various tea and tea polyphenols on weight loss and weight maintenance. Foeein Medical Geography Section, 28(1), 7–11, 26. [Google Scholar]
8. Fuchs, D., Nyakayiru, J., Draijer, R., Mulder, T. P. J., Hopman, M. T. E. et al. (2016). Impact of flavonoid-rich black tea and beetroot juice on postprandial peripheral vascular resistance and glucose homeostasis in obese, insulin-resistant men: a randomized controlled trial. Nutrition & Metabolism, 13. DOI 10.1186/s12986-016-0094-x34. [Google Scholar] [CrossRef]
9. Kan, N. C. (2013). Study on geographical distribution of wild tea trees in Sichuan and Chongqing, and origin of Tea Tree. Southwest China Journal of Agricultural Sciences, 26(1), 382–385. [Google Scholar]
10. Chen, X. (2016). Construction of DNA fingerprint of tea germplasms in Shanxi (Ma. D. Thesis). Shanxi: Shaanxi University of Technology. [Google Scholar]
11. Wang, X. C., Chen, L., Yang, Y. J. (2010). Biochemical diversity analysis of tea germplasms in Guangxi. Journal of Plant Genetic Resources, 11(3), 309–314. [Google Scholar]
12. Huang, H. T., Zhang, W., Ao, C., Cui, H. C., Yu, J. Z. et al. (2019). Diversity analysis of biochemical compositions in local tea germplasm resources and screening of excellent tea varieties in Hangzhou. Acta Agriculture Jiangxi, 31(1), 21–25. [Google Scholar]
13. Cao, S. (2018). Genetic diversity analysis of tea plants in Guizhou (Ma. D. Thesis). Guiyang: Guizhou Normal University. [Google Scholar]
14. Li, H. (2009). PCR-RFLP analysis chloroplast DNA among 30 tea (Camellia sinensis (L.) O. Kuntze) cultivars in Sichuan, China (Ma. D. Thesis). Ya’an: Sichuan Agriculture University. [Google Scholar]
15. Chen, C. L., Xie, X. Y., Huang, M., Deng, S. C., Bao, Y. X. et al. (2014). Research progress in rare tea germplasm from Yunnan. Hunan Agricultural Science, (12), 1–3. [Google Scholar]
16. Shen, C. W., Luo, J. W., Shi, Z. P., Gong, Z. H., Tang, H. P. et al. (2002). Study on genetic polymorphism of tea plants in Anhua Yuntaishan population by RAPD. Journal of Hunan Agricultural University (Natural Sciences), 28(4), 320–325. [Google Scholar]
17. Wang, K. B., Liu, F., Liu, Z. H., Huang, J. N., Xu, Z. X. et al. (2010). Analysis of chemical components in oolong tea in relation to perceived quality. International Journal of Food Science & Technology, 45(5), 913–920. DOI 10.1111/j.1365-2621.2010.02224.x. [Google Scholar] [CrossRef]
18. Song, X. Z., Zhao, Y. J., Zhang, J. F., Liu, P., Chen, J. H. (2002). Relationship between chlorophyll meter readings (SPAD readings) and chlorophyll content of tea leaves. Shandong Forestry Science and Technology, (6), 10–12. [Google Scholar]
19. Kan, N. C. (1985). Reduce anthocyanin accumulation and improve tea quality. Sichuan Agricultural Science and Technology, (4), 36–37. [Google Scholar]
20. Cerovic, Z. G., Masdoumier, G., Ghozlen, N. B., Latouchea, G. (2012). A new optical leaf-clip meter for simultaneous non-destructive assessment of leaf chlorophyll and epidermal flavonoids. Physiologia Plantarum, 146(3), 251–260. DOI 10.1111/j.1399-3054.2012.01639.x. [Google Scholar] [CrossRef]
21. Li, J. W., Zhang, F., Qian, X. Y., Zhu, Y. H., Shen, G. X. (2015). Quantification of rice canopy nitrogen balance index with digital imagery from unmanned aerial vehicle. Remote Sensing Letters, 6(3), 183–189. DOI 10.1080/2150704X.2015.1021934. [Google Scholar] [CrossRef]
22. da Silva, J. M. (2020). Application of proximal optical sensors to assess nitrogen status and yield of bell pepper grown in slab. Journal of Soil Science and Plant Nutrition, 21(1), 229–237. DOI 10.1007/s42729-020-00355-2. [Google Scholar] [CrossRef]
23. Song, S. N., Song, X. Y., Chen, L. P., Yang, G. J., Cui, B. et al. (2013). Spatial structure and relationships of nitrogen balance index and protein content of grain in winter wheat. Transactions of the Chinese Society of Agricultural Engineering, 29(15), 91–97. [Google Scholar]
24. Liu, Y. F., Kui, L. M., Gu, Q. Y., Li, H. H., Tu, J. et al. (2010). Identification of soft rice varieties from Yunnan with the assistance of RVA profiles. Hybrid Rice, 25(S1), 360–366. [Google Scholar]
25. Mei, J. F., Xu, D. L., Tang, C. Q., Lu, Y., Xu, Q. (2013). Advances on research and utilization of tea tree (Camellia sinensis) anthocyanins and its germplasm resources. Tropical Agricultural Engineering, 37(1), 42–46. [Google Scholar]
26. Liu, Z., Yao, M. Z., Wang, X. C., Chen, L. (2009). Analysis of genetic diversity and relationship of tea germplasms originated from Fujian province based on EST-SSR markers. Scientia Agricultura Sinica, 42(5), 1720–1727. [Google Scholar]
27. Jiang, Y. H., Duan, Y. S., Wang, L. Y., Zhou, J., Zeng, J. M. (2010). SSR analysis on tea germplasm in Fujian province and effect of variety selection. Journal of Zhejiang University Science & Technology, 30(3), 12–16. [Google Scholar]
28. Wu, X. M., Yao, M. Z., Ma, C. L., Wang, X. C., Chen, H. L. (2010). Genetic diversity and population structure among green tea and oolong tea cultivars based on EST-SSR markers. Journal of Tea Science, 30(3), 195–202. [Google Scholar]
29. Shen, C. W., Huang, Y. H., Huang, J. A., Luo, J. W., Liu, C. L. (2007). RAPD analysis for genetic diversity of typical tea populations in Hunan province. Journal of Agricultural Biotechnology, 15(5), 855–860. [Google Scholar]
30. Yang, L. (2007). RAPD analysis of tea cultivars in Shanxi Province and study on rare and precious sterile C. Sinensis CV. Ziyang (Ma. D. Thesis). Xi’an: North West Agriculture and Forestry University. [Google Scholar]
31. Ding, Z., Li, Y. X., Yuan, Y., Wang, H. Y., Liu, X. S. et al. (2018). Phenotypic traits and genetic diversity of elite tea population in Anhui (China). Journal of Tea Science, 38(2), 155–161. [Google Scholar]
32. Wang, Z. H., Yue, C. N., Li, C., Cai, H. L., Peng, G. H. et al. (2020). Diversity analysis and evaluation of chemical characteristics of tea germplasms in Jiangxi province. Jiangsu Journal of Agricultural Sciences, 36(1), 172–179. [Google Scholar]
33. Ji, P. Z., Wang, J. J., Liu, D. H., Song, W. X., Zhan, C. H. et al. (2013). A biochemical diversity of tea plant germplasm resources from Yunnan. China Southwest China Journal of Agricultural Sciences, 26(6), 2227–2230. [Google Scholar]
34. Li, J. X., Huang, H. L., He, Y. M., Yan, C. Y., Zhuo, M. et al. (2009). Research on the biochemical ingredient and quality character of tea varieties with high polyphenol. Guangdong Agricultural Sciences, 10, 16–18, 25. [Google Scholar]
35. Li, J. X., Zeng, F. G., Qiu, T. R., Ling, Y. X., Xie, M. T. et al. (1999). Breeding and utilization of a new variety of dayleaf tea Yinghong. Guangdong Agricultural Sciences, (1), 26–28. [Google Scholar]
36. Wang, X. P., Tang, X. B., Wang, Y. C., Li, C. H., Yao, Y. et al. (2012). Phenotypic diversity analysis of biochemical composition in 52 tea germplasms. Journal of Tea Science, 32(2), 129–134. [Google Scholar]
37. Zhang, H. D., Ye, C. X., Zhang, R. M., Ma, Y. D., Zeng, P. (1988). A discovery of new tea resource—coeoa tea tree containing theobromine from China. Acta Scientiarum Naturalium Universitatis Sunyatseni, (6), 131–133. [Google Scholar]
38. Chen, D., Li, J. X., Zhuo, M., Li, D. C., Wu, H. L. et al. (2010). Breeding of a new variety Danxia 2 with high flavor and both red and white teas are used. Guangdong Agricultural Sciences, 37(11), 46–52. [Google Scholar]
39. Yu, F. L. (1986). Discussion on the originating place and the originating center of tea plant. Journal of Tea Science , 6(1), 1–8. [Google Scholar]
40. Hu, Y. R., Jiang, T. M. (2019). Multiple angles can prove that Guizhou is the origin of tea trees. Guizhou Daily, 7(31), 9. [Google Scholar]
41. Chen, A. X. (1995). Northwest Guangxi is part of the tea tree origin center. Guangxi Agricultural Sciences, (2), 94–96. [Google Scholar]
42. Kottawa-Arachchi, J. D., Gunasekare, M. T. K., Ranatunga, M. A. B., Punyasiri, P. A. N., Jayasinghe, L. (2013). Use of biochemical compounds in tea germplasm characterization and its implications in tea breeding in Sri Lanka. Journal of the National Science Foundation of Sri Lanka, 41(4), 309–318. DOI 10.4038/jnsfsr.v41i4.6252. [Google Scholar] [CrossRef]
43. Mahanta, P. K., Hazarika, M. (1985). Chlorophylls and degradation products in orthodox and CTC black teas and their influence on shade of colour and sensory quality in relation to thearubigins. Journal of the Science of Food and Agriculture, 36(11), 1133–1139. DOI 10.1002/jsfa.2740361117. [Google Scholar] [CrossRef]
44. Cartelat, A., Cerovic, Z. G., Goulas, Y., Meyer, S., Lelarge, C. et al. (2005). Optically assessed contents of leaf polyphenolics and chlorophyll as indicators of nitrogen deficiency in wheat (Triticum Aestivum L.). Field Crops Research, 91(1), 35–49. DOI 10.1016/j.fcr.2004.05.002. [Google Scholar] [CrossRef]
45. Havsteen, B. H. (2002). The biochemistry and medical significance of the flavonoids. Pharmacology & Therapeutics, 96(2–3), 67–202. DOI 10.1016/S0163-7258(02)00298-X. [Google Scholar] [CrossRef]
46. Dreosti, I. E., Wargovich, M. J., Yang, C. S. (1997). Inhibition of carcinogenesis by tea: the evidence from experimental studies. Critical Reviews in Food Science and Nutrition, 37(8), 761–770. DOI 10.1080/10408399709527801. [Google Scholar] [CrossRef]
47. Wiseman, S. A., Balentine, D. A., Frei, B. (1997). Antioxidants in tea. Critical Reviews in Food Science and Nutrition, 37(8), 705–718. DOI 10.1080/10408399709527798. [Google Scholar] [CrossRef]
48. Rodriguez-Mateos, A., Vauzour, D., Krueger, C. G., Shanmuganayagam, D., Reed, J. et al. (2014). Bioavailability, bioactivity and impact on health of dietary flavonoids and related compounds: an update. Archives of Toxicology, 88(10), 1803–1853. DOI 10.1007/s00204-014-1330-7. [Google Scholar] [CrossRef]
49. Wang, H., Cao, G. H., Prior, R. L. (1997). Oxygen radical absorbing capacity of anthocyanins. Journal of Agricultural and Food Chemistry, 45(2), 304–309. DOI 10.1021/jf960421t. [Google Scholar] [CrossRef]
50. Kong, J. M., Chia, L. S., Goh, N. K., Chia, T. F. (2003). Analysis and biological activities of anthocyanins. Phytochemistry, 64(5), 923–933. DOI 10.1016/S0031-9422(03)00438-2. [Google Scholar] [CrossRef]
51. Wan, X. C. (2003). Tea biochemistry. Beijing: China Agriculture Press. [Google Scholar]
52. Lu, J. S., Wei, F. H., Li, C. H. (1994). A study on the relationship chemical components between main quality of tea varieties. Southwest China Journal of Agricultural Sciences, 7, 1–5. [Google Scholar]
53. Liang, Y. R., Liu, Z. S. (1994). Studies on relationship between chemical composition and Black Tea quality of various tea clones (Camellia sinensis L.). Journal of Zhejiang Agricultural University, 20(2), 149–154. [Google Scholar]
 | This work is licensed under a Creative Commons Attribution 4.0 International License, which permits unrestricted use, distribution, and reproduction in any medium, provided the original work is properly cited. |