International Journal of
Experimental Botany
| Phyton- International Journal of Experimental Botany |
DOI: 10.32604/phyton.2021.015916
ARTICLE
Quantitative Proteomics Analysis Identifies the Potential Mechanism Underlying Yellow-Green Leave Mutant in Wheat
College of Agronomy, Northwest A&F University, Yangling, 712100, China
*Corresponding Author: Yuncheng Liao. Email: yunchengliao@163.com
Received: 23 January 2021; Accepted: 19 March 2021
Abstract: Enhancing photosynthesis efficiency is considered as one of the most crucial targets during wheat breeding. However, the molecular basis underlying high photosynthesis efficiency is not well understood up to now. In this study, we investigated the protein expression profile of wheat Jimai5265yg mutant, which is a yellow-green mutant with chlorophylls b deficiency but high photosynthesis efficiency. Though TMT-labeling quantitative proteomics analysis, a total of 72 differential expressed proteins (DEPs) were obtained between the mutant and wild type (WT). GO analysis found that they significantly enriched in thylakoid membrane, pigment binding, magnesium chelatase activity and response to light intensity. KEGG analysis showed that they involved in photosynthesis-antenna protein as well as porphyrin and chlorophyll metabolism. Finally, 118 RNA editing events were found between mutant and WT genotype. The A to C editing in the 3-UTR of TraesCS6D02G401500 lead to its high expression in mutant through removing the inhibition of tae-miR9781, which might have vital role in regulating the yellow-green mutant. This study provided some useful clues about the molecular basis of Jimai5265yg mutant as well as chlorophylls metabolism in wheat.
Keywords: Wheat; photosynthesis; yellow-green mutant; quantitative proteomics
Photosynthesis is one of the most important and fundamental biological processes to maintain the life on Earth, providing the indispensable atmospheric oxygen and the initial source of all form of energy all over the world through harvesting and converting the solar energy [1,2]. It also lays the foundation for crop production that crop yield is determined by the collective rate of photosynthesis over the growing season [3]. In light of its importance, the molecular mechanism of plant photosynthesis has been well documented [4–6]. In general, plant photosynthesis system is consisted of four multi-protein complexes: photosystem (PS) II, cytochrome b6f (Cyt b6f), PSI and ATP synthases (ATPases) to perform light harvesting, electron transport and carbon fixation as well as energy conversion [7]. Among them, light harvesting is the first step of photosynthesis process as it not only absorbs the solar energy to provide the source for downstream processes but also it can respond to the light condition. It is found that illumination shortage will impact directly the light harvesting to reduce photosynthesis efficient, while excess light harvesting will produce excess proton, which are dissipated through the process of nonphotochemical quenching (NPQ) and then result in photoinhibition damage [8–10]. In particular, photosynthesis under ever-changing light condition, which is generally occurred in field, is highly inefficient and the rates of stomatal opening and activation of rubisco activity upon transition from low to high light significantly hinder carbon assimilation [11]. Thus, an optimal light harvesting system is that can capture sufficient light to drive the photosynthesis process but eliminating the cost of over-excitation at different light condition, such as fluctuated light intensity or low illumination.
Light harvesting is conducted by photosynthetic antenna complexes, which is comprised of Chlorophylls and binding proteins [12]. Chlorophylls (Chl) are one kind of pigment, which contribute to absorb photons and release electrons. In terrestrial plants, two types of chlorophylls are found, namely chlorophylls a (Chla) and chlorophylls b (Chlb), to assemble into the light-harvesting Chl a/b-binding protein complexes (LHC) to absorb light [13]. Extensive studies have demonstrated that the Chl a/b ratio was a crucial index of the light absorption efficiency for photosynthesis [14,15]. Regulation of the chlorophylls biosynthesis and the Chl a/b ratio hold the promise for constructing the optimal light harvesting system to increase photosynthesis efficiency.
Bread wheat (Triticum aestivum, AABBDD, 2n = 6x = 42) is one of the most important staple crops worldwide, occupying around 17% of the global farmland and providing about 20% of global calories consumed (FAOSTAT, 2019). Wheat also acts as one of most indispensable nutrient resource, supplying plenty of proteins, minerals and vitamins for human, which are initially originated from the photosynthesis in wheat [16]. As the critical staple crop to global food security, wheat production should be increased by 1.6% per year to meet future food demands due to global population booming by 2050 [17,18]. With the challenge of global climate change and plateaued harvest index, improving the photosynthetic efficiency to increase total biomass is urgently needed to boost wheat productivity nowadays. Thus, illuminating the chlorophylls metabolism mechanism and optimize the Chl a/b ratio in wheat are crucial.
A lot of chl-deficient mutants have developed and studied to identify loci associated with Chl content, clarify Chl metabolism mechanism as well as photosynthesis regulation in wheat [19]. Chla mutant CD3 is one of the most well studied mutant, which have been mapped to the long arms of chromosome 7 with cn-A1, cn-B1, and cn-D1 loci and they showed dose effects [20,21]. Wheat lines ANK having Chlorina-1 (cn-A1d) locus showed less NPQ capacity and sensitive to high temperatures [22,23]. Li et al. [24] reported a yellow-green leaf mutant in durum wheat, which were mapped to 5AL and 5BL chromosomes. Zhang et al. [25] identified an incompletely dominant gene controlling yellow leaf formation, which located on wheat 2BS chromosome. However, the mechanism underlying yellow-green mutant is not well determined. Jimai5265yg mutant is a newly identified high photosynthetic efficiency Chlb mutant, derived from an immature embryo callus culture of the wheat variety Jimai5265. Under normal light condition, it exhibited a yellow-green phenotype throughout the life span but with higher Chl a/b ratio due to Chlb metabolism deficiency, which provides the ideal system to study the mechanism of Chlb metabolism [26].
Here, we performed the comparative quantitative proteomics to compare the protein expression profiles between Jimai5265yg mutant and its counterpart WT. A total of 72 DEPs were obtained, which were supported by mRNA expression level from RNA-seq data. Then, GO (Gene Ontology) and KEGG (Kyoto Encyclopedia of Genes and Genomes) enrichment of them were conducted to understand their roles. Finally, RNA editing events between them were identified and results suggested that RNA editing might mediate miRNA to regulate Chlb metabolism process in the mutant. This study provided some useful clues about the molecular basis of Jimai5265yg mutant, and also pave the way to study the mechanism of chlorophylls metabolism and photosynthesis efficiency at the post-transcription level in wheat.
The seeds of wheat cultivar Jimai5265 (WT) and the yellow-green mutant Jimai5265yg (mutant) were sown and germinated in glass plates containing expanded perlite in normal condition with relative humidity of 60% and natural light in Northwest A&F University, Yangling, China. The leaves from 5 one-week-old seedlings were collected and mixed as one sample to perform downstream quantitative proteomics analysis. Three biological replications were performed.
2.2 Protein Extract, Digestion and TMT Labeling
The protocol was followed the method as described by Jian et al. [27] with some modifications. Firstly, the collected leave sample was ground into cell powder with enough liquid nitrogen and then the powder was transferred to a 5-mL centrifuge tube. Then, about 3 microliter (ml) lysis buffer (8 M urea, 1% Triton-100, 10 mM dithiothreitol, and 1% protease inhibitor cocktail) was added to the tube, and the mixture was sonicated three times on ice through a high intensity ultrasonic processor (Scientz98-III, Ningbo, China). After centrifugation with 20,000 g at 4°C for 10 min, the supernatant was collected to clean tube and the protein was precipitated with 5 × volumes of ice-cold 20% Trichloroacetic acid (TCA) for 2 h at −20. Following centrifugation at 12,000 g, 4°C for 10 min, the protein pellet was washed with ice-cold acetone for three times, and then the protein pellet was dissolved in 8 M urea and the protein concentration was determined with BCA kit according to the manufacturer’s instructions. For digestion, 5 mM dithiothreitol was added to the protein sample to reduced it for 30 min at 56°C and then 11 mM iodoacetamide was added to alkylate the protein for 15 min at room temperature in darkness. Furthermore, 100 mM Triethylamonium bicarbonat (TEAB) was added to dilute the urea concentration in the protein sample to less than 2 M. And then, trypsin was added to the sample at 1:50 trypsin-to-protein mass ratio for the first digestion overnight and 1:100 trypsin-to-protein mass ratio for the second 4 h digestion. Finally, the obtained peptide was desalted by Strata X C18 SPE column (Phenomenex, USA) and vacuum-dried, following by was redissolved in 0.5 M TEAB and then processed by TMT labeling according to the manufacturer’s protocol using the TMP kit (ThermoFisher Scientific, Waltham, MA, USA).
2.3 Mass Spectrometry Analsyis and Protein Identification
The LC-MS/MS analysis was performed following the previously described protocol by Jian et al. [27]. Briefly, the labeled peptide samples were dissolved in 0.1% formic acid (solvent A), and then was mixed by the solvent B (0.1% formic acid in 98% acetonitrile) with the increase gradient from 6% to 23% for about 26 min, followed by from 23% to 35% for 8 min and 80% for 3 min, and then holded at 80 % for 3 min on an EASY-nLC 1000 UPLC system with the flow rate of 400 nL/min. Then, the peptides were subjected to NSI source followed by tandem mass spectrometry (MS/MS) in Q ExactiveTM Plus (ThermoFisher Scientific, Waltham, MA, USA) coupled with the UPLC system. The detailed parameters were set as follow: electrospray voltage 2.0 kV, m/z scan ranging from 350 to 1800 for full scan, and intact peptide detected in the Orbitrap at a resolution of 70,000; NCE setting as 28 and the selected peptide fragments detected in the Orbitrap at a resolution of 17,500; a data-dependent procedure that alternated between one MS scan followed by 20 MS/MS scans with 15.0 s dynamic exclusion and automatic gain control (AGC) 5E4 as well as fixed first mass 100 m/z. The obtaining MS/MS data were searched against the UniProt Triticum estivum dataset (136,892 series) through the MaxQuant software v1.5.2.8. with the parameters set as follow: trypsin/P was specified as cleavage enzyme allowing up to 4 missing cleavages; The mass tolerance for precursor ions was 20 ppm in First search and 5 ppm in Main search, respectively, with the mass tolerance for fragment ions was 0.02 Da; Carbamidomethyl on Cys was specified as fixed modification and acetylation modification and oxidation on Met were specified as variable modifications; FDR was adjusted to <1% and minimum score for modified peptides was set >40. The Quantitative proteomics analysis was conducted by PTM-Biolabs Cd., Ltd., Hangzhou, China. The MS proteomics data have been deposited to the ProteomeXchange Consortium (http://proteomecentral.proteomexchange.org) via the PRIDE partner repository with the data set identifier PXD002799.
Differential expressed proteins were identified using DESeq2 R package with the cut-offs parameter of padj <0.05 and | fold change | >1.3 [28]. Subcellular localization was predicted by CELLO tool. GO annotation was conducted using the AgriGO v2 [29]. GO terms with FDR (false discovery rate) less than 0.05 were taken as significantly ones. KEGG enrichment was performed using KOBAS v3.0 software [30]. The p-value less than 0.05 was considered to be the significant pathways. GO and KEGG enrichment result was plotted using TBtools software [31].
2.4 Gene Expression and RNA Editing Sites Identification
RNA-seq reads of 6 libraries with the same samples used for proteomics analysis were downloaded from the GSA database with the accession no. of PRJCA000439 [26]. After quality control by Trimmics tool, all of these RNA-seq reads were mapped to the wheat reference genome IWGSC_v1.1 (ftp://ftp.ensemblgenomes.org/pub/plants/release-50/fasta/triticum_aestivum) by STAR v2.7.6a [32] and the transcripts per million (TPM) were calculated by StringTie v2.1.2 [33]. The mRNA expresison level of the DEPs were extracted and displayed by the R package pheatmap. For RNA editing identification, these 6 RNA-seq dataset were also mapped to the wheat reference genome IWGSC_v1.1 using the BWA-MEM tool and then UnifiedGenotyper tool in GATK (Genome Analysis Toolkit) software was used to call SNPs [34] with the parameter as follow: --genotype_likelihoods_model ‘SNP’, --stand_call_conf ‘30’, --stand_emit_conf ‘30’. Then, using the WT samples as background, the SNPs at the same position in mutant sample which were different from the background were considered as the potential RNA editing sites. The editing sites were found in all of the three biological replications were remained as the high confidence sites and were annotated with SnpEff tool v3.6 with the annotation file wheat genome (ftp://ftp.ensemblgenomes.org/pub/plants/release-50/gff3/triticum_aestivum). All wheat miRNA mature sequences were downloaded from the miRbase database (http://www.mirbase.org/) and the miRNA-target relationship was predicted using the psRNAtarget online sever (http://plantgrn.noble.org/psRNATarget/).
3.1 Quantitative Proteomics Analysis
Using the methods as described above, a total of 377,451 mass spectrums were obtained for these 6 samples. Through MaxQuant searching, 41,861 spectrums were matched with the known spectrums, corresponding to 38,834 peptides, of which 14,541 were unique. The size of peptide ranged from 7 to 39 amino acid (AA) residues, most of which distributed between 7 and 16 AA, suggesting sample preparation process meet the requirement and the obtained result was reliable [27]. After quality control, a total of 5,026 proteins were identified and 3,287 could be quantified in WT and mutant samples, comprising of the protein atlas of Jimai5265yg. The molecular weight (MW) of these quantified 3,287 proteins ranged from 4.50 to 362.88 kDa, and covered by 1 to 29 unique peptides. Among them, most of chloroplast genes associated with photosynthesis were found, such as photosystem I related genes psaC, psaB, psaA, photosystem II related genes psbL, psbH, psbD, Cytochrome b6/f genes petC, petB, petA, NADH oxidoreductase ndhK, ndhI, ndhH, ndhF, ATP synthase genes atpI, aptE and Rubisco gene rbcL, which provided the basis for analyzing the DEPs between WT and mutant. Furthermore, some transcript factors were also identified, including the bZip transcription factor ABI5, bHLH140, GATA27 and MADS29, which mainly involved in tissue development and morphogenesis as well as energy metabolism [35,36].
3.2 Identification of the DEPs between Mutant and WT
To understand the protein dynamic differentiation between Jimai5265yg and WT, we compared the protein expression level between them. On the whole, Jimai5265yg displayed similar protein profile with that of wild type. Using the threshold value of expression fold change more than 1.3 times and P value less than 0.05, a total of 72 DEPs were identified between them, of which 19 were up-regulated and 53 were down-regulated, respectively (Fig. 1). We found that 16 out of the 53 down-regulated proteins were annotated as chlorophyll a/b binding proteins, suggesting that chlorophyll binding ability might be inhibited in Jimai5265yg compared to Jimai5265. Previous study has reported that chlorophyll metabolism deficiency resulted in the yellow-green phenotype of Jimai5265yg [26]. The quantitative proteomic result in this study further demonstrated the finding, indicating that chlorophyll a/b binding deficiency contributed to the yellow-green phenotype. Furthermore, a Mg-protoporphyrin IX chelatase gene (TraesCS7D02G467500) was also found be down-regulated with only about 50% expression in Jimai5265yg compared to the wild type, which was also consistent with the previous result that Mg-Proto IX was reduced in the Jimai5265yg mutant [26]. It is well known to us that Mg-Proto IX is the precursor of chlorophyll, playing the crucial role in chlorophyll biosynthesis [37]. The lower expression of Mg-protoporphyrin IX chelatase gene could reduce the chlorophyll content. Among up-regulated proteins, several genes involving in signaling transduction were found, such as ankyrin-kinase (TraesCS2B02G180500) and PAP-specific phosphatase (TraesCS6B02G260100 and TraesCS6A02G233100), suggesting the signaling network was activated to correspond to leave yellowing in mutant (Tab. S1).
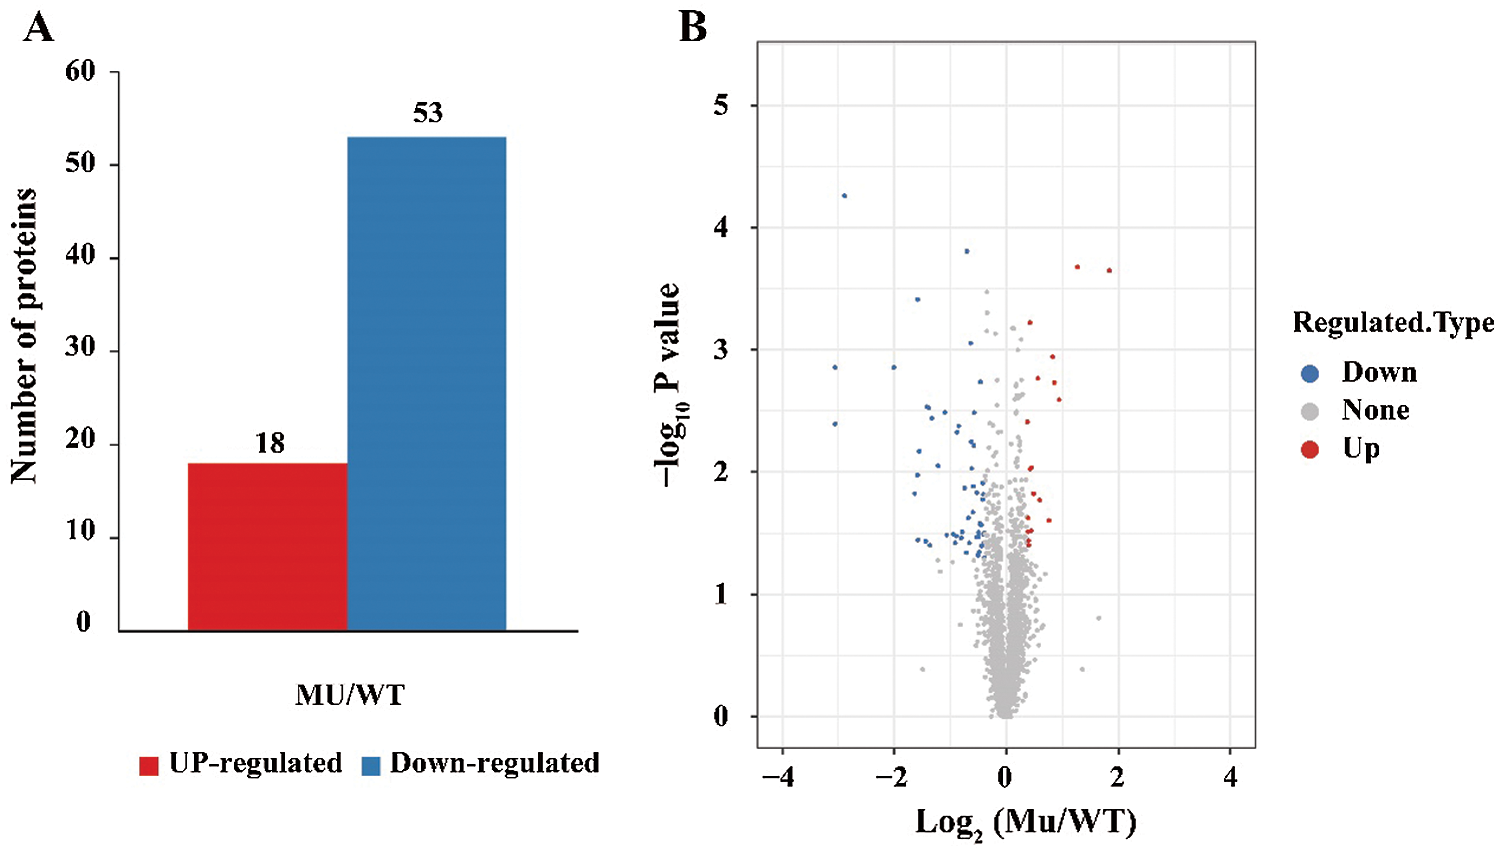
Figure 1: Identification of the differential expressed proteins (DEPs) between the Jimai5265yg mutant (Mu) and WT. (A): The number of up-regulated and down-regulated proteins were identified between the Mu and WT; (B) The volcano map of the expressed proteins. The map was drawn based on the Ms ratio of Mu vs. WT and p value
To validate the protein expression level, we further investigated the mRNA expression levels of the differential expressed proteins through RNA-seq mapping approach. Results showed that the mRNA expression level of these 72 DEPs showed the similar patterns with protein expression level although the change range displayed some difference, for example the chlorophyll a/b binding protein TraesCS1D02G306200 had Mu/WT ratio of 0.337 at protein level, and have Mu/WT ratio of 0.1 at mRNA level (Fig. 2).
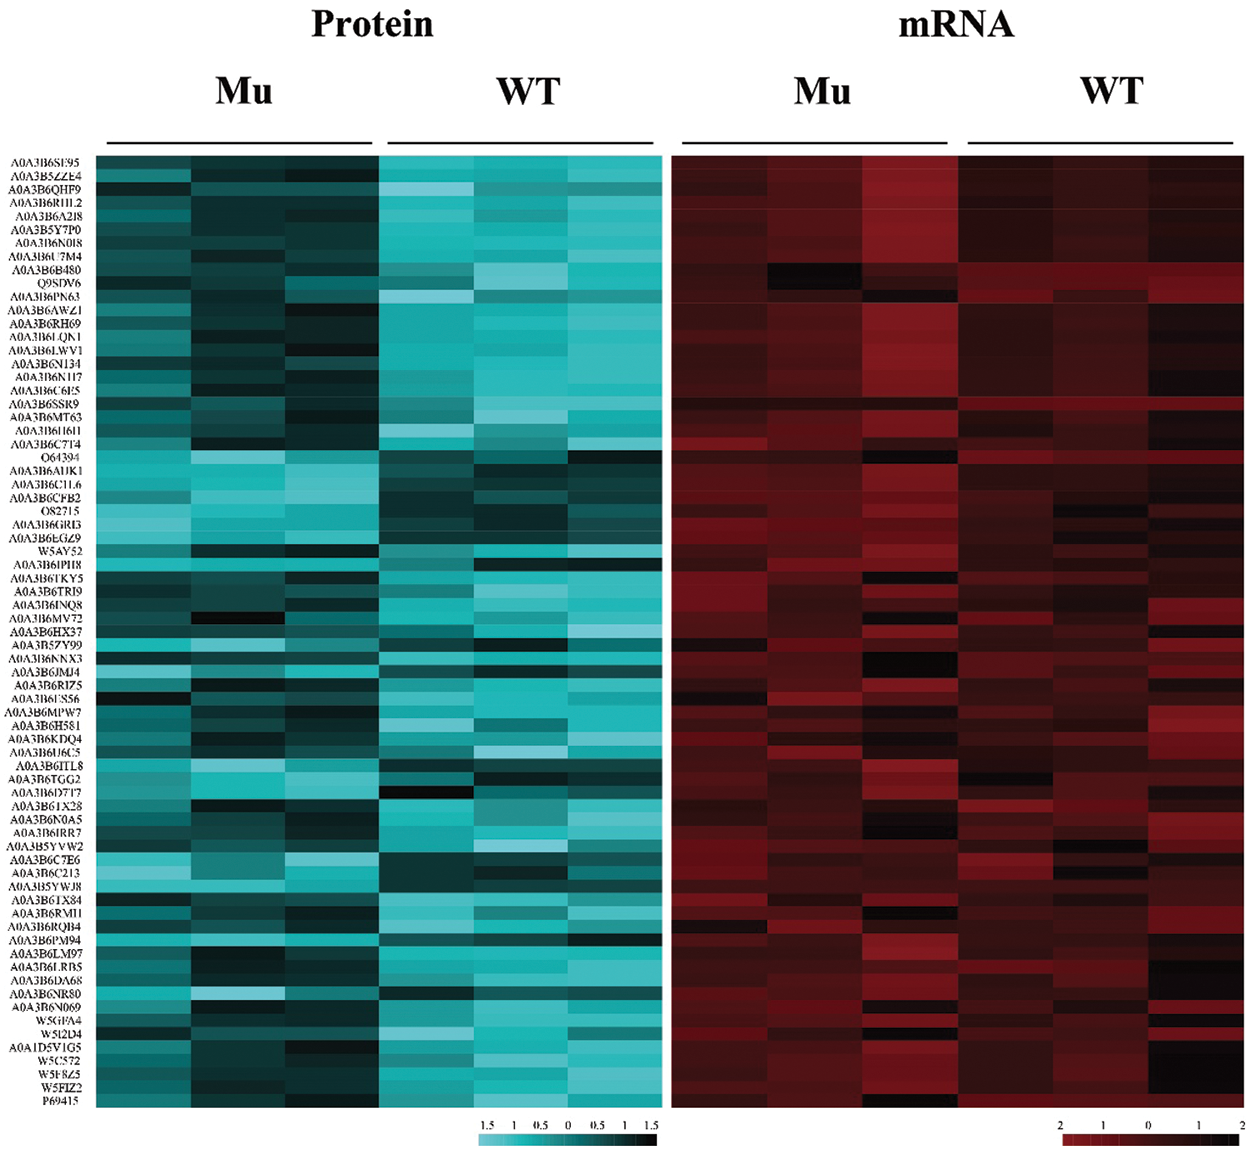
Figure 2: Heatmeap of the DEPs and their mRNA expression level based on RNA-seq
Finally, we predicted the subcellular localization prediction of these DEPs. Result found that 50 DEPs were localized in chloroplast, of which 41 were down-regulated and 9 were up-regulated, followed by 8 in cytoplasm with 5 down-regulated and 3 up-regulated, and 5 in nucleus with 2 down-regulated and 3 up-regulated (Fig. 3, Fig. S1). These results indicated that chloroplast metabolism played the important role in controlling the phenotype of Jimai5265yg mutant. At the same time, some nucleus localized proteins also functioned in this process. Further functional study of these proteins could provide the useful clues to better understand the mechanism underlying yellow-green mutant and photosynthesis efficiency.
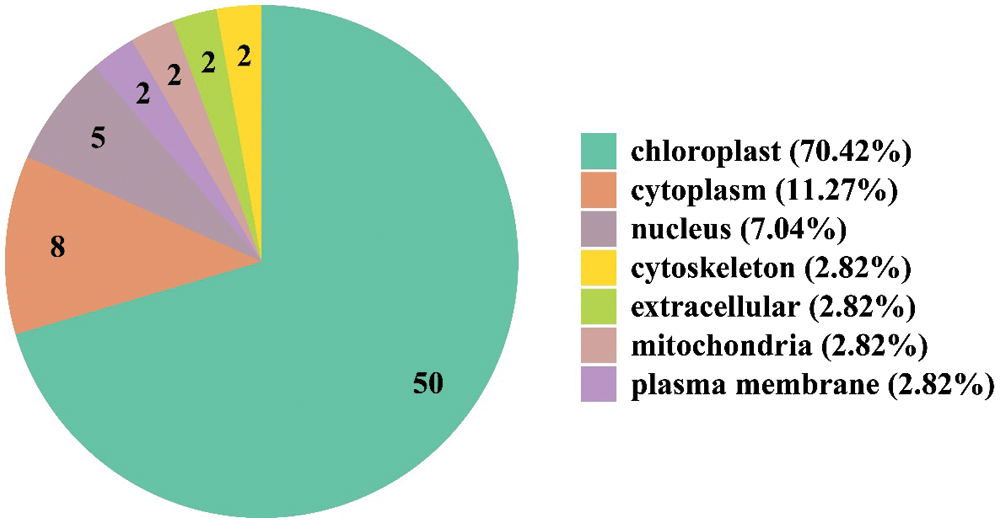
Figure 3: Subcellular localization of the differential expressed proteins between Jimai5265yg mutant and WT
3.3 Function Enrichment Analysis of the DEPs
To get more information about the biological effects of these DEPs, GO annotation analysis of the DEPs were further performed and GO terms enriched by down-regulated and up-regulated DEPs were compared. Totally, these DEPs were annotated into 45 GO terms, with 27 for down-regulated and 18 for up-regulated DEPs, respectively (Fig. S2). In detail, for biological process, the up-regulated DEPs were mainly related to cellular process, response to stimulus and metabolic process, while the down-regulated DEPs mainly enriched into immune system process and detoxification. For cellular component, the up-regulated DEPs involved in cell, organelle, membrane and macromolecular complex, while the down-regulated DEPs mainly involved in membrane-enclosed lumen and symplast, suggesting that down-regulated DEPs participated in chlorophyll biosynthesis. For molecular function, the up-regulated DEPs were related to catalytic activity and transporter activity, while the down-regulated DEPs were related to binding and antioxidant activity, indicating the differential function of the up- and down- regulated DEPs. Then, we further conducted GO enrichment of these DEPs using all of wheat proteins as background. Results showed that these DEPs were significantly enriched in thylakoid membrane, photosynthetic membrane, pigment binding, magnesium chelatase activity, response to different light, response to high light intensity and so on (Fig. 4). Thylakoid membrane has been demonstrated to play the vital role in response to the light variation in plants, which can adjust the photosynthetic light reaction on it to maintain the balance between light harvesting, electron transport and carbon fixation when subjected to ever-changing light condition [38]. Jimai5265yg is a light-intensity-dependent yellow-green wheat mutant, which shows the normal green leave under low light intensity treatment while changes into yellow leave under high light intensity treatment. The GO enrichment result was consistent with the phenotypic and physiological performance of Jimai5265yg and the DEPs enriching in thylakoid membrane might be candidates responsible for regulating the mutant phenotype.
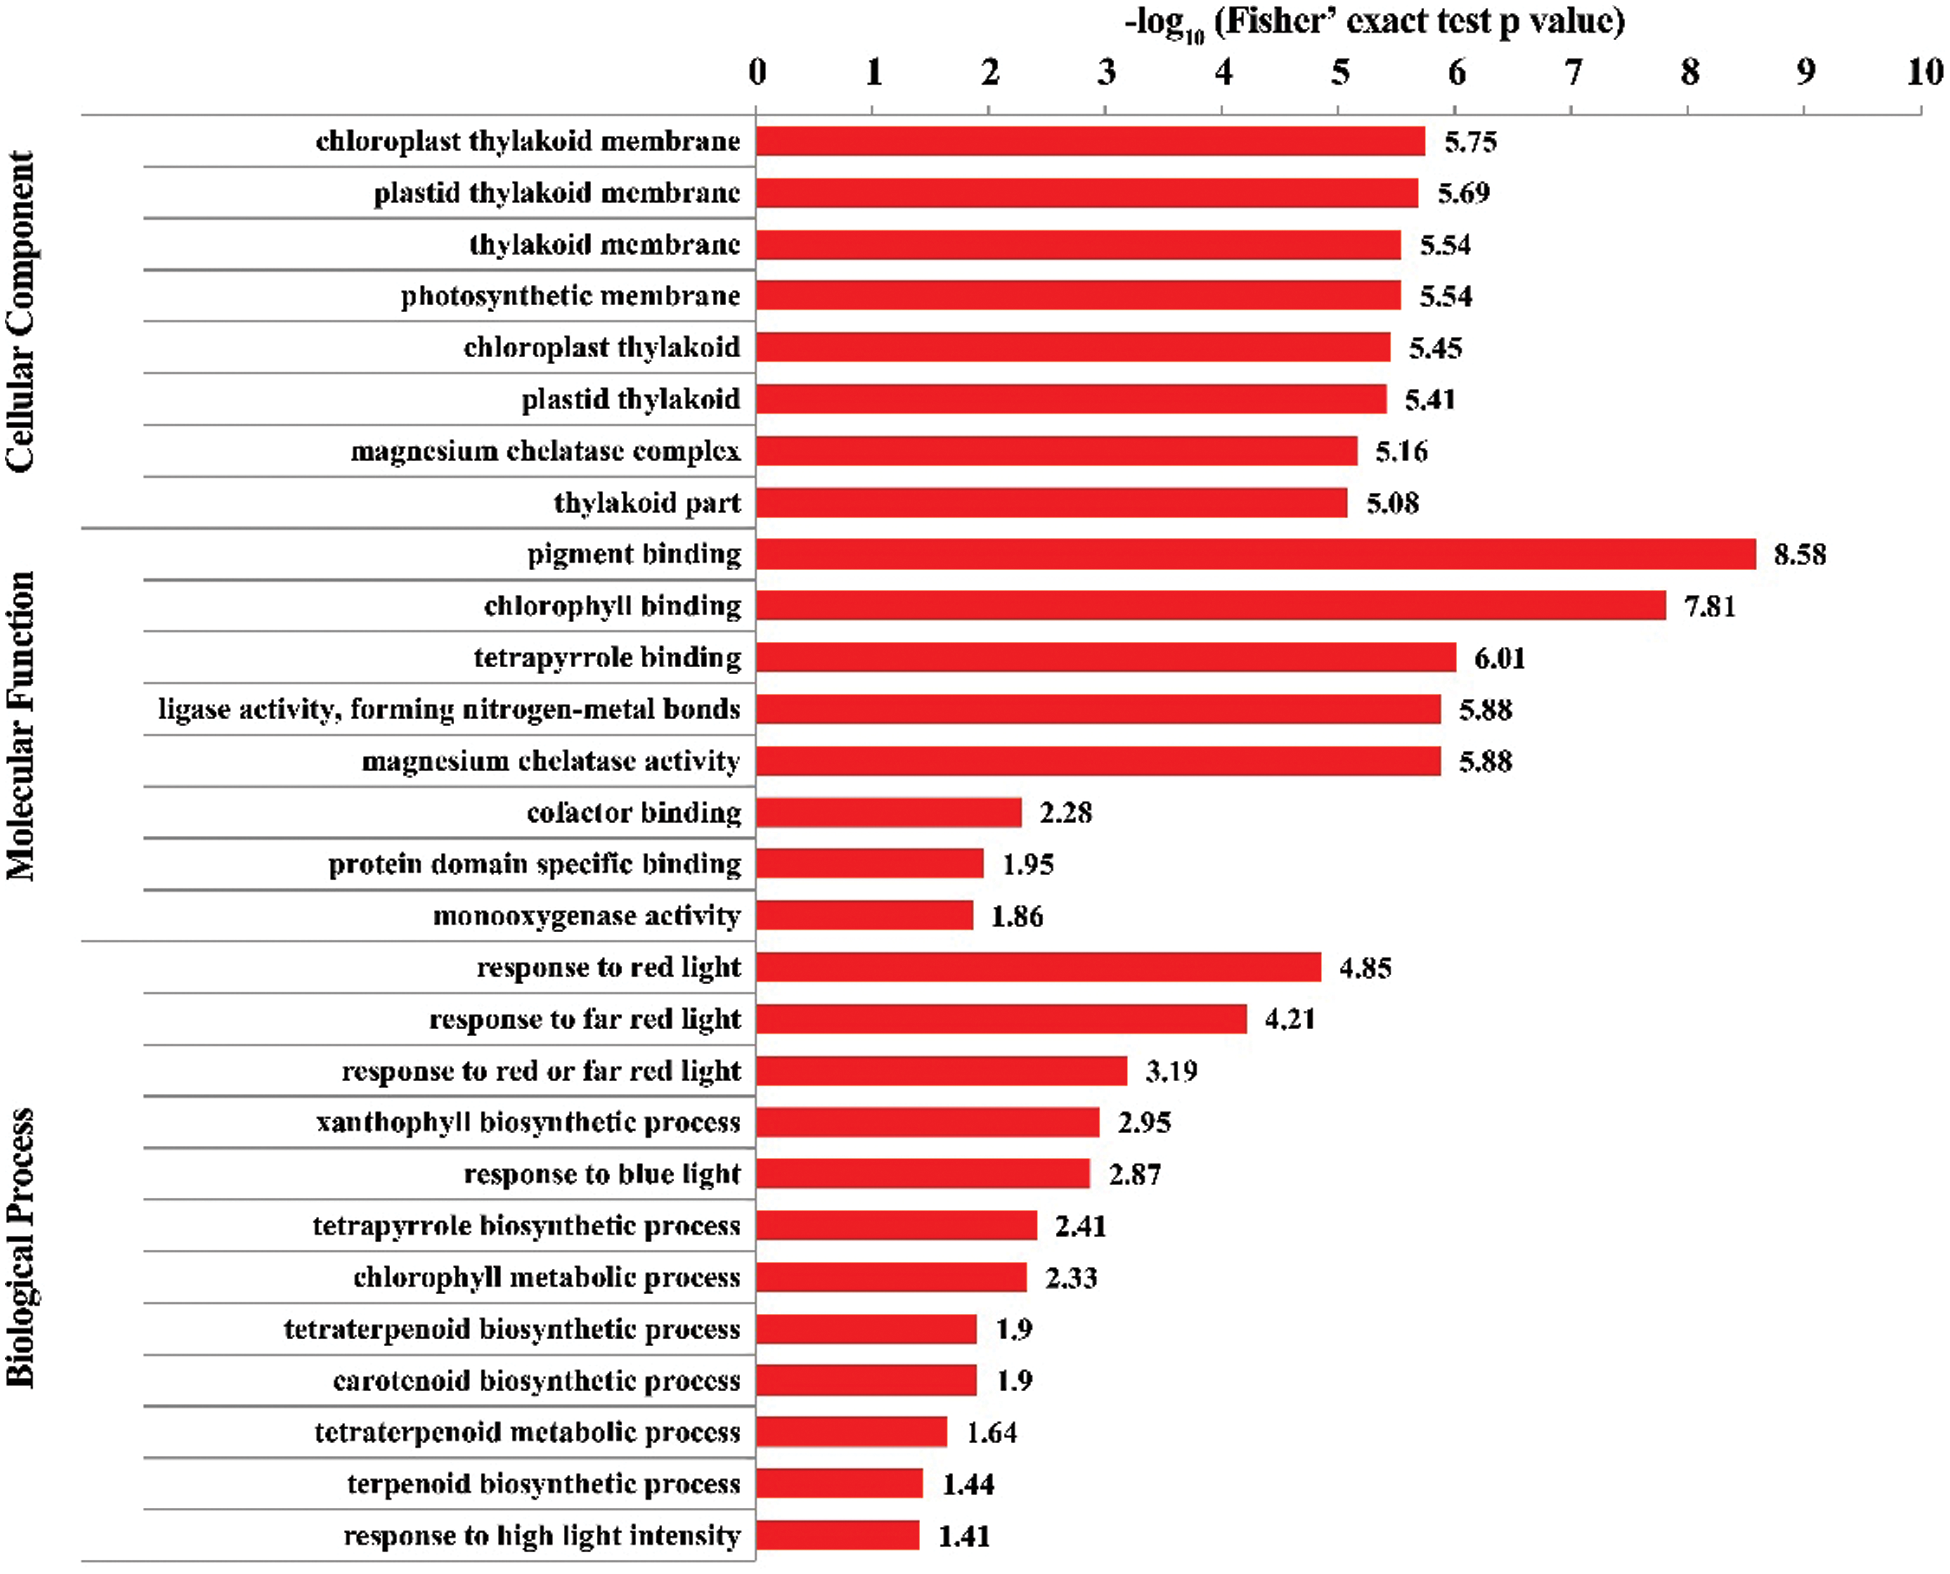
Figure 4: GO enrichment analysis of the DEPs between Jimai5265yg mutant and WT. GO terms with corrected FDR less than 0.05 were taken as significantly ones
Furthermore, we also investigated the KEGG enrichment of these DEPs. Results showed that they were significantly enriched in photosynthesis, photosynthesis-antenna protein as well as porphyrin and chlorophyll metabolism (Fig. 5), which also supported the phenotypic and physiological performance of Jimai5265yg that its chlorophyll metabolism was inhibited and porphyrin content was reduced under normal light intensity condition (Fig. S3). And the differential proteins were mainly involved in light harvesting chlorophyll protein complex.
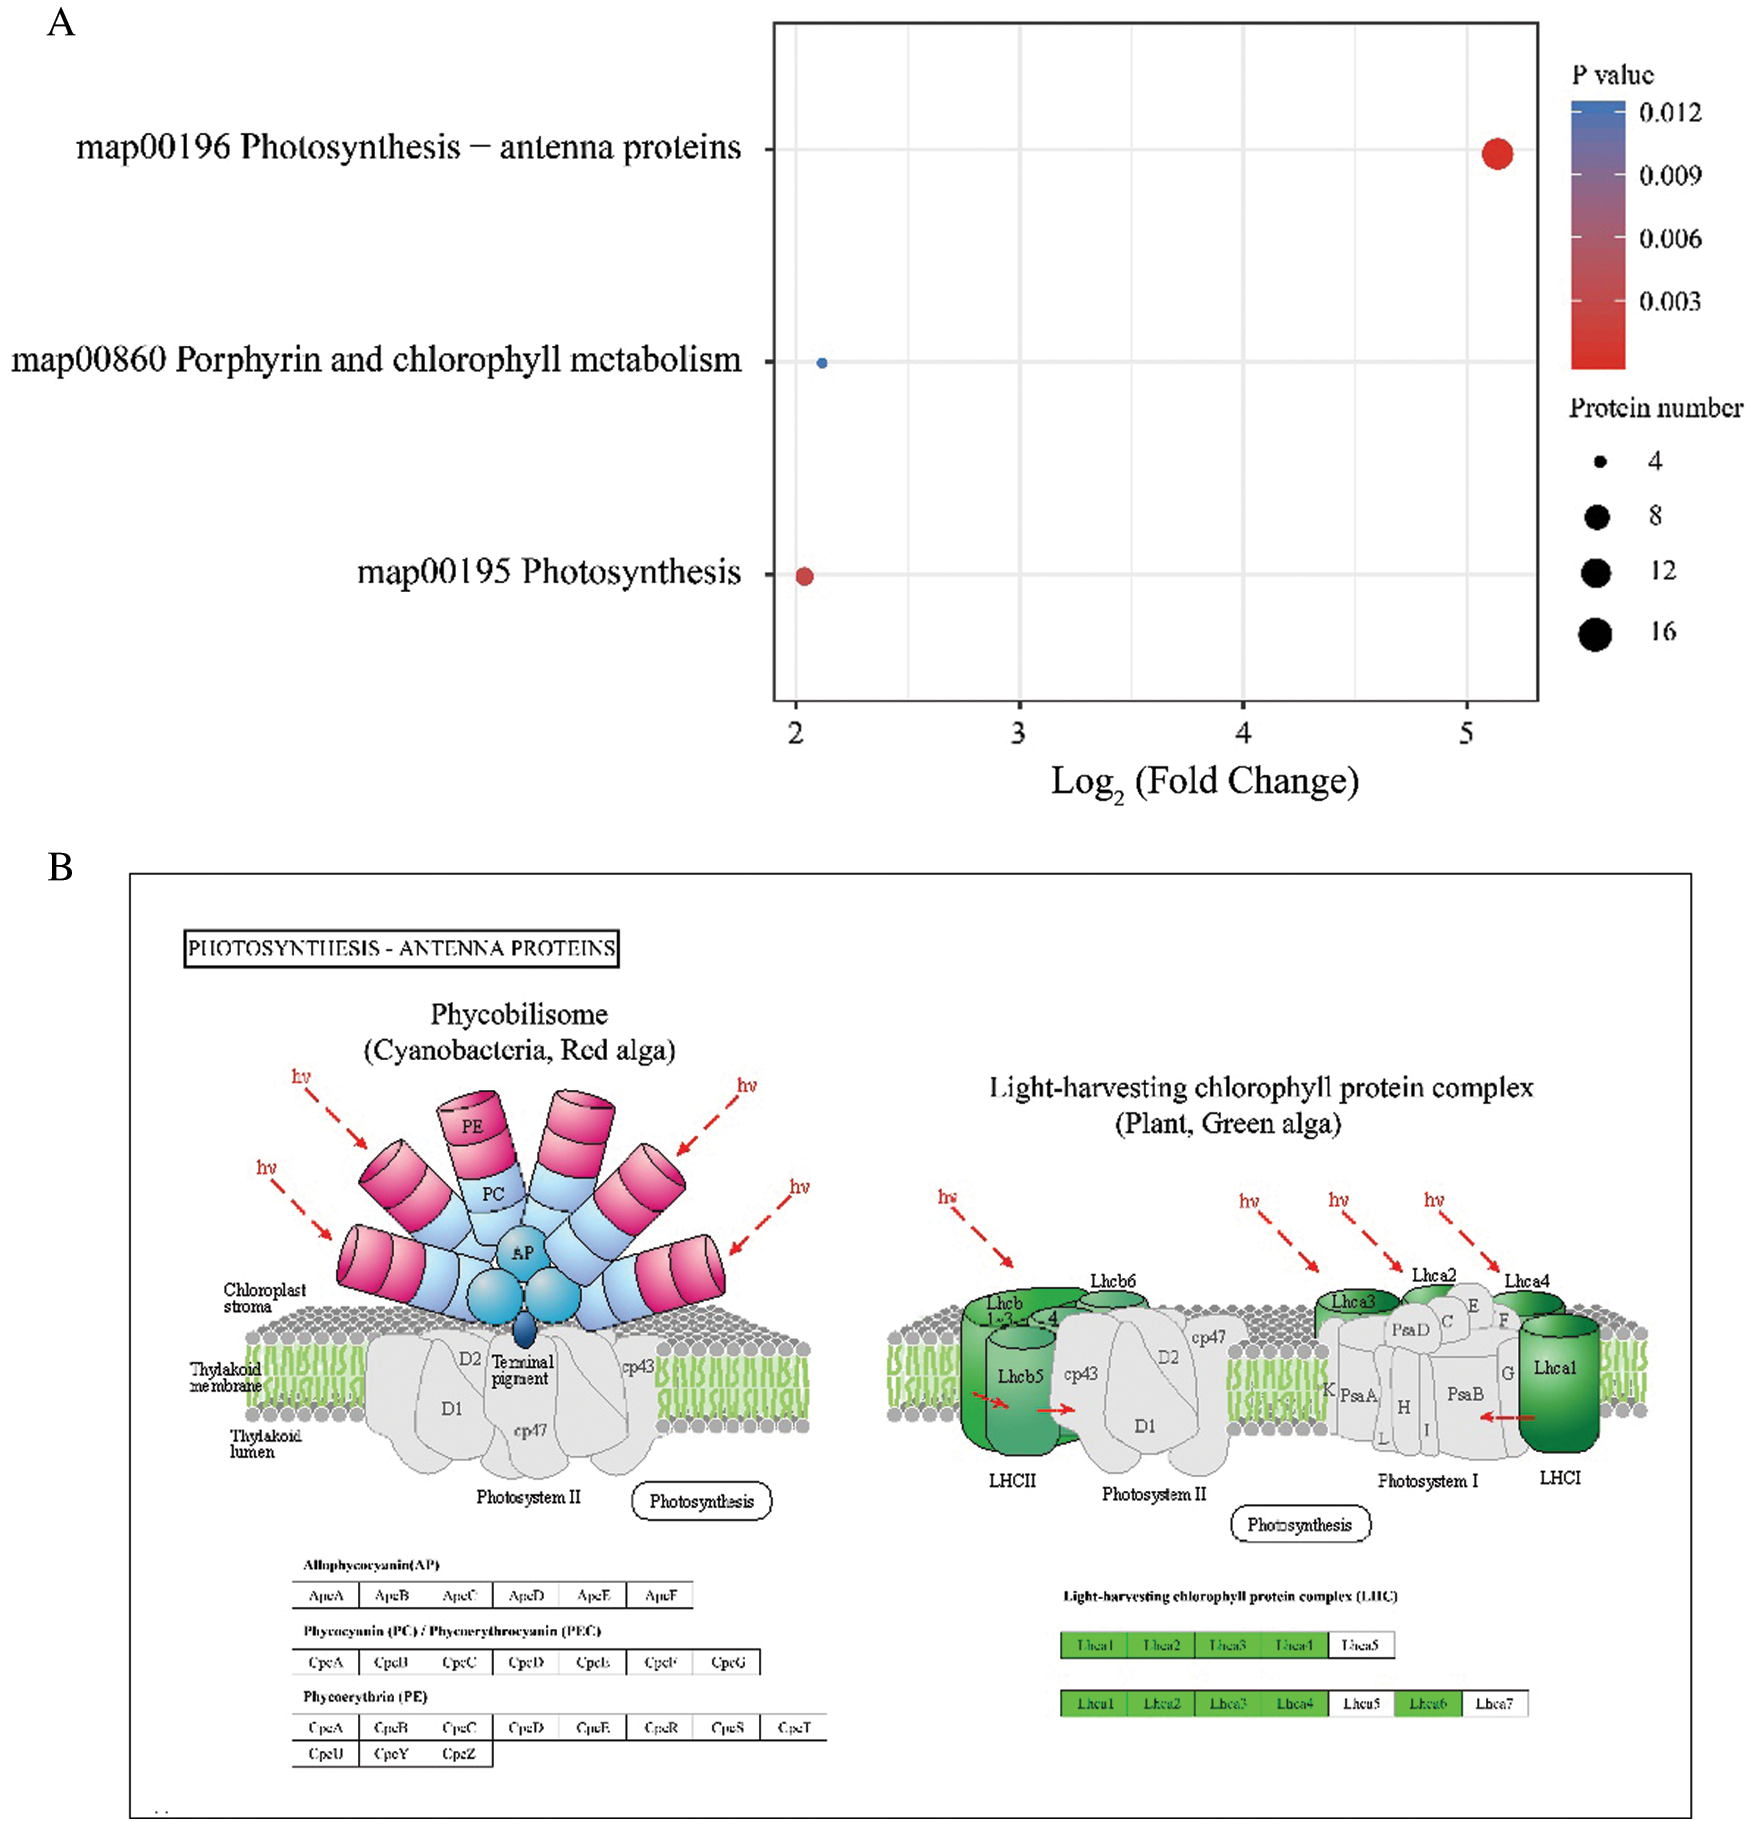
Figure 5: KEGG enrichment of these DEPs between Mu and WT. (A): The pathways enriched by these DEPs; (B): The pathway map of the significantly enriched photosynthesis-antenna proteins complex. The enriched proteins were highlighted
3.4 RNA Editing Analysis between Jimai5265yg Mutant and WT
RNA editing is one of most important post-transcription mechanisms to regulate gene expression and enrich genetic information, which also provides the necessary insight into correlation between mRNA and protein [39]. To better understand the molecular mechanism underlying Jimai5265yg mutant, the RNA editing sites were identified using the RNA-seq data of them based on the method described in the Material and Methods section (Tab. S2). Totally, 118 yellow-green mutant responsive RNA editing sites in 62 genes were identified. TraesCS2A02G464100 had the most abundant editing sties with the number of 10, followed by TraesCS1A02G125300 with 9 editing sites, TraesCS6A02G058400 with 8 sites, TraesCS6A02G411100 with 5 sites and TraesCS3B02G568100 with 4 sites. The remaining 57 genes contained 1 to 3 editing sites. A total of 86 editing sites were occurred on CDS regions, including 36 nonsynonymous variants and 50 synonymous variations, followed by 17 editing sites on 3’-untranslated region (UTR) region and 11 on intron as well as 2 in 5’-UTR, 1 caused start-lost and 1 caused stop-gain events, respectively. NR (Non-Redundant Protein Sequence Database) annotation found that these edited genes functioned as transcription factor bHLH (TraesCS2A02G504100) and GTE4(TraesCS2A02G466700), Cytochrome P450 (TraesCS6A02G058400), RNA binding (TraesCS2A02G464300) and ATP synthase subunit-like protein (TraesCS7B02G220400), as well as Argonaute (TraesCSU02G081900), indicating RNA editing might play the role in regulating signaling network of photosynthesis and energy metabolism processes of Jimai5265yg. About the edit type, a total of 12 types of base change were found, of which C to T and G to A conversion ranked the most abundant type with the number of 24 sites, followed by 20 T to C and 11 A to G sites, 8 C to G sites, 6 G to T sites, 5 G to C and C to A sites and all of T to G, T to A and A to C with 4 sites as well as A to T with 3 sites, respectively. It showed that the number of transition (79) was significantly higher than that of transversion (39) in these RNA editing sites, which was consistent with previous study [40]. Integrated with RNA editing sites and DEPs, we found that TraesCS6D02G401500, was annotated as a peptidase_M3 domain-containing protein, which had two editing sites in 3-UTR region and also displayed differential expression between mutant and WT, suggesting that the RNA editing might impact on its protein expression.
It is well-known to us that Argonaute (AGO) proteins is the central component of the small RNA regulatory machinery, widely involving in regulating the miRNA biogenesis, process and mature to affect RNA stability and protein synthesis at the post-transcription level [41]. Interesting, we found that there were two RNA editing sites occurring on wheat AGO gene (TraesCSU02G081900) in this study, indicating that small RNA mediated process might have a role in the production of Jimai5265yg mutant. To test our presumption, we further download all available wheat miRNA mature sequences from miRNA database and then used all of the identified proteins together with the edited genes as targets to predict the miRNA-target interaction. A total of 92 pairs of miRNA-target were obtained. Comparison of the unedited and edited gene dataset, we found that in wild type, tae-miR9781 could target on the 3-UTR of TraesCS6D02G401500 to inhibit its expression, but when A to C editing was occurred in the 3-UTR of this gene in mutant, tae-miR9781 can’t targeted on it due to sequence variation (Fig. 6). The mRNA expression level of this gene in mutant was significantly higher than that of WT with the p value of 0.01513, and the protein expression level is also significantly up regulated. Based on these results, we postulated that RNA editing in 3-UTR of TraesCS6D02G401500 resulted that it cannot be targeted by tae-miR9781 to remove the expression inhibition and show higher expression in mutant. Our results indicated that RNA editing participated in regulating the yellow-green Jimai5265yg through miRNA-mediated approach, which shed light on the underlying mechanism of yellow-green mutant as well as photosynthesis at the post-transcription level. Further functional study of these genes will provide the vital clues for chlorophyll biosynthesis and photosynthesis efficiency, and also contribute to wheat genetic improvement for high photosynthesis efficiency.
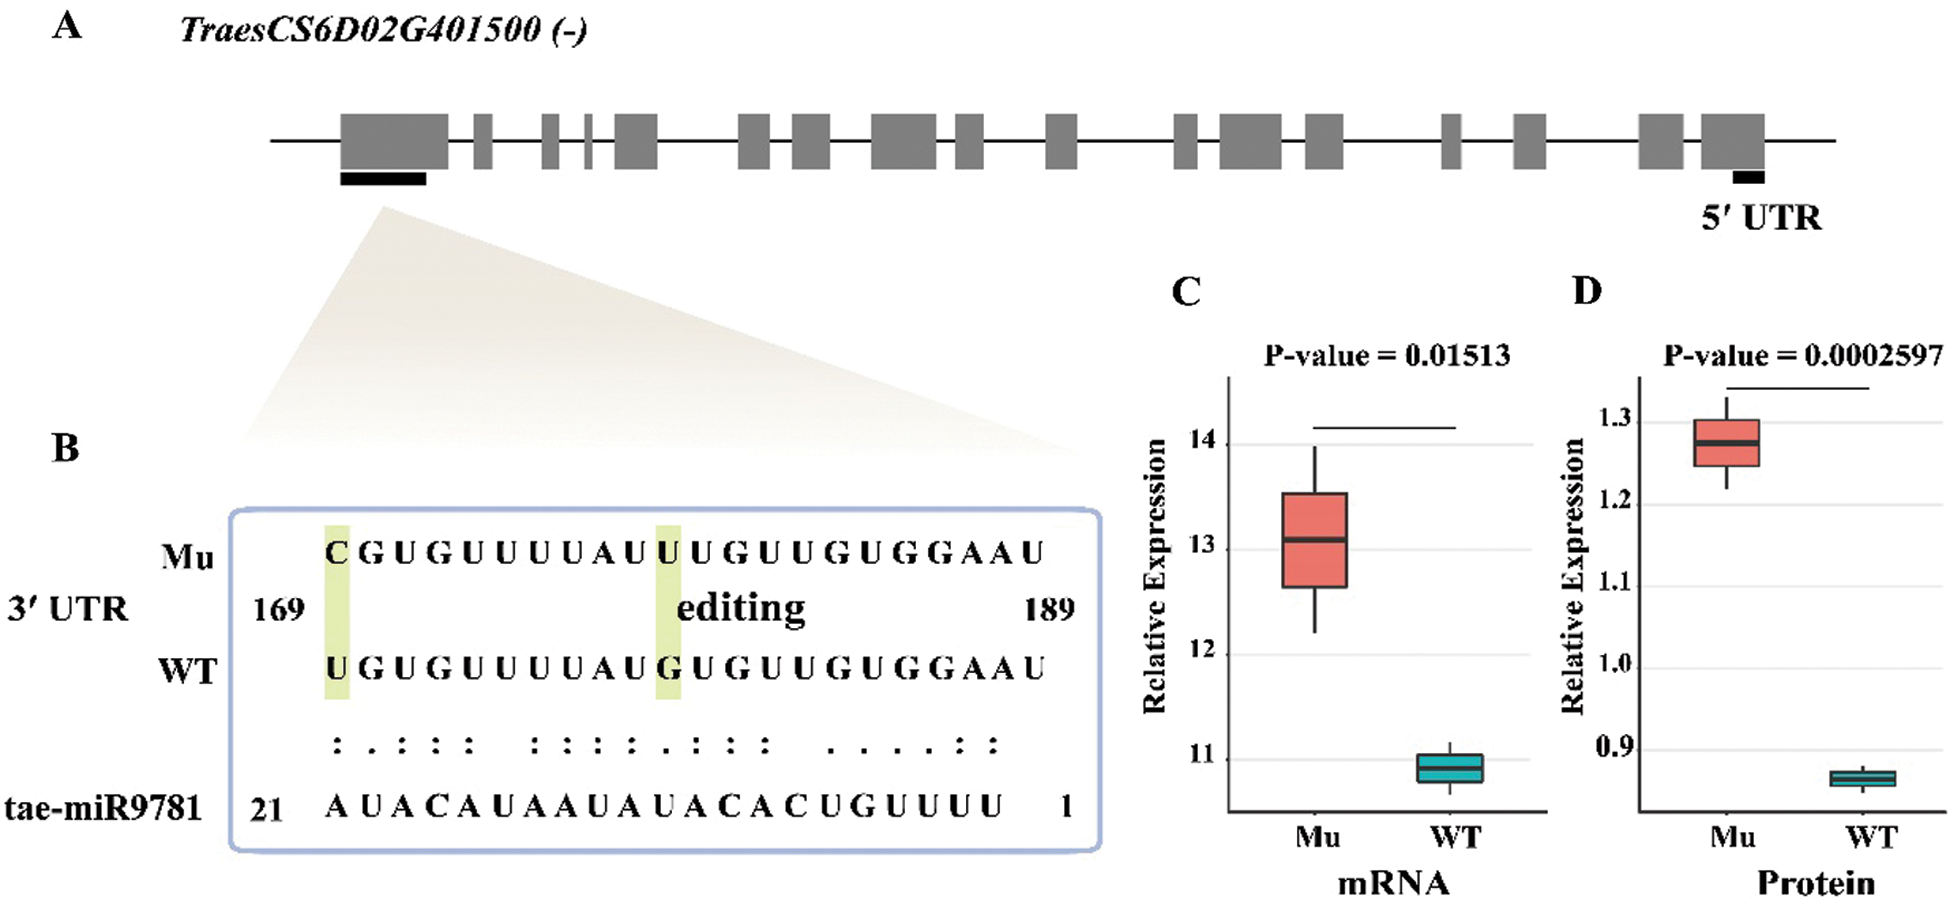
Figure 6: RNA editing in 3-UTR region of TraesCS6D02G401500 resulting that it could not be targeted by tae-miR9781 and displaying significant high expression at mRNA and protein level in mutant. (A): The gene structure of TraesCS6D02G401500. The bold line indicated the RNA editing site located in the gene; (B): The target binding of tae-miR9782 on the 3-UTR region of TraesCS6D02G401500; (C): The mRNA expression level of TraesCS6D02G401500 between Mu and WT; (D): The protein expression level of TraesCS6D02G401500 between Mu and WT
In this study, we compared the protein expression profile of a wheat yellow-green mutant Jimai5265yg and its WT. A total of 72 DEPs were obtained, and their mRNA expression level also showed similar expression pattern. GO and KEGG enrichment analysis found that the DEPs mainly enriched in photosynthesis-antenna protein, chlorophyll metabolism as well as pigment binding, which was consistent with the phenotypic and physiological performance of mutant. Finally, 118 RNA editing events were found among them and A to C editing in the 3-UTR of TraesCS6D02G401500 lead to its high expression in mutant through removing the inhibition of tae-miR9781, which might involve in regulating the production of yellow-green mutant. This study provided some useful information on the underlying mechanism of yellow-green mutant as well as photosynthesis efficiency, which will contribute to genetic improvement of photosynthesis in wheat and beyond.
Availability of Data and Materials: The datasets supporting the conclusions of this article are included within the article and its additional files.
Author Contributions: CLY designed and supervised the project. WZ performed the analysis and also drafted the manuscript. ZS and ML contributed to plant material preparation and collection.
Funding Statement: This work was mainly supported by the National Key Research and Development Plan [2017YFD0100706], National Natural Science Foundation of China [31871618].
Conflicts of Interest: The authors declare that they have no conflicts of interest regarding this study.
1. Johnson, M. P. (2016). Photosynthesis. Essays in Biochemistry, 60(3), 255–273. DOI 10.1042/EBC20160016. [Google Scholar] [CrossRef]
2. Ort, D. R., Merchant, S. S., Alric, J., Blankenship, R. E., Bock, R. et al. (2015). Redesigning photosynthesis to sustainably meet global food and bioenergy demand. Proceedings of the National Academy of Sciences of the United States of America, 112(28), 8529–8536. DOI 10.1073/pnas.1424031112. [Google Scholar] [CrossRef]
3. Furbank, R. T., Sharwood, R., Estavillo, G. M., Silva-Perez, V., Condon, A. G. (2020). Photons to food: Genetic improvement of cereal crop photosynthesis. Journal of Experimental Botany, 71(7), 2226–2238. DOI 10.1093/jxb/eraa077. [Google Scholar] [CrossRef]
4. Ruban, A. V. (2014). Evolution under the sun: Optimizing light harvesting in photosynthesis. Journal of Experimental Botany, 66(1), 7–23. DOI 10.1093/jxb/eru400. [Google Scholar] [CrossRef]
5. Sukhov, V. (2016). Electrical signals as mechanism of photosynthesis regulation in plants. Photosynthesis Research, 130(1–3), 373–387. DOI 10.1007/s11120-016-0270-x. [Google Scholar] [CrossRef]
6. Sukhov, V., Sherstneva, O., Surova, L., Katicheva, L., Vodeneev, V. (2014). Proton cellular influx as a probable mechanism of variation potential influence on photosynthesis in pea. Plant, Cell & Environment, 37(11), 2532–2541. DOI 10.1111/pce.12321. [Google Scholar] [CrossRef]
7. Cardona, T., Shao, S., Nixon, P. J. (2018). Enhancing photosynthesis in plants: The light reactions. Essays in Biochemistry, 62(1), 85–94. DOI 10.1042/EBC20170015. [Google Scholar] [CrossRef]
8. Kaiser, E., Correa Galvis, V., Armbruster, U. (2019). Efficient photosynthesis in dynamic light environments: A chloroplast’s perspective. Biochemical Journal, 476(19), 2725–2741. DOI 10.1042/BCJ20190134. [Google Scholar] [CrossRef]
9. Kromdijk, J., Głowacka, K., Leonelli, L., Gabilly, S. T., Iwai, M. et al. (2016). Improving photosynthesis and crop productivity by accelerating recovery from photoprotection. Science, 354(6314), 857–861. DOI 10.1126/science.aai8878. [Google Scholar] [CrossRef]
10. Wobbe, L., Bassi, R., Kruse, O. (2016). Multi-level light capture control in plants and green algae. Trends in Plant Science, 21(1), 55–68. DOI 10.1016/j.tplants.2015.10.004. [Google Scholar] [CrossRef]
11. Salter, W. T., Li, S., Dracatos, P. M., Barbour, M. M. (2020). Identification of quantitative trait loci for dynamic and steady-state photosynthetic traits in a barley mapping population. AoB Plants, 12(6), 1097. DOI 10.1093/aobpla/plaa063. [Google Scholar] [CrossRef]
12. Mirkovic, T., Ostroumov, E. E., Anna, J. M., van Grondelle, R., Govindjee, G. et al. (2016). Light absorption and energy transfer in the antenna complexes of photosynthetic organisms. Chemical Reviews, 117(2), 249–293. DOI 10.1021/acs.chemrev.6b00002. [Google Scholar] [CrossRef]
13. Kunugi, M., Satoh, S., Ihara, K., Shibata, K., Yamagishi, Y. et al. (2016). Evolution of green plants accompanied changes in light-harvesting systems. Plant and Cell Physiology, 57(6), 1231–1243. DOI 10.1093/pcp/pcw071. [Google Scholar] [CrossRef]
14. Benson, S. L., Maheswaran, P., Ware, M. A., Hunter, C. N., Horton, P. et al. (2015). An intact light harvesting complex I antenna system is required for complete state transitions in Arabidopsis. Nature Plants, 1(12), 301. DOI 10.1038/nplants.2015.176. [Google Scholar] [CrossRef]
15. Kume, A., Akitsu, T., Nasahara, K. N. (2018). Why is chlorophyll b only used in light-harvesting systems? Journal of Plant Research, 131(6), 961–972. DOI 10.1007/s10265-018-1052-7. [Google Scholar] [CrossRef]
16. Shewry, P. R. (2009). Wheat. Journal of Experimental Botany, 60(6), 1537–1553. DOI 10.1093/jxb/erp058. [Google Scholar] [CrossRef]
17. Appels, R., Eversole, K., Feuillet, C., Keller, B., Rogers, J. et al. (2018). Shifting the limits in wheat research and breeding using a fully annotated reference genome. Science, 361(6403), eaar7191. DOI 10.1126/science.aar7191. [Google Scholar] [CrossRef]
18. Hatfield, J. L., Beres, B. L. (2019). Yield gaps in wheat: Path to enhancing productivity. Frontiers in Plant Science, 10, 412. DOI 10.3389/fpls.2019.01603. [Google Scholar] [CrossRef]
19. Williams, N. D., Joppa, L. R., Duysen, M. E., Freeman, T. P. (1985). Inheritance of three chlorophyll-deficient mutants of common wheat. Crop Science, 25(6), 1023–1025. DOI 10.2135/cropsci1985.0011183X002500060030x. [Google Scholar] [CrossRef]
20. Freeman, T. P., Duysen, M. E., Williams, N. D. (1987). Effects of gene dosage on light harvesting chlorophyll accumulation. Canadian Journal of Botany, 65(10), 2118–2123. DOI 10.1139/b87-291. [Google Scholar] [CrossRef]
21. Watanabe, N., Koval, S. F. (2003). Mapping of chlorina mutant genes on the long arm of homoeologous group 7 chromosomes in common wheat with partial deletion lines. Euphytica, 129(3), 259–265. DOI 10.1023/A:1022276724354. [Google Scholar] [CrossRef]
22. Brestic, M., Zivcak, M., Kunderlikova, K., Allakhverdiev, S. I. (2016). High temperature specifically affects the photoprotective responses of chlorophyll b-deficient wheat mutant lines. Photosynthesis Research, 130(3), 251–266. DOI 10.1007/s11120-016-0249-7. [Google Scholar] [CrossRef]
23. Brestic, M., Zivcak, M., Kunderlikova, K., Sytar, O., Shao, H. et al. (2015). Low PSI content limits the photoprotection of PSI and PSII in early growth stages of chlorophyll b-deficient wheat mutant lines. Photosynthesis Research, 125(2), 151–166. DOI 10.1007/s11120-015-0093-1. [Google Scholar] [CrossRef]
24. Li, N., Jia, J., Xia, C., Liu, X., Kong, X. (2013). Characterization and mapping of novel chlorophyll deficient mutant genes in durum wheat. Breeding Science, 63(2), 169–175. DOI 10.1270/jsbbs.63.169. [Google Scholar] [CrossRef]
25. Zhang, L. L., Liu, C., An, X. Y., Wu, H. Y., Feng, Y. et al. (2017). Identification and genetic mapping of a novel incompletely dominant yellow leaf color gene, Y1718, on chromosome 2BS in wheat. Euphytica, 213(7), 2320. DOI 10.1007/s10681-017-1894-4. [Google Scholar] [CrossRef]
26. Wang, Y., Zheng, W., Zheng, W. J., Zhu, J. C., Liu, Z. S. et al. (2018). Physiological and transcriptomic analyses of a yellow-green mutant with high photosynthetic efficiency in wheat (Triticum aestivum L.). Functional & Integrative Genomics, 18(2), 175–194. DOI 10.1007/s10142-017-0583-7. [Google Scholar] [CrossRef]
27. Jian, M. Y., Zhang, D. Z., Wang, X. Y., Wei, S. W., Zhao, Y. et al. (2020). Differential expression pattern of the proteome in response to cadmium stress based on proteomics analysis of wheat roots. BMC Genomics, 21(1), 1301. DOI 10.1186/s12864-020-6716-8. [Google Scholar] [CrossRef]
28. Li, H. J., Wang, Y. F., Zhao, C. F., Yang, M., Wang, G. X. et al. (2021). The quantitative proteomic analysis provides insight into the effects of drought stress in maize. Photosynthetica, 59(1), 1–11. DOI 10.32615/ps.2020.078. [Google Scholar] [CrossRef]
29. Tian, T., Liu, Y., Yan, H., You, Q., Yi, X. et al. (2017). AgriGO v2.0: A GO analysis toolkit for the agricultural community, 2017 update. Nucleic Acids Research, 45(W1), W122–129. DOI 10.1093/nar/gkx382. [Google Scholar] [CrossRef]
30. Wu, J., Mao, X., Cai, T., Luo, J., Wei, L. (2006). KOBAS server: A web-based platform for automated annotation and pathway identification. Nucleic Acids Research, 34(Web Server), W720–W724. DOI 10.1093/nar/gkl167. [Google Scholar] [CrossRef]
31. Chen, C., Chen, H., Zhang, Y., Thomas, H. R., Frank, M. H. et al. (2020). TBtools: An integrative toolkit developed for interactive analyses of big biological data. Molecular Plant, 13(8), 1194–1202. DOI 10.1016/j.molp.2020.06.009. [Google Scholar] [CrossRef]
32. Dobin, A., Davis, C. A., Schlesinger, F., Drenkow, J., Zaleski, C. et al. (2013). STAR: Ultrafast universal RNA-seq aligner. Bioinformatics, 29(1), 15–21. DOI 10.1093/bioinformatics/bts635. [Google Scholar] [CrossRef]
33. Pertea, M., Kim, D., Pertea, G. M., Leek, J. T., Salzberg, S. L. (2016). Transcript-level expression analysis of RNA-seq experiments with HISAT, StringTie and Ballgown. Nature Protocols, 11(9), 1650–1667. DOI 10.1038/nprot.2016.095. [Google Scholar] [CrossRef]
34. McKenna, A., Hanna, M., Banks, E., Sivachenko, A., Cibulskis, K. et al. (2010). The genome analysis toolkit: A MapReduce framework for analyzing next-generation DNA sequencing data. Genome Research, 20(9), 1297–1303. DOI 10.1101/gr.107524.110. [Google Scholar] [CrossRef]
35. Zou, M. J., Guan, Y. C., Ren, H. B., Zhang, F., Chen, F. (2008). A bZIP transcription factor, OsABI5, is involved in rice fertility and stress tolerance. Plant Molecular Biology, 66(6), 675–683. DOI 10.1007/s11103-008-9298-4. [Google Scholar] [CrossRef]
36. Yin, L. L., Xue, H. W. (2012). The MADS29 transcription factor regulates the degradation of the nucellus and the nucellar projection during rice seed development. Plant Cell, 24(3), 1049–1065. DOI 10.1105/tpc.111.094854. [Google Scholar] [CrossRef]
37. Mochizuki, N., Brusslan, J. A., Larkin, R., Nagatani, A., Chory, J. (2001). Arabidopsis genomes uncoupled 5 (GUN5) mutant reveals the involvement of Mg-chelatase H subunit in plastid-to-nucleus signal transduction. Proceedings of the National Academy of Sciences of the United States of America, 98(4), 2053–2058. DOI 10.1073/pnas.98.4.2053. [Google Scholar] [CrossRef]
38. Albanese, P., Manfredi, M., Re, A., Marengo, E., Saracco, G. et al. (2018). Thylakoid proteome modulation in pea plants grown atdifferent irradiances: quantitative proteomic profiling in a non-model organism aided by transcriptomic data integration. Plant Journal, 96(4), 786–800. DOI 10.1111/tpj.14068. [Google Scholar] [CrossRef]
39. Takenaka, M., Zehrmann, A., Verbitskiy, D., Härtel, B., Brennicke, A. (2013). RNA editing in plants and its evolution. Annual Review of Genetics, 47(1), 335–352. DOI 10.1146/annurev-genet-111212-133519. [Google Scholar] [CrossRef]
40. Lv, S., Feng, K., Peng, S., Wang, J., Zhang, Y. et al. (2018). Comparative analysis of the transcriptional response of tolerant and sensitive wheat genotypes to drought stress in field conditions. Agronomy, 8(11), 247. DOI 10.3390/agronomy8110247. [Google Scholar] [CrossRef]
41. Niaz, S. (2018). The AGO proteins: An overview. Biological Chemistry, 399(6), 525–547. DOI 10.1515/hsz-2017-0329. [Google Scholar] [CrossRef]
 | This work is licensed under a Creative Commons Attribution 4.0 International License, which permits unrestricted use, distribution, and reproduction in any medium, provided the original work is properly cited. |