International Journal of
Experimental Botany
| Phyton- International Journal of Experimental Botany |
DOI: 10.32604/phyton.2021.014242
ARTICLE
GC-MS Analysis of Metabolites in Filling Grains of Rice-Tartary Buckwheat (Fagopyrum tataricum) in Comparison to Conventional Tartary Buckwheat
1Research Center of Buckwheat Industry Technology, School of Life Science, Guizhou Normal University, Guiyang, 550001, China
2College of Bioengineering, Chengdu University, Chengdu, 610106, China
3National Research and Development Center for Coarse Cereal Processing, Chengdu, 610106, China
*Corresponding Author: Yan Wang. Email: 201606002@gznu.edu.cn
Received: 12 September 2020; Accepted: 25 November 2020
#The two authors contributed equally to this work
Abstract: Rice-Tartary buckwheat (RTB) is a special germplasm of Tartary buckwheat. In this study, the appraisal of taste quality between RTB and conventional Tartary buckwheat (CTB) was presented, and the metabolites in kernels at three typical grain filling stage (GFS) were investigated. Unlike CTB, RTB showed thin shell seeds without longitudinal furrows at maturity, which was easily artificially dehulled. Sense organ test indicated that RTB exhibited better taste quality because of the higher values of appearance, viscosity, taste and summary were appraised. In total, 92 metabolites were identified in kernels using GM-MS metabolomics platform. The levels of most metabolites changed greatly during grain filling and a large numbers of metabolite-metabolite correlations were found by Pearson correlation coefficient analysis. ANOVA analysis identified 61 differentially expressed metabolites between RTB and CTB, while Venn diagram analysis screened 35 common differential metabolites. Compared with CTB, RTB showed similar levels of lysine and methionine, indicated that RTB own excellent nutritional value. Additionally, RTB exhibited significantly up-regulated levels of most sweeteners (sugars and polyols), which might contribute to better taste. This work provides the first comprehensive metabolomics analysis of kernels between RTB and CTB, which may potentially provide theoretical basis for further research.
Keywords: Rice-Tartary buckwheat; metabolome; taste; amino acids; sugars; polyols
Conventional Tartary buckwheat (CTB, Fagopyrum tataricum (L.) Gaertn) is one of cultispecies belong to Fagopyrum Mill [1,2]. As an edible pseudocereal, the high nutrition and health value of CTB have been wildly recognized recently [3–5]. Thus, more and more people enjoy to consume CTB as compensational food to achieve health benefits [6]. However, the kernel of CTB will be broken when directly processed due to the thick shell adhering to kernel [7], thus, the kernel of CTB is barely sold due to the difficulty of seed dehulling.
Rice-Tartary buckwheat (RTB) is a special germplasm with thin shell non-adhering to kernel [7,8]. It is feasible to directly process whole kernel of Tartary buckwheat without damaging of active ingredients with RTB [9,10]. Metabolomics analysis provides a powerful insight into understanding the basis of physiological metabolism during seed development and seed quality at maturity [11]. Till now, the dynamic changes of metabolites in CTB and RTB seeds during grain filling are rarely known. Unlike CTB (also well known as ‘Kuqiao’), RTB is call ‘Miqiao’ that is acceptable as a daily functional cereal for the palatable taste cooking like rice, but the mechanism is poorly understood. Therefore, in this study, the metabolite profiling in kernels was analyzed by GM-MS to appraise the differential metabolites between CTB and RTB, and make a comprehensive understanding of physiological metabolism during grain filling and cereal quality at maturation.
RTB ‘cv. Xiaomiqiao’ and CTB ‘cv. Jinqiao 2’ were planted at the Experiment Station of the Research Center of Buckwheat in Guizhou Normal University, China (1146 m, 26°50′ N, 106°58′ E) during the autumn growing season in 2018.
The grains of Tartary buckwheat were sampled at early grain filing stage (10 d after heading), middle grain filing stage (20 d after heading) and maturity (30 d after heading) with 6 replications for further investigation (Fig. 1A).
RTB and CTB seeds were artificially dehulled and cooked by electric rice cooker (MB-40EASY202, Midea, China). Twenty-two trained panelists were divided into 11 groups to participate in appreciating the sense organ test. The values of appearance, aroma, taste, viscosity and summary were appraised according to the method of Zhao et al. [12], compared with JQ2.
A 100 mg of samples was transferred to 5 mL centrifuge tubes and grinded by high flux organization grinding apparatus under liquid nitrogen condition. The preparation of samples for GC-MS detection was processed according to the methods of Lisec et al. [13] and Sangster et al. [14]. Then, all samples were injected into GC (Agilent GC 7890A-5975C, USA), respectively. GC was performed on a HP-5MS capillary column (5% phenyl/95% methylpolysiloxane 30 m × 250 μm i.d., 0.25 μm film thickness, Agilent J & W Scientific, Folsom, CA, USA). The injection temperature was 280°C and the split ratio was 1:20, while the interface was set to 150°C and the ion source was adjusted to 230°C. The temperature was controlled following by 60°C for 2 min, 10 °C/min rate up to 300°C and holding there for 5 min. Mass spectrometry was recorded from 35 to 750 (m/z).
The data of GC-MS was processed by G1701 MSD ChemStation and R (v3.3.2) and analyzed by the automatic mass spectral deconvolution and identification system (AMDIS, version 2.71) using National Institute of Standards and Technology (NIST), Wiley Registry and the Golm Metabolome Database (GMD). The qualitative standard was similarity greater than 70%.
Multivariate data analysis was performed by SIMCA-P (v13.0, Umetrics, Sweden) and R package ropls. The PCA and OPLS-DA were validated according to the method of Thévenot et al. [15]. The potential biomarkers and variable contribution were evaluated by the analysis of Variable Importance in the Projection (VIP) value (VIP > 1), ANOVA (p-value < 0.05) using SPSS (v19.0, IBM Corporation, Armonk, NY, USA).
Statistical analysis was performed by one-way ANOVA and t-test using SPSS (v19.0, IBM Corporation, Armonk, NY, USA).
3.1 Phenotypic Observation and Sense Organ Test
CTB showed three edges with obviously longitudinal furrows in both shell and kernel during grain filling, while RTB exhibited thin shell without longitudinal furrows at maturity (Fig. 1A). To identify the taste quality between RTB and CTB, the shell was artificially hulled, which confirmed that CTB was very difficult to dehull, whereas RTB was easily dehulled. The sense organ test of palatability characteristics was investigated by cooking like rice. Compared with CTB, RTB exhibited better taste quality because of higher values of appearance, viscosity, taste and summary were appraised (Fig. 1B, Tab. S1).
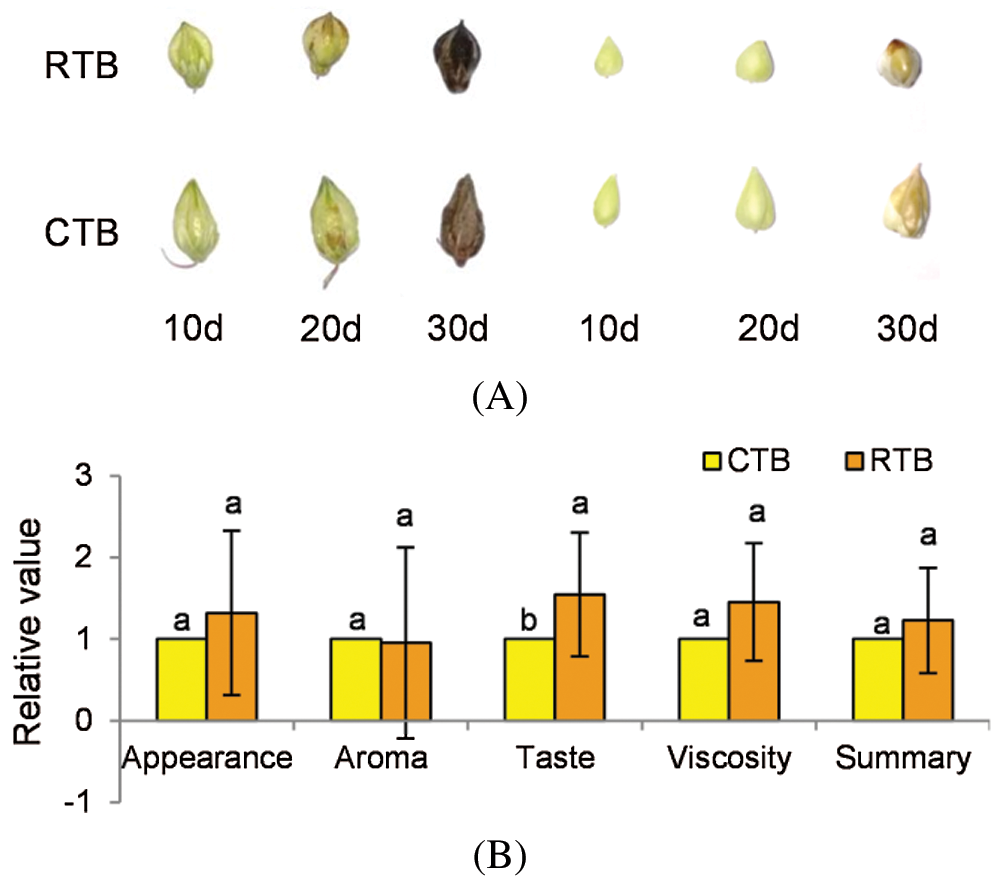
Figure 1: Phenotypic observation of grain and kernel during grain filling (A) and taste quality analysis of kernel (B) in RTB and CTB. Note: Different letters represent a significant difference (p < 0.05) between CTB and RTB by t-test, n = 11
3.2 Metabolomics Analysis of Filling Grains between RTB and CTB Seeds
The metabolites in grains of cereals are not only related to physiological metabolism, but also determine nutritive value and taste quality [11]. In this study, The GC-MS metabolomics platform was performed and 92 metabolites (including 27 amino acids, 26 organic acids, 10 sugars, 6 phosphoric acids, 6 polyols, 3 fatty acids, and others) were positively identified in grains (Fig. 2A). The hot map was established using all metabolites of the samples, which indicated that the content of metabolites varied greatly during grain filling, especially amino acids and organic acids (Fig. 2C and Tab. S2).
PCA indicated that the metabolomes in grains sampled at different filling stage were different from each other by the value of PC1 and PC2 were 81.9% and 14.9%, respectively (Fig. S1). OPLS-DA was performed to maximize the distinction between groups, with the values of R2X, R2Y and Q2 were shown in Fig. S2.
The one-way ANOVA p-value ≤ 0.05 and the VIP value ≥ 1 were performed to screen DEMs using OPLS-DA models. In total, 61 and 41 DEMs in CTB and RTB were detected at different GFS, respectively. Compared with CTB, RTB showed 60, 50 and 54 of DEMs at 10 d, 20 d and 30 d after heading, respectively (Fig. 2B, Tab. S2). Venn diagram showed 35 common differential metabolites amongst comparison groups (Fig. 2D).
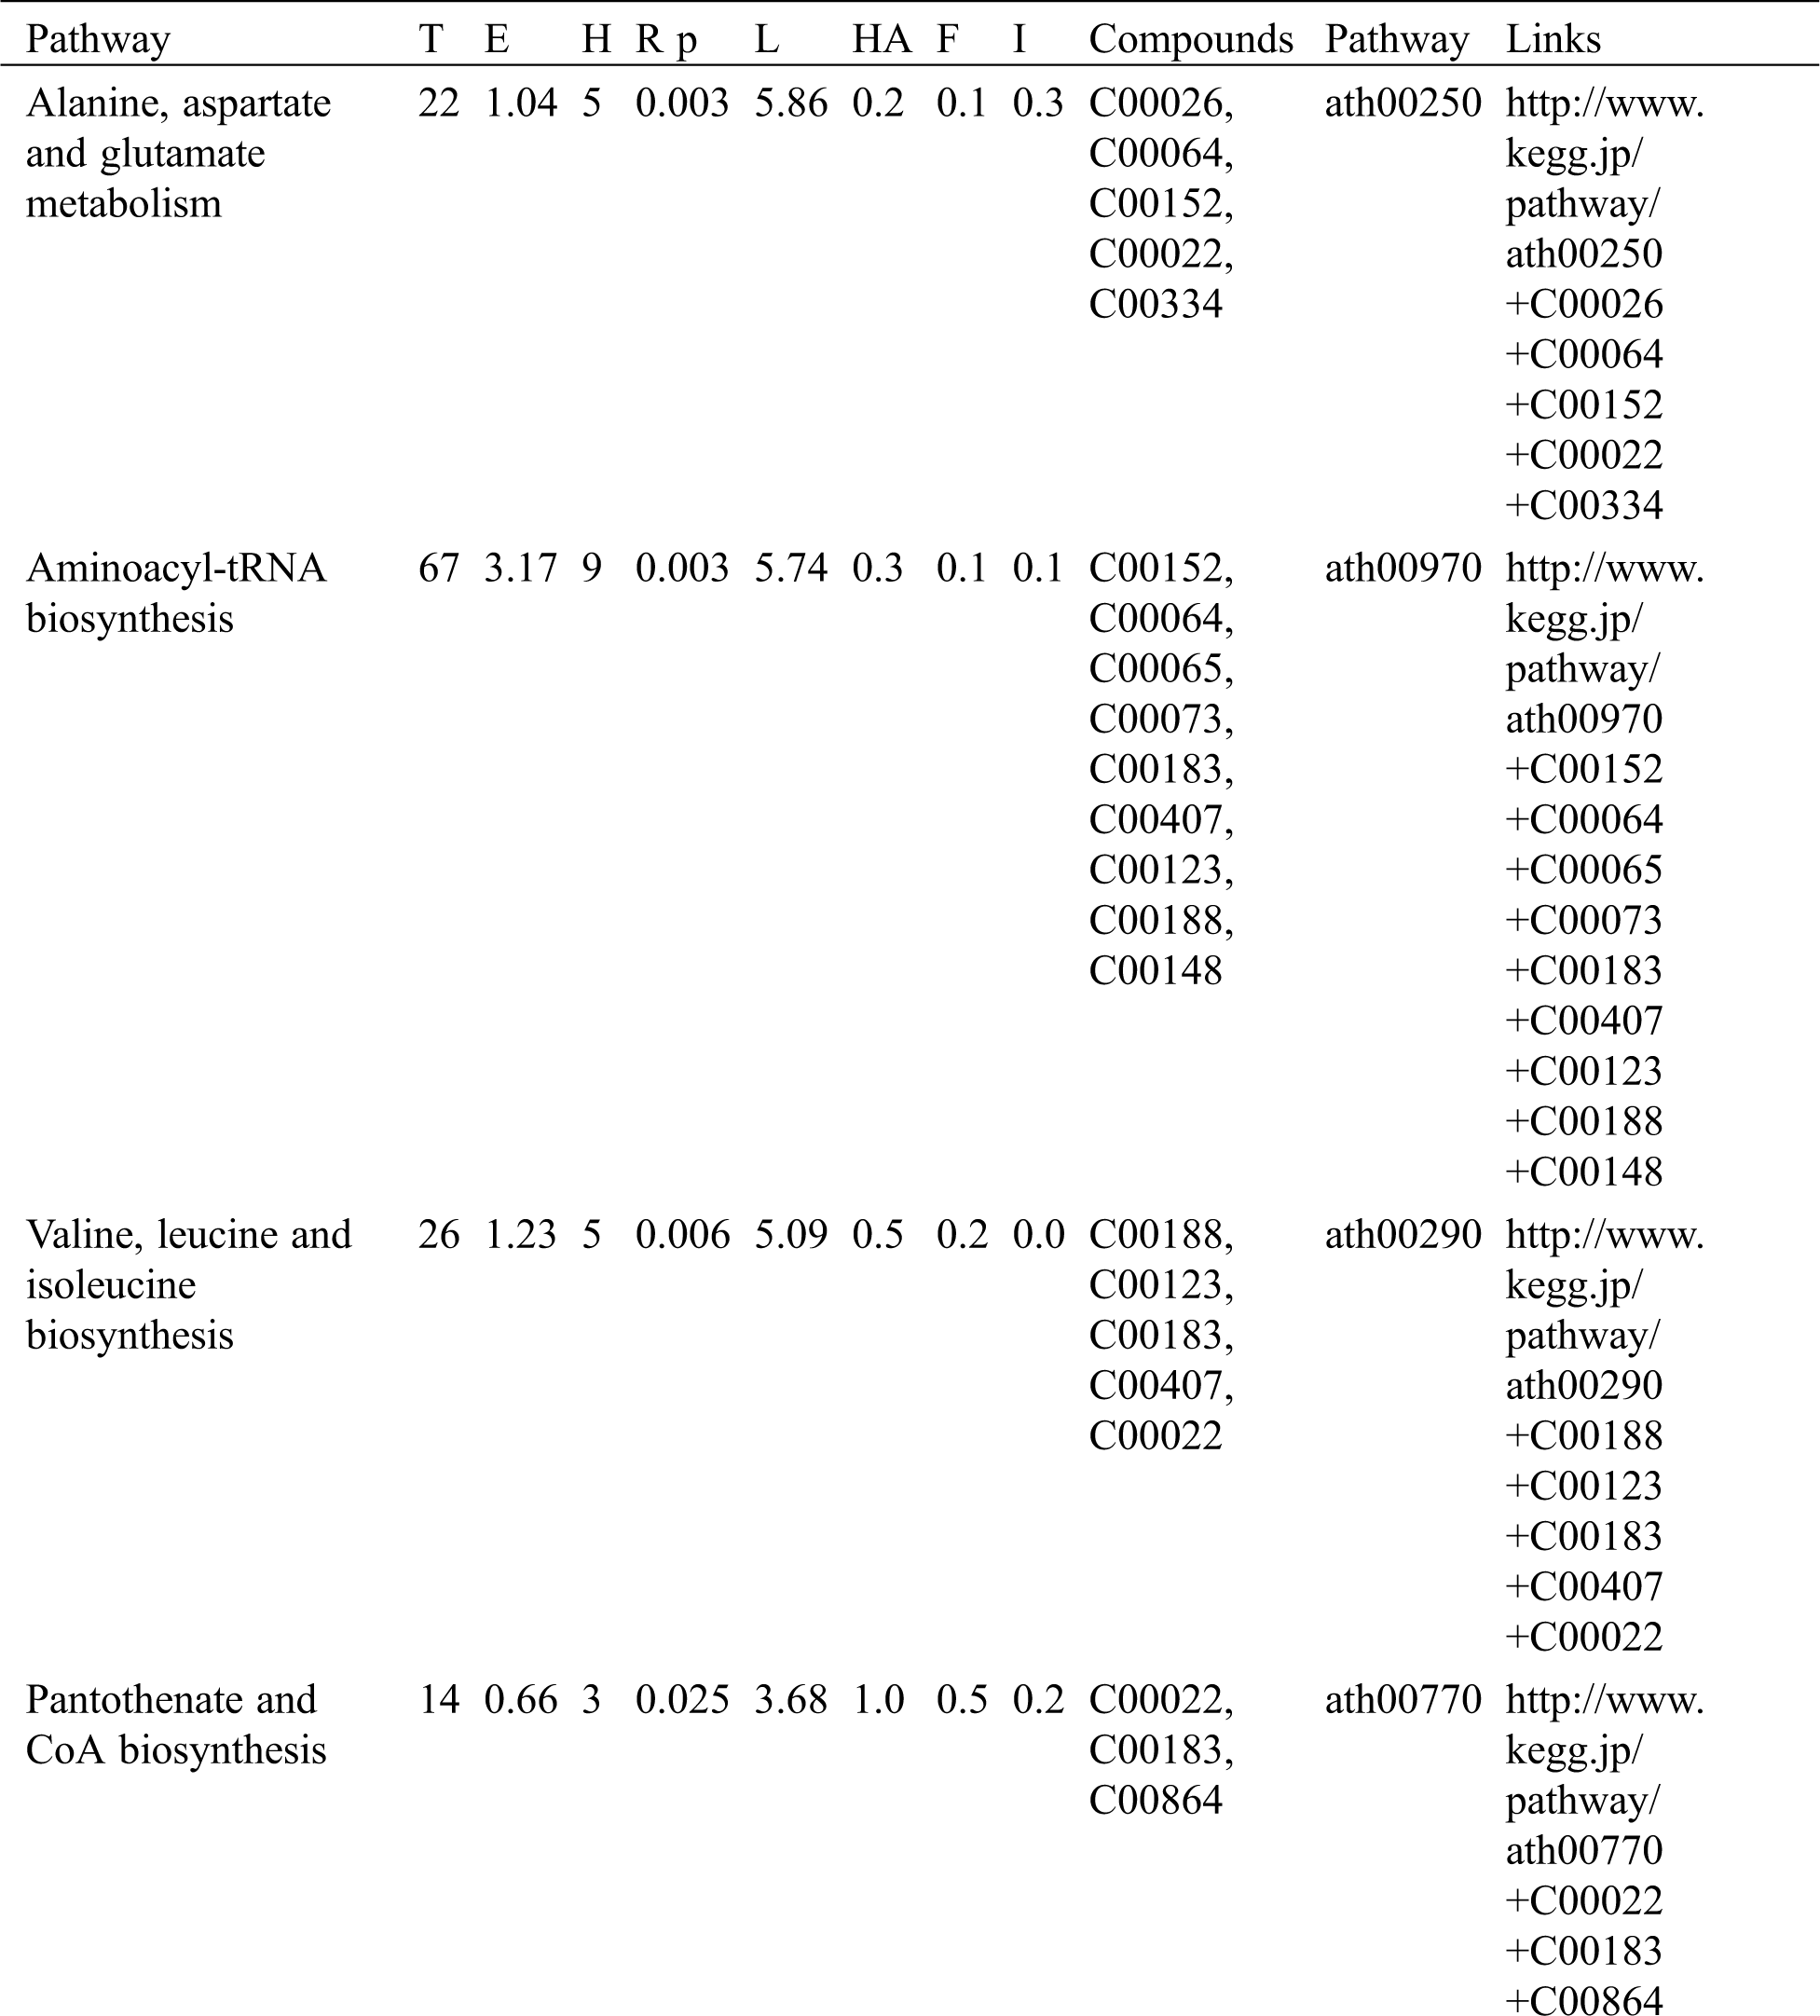
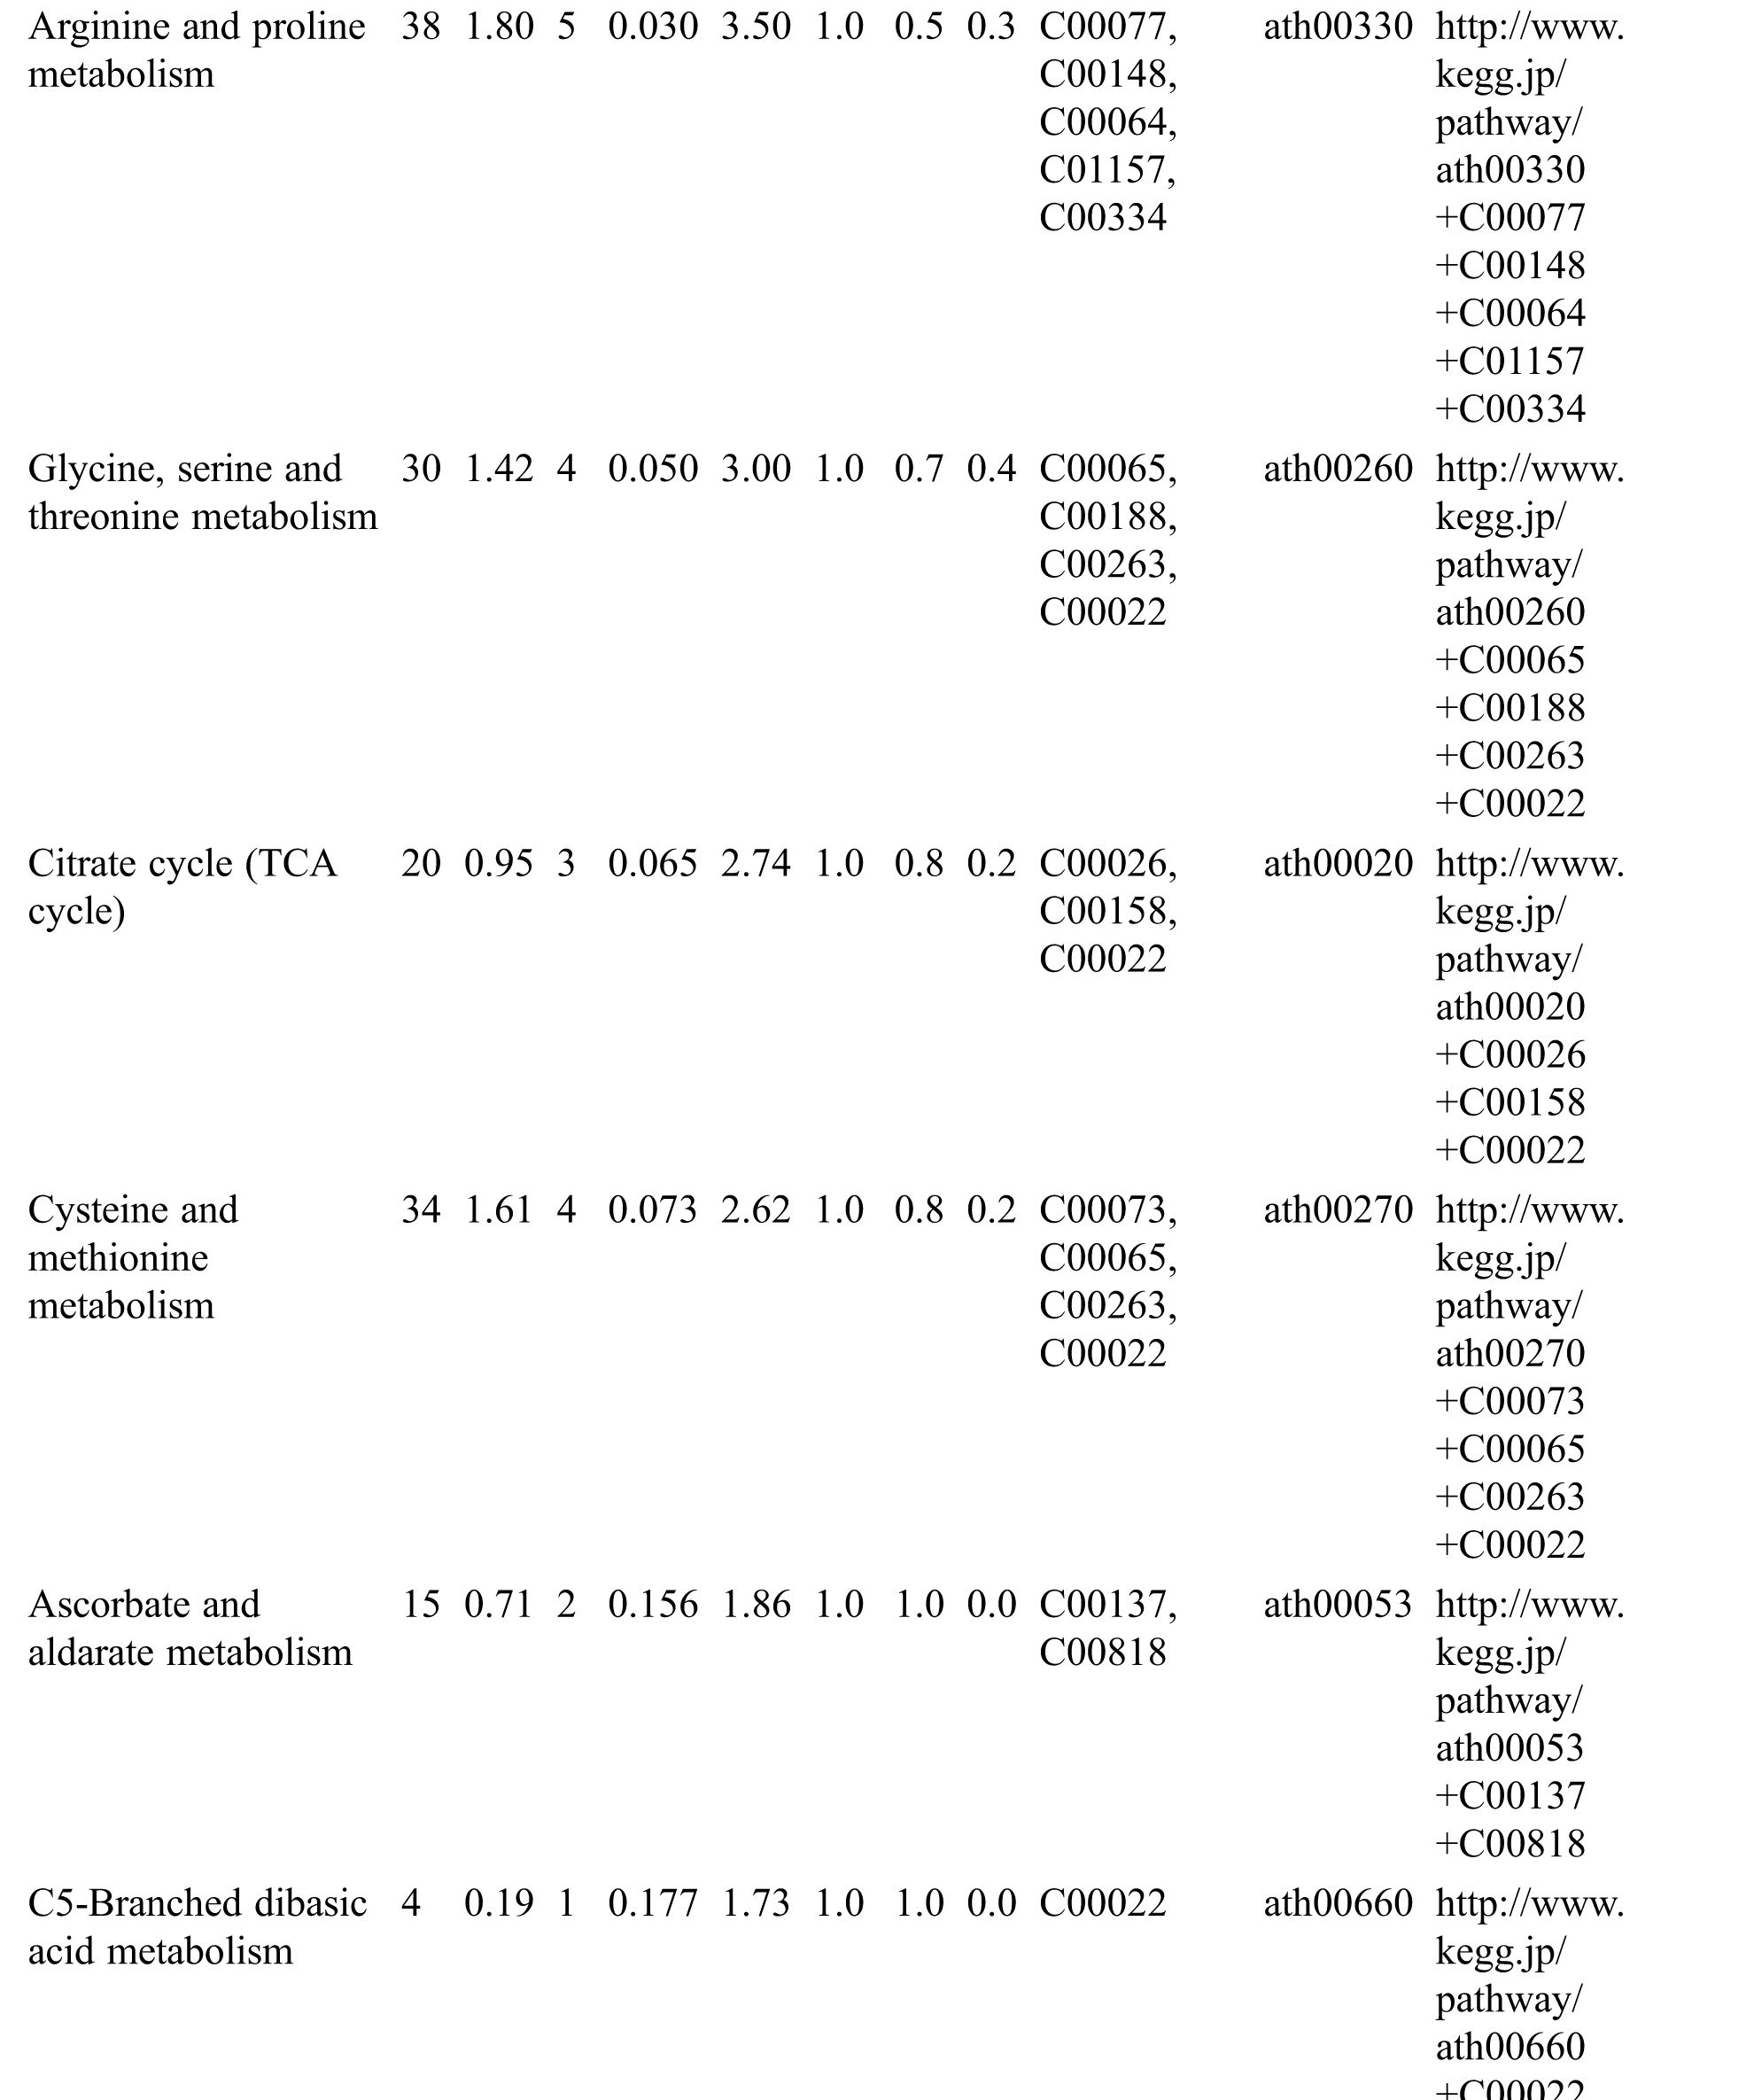
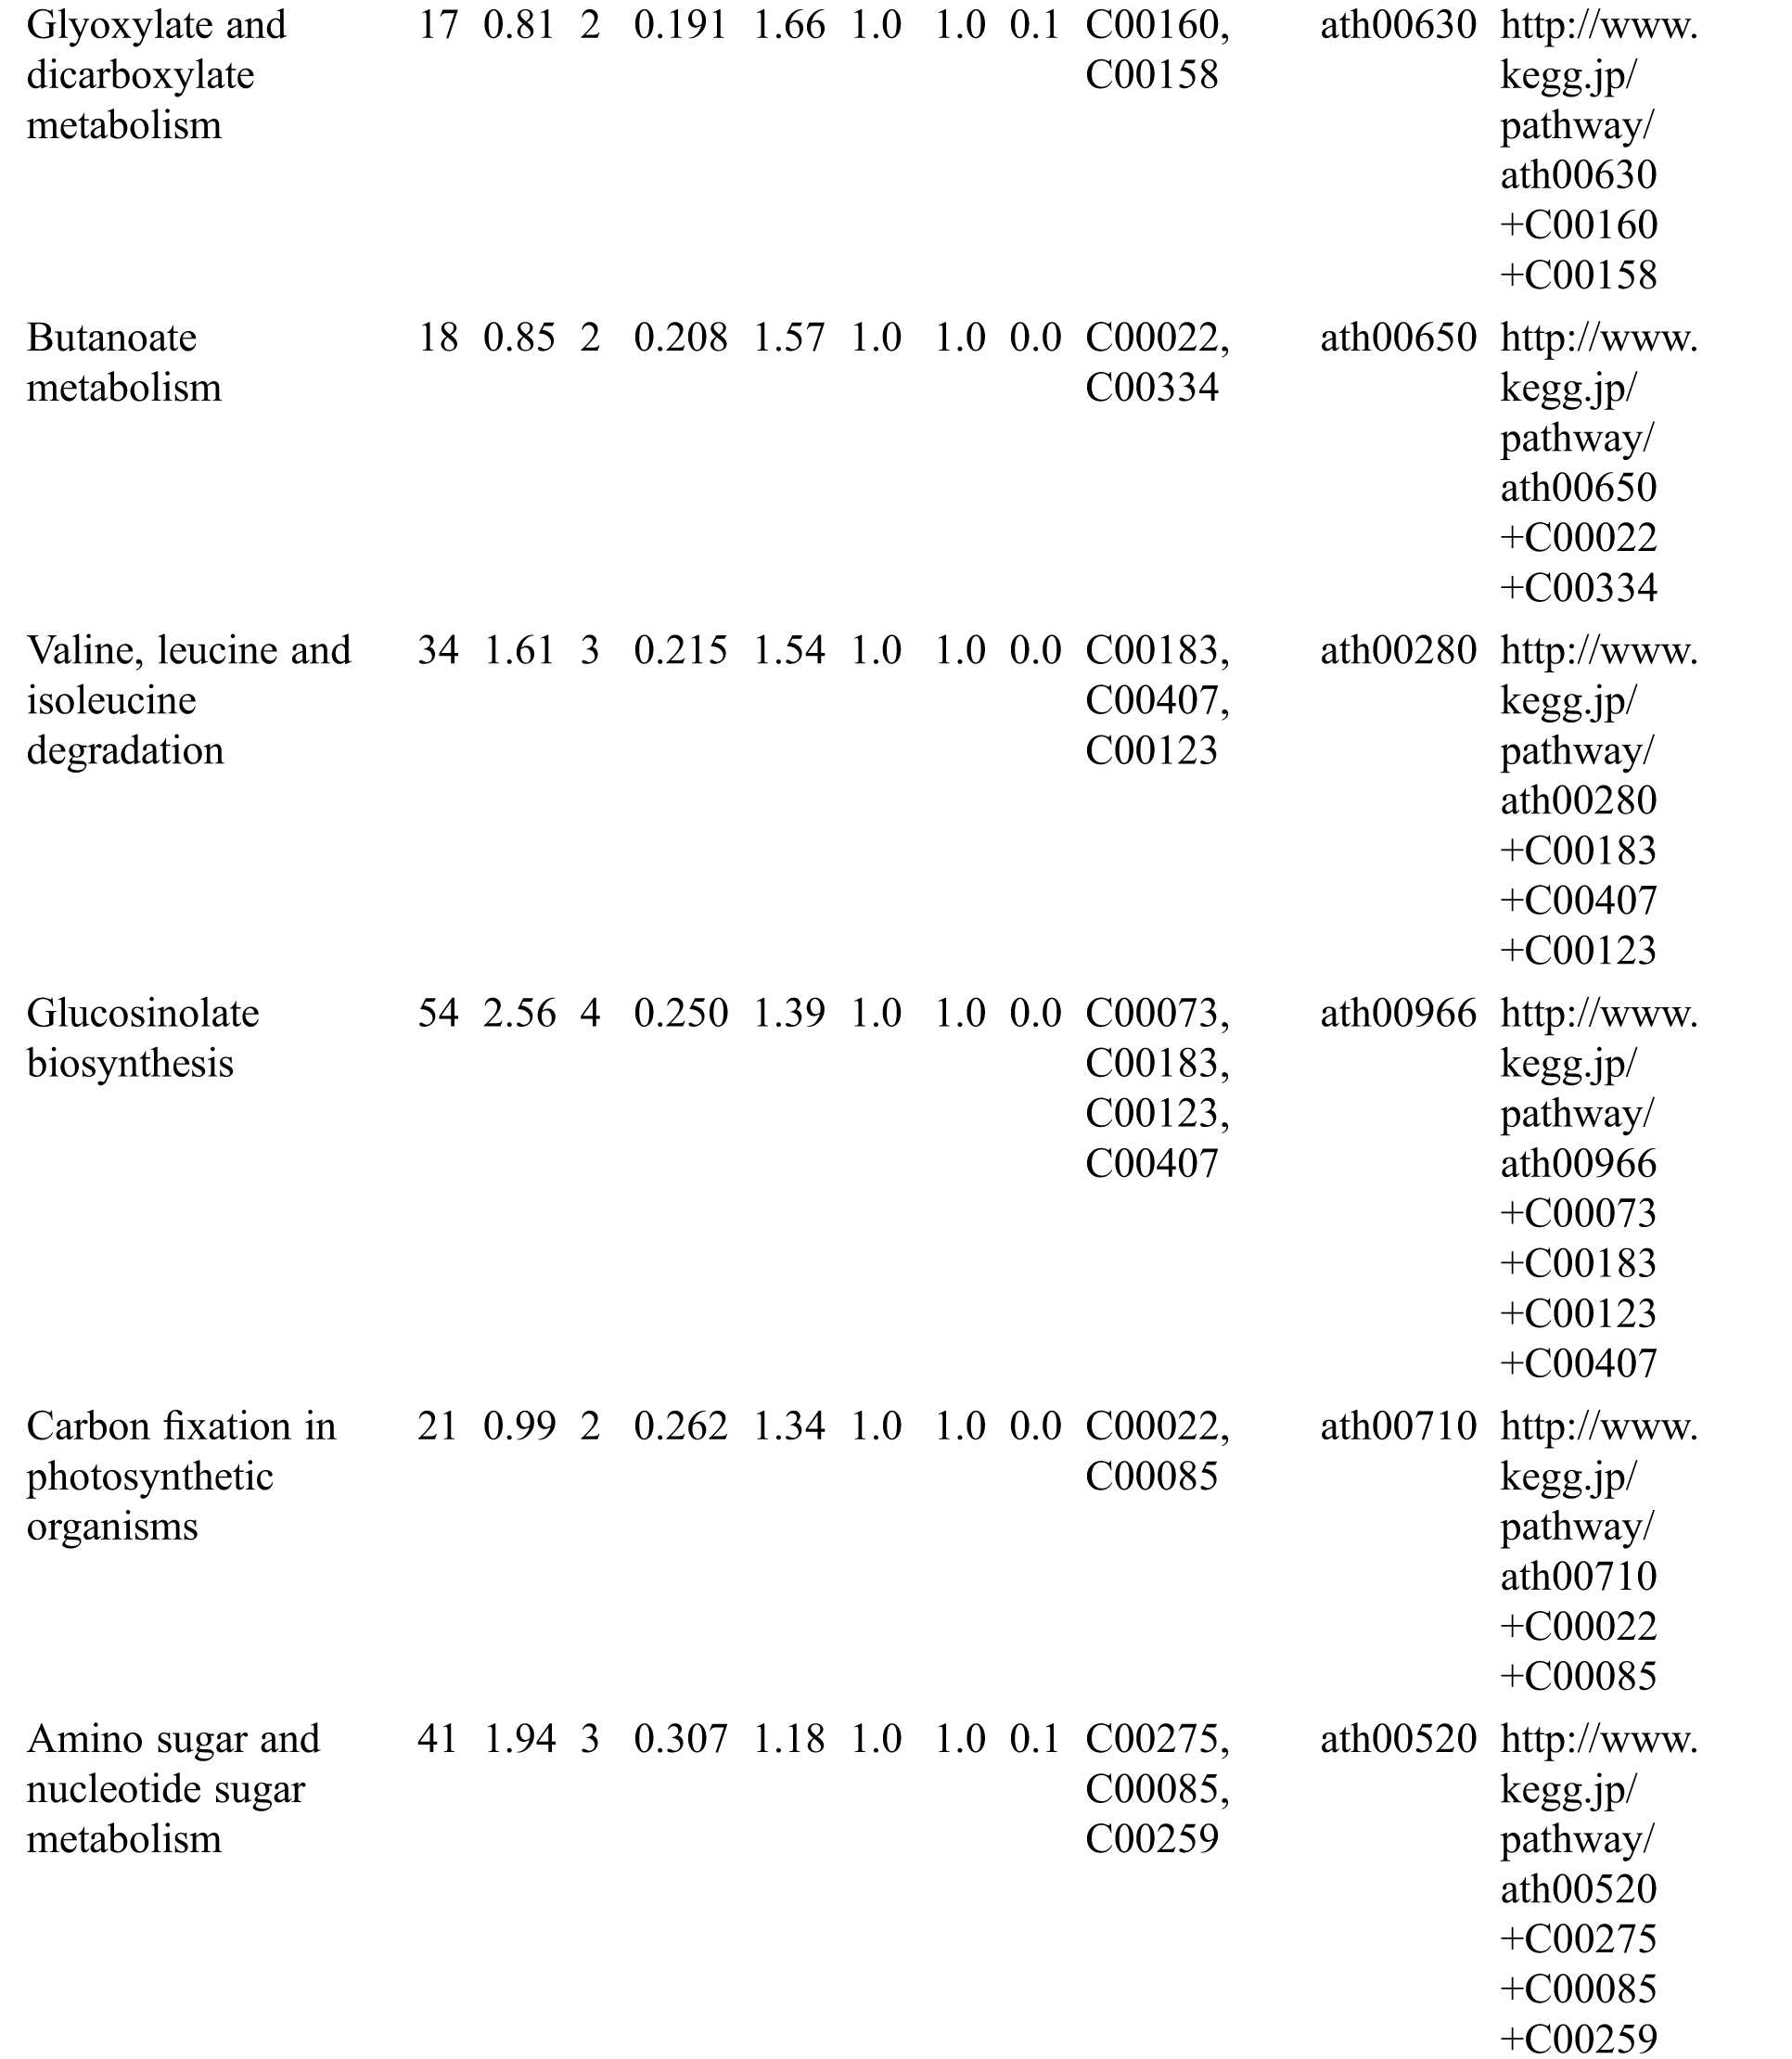
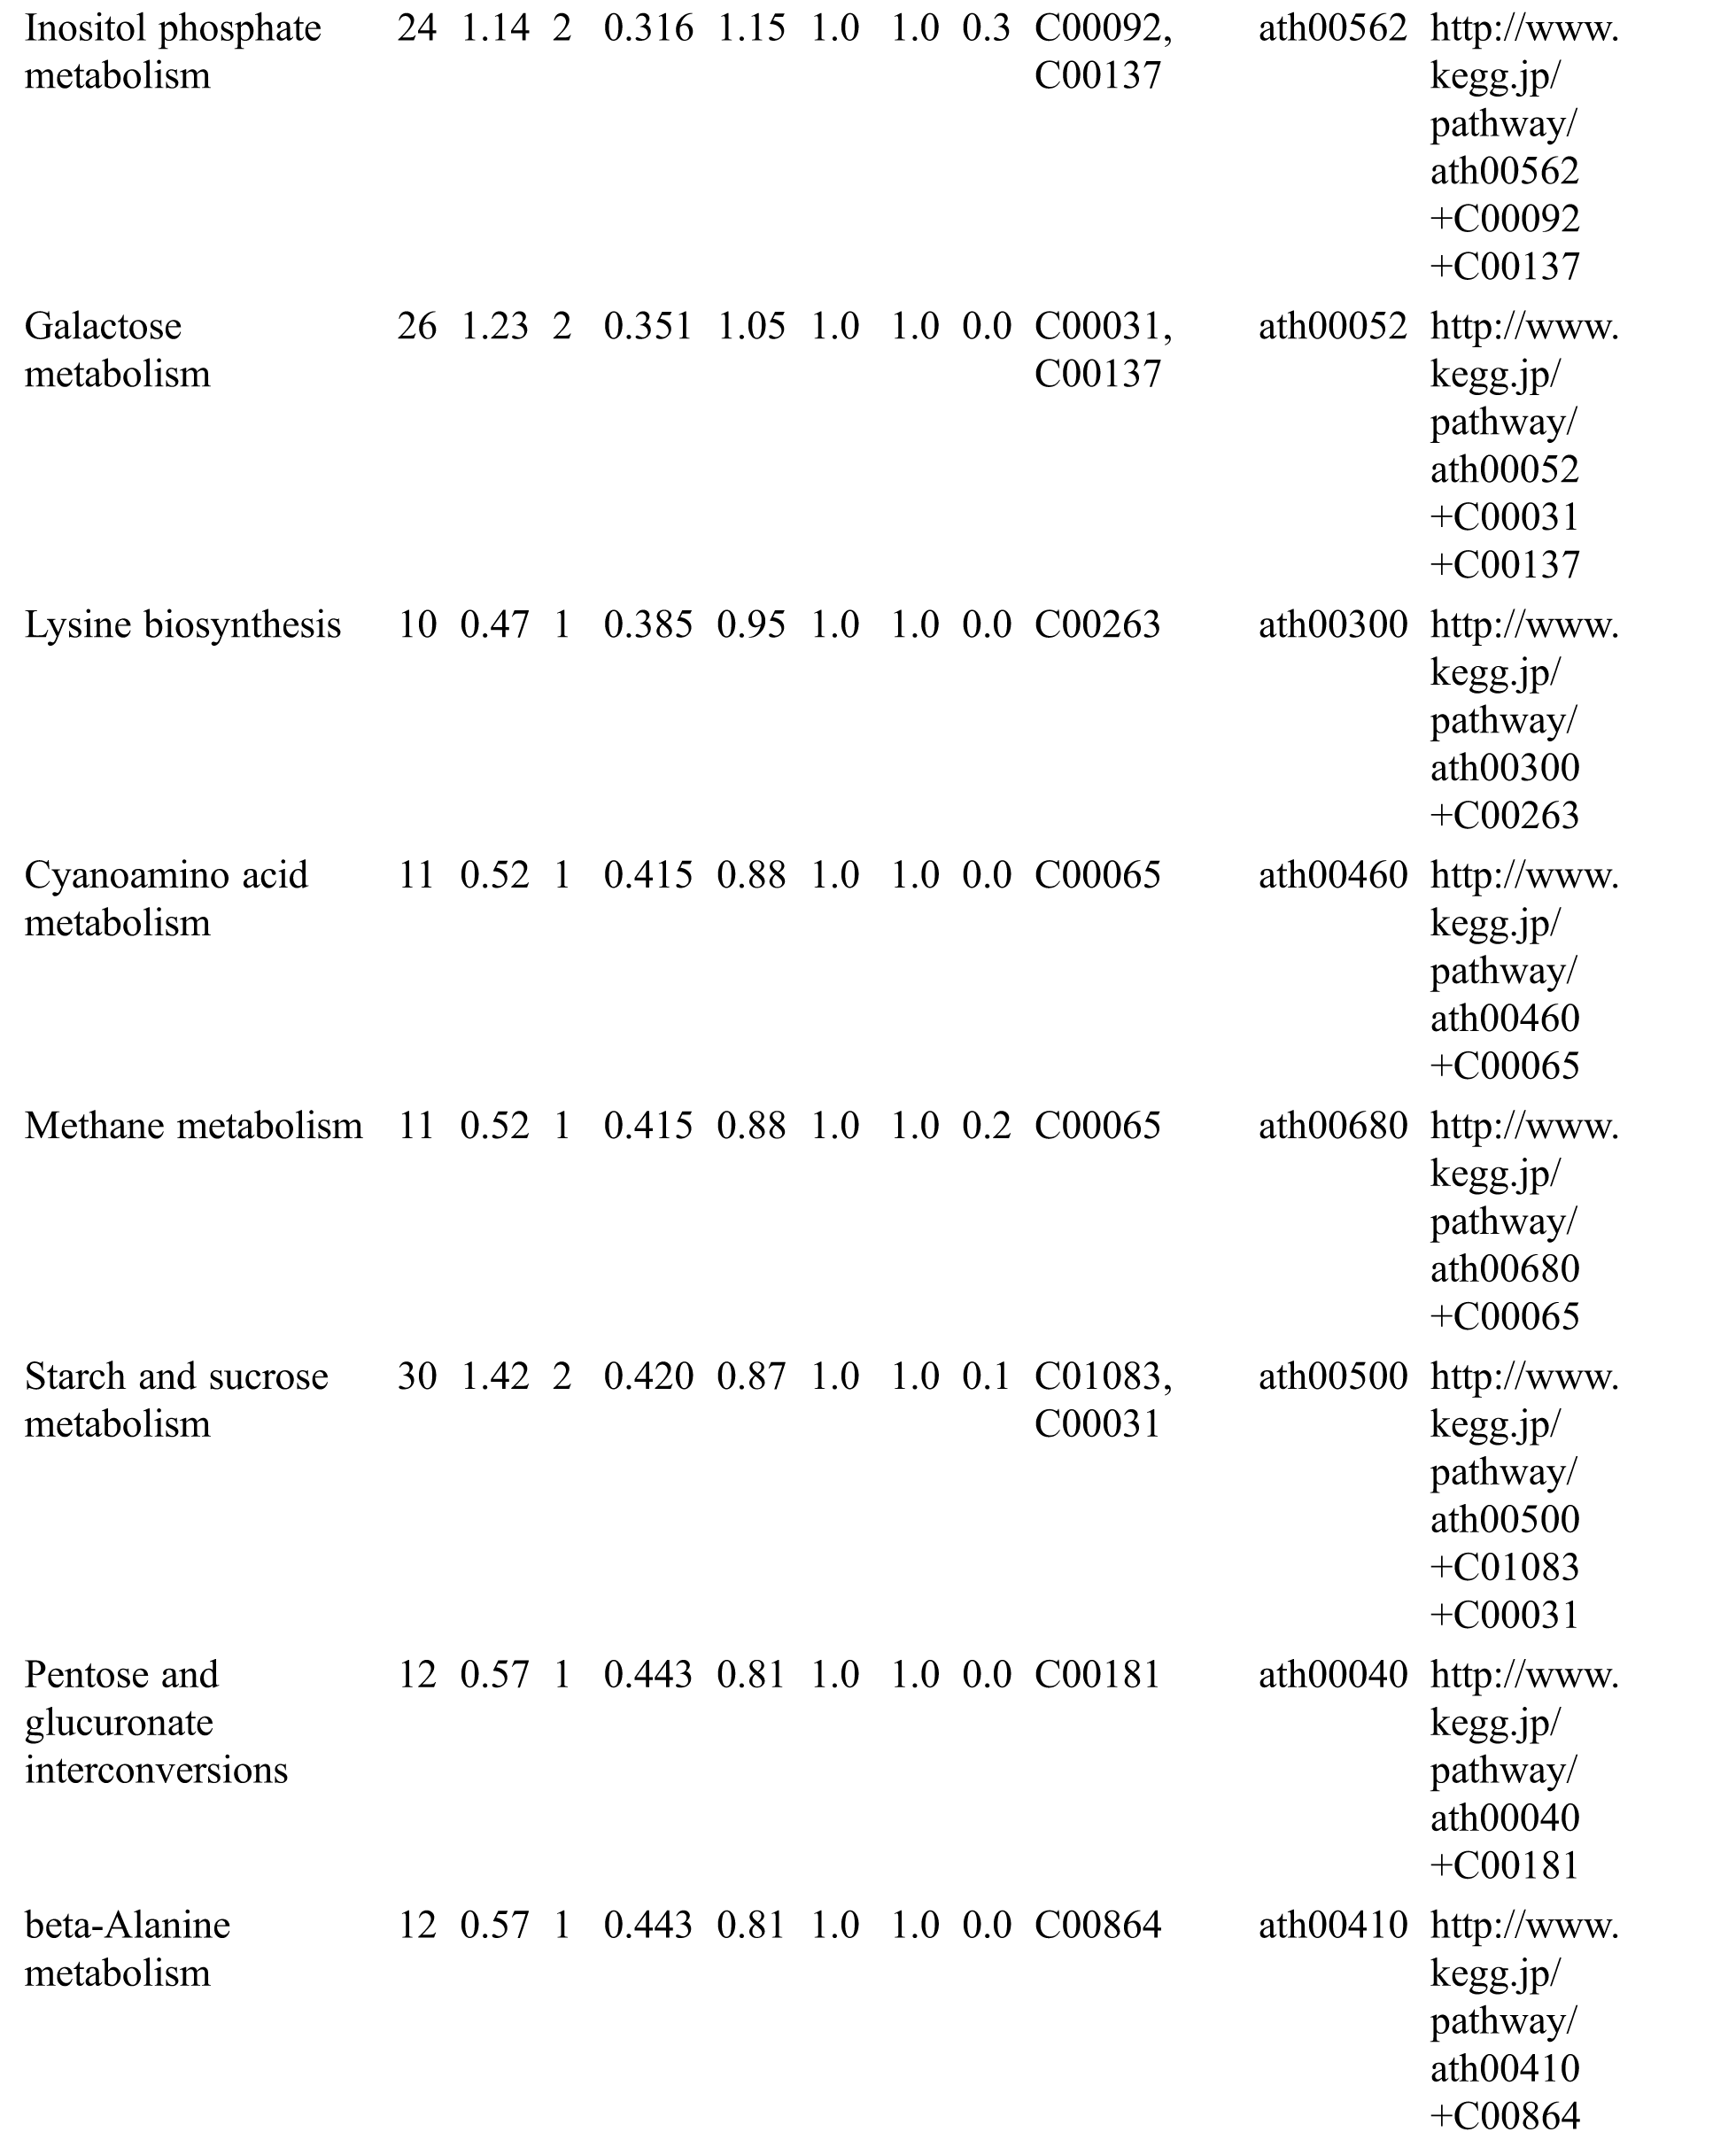
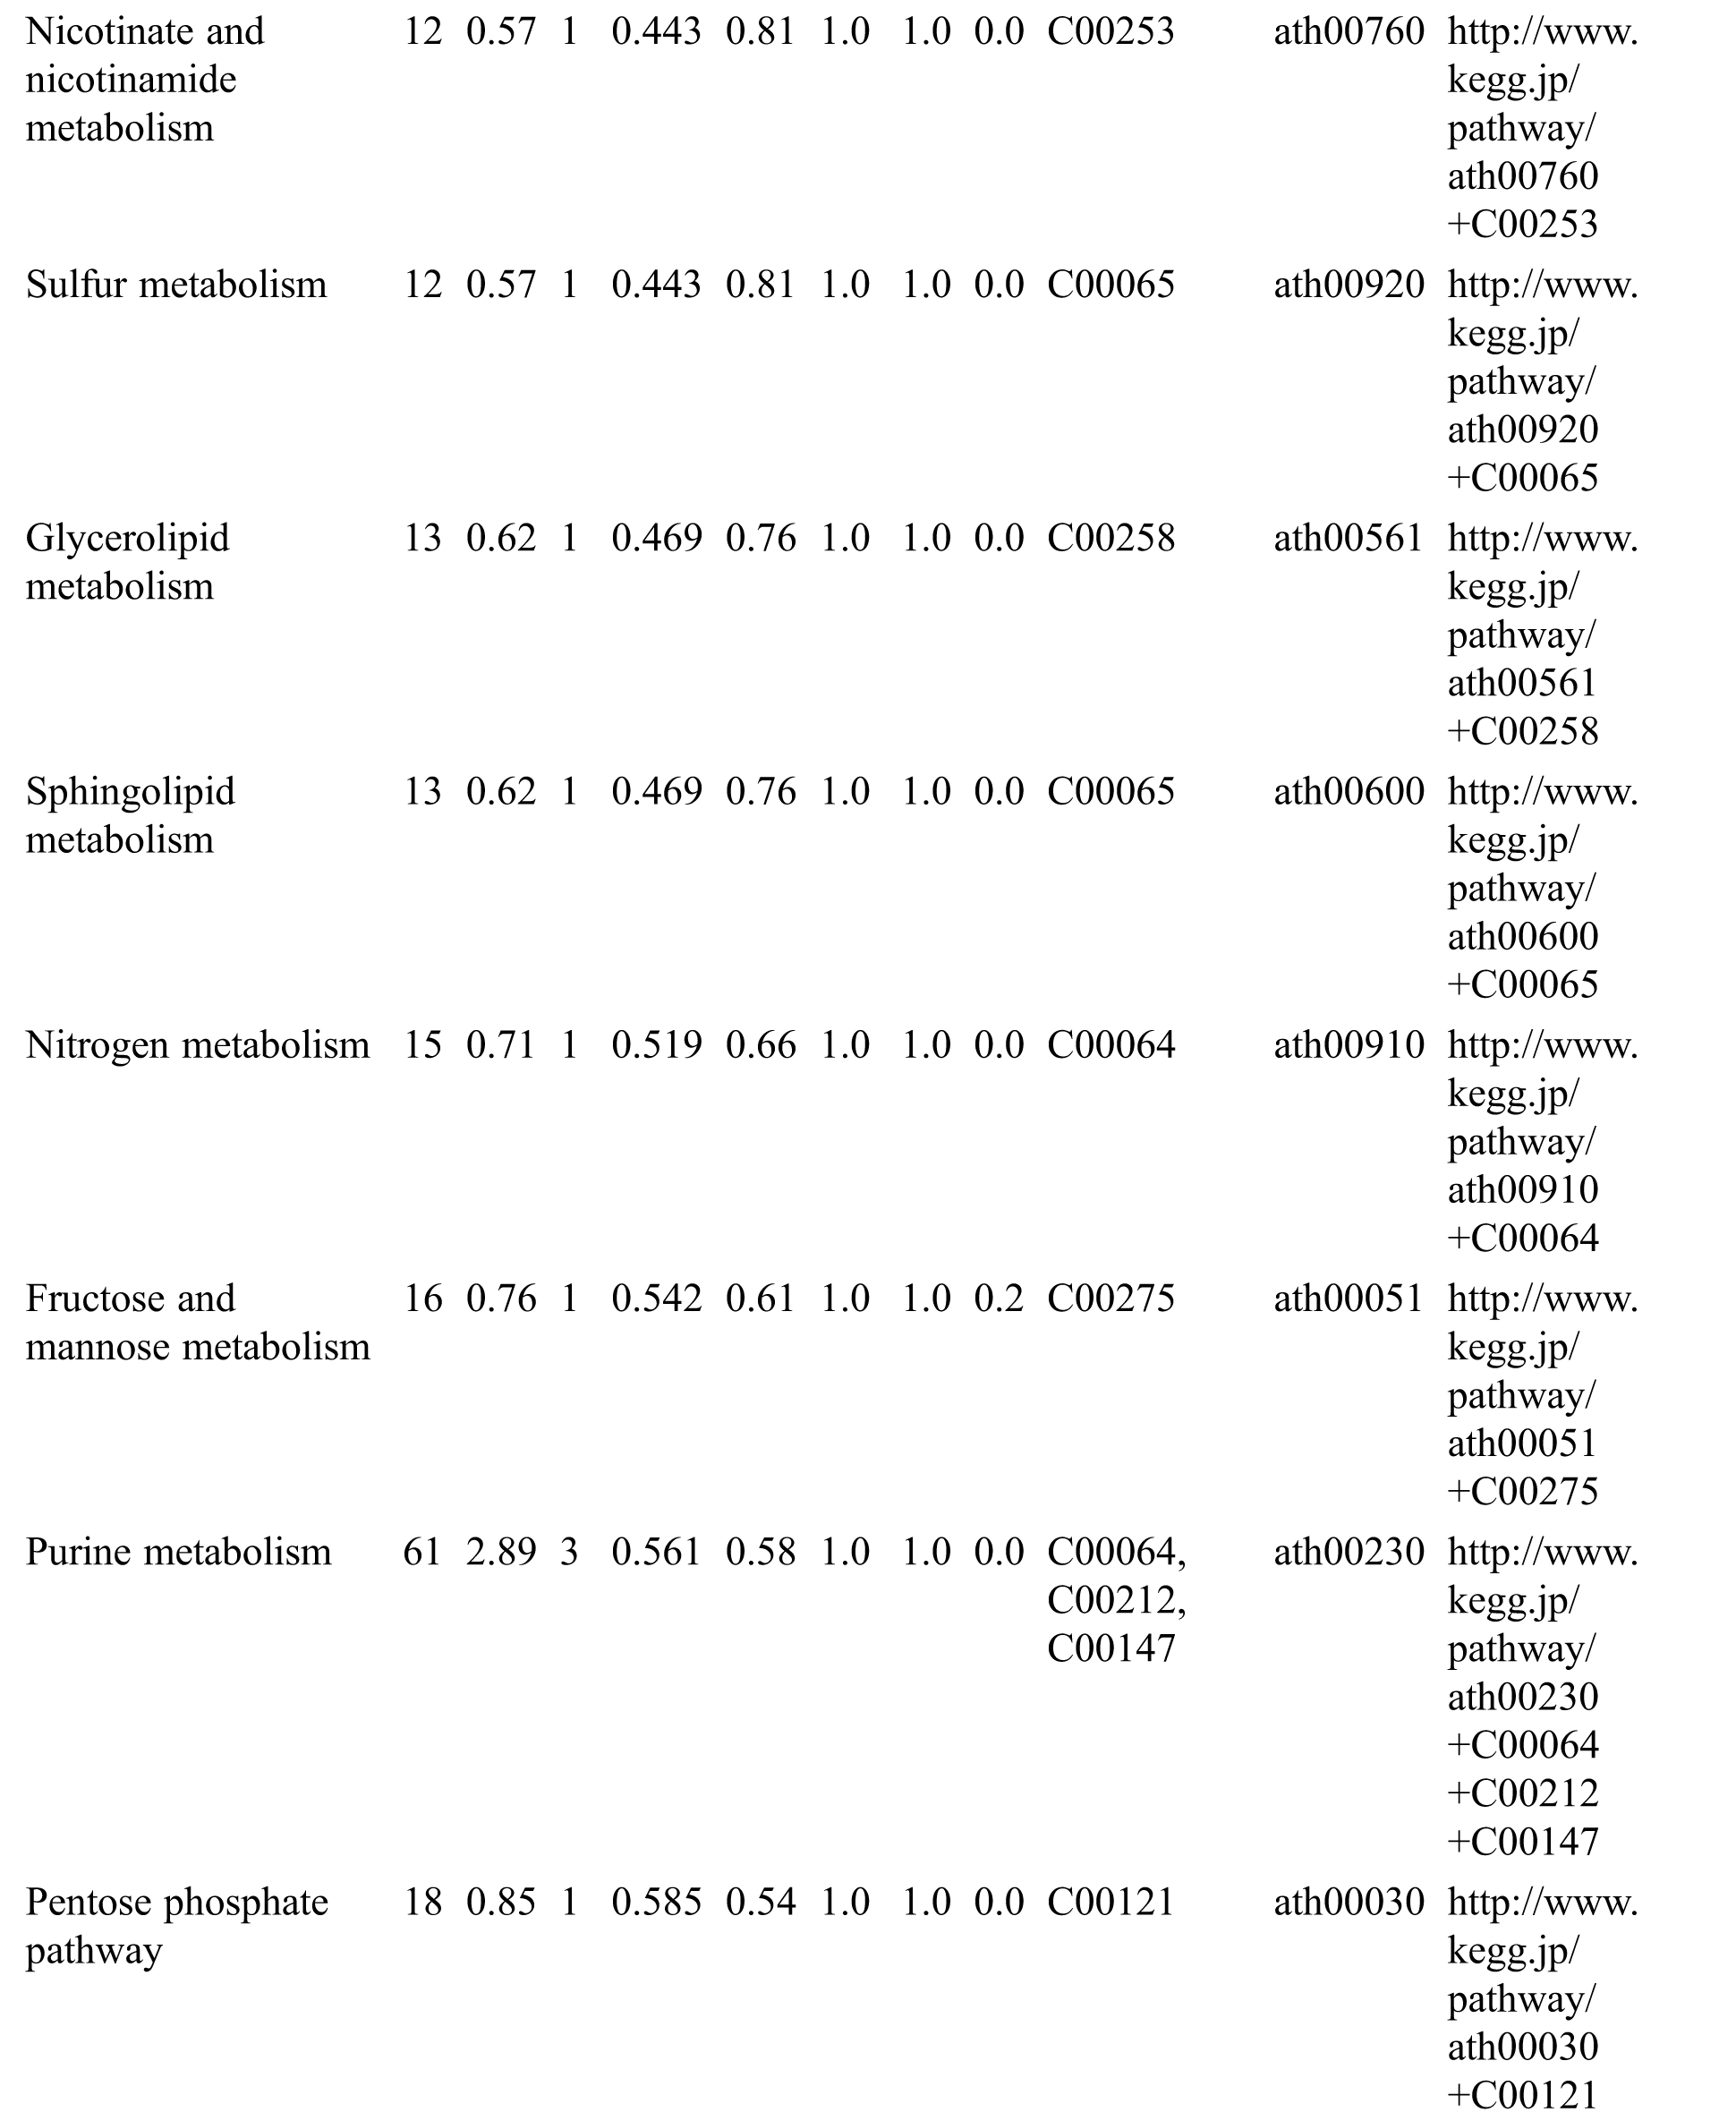
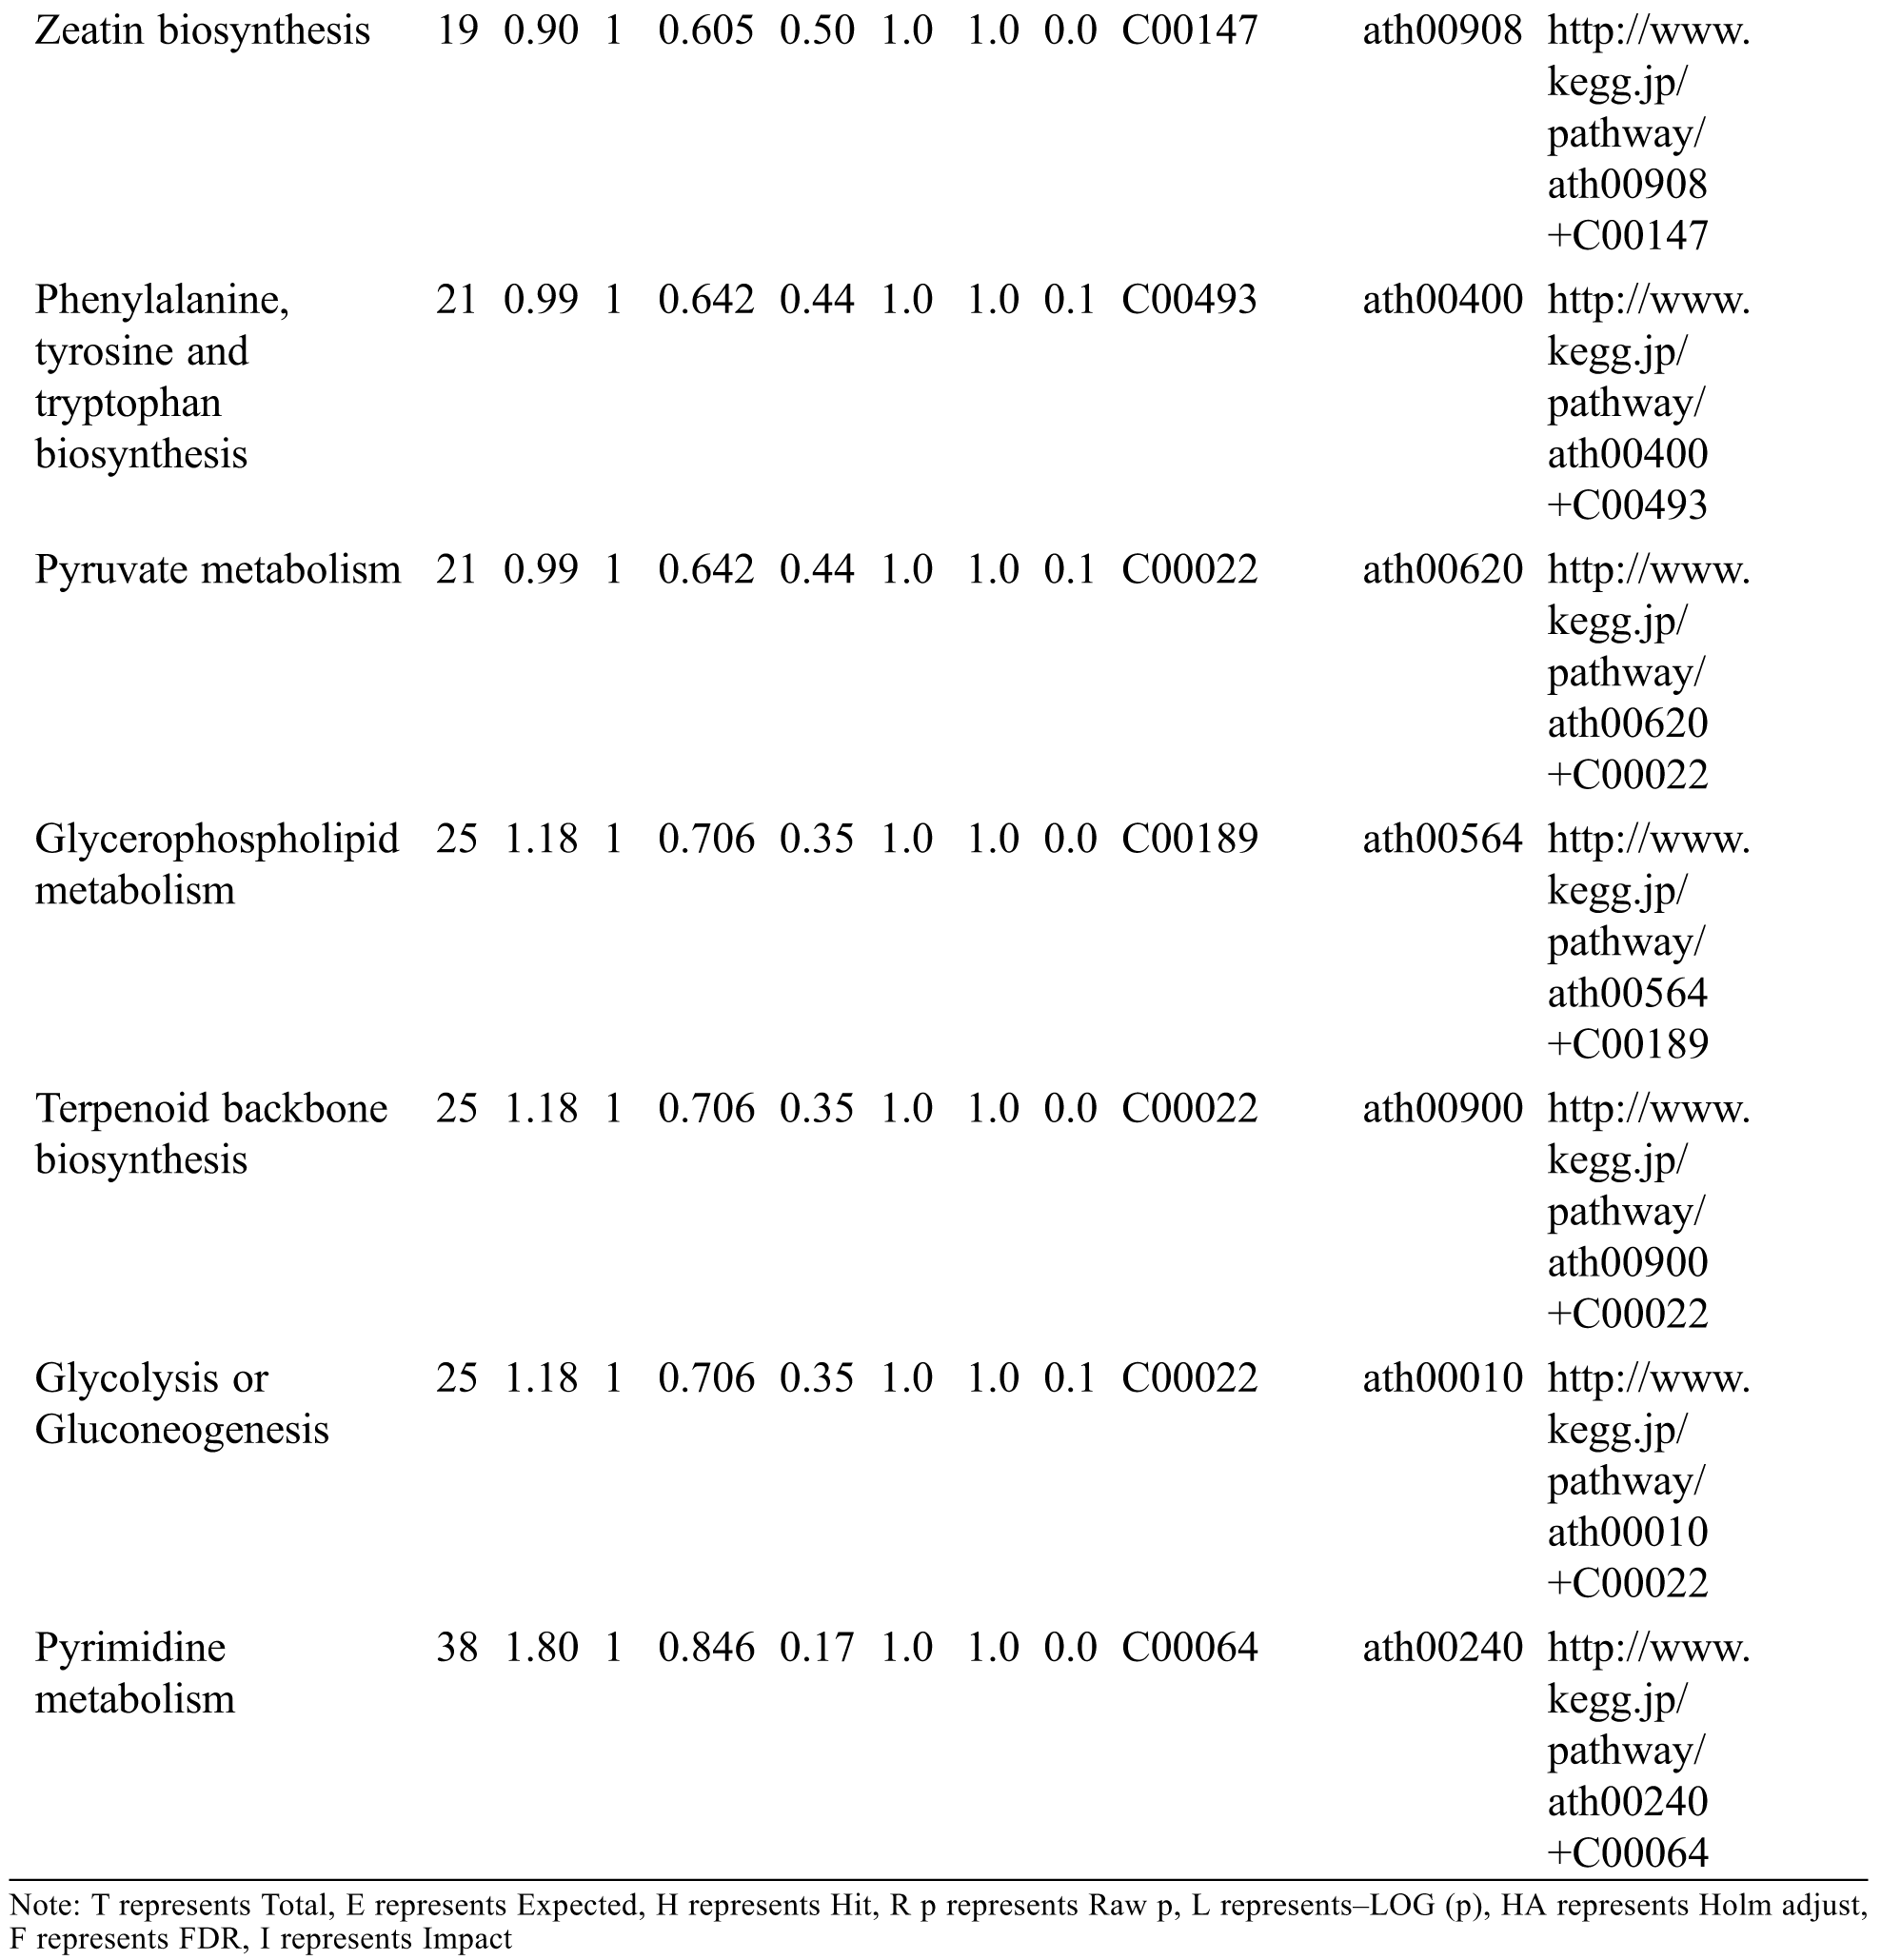
KEGG analysis indicated that the DEMs covered 41, 45 and 52 pathways or metabolisms at 10 d, 20 d and 30 d after heading, respectively (Fig. S3, Tab. S3). Among these, most DEMs involved in the pathways referring to amino acids metabolism (Tab. S3). The impact values indicated that the alanine, aspartate and glutamate metabolism at 10 d after flowering, beta-alanine metabolism at 20 d after flowering and glycine, serine and threonine metabolism at 30 d after flowering were the most diverse metabolic pathways during grain filling between RTB and CTB (Tab. S3). Protein-derived carbon is the substrate for the synthesis of most compounds. Therefore, it was conceivable that high levels of most amino acids were detected at early-GFS, but decreased to very low level at maturity (Tab. S2). Asparagine is a key nitrogen form of amino acids for long-distance transport to the seeds. It has been proposed that free asparagine levels are positive related to seed protein concentration, asparagine might act as a metabolite signal for protein accumulation in seed [16,17]. In this study, high levels of asparagine were detected at late-GFS rather than early-GFS in both CTB and RTB seeds. By contrast, the levels of glutamine were rapidly decreased at late-GFS. Meanwhile, the levels of glutamic acid were increased at late-GFS, while the levels of aspartic acid were decreased (Figs. 3A–3B). These results implied that, unlike other plants, the asparagine synthesis in Tartary buckwheat seeds was enhanced at late-GFS, which might influence seed protein accumulation.
Person correlation coefficient analysis indicated that there were 881 and 252 significant correlation coefficients (p < 0.01, r2 ≥ 0.49, FDR ≤ 0.01) in CTB and RTB, respectively. Out of these significant correlations, 639 were positive and 242 were negative in CTB, whereas 143 were positive and 242 were negative in RTB (Fig. 2E).
3.2.1 Analysis of Nutrients between CTB and RTB
For human body, there are 8 essential amino acids that cannot be synthesized by itself. Tartary buckwheat seeds contain all 8 of the essential amino acids, of which levels varied greatly during grain filling (Figs. 3A–3C). These essential amino acids belong to 3 amino acids families: Aspartic acid family, Alanine family and Aromatic amino acid family. Typically, the similar change pattern of most amino acids during grain filling was observed in the same amino acids family pathway, such as leucine and valine belong to Alanine family; threonine and isoleucine belong to Aspartic acid family (Figs. 3A–3B). But, some amino acids involved in the same metabolic pathway changed differently during grain filling (Figs. 3A–3C). It was probably because of the complicated relationship of metabolites, such as competition, promotion and suppression.
Lysine and methionine are the first and second limiting amino acids, of which levels are generally used to evaluate the nutritional value of cereals [18]. CTB shows excellent lysine proportion of protein, which is better than the mode value of WHO/FAO and egg [19]. In this study, no significantly difference was detected in the levels of lysine and methionine by one-way ANOVA between RTB and CTB at 30 d after heading (Fig. 3B), which indicated that RTB also exhibited excellent nutritional value as CTB.
3.2.2 Analysis of Sweeteners between CTB and RTB
CTB is well-known as ‘Kuqiao’ in China because of the bitter taste. In history, CTB is a staple food for only Yi people in China [20]. It is conjectured that the bitter feature limited the consumption of Tartary buckwheat. Sugars not only act as signals for metabolism in seed during grain filling, but also are crucial constituents that influence the sweet taste [21]. In this study, 9 sugars were identified, while 6 sugars including arabinose, fucose, glucose, galactose, ribose and xylose in RTB were detected to be significantly higher than CTB (Fig. 3D). Meanwhile, polyols are well-known as sugar-free sweeteners. Xylitol, mannitol and maltitol are suggested as sucrose replacers in food [22]. Compared with CTB, the levels of most polyols were found to be higher in RTB regardless of GFS (Tab. S2). Especially, the levels of xylitol, mannitol, maltitol and threitol in RTB were detected to be significantly higher at maturity (Fig. 3D). The previous work found that the level of major storage components including starches and proteins in RTB were similar to CTB [10]. Therefore, the high level of sugars and polyols might be responsible for the better taste of RTB.
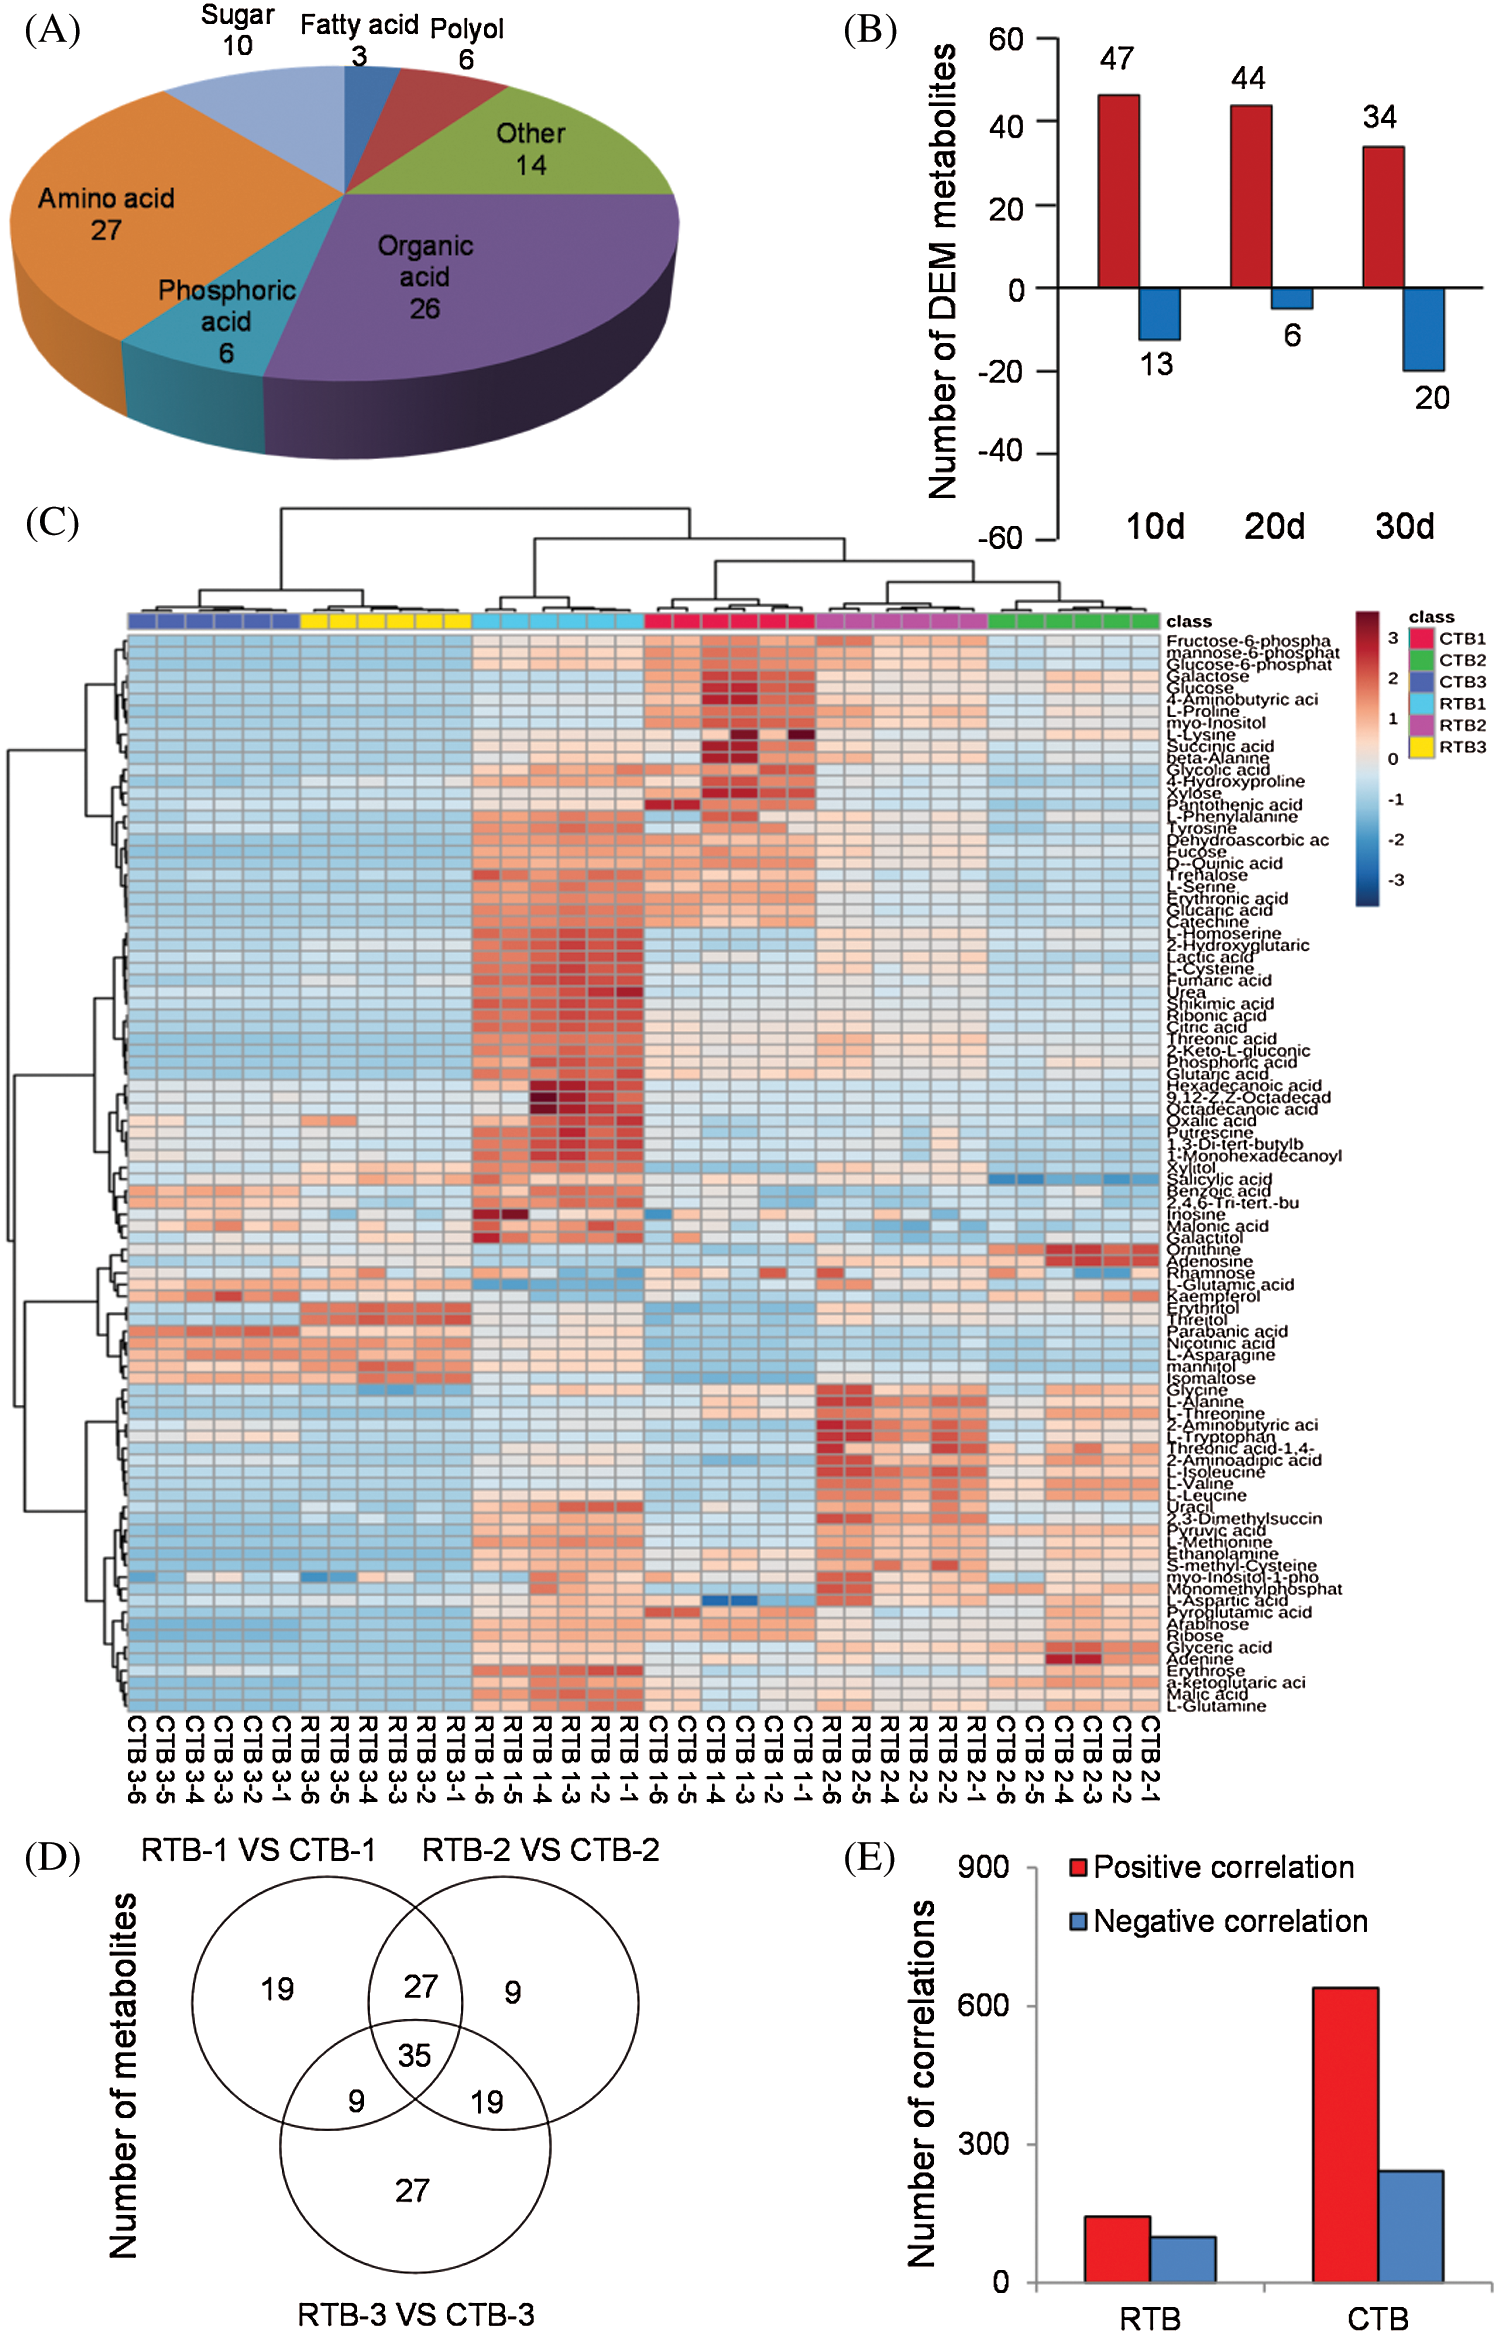
Figure 2: The groups (A), differential expressed metabolites (B), hotmap (C), common differential metabolites (D) and correlations (E) by GC-MS analysis
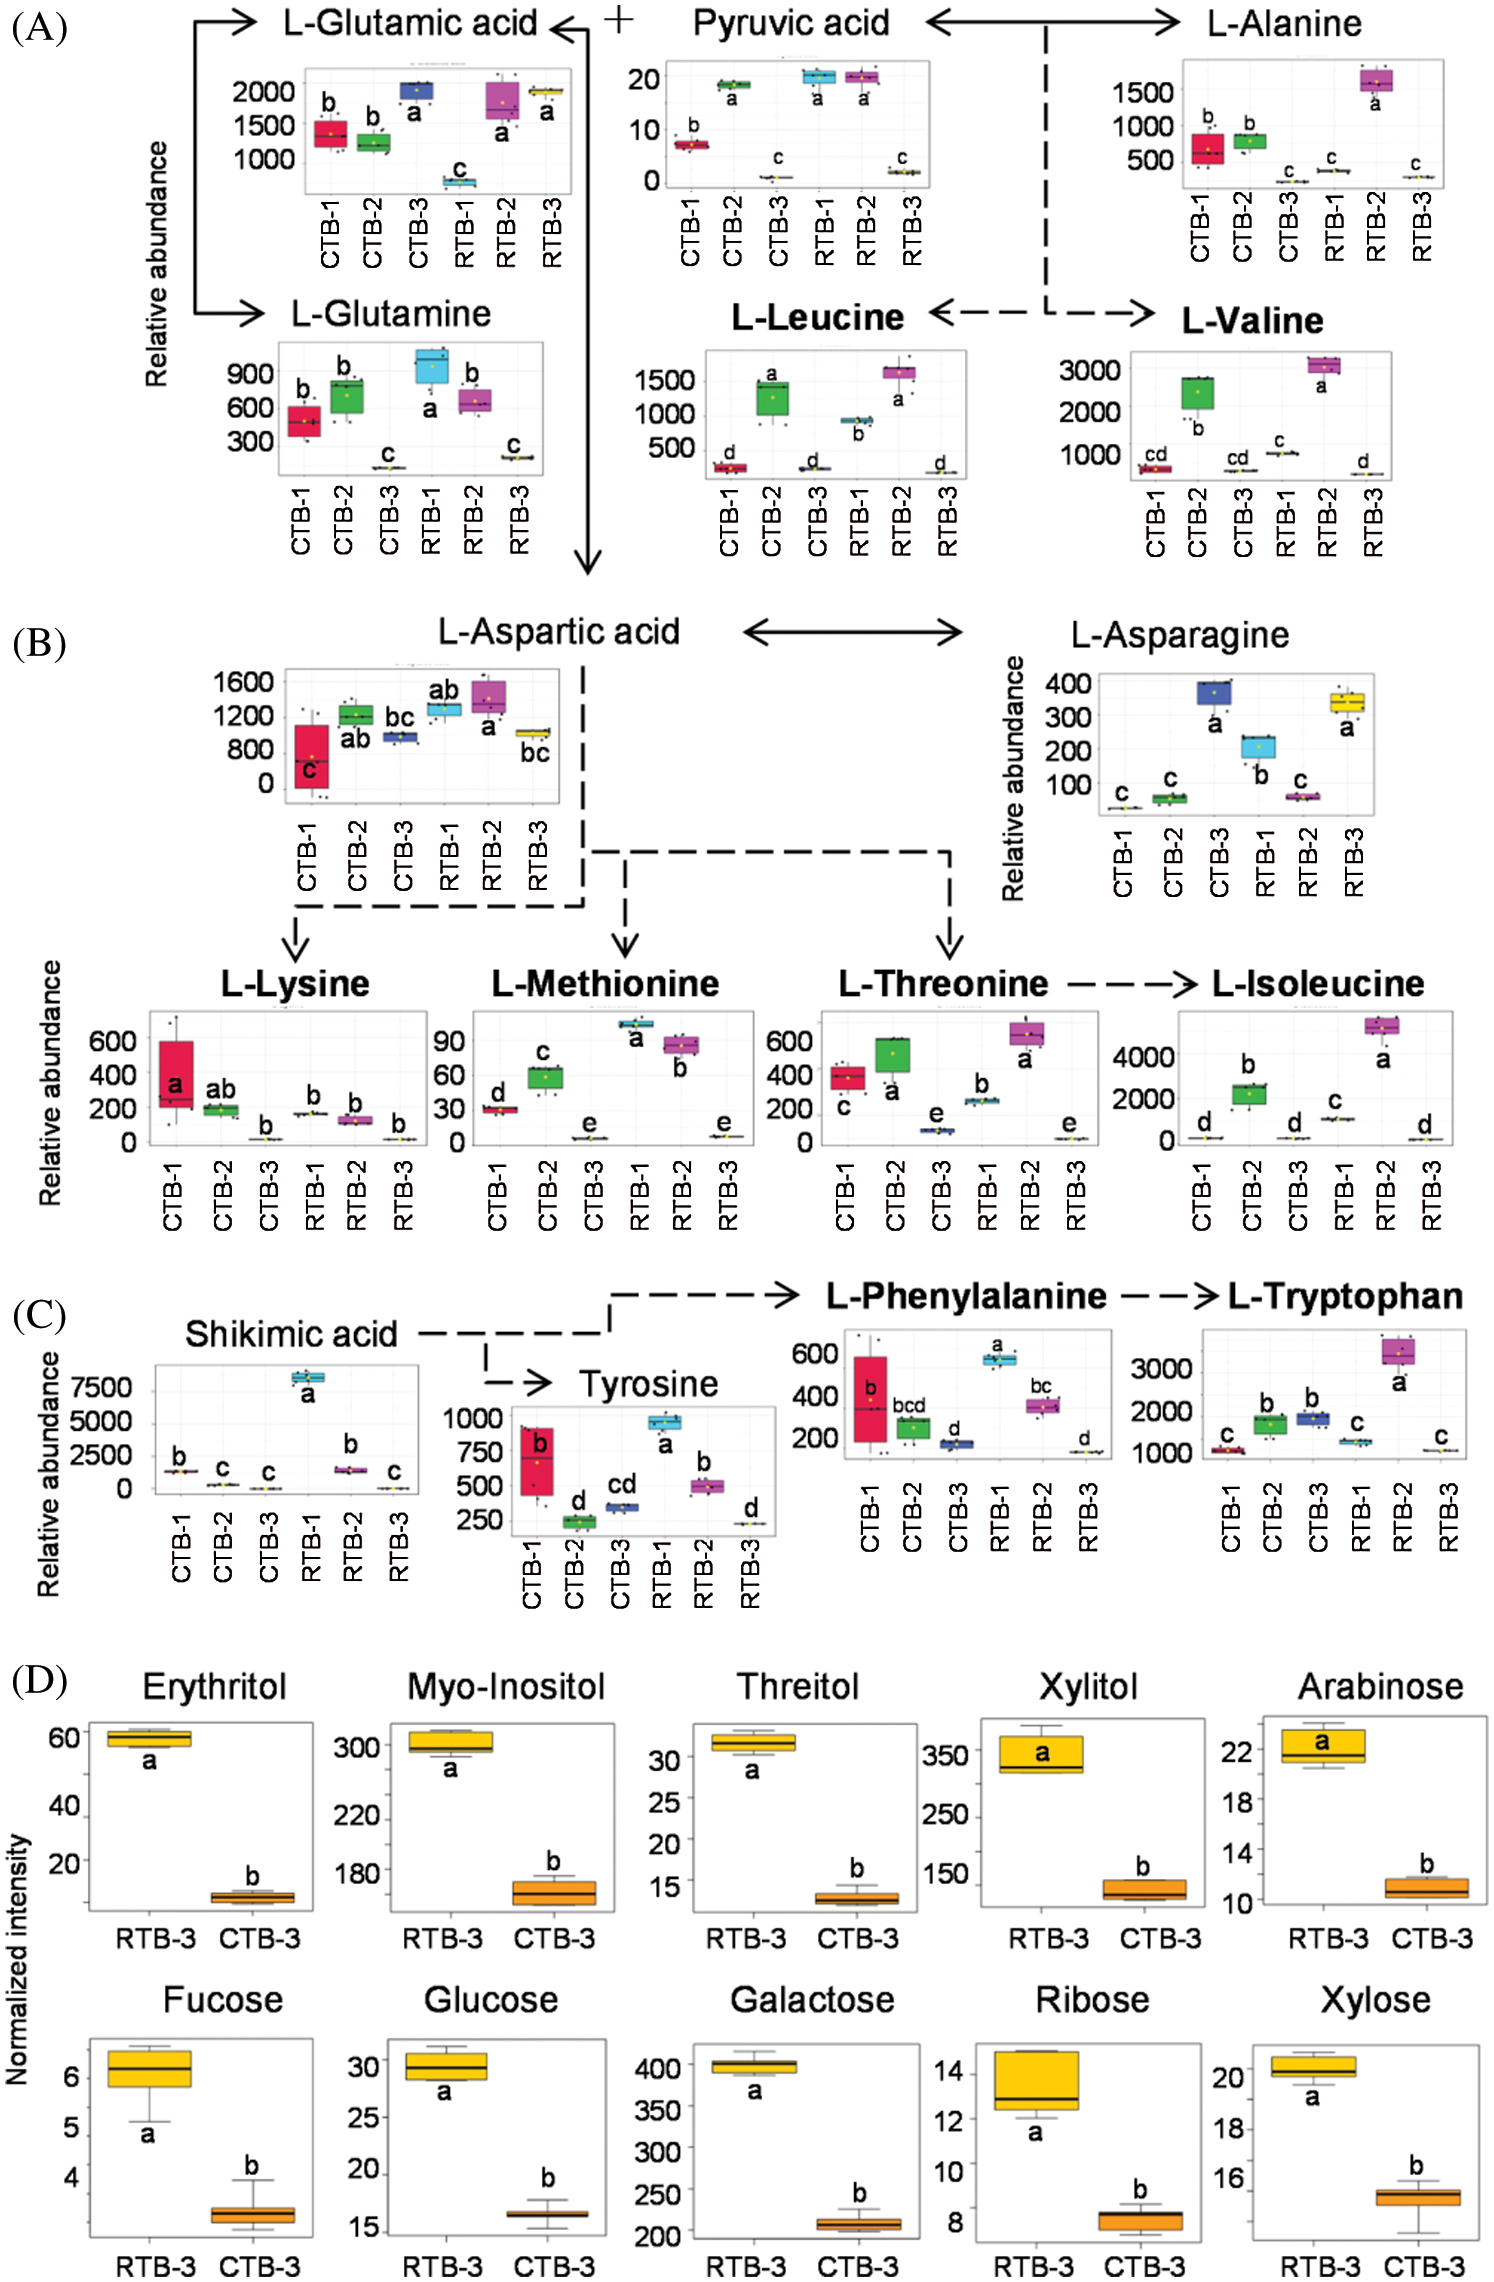
Figure 3: Boxplot-visualizations of Alanine family (A), Aspartic acid family (B) and Aromatic amino acid family (C) metabolites during grain filling and differential expressed sweeteners (D) at maturity between RTB and CTB. Note: Different letters represent a significant difference (p < 0.05) between CTB and RTB by one-way ANOVA in (A), (B) and (C) and t-test in (D), n = 6
RTB showed easily dehulled property because of the thin shell without longitudinal furrows adhering to seeds. Compared with CTB, RTB exhibited better taste quality by higher values of appearance, viscosity, taste and summary were appraised in sense organ test. In total, 92 metabolites were identified in kernels using GM-MS metabolomics platform. Among these, the significantly up-regulated levels of most sweeteners (sugars and polyols) in RTB seeds might contribute to the better taste. During grain filling, the levels of most metabolites changed greatly in both RTB and CTB seeds. ANOVA analysis identified 61 DEMs between RTB and CTB, while Venn diagram analysis screened 35 common differential metabolites. KEGG found that most DEMs involved in the pathways referring to amino acids metabolism. Unlike other plant, Tartary buckwheat exhibited unique protein-derived carbon change pattern, which might influence seed protein accumulation. This work provides the first comprehensive metabolomics analysis of kernels between RTB and CTB, which may potentially provide theoretical basis for further research.
Acknowledgement: We thank the panelists for sense organ test.
Author Contribution: YW and CL proposed the original idea. YW provided the experiment methods and supervised the experiment data collection. TS provided the materials. CW, WY, KL and QC participated in the fieldwork and the evaluation of the phenotype. DX performed sense organ test. CL and CW performed data analysis and drafted the manuscript. YW revised the manuscript. All authors have read and approved the final version of manuscript.
Funding Statement: This research was funded in part by the National Natural Science Foundation of China (Grant Nos. 31660366, 31660424), Natural Science Foundation of Guizhou Province (QKH ZC[2019]2298, QKH CG[2019]4336), the construction of the Key Laboratory for Conservation and Innovation of Buckwheat Germplasm in Guizhou (QJH KY Zi [2017]002) and Doctor Research Fund in Guizhou Normal University.
Conflicts of Interest: The authors declare that they have no conflicts of interest to report regarding the present study.
1. Hunt, H. V., Shang, X., Jones, M. K. (2017). Buckwheat: a crop from outside the major Chinese domestication centres? A review of the archaeobotanical, palynological and genetic evidence. Vegetation History and Archaeobotany, 46(Suppl 1), 448. DOI 10.1007/s00334-017-0649-4. [Google Scholar] [CrossRef]
2. Weisskopf, A., Fuller, D. Q. (2014). Buckwheat: Origins and Development. Encyclopedia of global archaeology, pp. 1025–1028, Berlin, Germany: Springer. [Google Scholar]
3. Hu, Y., Hou, Z., Yi, R., Wang, Z., Sun, P. et al. (2017). Tartary buckwheat flavonoids ameliorate high fructose-induced insulin resistance and oxidative stress associated with the insulin signaling and Nrf2/HO-1 pathways in mice. Food & Function, 8, 10–1039. [Google Scholar]
4. Ren, G., Hu, Y., Zhang, J., Zou, L., Zhao, G. (2018). Determination of multi-class mycotoxins in Tartary Buckwheat by ultra-fast liquid chromatography coupled with triple quadrupole mass spectrometry. Toxins, 10(1), 28. [Google Scholar]
5. Zhu, F. (2016). Chemical composition and health effects of Tartary buckwheat. Food Chemistry, 203, 231–245. DOI 10.1016/j.foodchem.2016.02.050. [Google Scholar] [CrossRef]
6. Ahmed, A., Khalid, N., Ahmad, A., Abbasi, N. A., Latif, M. et al. (2014). Phytochemicals and biofunctional properties of buckwheat: A review. Journal of Agricultural Science and Technology, 152(3), 349–369. DOI 10.1017/S0021859613000166. [Google Scholar] [CrossRef]
7. Zhu, X., Fan, W., Li, Z., Guo, W. (2017). Test and development of an non-thermal tartary buckwheat huller. Journal of China Agricultural University, 22, 146–155. [Google Scholar]
8. Song, C., Ma, C., Xiang, D. (2019). Variations in accumulation of lignin and cellulose and metabolic changes in seed hull provide insight into dehulling characteristic of Tartary buckwheat seeds. International Journal of Molecular Sciences, 20(3), 524. DOI 10.3390/ijms20030524. [Google Scholar] [CrossRef]
9. Wang, Y., Campbell, C. G. (2007). Tartary buckwheat breeding (Fagopyrum tataricum L. Gaertn.) through hybridization with its Rice-Tartary type. Euphytica, 156(3), 399–405. DOI 10.1007/s10681-007-9389-3. [Google Scholar] [CrossRef]
10. Liao, K., Wang, Y., Yu, W., Wei, C., Liang, C. (2020). Characteristics of starch synthesis, yield and quality provide insights into rice-Tartary Buckwheat utilization and improvement. Agricultural Biotechnology, 2(9), 31–34 38. [Google Scholar]
11. Hong, J., Yang, L., Zhang, D., Shi, J. (2016). Plant metabolomics: an indispensable system biology tool for plant science. International Journal of Molecular Sciences, 17(6), 767. DOI 10.3390/ijms17060767. [Google Scholar] [CrossRef]
12. Zhao, J., Kusutani, A., Cui, J., Chen, X., Liu, J. et al. (2003). Sense organ test method of palatability characteristics on Japonica varieties. Tianjin Agricultral Sciences, 1(9), 12–14. [Google Scholar]
13. Lisec, J., Schauer, N., Kopka, J., Willmitzer, L., Fernie, A. R. (2006). Gas chromatography mass spectrometry–based metabolite profiling in plants. Nature Protocols, 1(1), 387–396. DOI 10.1038/nprot.2006.59. [Google Scholar] [CrossRef]
14. Sangster, T., Major, H., Plumb, R., Wilson, A. J., Wilson, I. D. (2006). A pragmatic and readily implemented quality control strategy for HPLC-MS and GC-MS-based metabonomic analysis. Analyst, 131(10), 1075–1078. DOI 10.1039/b604498k. [Google Scholar] [CrossRef]
15. Thévenot, E. A., Roux, A., Xu, Y., Ezan, E., Junot, C. (2015). Analysis of the human adult urinary metabolome variations with age, body mass index, and gender by implementing a comprehensive workflow for univariate and OPLS statistical analyses. Journal of Proteome Research, 14(8), 3322–3335. DOI 10.1021/acs.jproteome.5b00354. [Google Scholar] [CrossRef]
16. Pandurangan, S., Pajak, A., Molnar, S. J., Cober, E. R., Dhaubhadel, S. et al. (2012). Relationship between asparagine metabolism and protein concentration in soybean seed. Journal of Experimental Botany, 63(8), 3173–3184. DOI 10.1093/jxb/ers039. [Google Scholar] [CrossRef]
17. Rao, G., Sui, J., Zhang, J. (2016). Metabolomics reveals significant variations in metabolites and correlations regarding the maturation of walnuts (Juglans regia L.). Biology Open, 5(6), 829–836. DOI 10.1242/bio.017863. [Google Scholar] [CrossRef]
18. Kies, C., Fox, H. M. (1970). Determination of the first-limiting amino acid of wheat and triticale grain for humans. Cereal Chemistry, 47(4), 615–622. [Google Scholar]
19. Tian, X., Li, H. (2010). Nutritional evaluation of protein in Tartary Buckwheat grain and its response to selenium. Food Science, 31(7), 105–108. [Google Scholar]
20. Song, Y., Dong, Y., Wang, J., Feng, J., Long, C. (2020). Tartary buckwheat (Fagopyrum tataricum Gaertn.) landraces cultivated by Yi people in Liangshan. China Genetic Resources and Crop Evolution, 67(3), 745–761. DOI 10.1007/s10722-019-00852-z. [Google Scholar] [CrossRef]
21. Shimbata, T., Inokuma, T., Sunohara, A., Vrinten, P., Saito, M. et al. (2011). High levels of sugars and fructan in mature seed of sweet wheat lacking GBSSI and SSIIa enzymes. Journal of Agricultural and Food Chemistry, 59(9), 4794–4800. DOI 10.1021/jf200468c. [Google Scholar] [CrossRef]
22. Sahin, A. W., Axel, C., Zannini, E., Arendt, E. K. (2018). Xylitol, mannitol and maltitol as potential sucrose replacers in burger buns. Food & Function, 9(4), 2201–2212. DOI 10.1039/C8FO00066b. [Google Scholar] [CrossRef]
Appendix
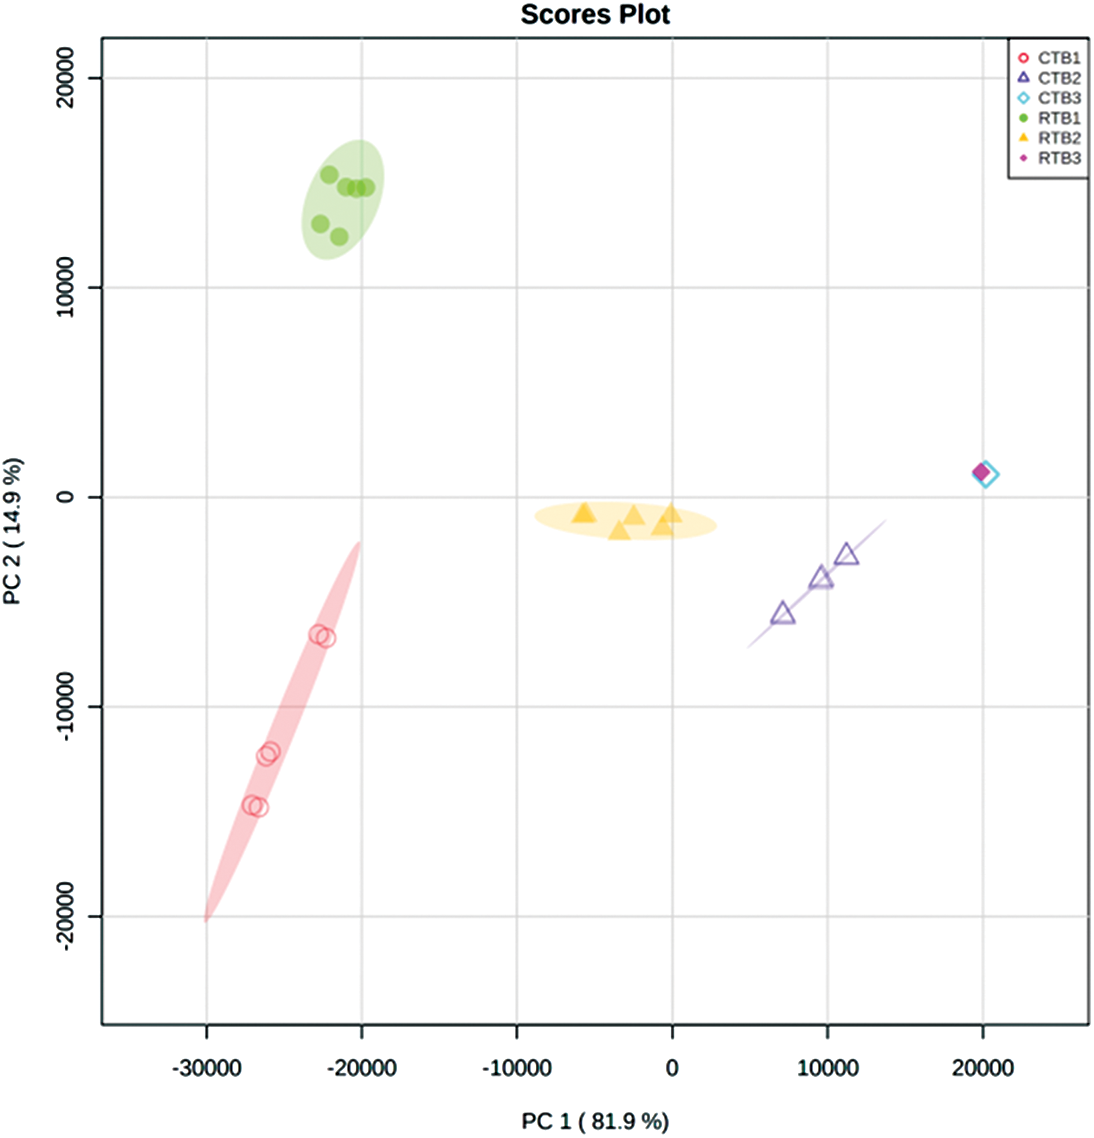
Figure S1: The PCA of metabolites in RTB and CTB during grain filling
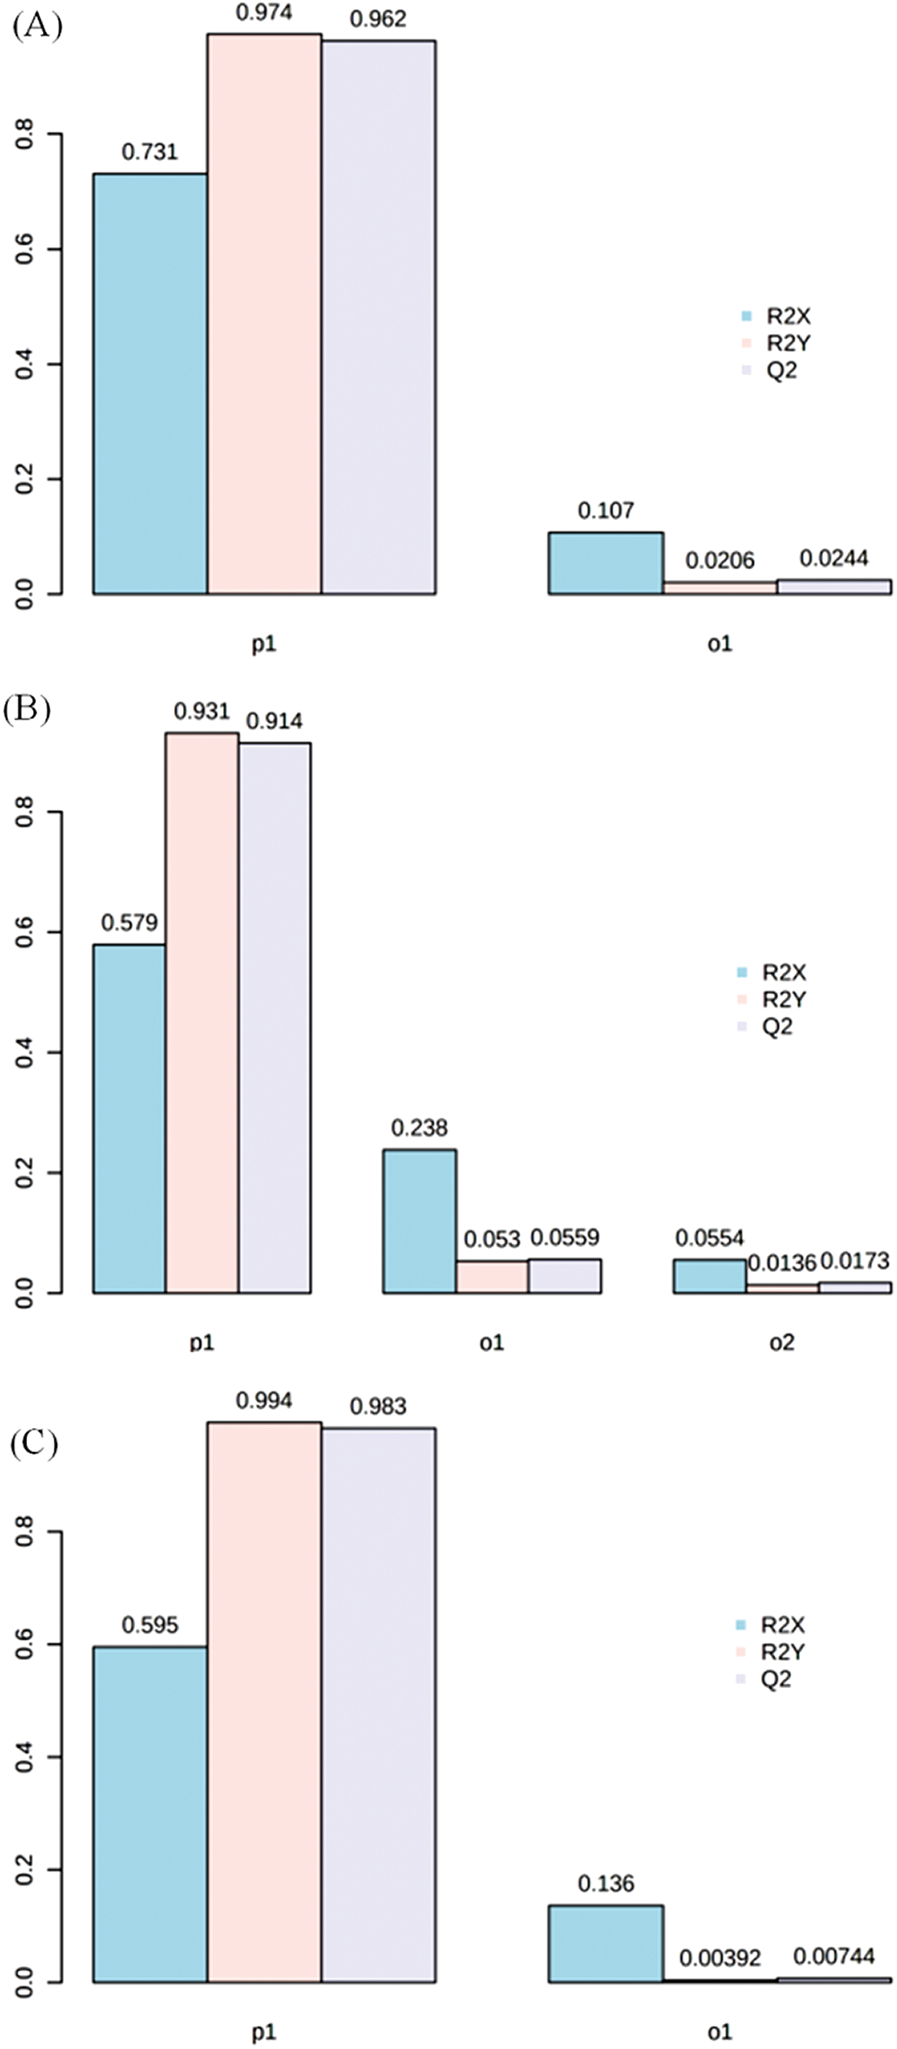
Figure S2: The value of R2X, R2Y and Q2 in groups of RTB1 vs. CTB1 (A), RTB2 vs. CTB2 (B) and RTB2 vs. CTB2 (C) by OPLS-DA
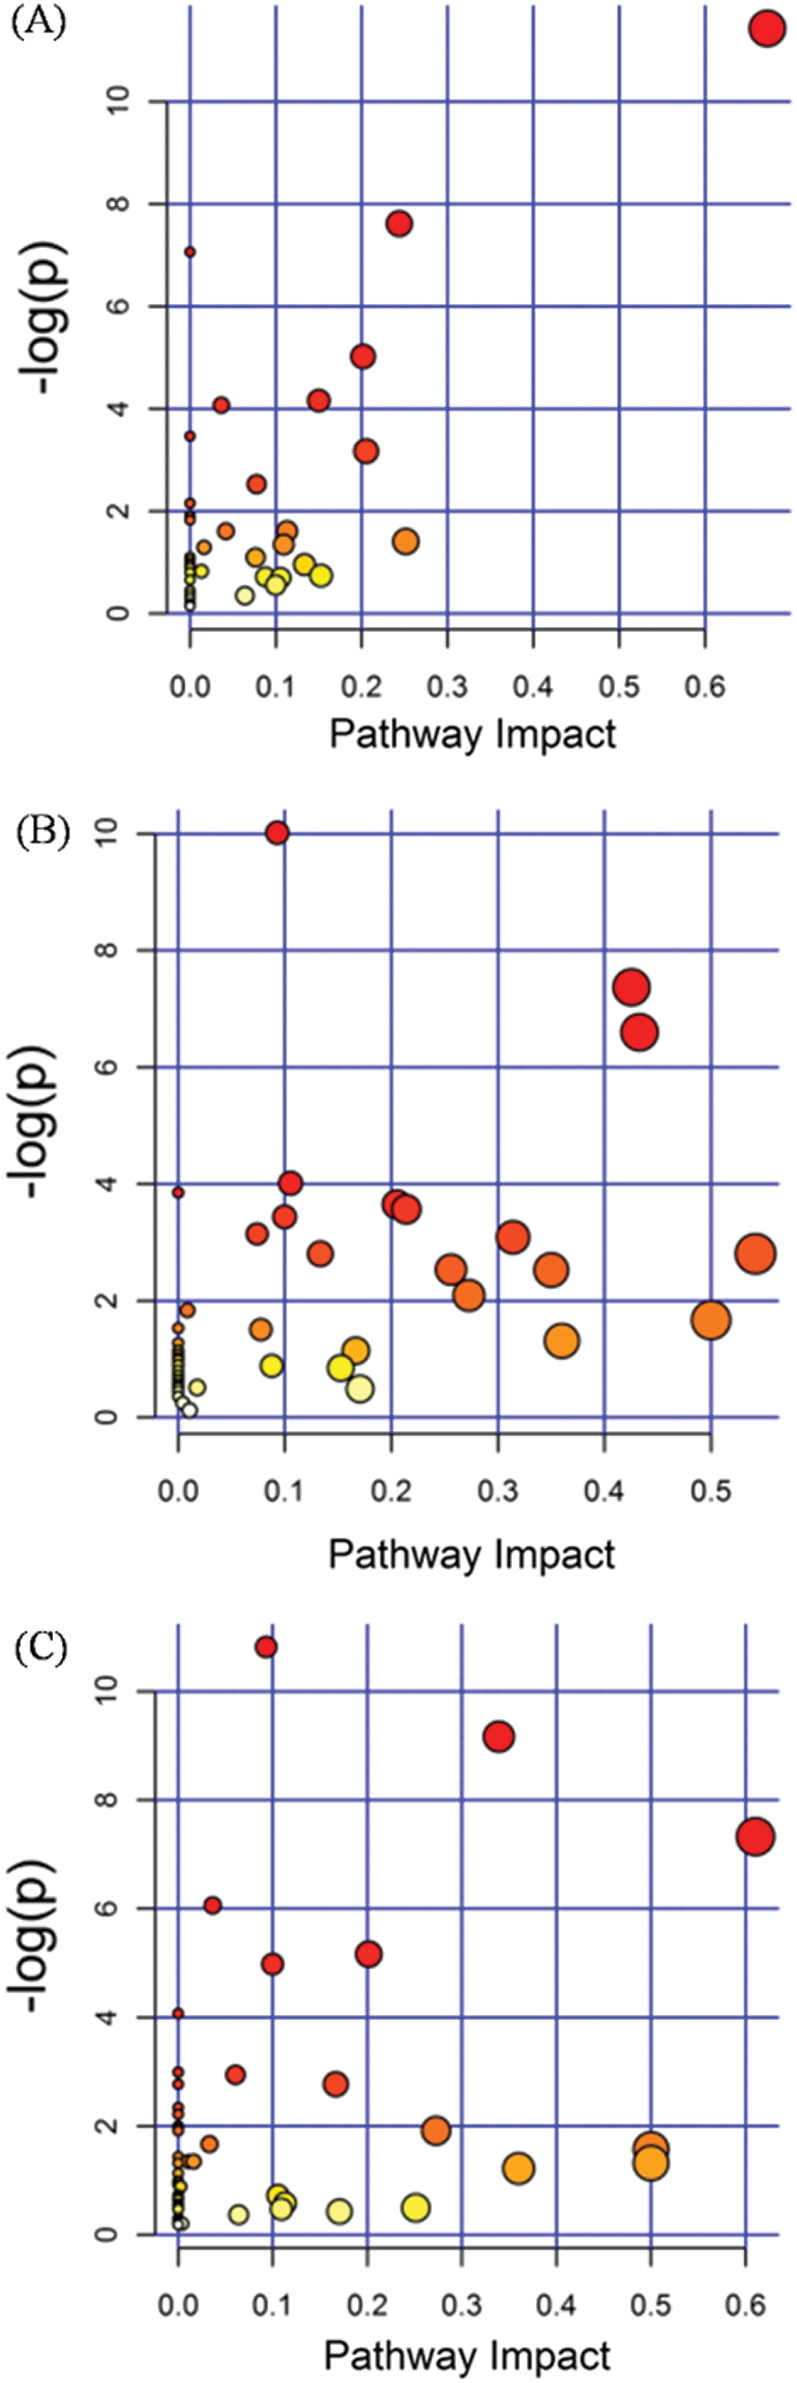
Figure S3: The analysis of KEGG in groups of RTB1 vs. CTB1 (A), RTB2 vs. CTB2 (B) and RTB2 vs. CTB2 (C) by OPLS-DA
Table S1: The taste quality analysis of kernel
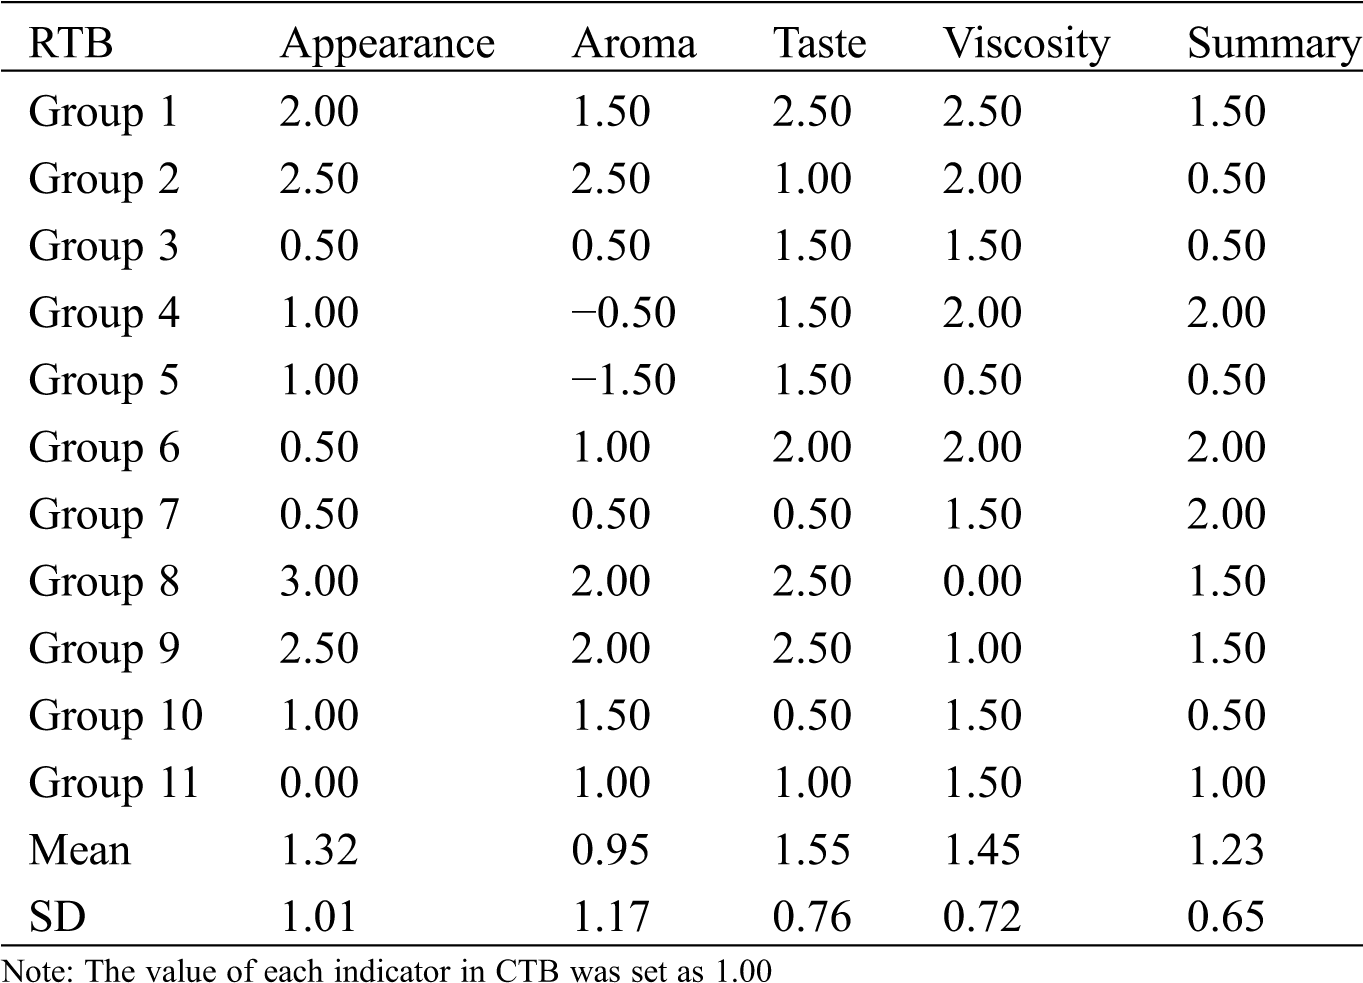
Table S2: The differential expressed metabolites (DEMs)
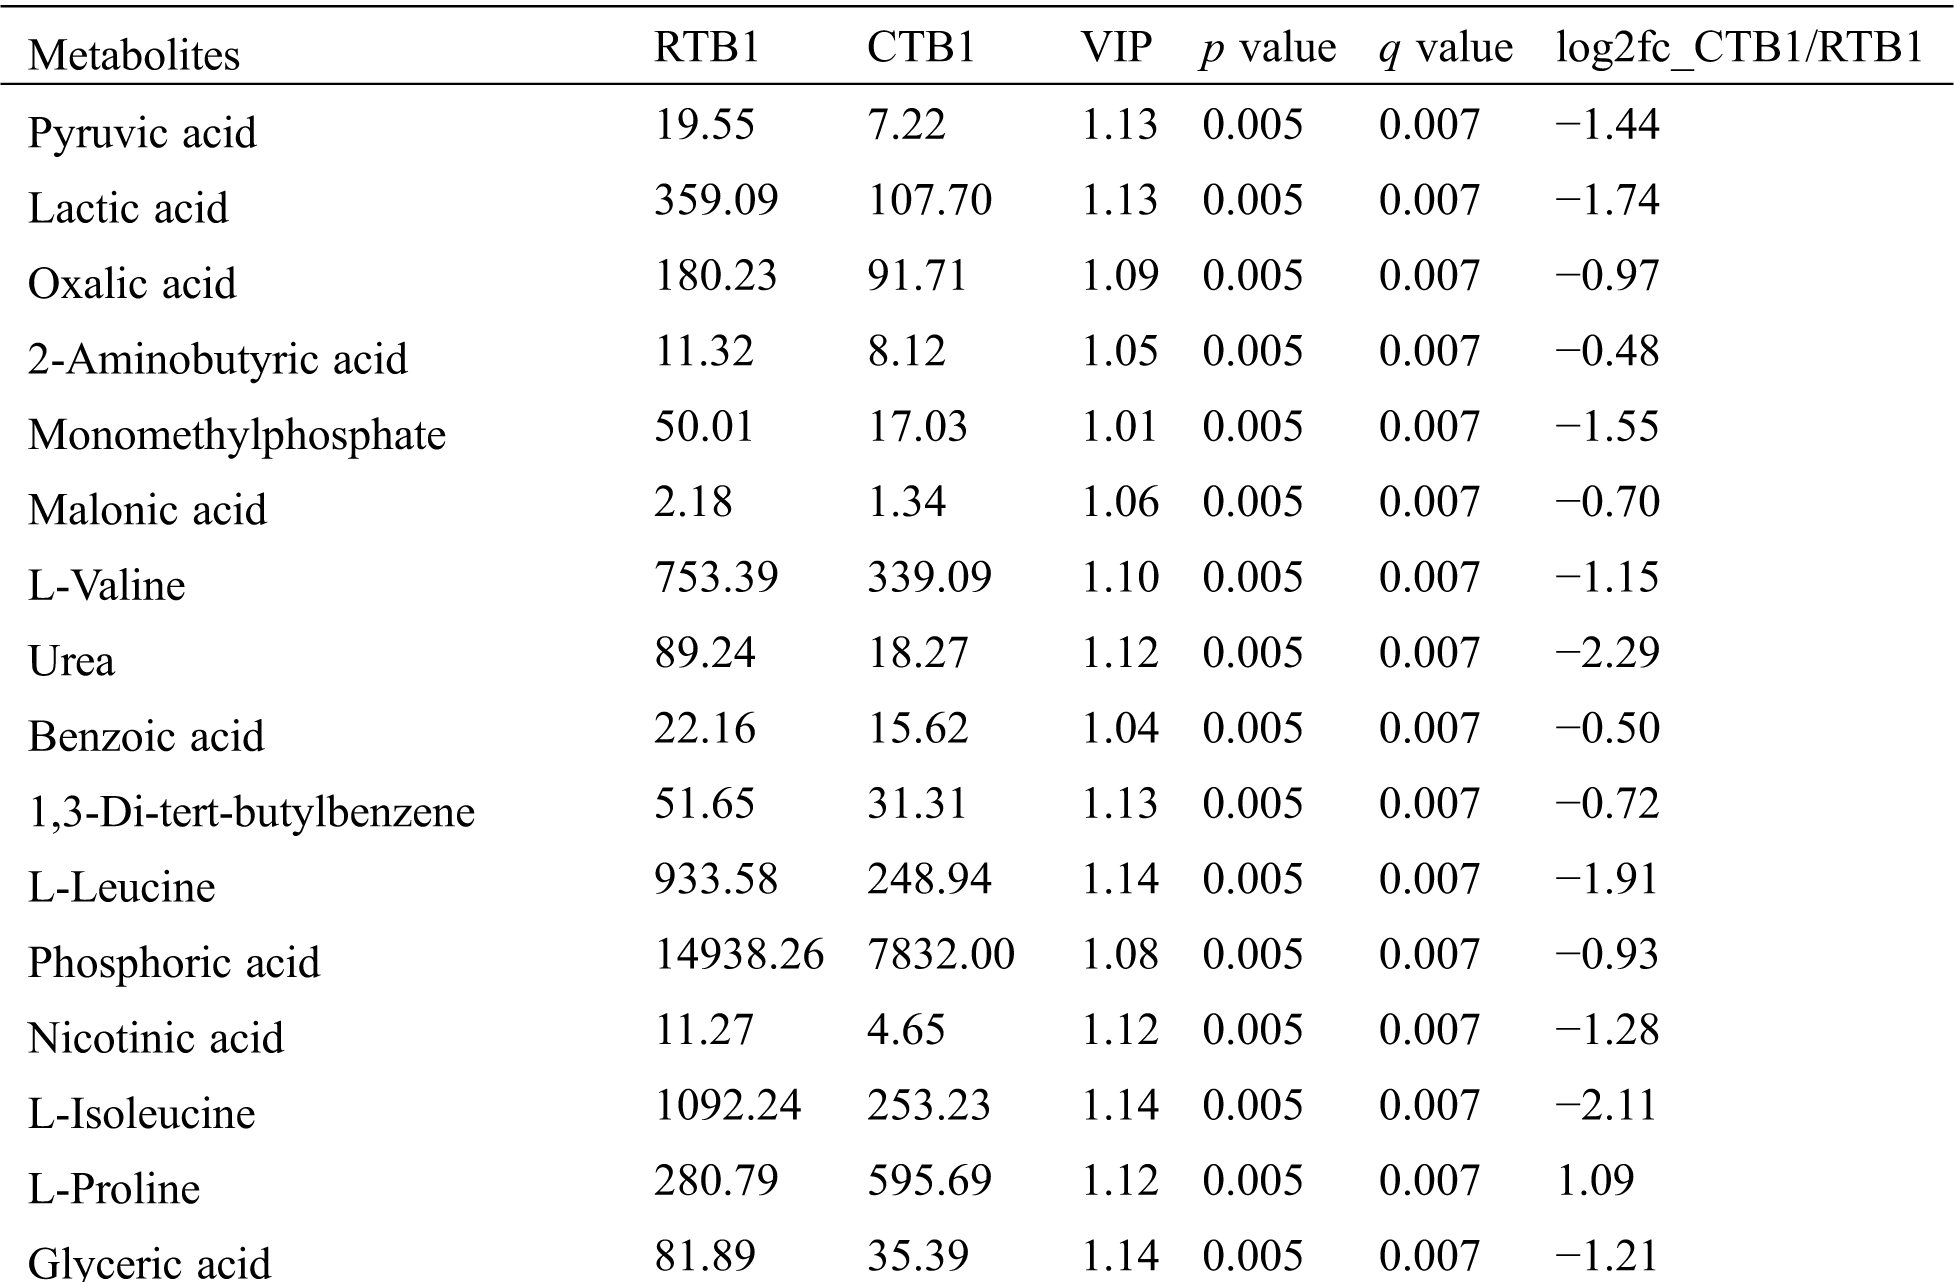
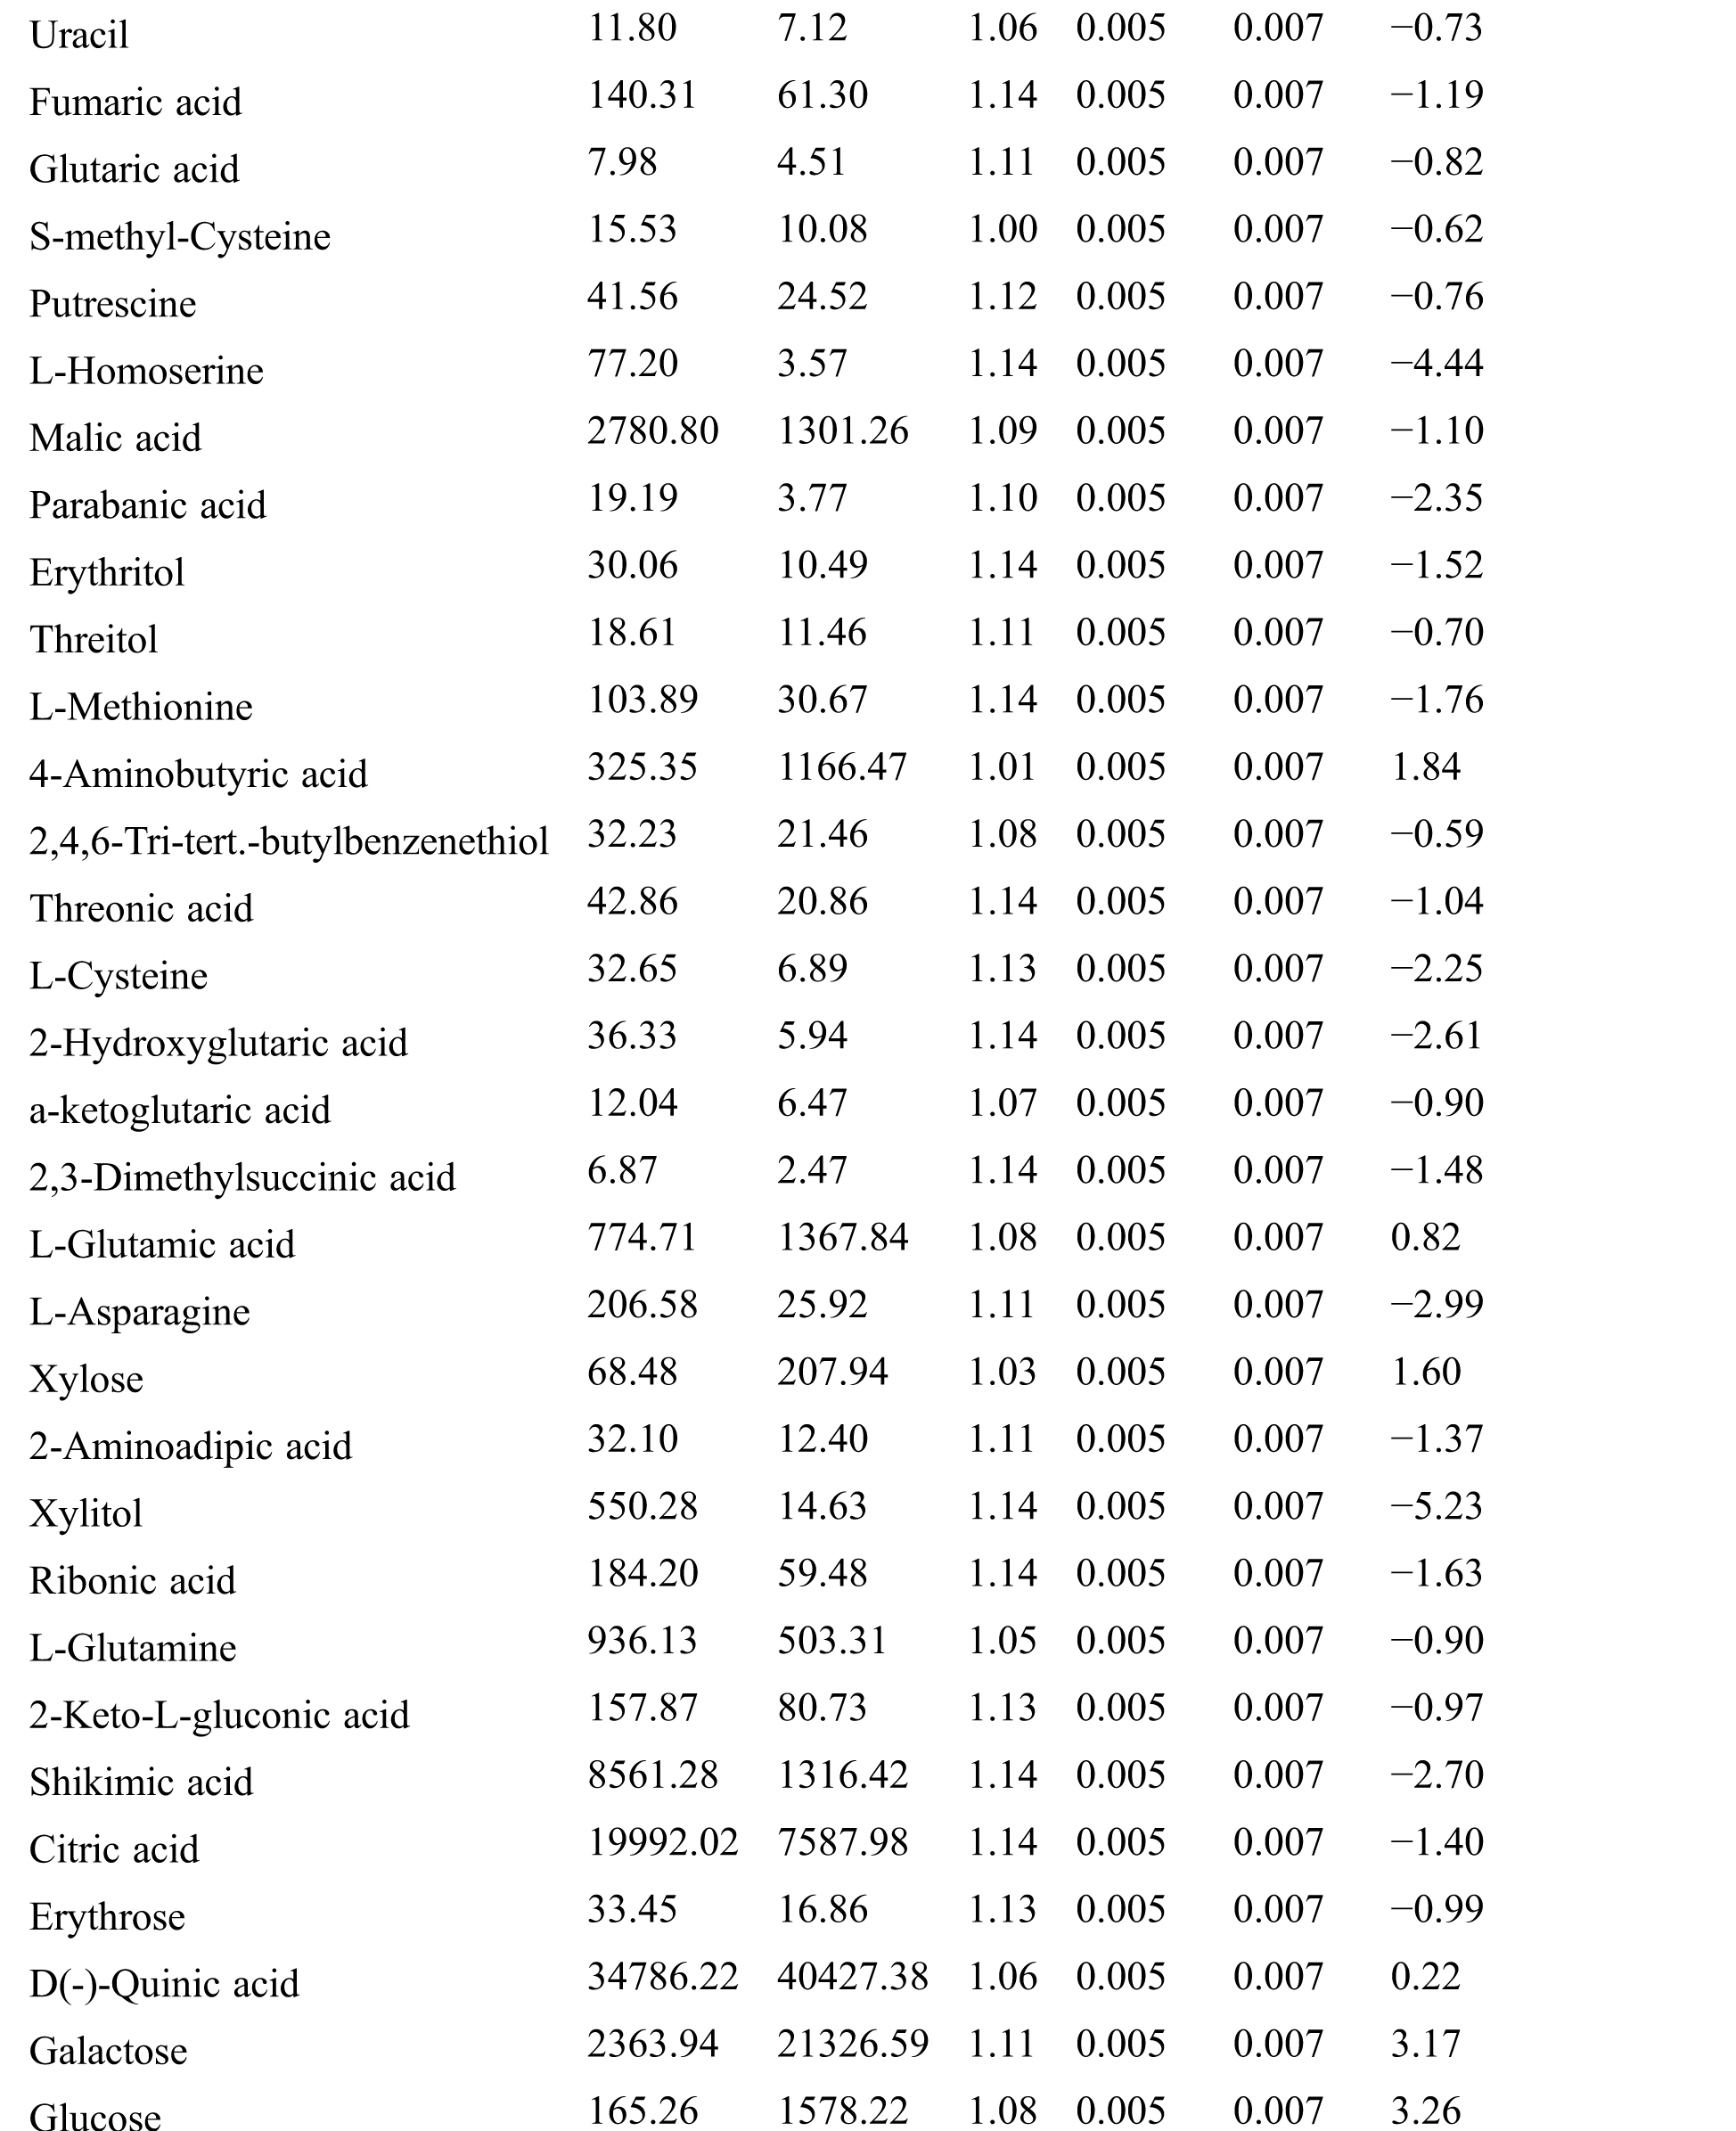
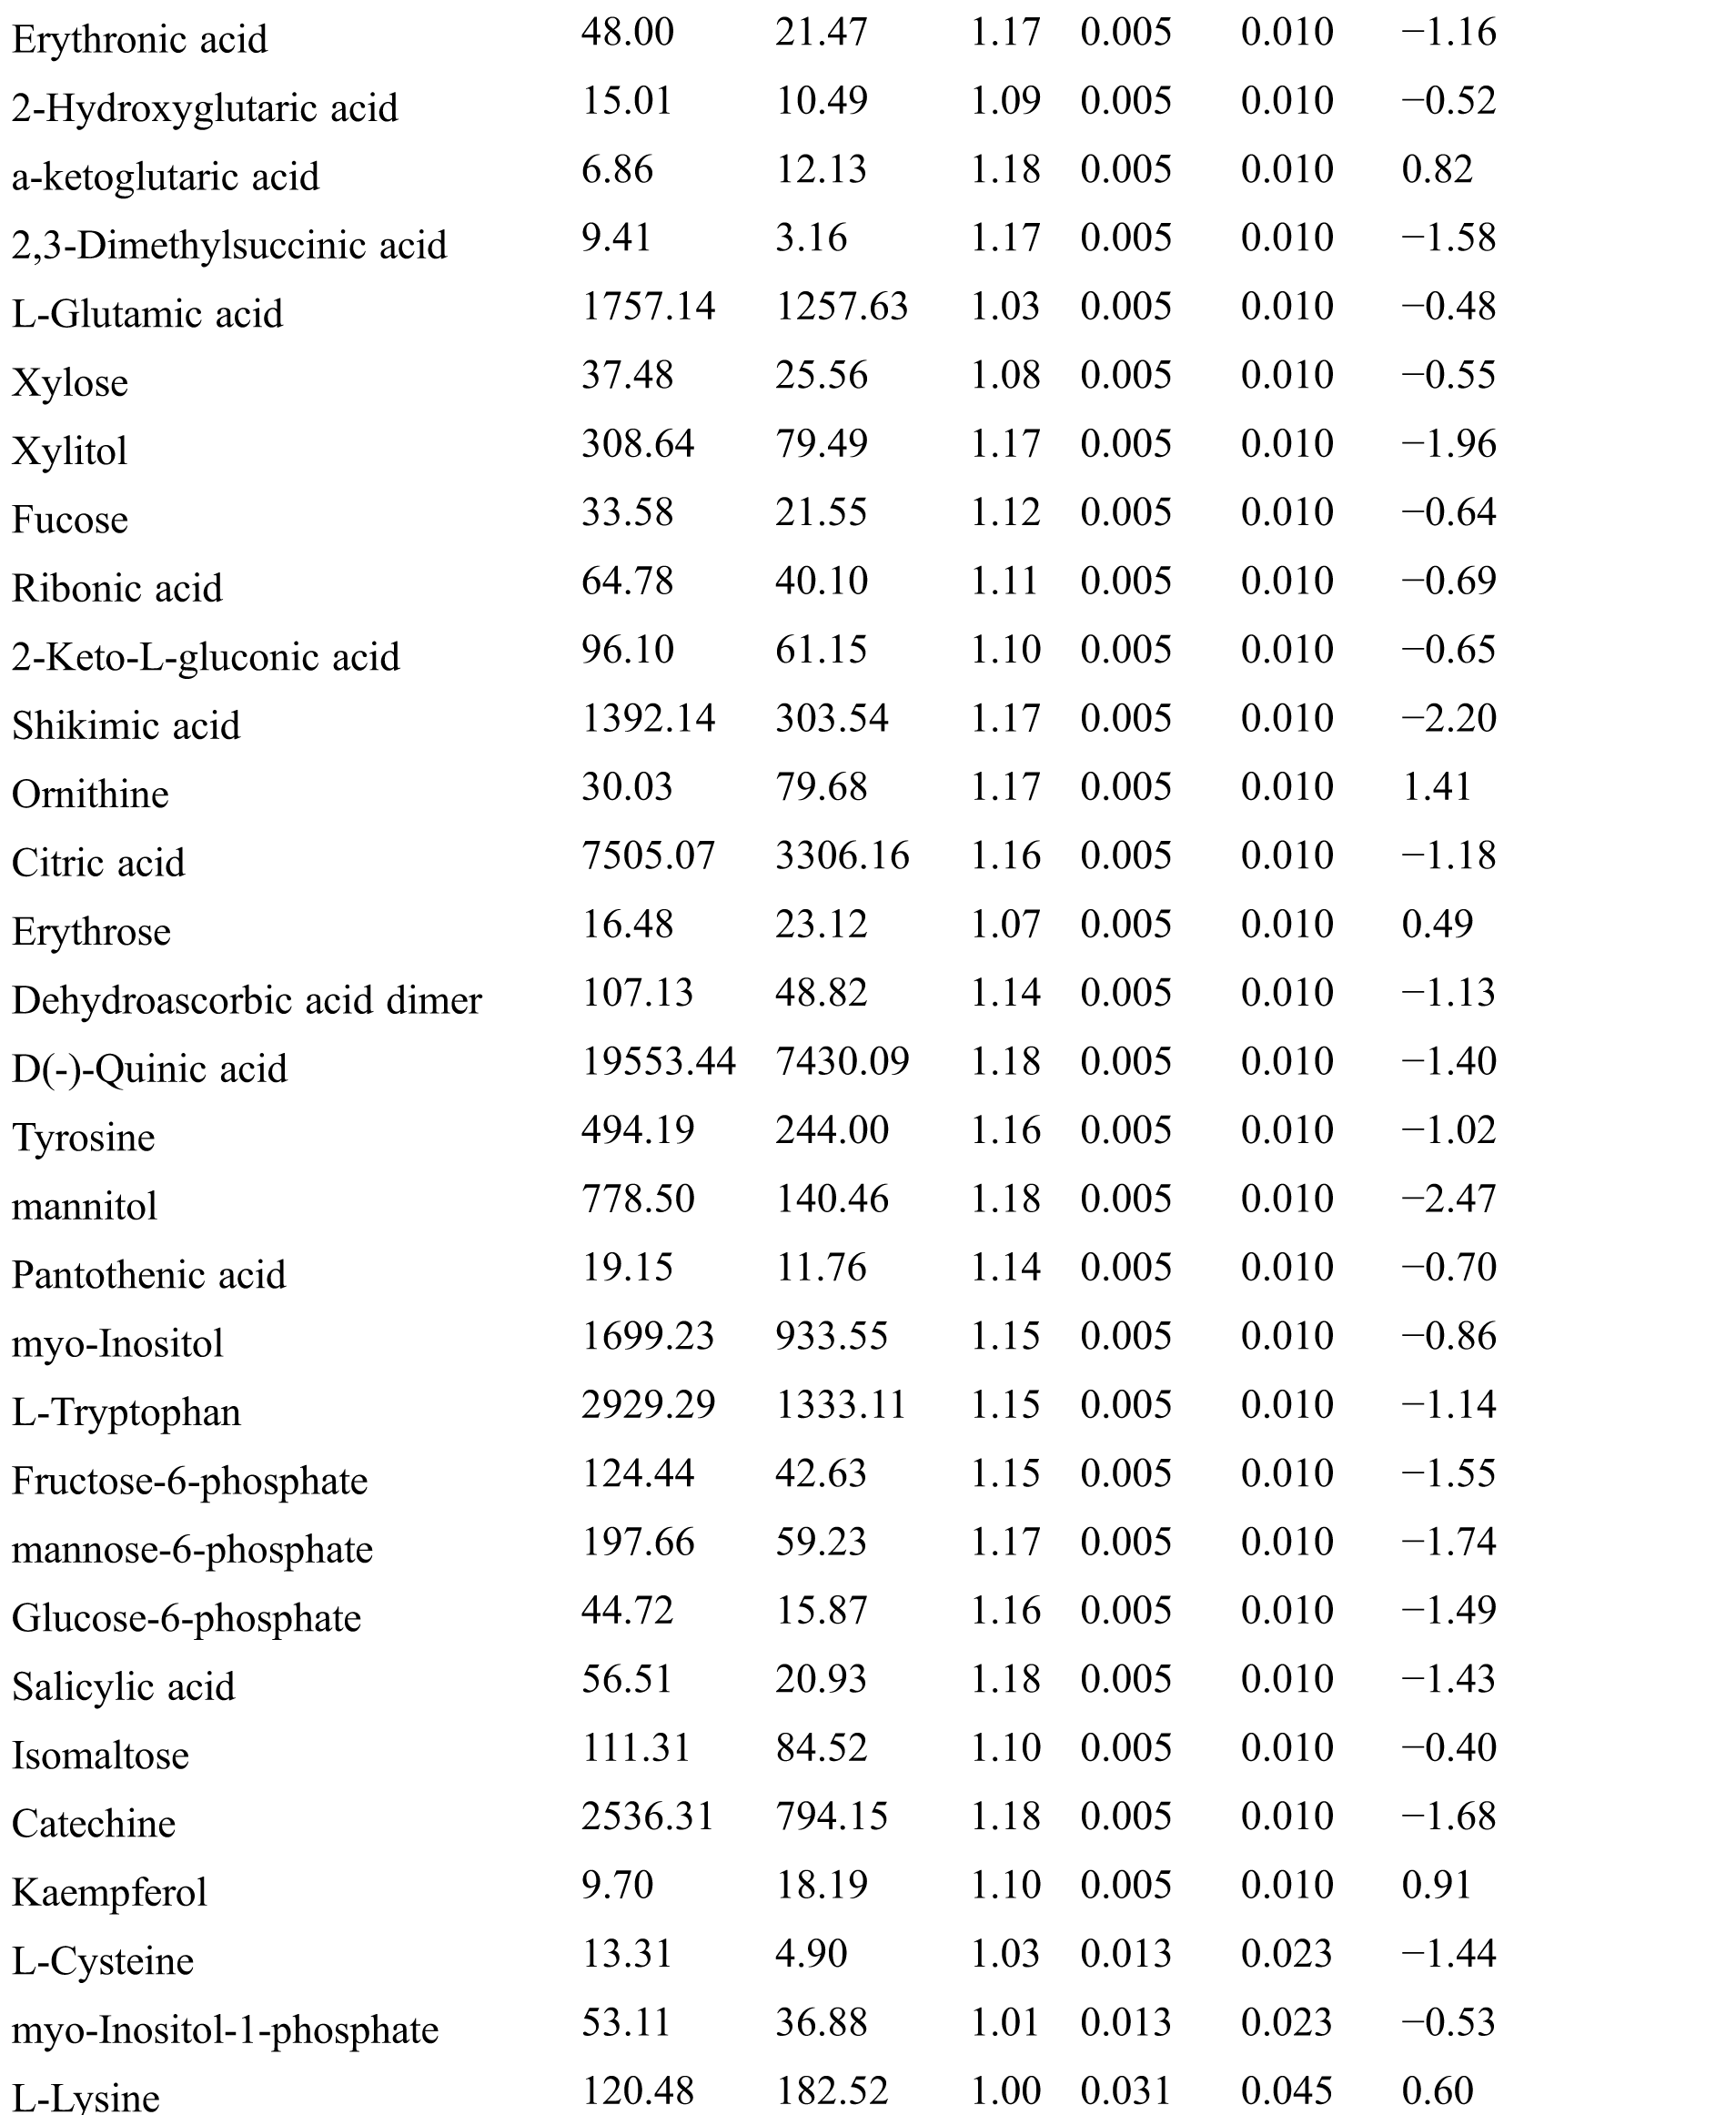
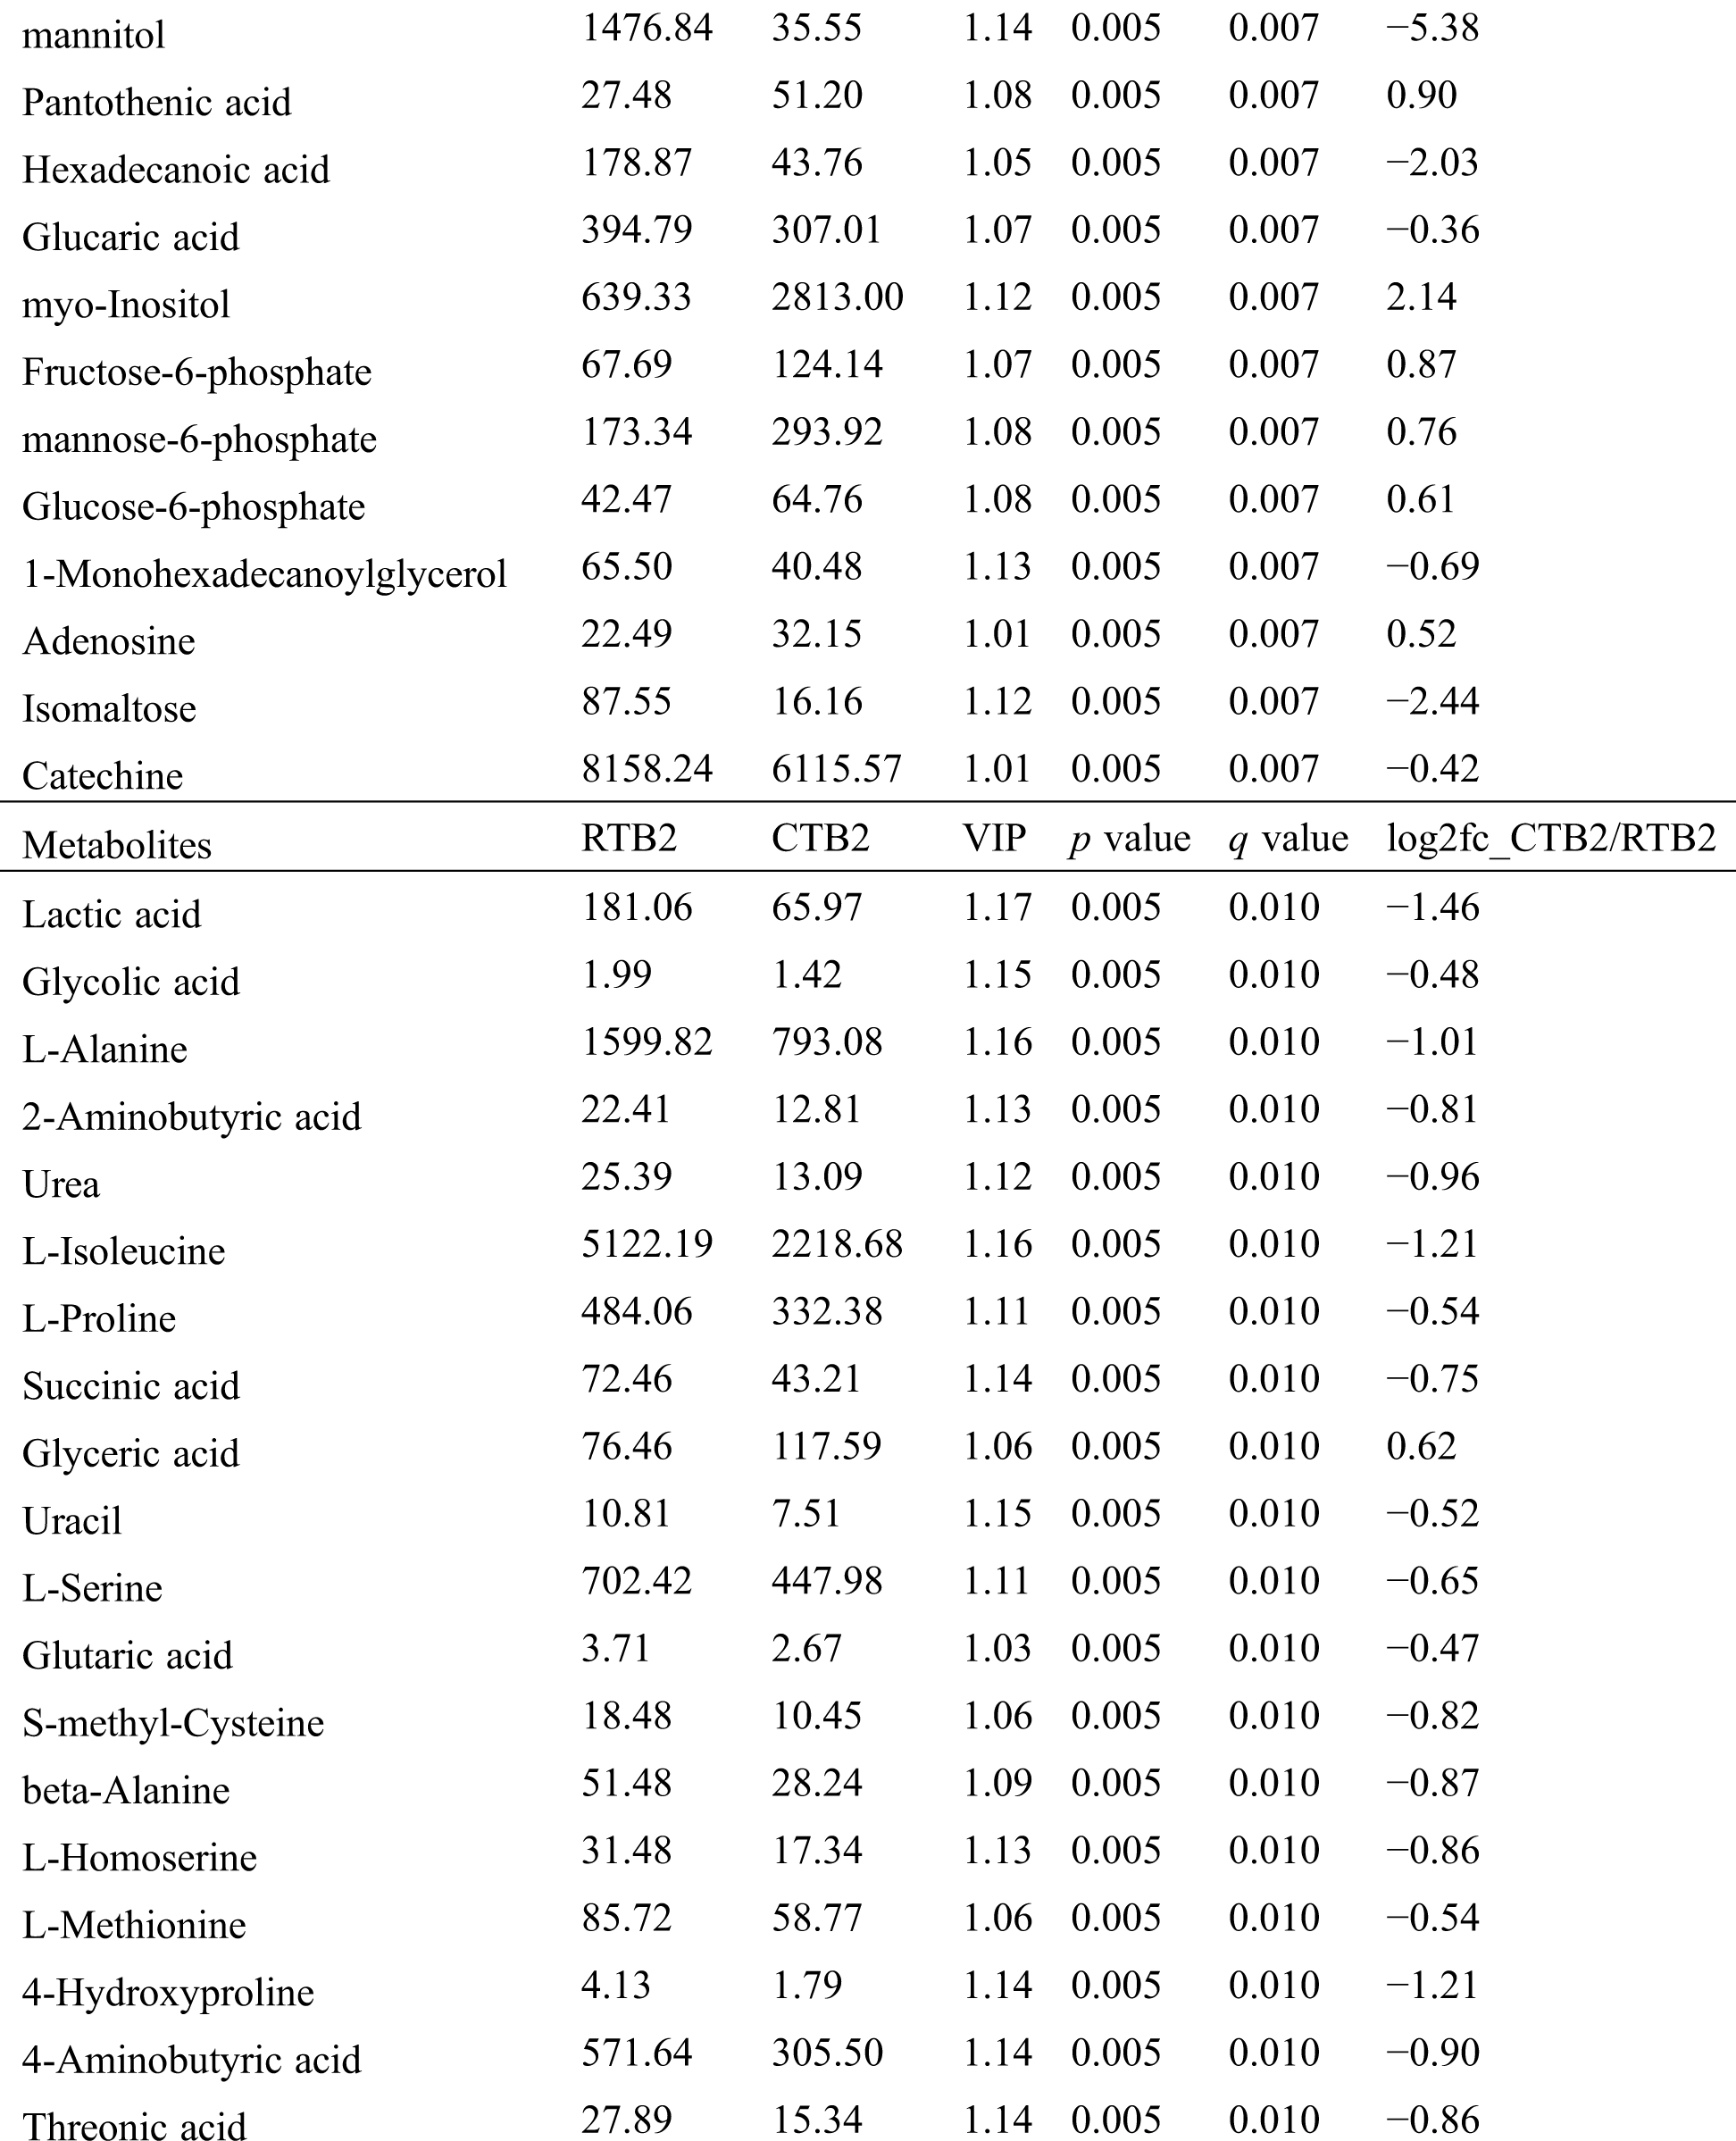
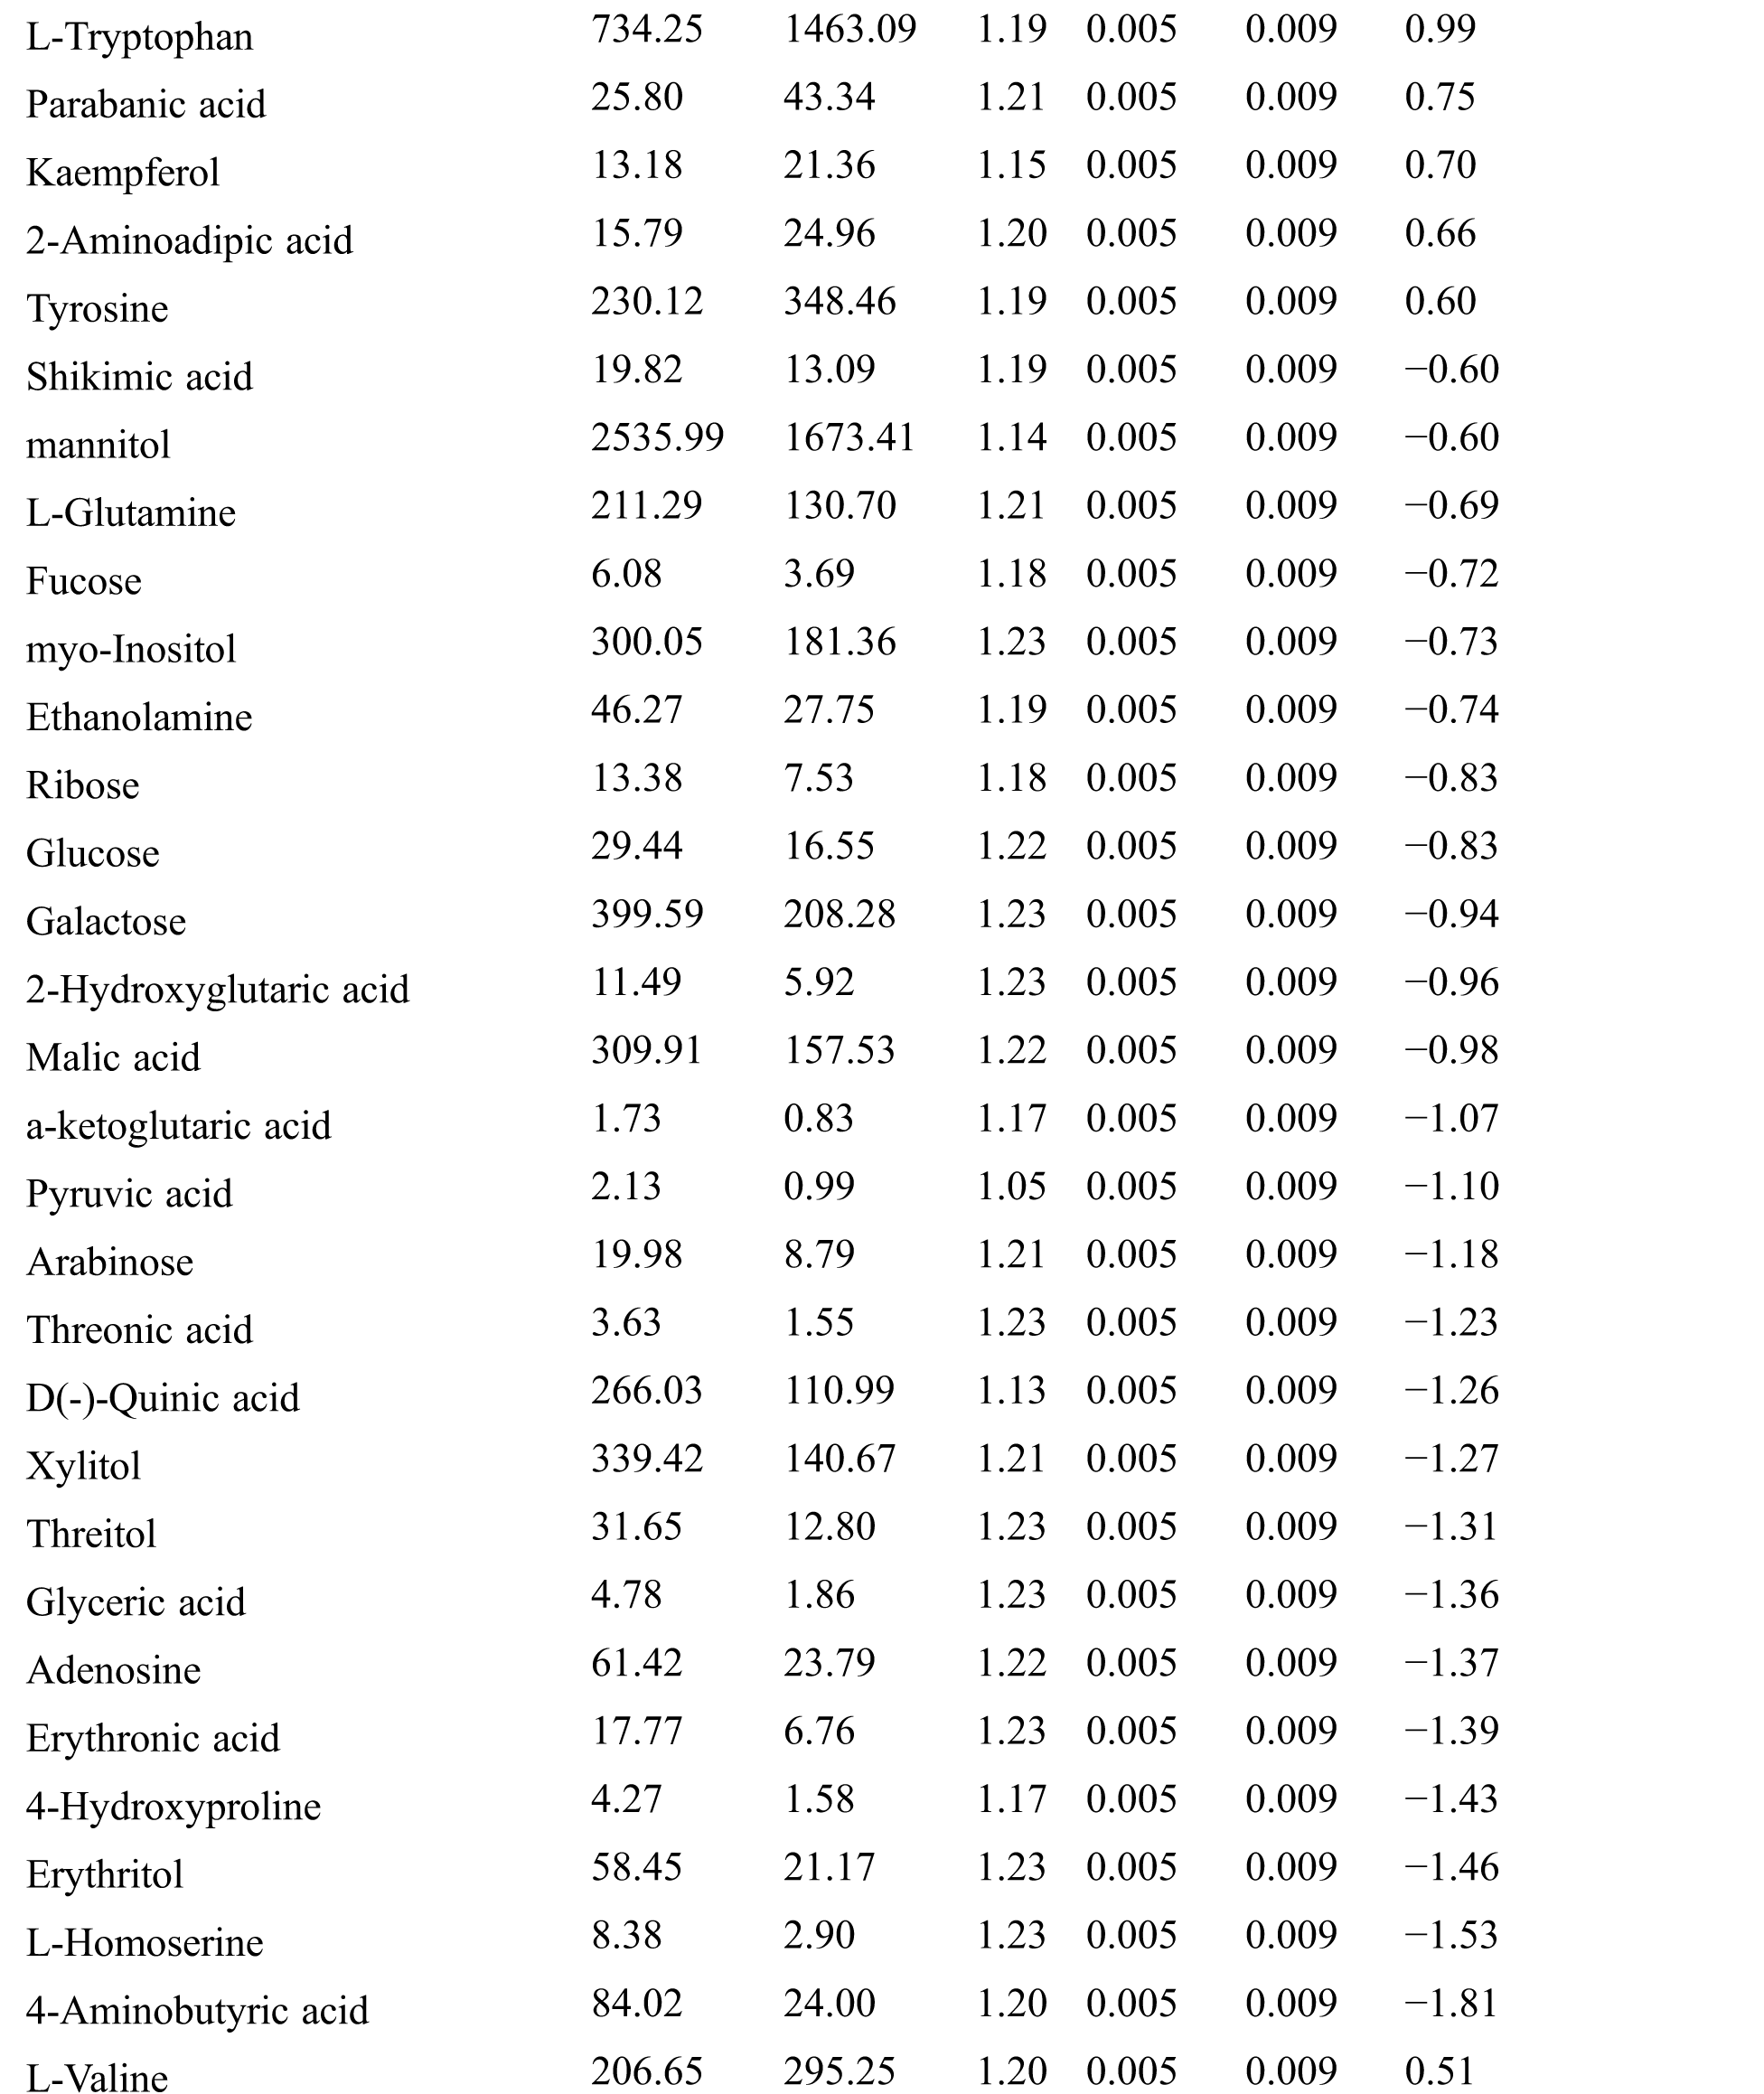
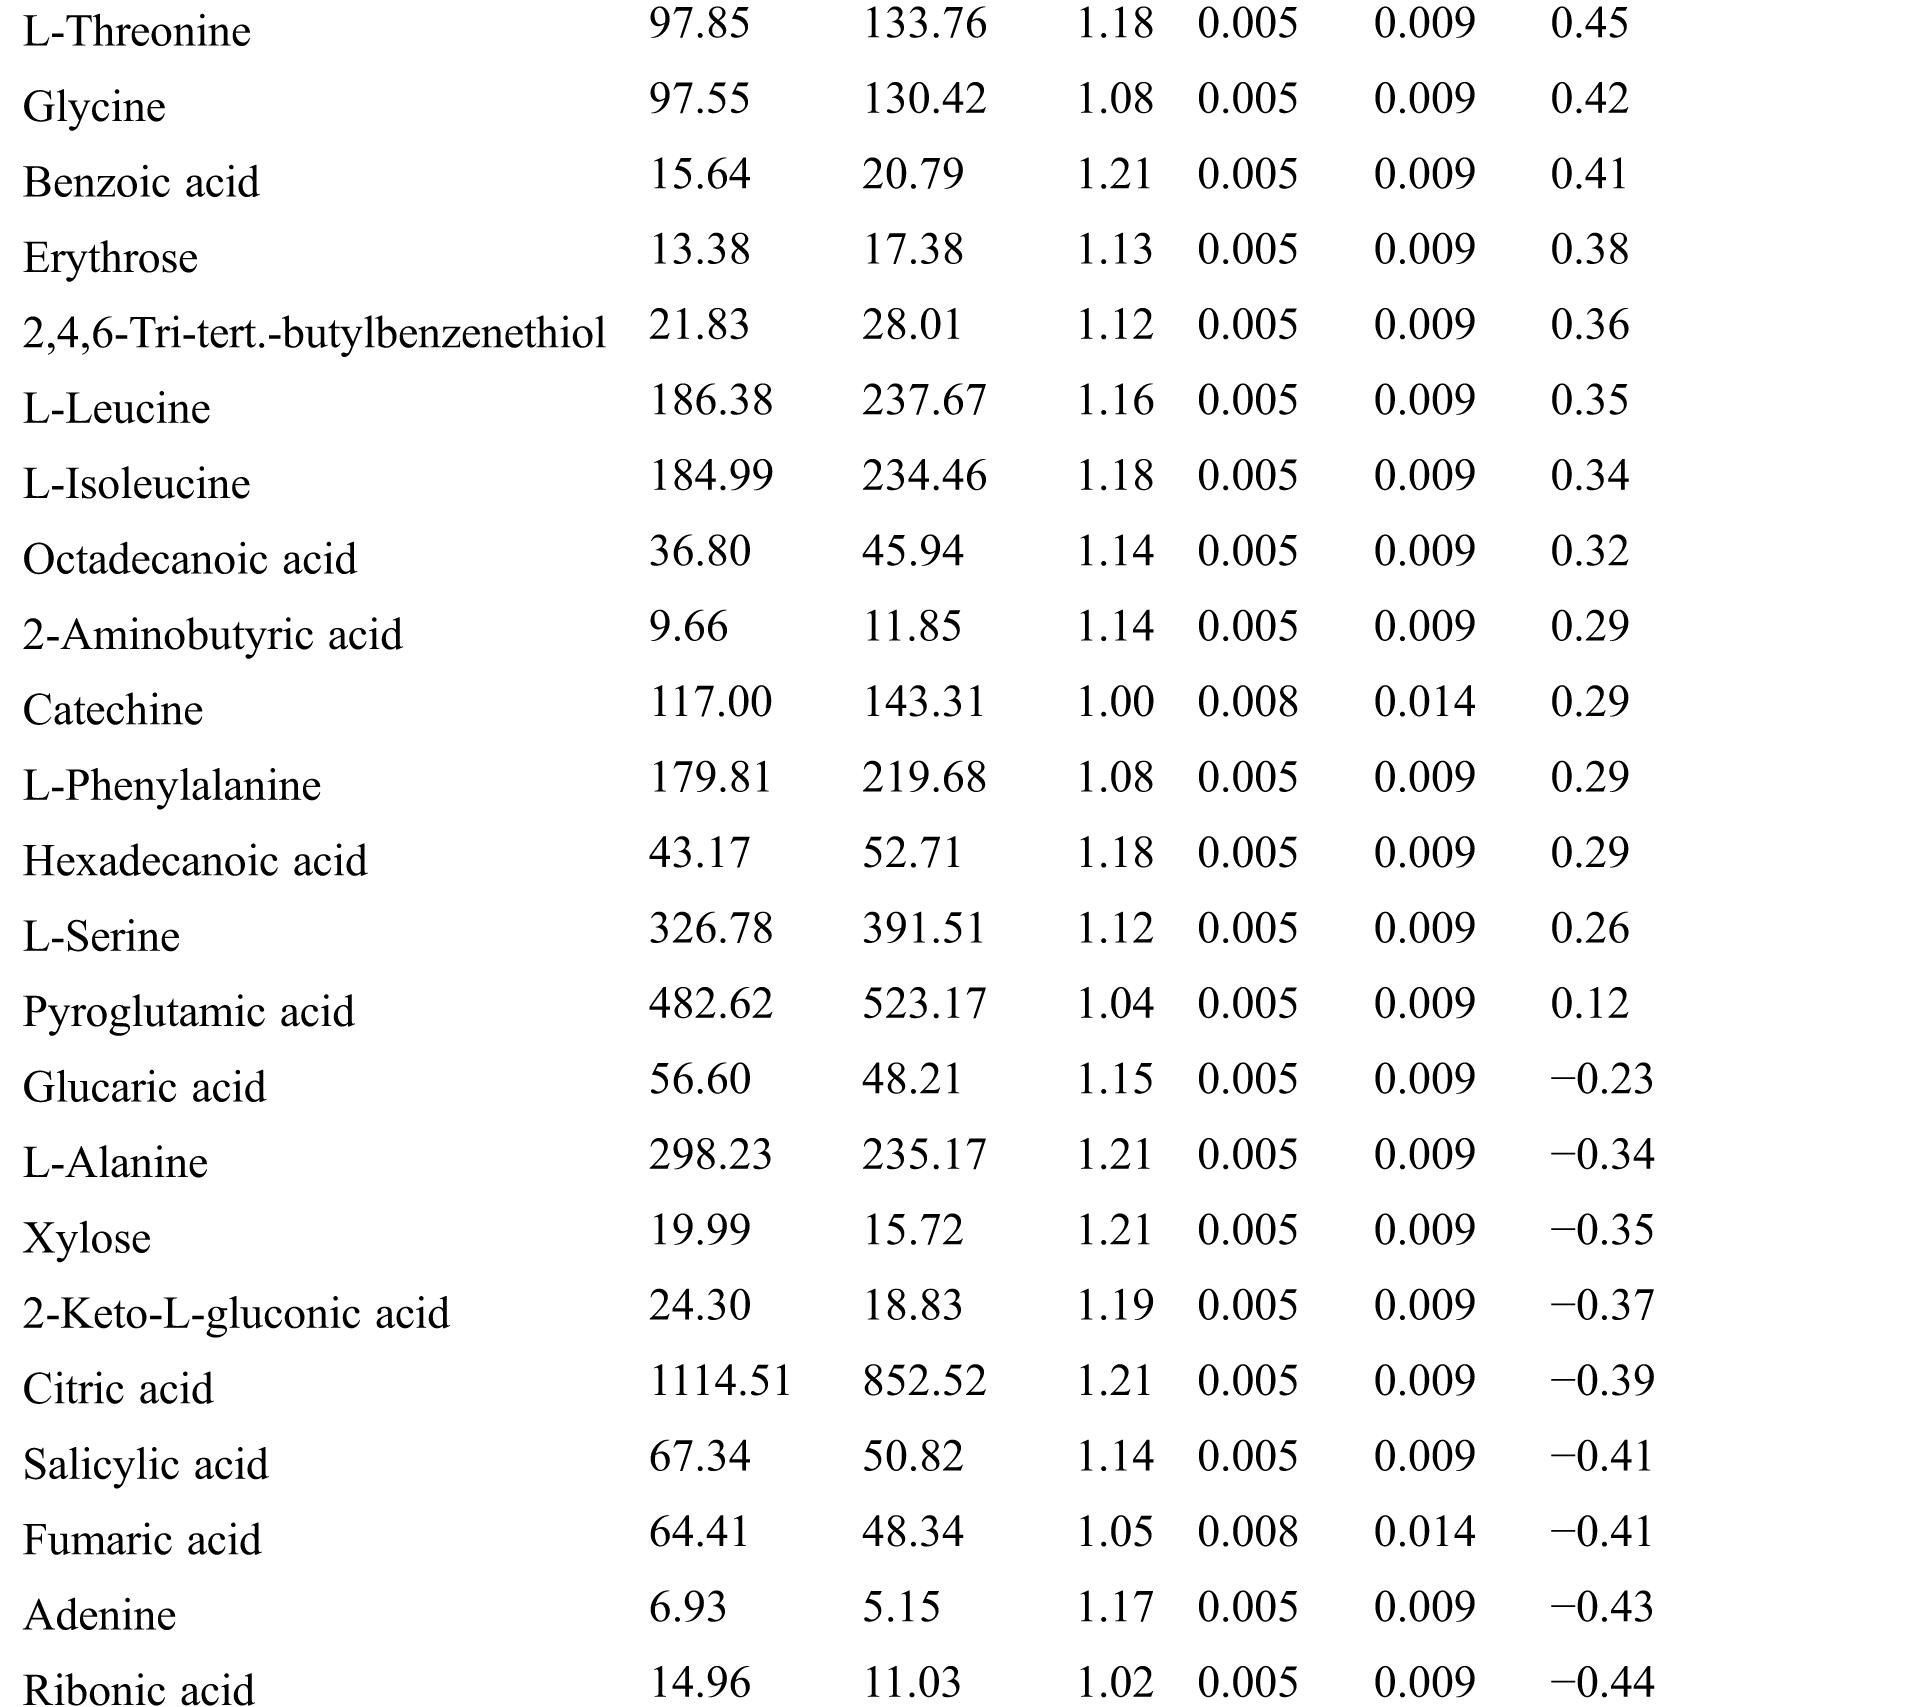
Table S3: The analysis of KEGG
 | This work is licensed under a Creative Commons Attribution 4.0 International License, which permits unrestricted use, distribution, and reproduction in any medium, provided the original work is properly cited. |