DOI:10.32604/phyton.2020.014073
| Phyton-International Journal of Experimental Botany DOI:10.32604/phyton.2020.014073 | |
| Article |
Effect of Pre-Anthesis Drought Hardening on Post-Anthesis Physiological Characteristics, Yield and WUE in Winter Wheat
1School of Water Conservancy, North China University of Water Resources and Electric Power, Zhengzhou, 450000, China
2Changshu River Management Office, Changshu, 215500, China
*Corresponding Author: Daoxi Li. Email: lidaoxi@ncwu.edu.cn
Received: 31 August 2020; Accepted: 20 October 2020
Abstract: A drought event can cause yield loss or entire crops to fail. In order to study the effects of continuous drought on physiological characteristics, yield, and water use efficiency (WUE) of winter wheat (Triticum aestivum L.), the variety “Zhoumai 22” was grown in controlled water conditions of the pot-planted winter wheat under a mobile rainout shelter. Foot planting and safe wintering were used to evaluate, winter wheat under different drought conditions, including light, moderate and severe drought at the jointing, heading, and filling stages. The soil water content was controlled at 60–70%, 50–60%, or 40–50% of field capacity. Experimental trials included 3 pre-anthesis drought hardening, 3 three-stage continuous drought, and 1 test control conditions. Under drought stress conditions, winter wheat leaf water potential, soil plant analysis development (SPAD), photosynthesis parameters, and yield declined due to pre-anthesis drought hardening. And the degree of decline: continuous drought > pre-anthesis drought hardening. Changes in the post-anthesis photosynthetic capacity of winter wheat were mainly related to the pre-anthesis drought level, rather than post-anthesis rehydration. The threshold of non-stomata limiting factors caused by photosynthesis at the filling stage is 40–50%FC, while comprehensive yield and WUE affected, the yield in severe drought treatments was the most significant, B3C3 and B3C3G3 decreased by 55.68% and 55.88%, respectively. Pre-anthesis drought was the main reason for the decreased crop yield. Thus, severe drought should be avoided during planting, while pre-anthesis light drought is a suitable choice for water-saving and crop production, as proper pre-anthesis drought hardening (60–70% FC) is feasible and effective.
Keywords: Triticum aestivum L; pre-anthesis drought hardening; leaf water potential; SPAD; yield; WUE
 | This work is licensed under a Creative Commons Attribution 4.0 International License, which permits unrestricted use, distribution, and reproduction in any medium, provided the original work is properly cited. |
Abbreviations
| B | joining stage |
| C | heading stage |
| Ci | intercellular CO2 concentration |
| FC | field capacity |
| G | filling stage |
| Gs | stomatal conductance |
| LWP | leaf water potential |
| NI | normal irrigation |
| Pn | net photosynthetic rate |
| SPAD | soil plant analysis development |
| Tr | transpiration rate |
| WUE | water use efficiency |
| 1 | light drought |
| 2 | moderate drought |
| 3 | severe drought |
Winter wheat is the third-largest agricultural product in China, with an annual output of about 110 million tons, and accounts for about 40% of total grain yields [1]. Winter wheat production is often related to economic, social development, and stability in some regions. Moreover, due to the combined effects of climate change and human activities, the frequency and intensity of drought disasters are increasing each year. Drought directly limits crop growth and grain yield and significantly affects economic development and food security [2,3]. In China, most of the winter wheat is grown in arid and semi-arid areas, where there is little rainfall and the rainy season is out of sync with its critical water demand stages, which causes winter wheat to often be under drought stress when it is growing [4,5]. Drought stress has become the main limiting factor for high and stable crop yield [6]. Initial studies have focused on the effects of drought stress on winter wheat yield and quality, the physiological response of winter wheat to drought, and the application of plant drought tolerance in genetically modified crops [7]. However, studies on the effects of drought hardening on the physiological characteristics and yield of winter wheat are still limited.
“Hardening” refers to the process by which organisms improve their physiological functions, health qualities and resilience to stress in order to adapt to the ecological environment and perform self-regulation and improvement for better survival [8]. Crop resistance can be improved through artificial protection and regulation measures [9]; therefore, we hypothesize that when winter wheat is introduced to drought at specific growth stage before flowering stages so that it has a drought-resistant memory, which can increase its resistance to future drought stress.
The flowering and filling stages are the critical periods for wheat reproductive growth and grain formation, as well as essential stages that determine winter wheat yield and quality [10]. The formation of winter wheat yield mainly depends on the accumulation, distribution and transport of dry matter. Dry matter is mainly derived from photosynthesis, which is the final form of photosynthetic products. The amount of accumulation, distribution, and transport of these products into the grains are closely related to the economic benefits obtained by crops in actual production [11]. At present, some studies show that drought stress results in soil water deficit that changes the water content in plants, which in turn affects photosynthesis, transpiration, and water use efficiency [12,13]. Leaf water potential can directly reflect the water status in plants and is the most sensitive measurement for evaluating plant water deficit [14] because it has a negative linear correlation with soil water content and is closely related to stomatal conductance [15]. When plants are dehydrated, the physiological activities of photosynthetic organs respond through highly sensitive and complex changes [16]. Water stress can reduce the photosynthetic rate during the filling stage, hinder the synthesis of photosynthetic products after the flowering stage, and reduce the transport of photosynthetic products to the seeds before the flowering stage, thus reducing yield [17]. Studies that used traditional leaf gas exchange technologies showed that drought stress induces plant leaf stomatal closure, leading to reduced stomatal conductance (Gs), net photosynthetic rate (Pn), intercellular CO2 concentration (Ci), and transpiration rate (Tr). These factors can ultimately lead to a decreased photosynthetic capacity [18–20]; however, when drought stress reaches a certain severity, simple leaf gas exchange can only reflect the apparent photosynthetic capacity of plants, while chlorophyll fluorescence (CHIF) can reflect internal light system performance [21,22]. Drought stress causes damage to the photosystem II (PSII) response center, reduces photosynthetic electron transfer capacity, decreases the original light energy capture efficiency, and inhibits photosynthesis to varying degrees. Drought stress reduces ΦPSII, ETR and NPQ in wheat flag leaves [23] and severe drought can decrease the chlorophyll content, leaf water content, F0, Fv/Fm, and Fv/F0 of the coleus [24]. In short, drought stress causes damage to photosynthetic organs, which are reflected as changes in photosynthetic physiological parameters that lead to a decrease in photosynthetic capacity. In practice, leaf gas exchange and chlorophyll fluorescence technology are often combined organically to accurately reflect the state and performance of the plant light system and to fully explain the impact external environmental stress has on photosynthetic organs. Hence, photosynthetic organs are the basis for plant growth, development, dry matter accumulation and yield formation [25]. Therefore, we tested how post-anthesis drought will lead to changes in the whole wheat plant, including accelerated senescence, reduced stomatal conductance, obstructed photosynthesis, shortened filling time, reduced spike number, grains per spike, thousand-grain weight, and grain yield [26,27].
Although the physiological characteristics and yield traits of winter wheat under drought stress have been studied, there are few reports about the effects of pre-anthesis drought hardening on the physiological characteristics of winter wheat under post-anthesis drought. This study has specific significance in combating the negative effects of drought cultivation, aims to aid in drought relief and disaster alleviation for crop production, and provides essential reference values for wheat planting areas that should be protected from drought to maintain stable yield and quality, and ensure food security.
2.1 Experimental Design and Field Practices
A pot experiment was conducted from October 2018 to June 2019 at the Chinese Academy of Agricultural Sciences, Qiliying experiment base in Xinxiang, Henan Province of China (35° 18’N, 113° 54’E; altitude 81 m). The study area has a warm, temperate continental monsoon climate zone with mean annual precipitation, potential evapotranspiration, air temperature, accumulated temperature sunshine duration and a frost-free period of 580 mm, 2000 mm, 14°C, 5070°C, 2399 h and 210 d, respectively.
The winter wheat variety “Zhoumai 22” was sown on October 15, 2018.
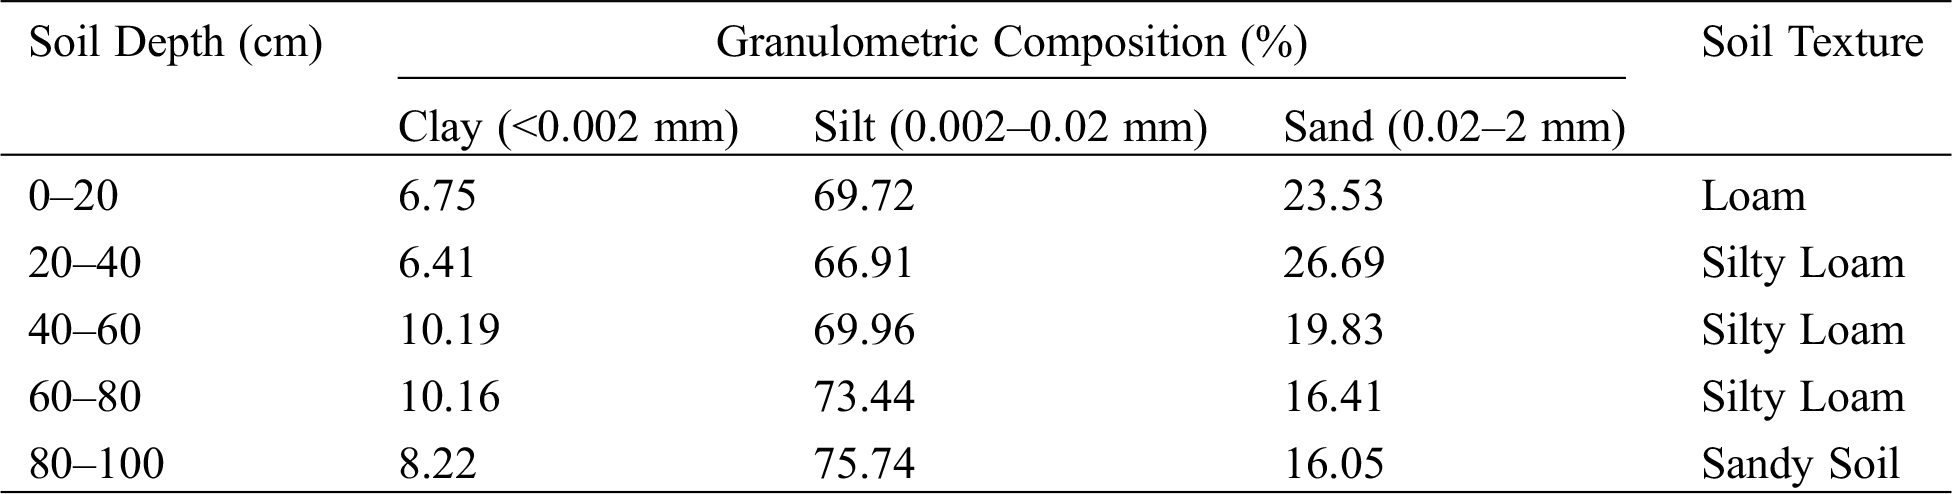
The experiment consisted of different drought levels at the jointing (jointing–heading stage), heading (heading–flowering stage) and filling stage (flowering–mature stage). These levels were defined as normal (70–80%), light drought (60–70%), moderate drought (50–60%) and severe drought (40–50%) of the field capacity, respectively. Due to limited funding and space, full permutation and combination tests were not adopted. After the screening, there were 3 pre-anthesis droughts, 3 three-stage continuous droughts, and 1 normal irrigation conditions, for a total of 7 experimental treatments (Tab. 1). Each treatment was replicated four times, one of which was used for destructive testing, totaling of 28 pots. The pots used in the experiment were made of iron and were 40 cm in diameter and 60 cm tall. The soil was loam and its bulk density for each pot was controlled at 1.36 g/cm3 (Tabs. 2-1 and 2-2). The pots were placed in a 60 cm underground pit and weighed with a hanging scale to monitor the water consumption of plants. The effective plants were selected at the three leaf stages and 60 plants were planted in each pot.
Table 1: The pot-planted experimental design
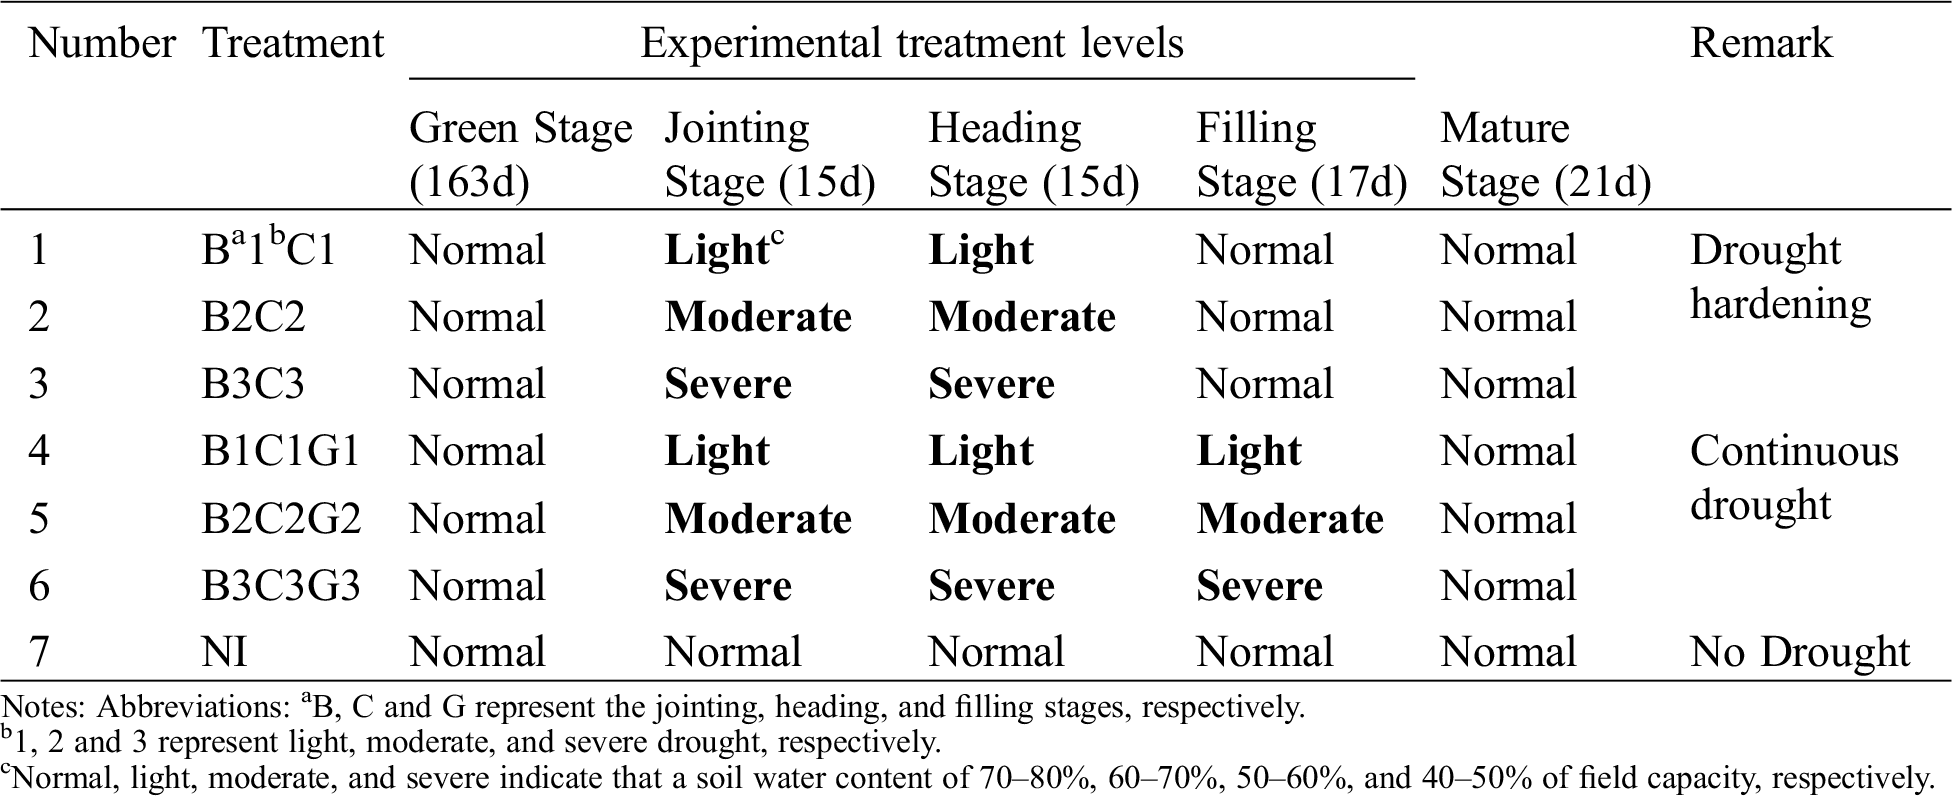
Table 2-1: Basic traits of the experimental soil

Table 2-2: Soil parameters of the experimental station
All agronomic measurements were consistent except for the difference in moisture in all test treatments. Before sowing, 10 g compound fertilizer (N, P, K = 15:15:15), and 3.5 g urea (pure nitrogen levels ≥46%) were applied as basally does through topdressing in the early jointing stage.
2.2.1 Soil Water Content and Irrigation Amount
In order to guide the irrigation scheduling, soil samples were taken once every growth stage starting from the tillering stage depth of 10–30 cm and 30–50 cm. The soil water content was determined using the oven drying method. The average water content of the two soil layers was measured as the initial soil water content of the growth stage. After entering the jointing stage, the test winter wheat was controlled to three levels of light drought, moderate drought and severe drought through natural evaporation and quantitative irrigation.
Irrigation was applied when the soil water content at a specific growth stage was reached the set limit of the experimental treatment, and each irrigation amount was calculated according to Eq. (1). As measuring cup was used to quantify of the amount of water added to each pot. After each irrigation, the pots were weighed every 1∼2 days and the mass change of the pots represented the water-consumption of the plants, which predicted the next irrigation time.

where W is the irrigation amount (g); γ is the soil dry bulk density (g/cm3); H is the scheming wetted soil layer depth (cm); A is the cross-sectional area of the pot (cm2); θ1 is the upper limit water content of the design irrigation; θ2 is the soil water content before irrigation.
2.2.2 Observation of Growth Stages
Observation of the eight main growth stages of winter wheat, including emergence, greening, jointing, heading, flowering, filling, maturation, and harvesting stages. When 50% of the winter wheat had the characteristics of the corresponding growth stage, it was considered that the plants had reached that growth stage and the date was recorded.
A WP4C water potential meter (Decagon, USA) was used to measure the water potential of flag leaves. In sunny and windless weather, flag leaf that received the same light as the measurement object at 9:00 in the morning was selected and 10 samples with a diameter of 1 cm were collected with a puncher. Samples were placed them in the sample box of the WP4C to measure leaf water potential. Three replicates for each treatment were included in the analysis.
2.2.4 Water Consumption and WUE
The soil water content was monitored during the whole growth period, and the soil water content of the planned moisture layer was measured by the drying method before and after each growth stage. The water consumption was calculated by daily weighing of the pots. The evapotranspiration of winter wheat was calculated using the soil water balance Eq. (2).


where ET0 is the total evapotranspiration of the winter wheat growing season (mm); I is the irrigation water (mm); P is the effective precipitation (mm); R is the surface runoff (mm); D is the deep percolation (mm); SW is the change in soil water content in the wet layer from planting to harvest (mm); ET is the total evapotranspiration per pot for the winter wheat growing season (m3).
The experiment was performed in bottomed pots under a rain shelter; thus, P, R, and D could be ignored. Calculated water use efficiency was based on the yield and water consumption of each treatment.

where WUE is the water use efficiency (kg/m3) and Y is the yield (kg).
2.2.5 Physiological Characteristics
The photosynthetic parameters of flag leaves were measured every 7 days from the beginning of the winter wheat treatment to the corresponding growth stage. Select fine weather, the photosynthetic rate (Pn) and stomatal conductance (Gs) were measured from the flag leaves between 09:00–11:00 using the LI-6400XT portable photosynthesis system (LI-COR, USA), following the manufacturer instructions. Test data were recorded as an average of three different pots in each treatment. During measurement, the CO2 concentration in the leaf chamber was set to 400 μmol/mol, the flow rate was set to 500 μmol/(m2 · s2), and an artificial light source LED that provided the light intensity in the system was set to 1200 μmol/(m2 · s). During cloudy weather, before measuring each sample, leaves were induced in the LI-6400XT with a light intensity of 1200 μmol/(m2 · s) for 30 min.
Chlorophyll content in the topmost fully expanded leaves that received light from the same direction as the leaves on the main stem between 10:00 and 12:00 am was measured using a SPAD meter (Model: SPAD-502, Minolta Sensing Ltd., Osaka, Japan). Chlorophyll content was expressed in SPAD (Soil Plant Analysis Development) units and values were recorded from three pots within each treatment. The readings were averaged to obtain a single value for each replicate.
2.2.6 Yield and Yield Components
After the winter wheat was artificially harvested on June 1, it was dried, threshed, tested for seed production, and counted for production. Its effective panicle number, grain number per spike, thousand seed mass, and economic yield were calculated.
The data were processed and graphed in Microsoft Excel 2016 and Origin 2019b (Origin Lab, USA). Analysis of variance (two-way ANOVA) was performed using SPSS software version 25.0 (SPSS Inc. USA). Statistical differences in leaf water potential, SPAD, photosynthetic parameters, yield, WUE were examined using the LSD multiple comparison test and declared at the 0.05 probability level.
Leaf water potential (LWP) is the driving force for the flow of liquid water in plants, and the most sensitive physiological index reflecting water deficit, making it an essential index for evaluating drought stress [28]. Compared with NI, all drought stress conditions reduced leaf water potential of winter wheat, regardless of whether plants had undergone drought hardening (Fig. 1). Additionally, the leaf water potential showed a positive correlation with soil moisture; as the soil moisture decreased, the leaf water potential also decreased. Before the flowering stage, the leaf water potential of B1C1 and B2C2 decreased by 5.9% and 18.8% compared with NI, respectively, but this decline was not significant (p < 0.05). However, B3C3 was significantly different from NI, with a decrease in leaf water potential of 36.7%. After entering the flowering stage, there was no significant difference between treatments after drought hardening compared with NI. However, the treatments that ended the drought hardening but continued the drought showed a significant reduction in LWP with NI. Among them, the decrease in B2C2G2 and B3C3G3 even reached 118.7% and 135.8%, respectively. Under the same drought condition, the treatments that ended in drought hardening were also significantly different from those that continued the drought treatments. These results indicated that after drought hardening, winter wheat can effectively maintain leaf water potential.
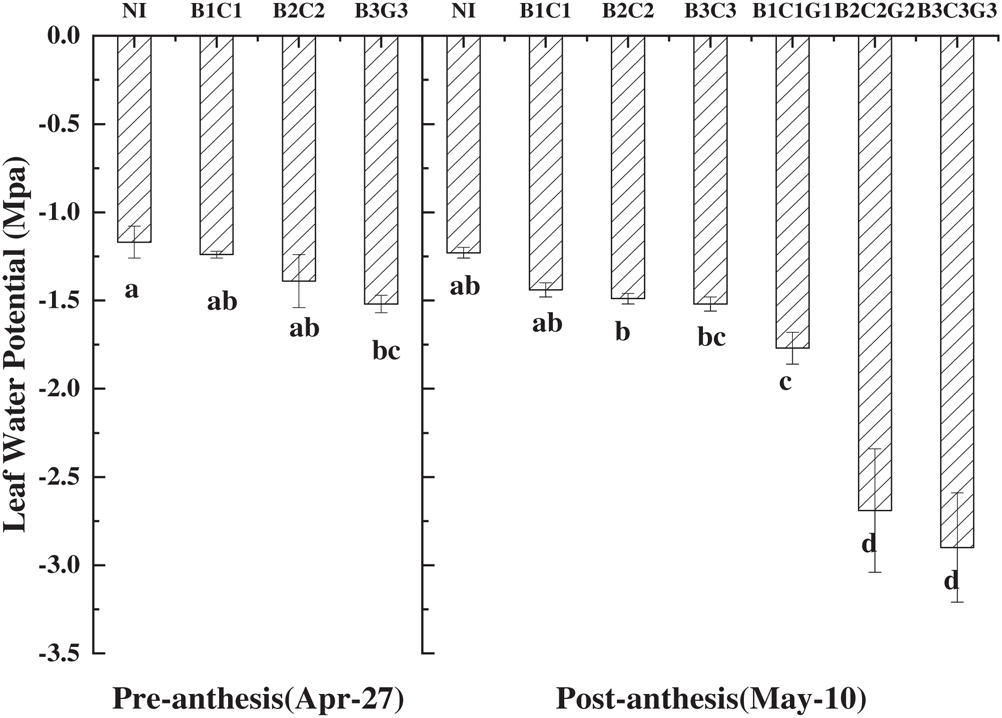
Figure 1: Effect of pre-anthesis drought hardening on leaf water potential in winter wheat. B, C, and G represent the jointing stage, heading stage and filling stage, respectively; 1, 2, and 3 represent light, moderate, and severe drought, respectively
When SPAD changes were compared after plants entered the flowering stage, B1C1, B2C2, and B1C1G1 increased similar to NI, while B3C3, B2C2G2, and B3C3G3 showed a downward trend (Fig. 2). After entering the flowering stage, the three treatments showing an upward trend that was not significantly different with NI; however, B3C3, B2C2G2, and B3C3G3 decreased by 5.9%, 7.1%, and 7.8%, respectively, reaching a significant level (p < 0.05). After drought hardening with rehydration or continued drought, the SPAD value during the filling stage could be sorted by the level of drought hardening: Light drought > moderate drought > severe drought. It is worth noting that B3C3 did not show an upward trend like the other two treatments after drought hardening and that the SPAD of B1C1G1 did not decrease but increased. This showed that drought hardening should control the level of drought stress. Thus, even if the drought hardening were ended during severe drought stress, the SPAD of winter wheat would significantly decrease during the filling stage.
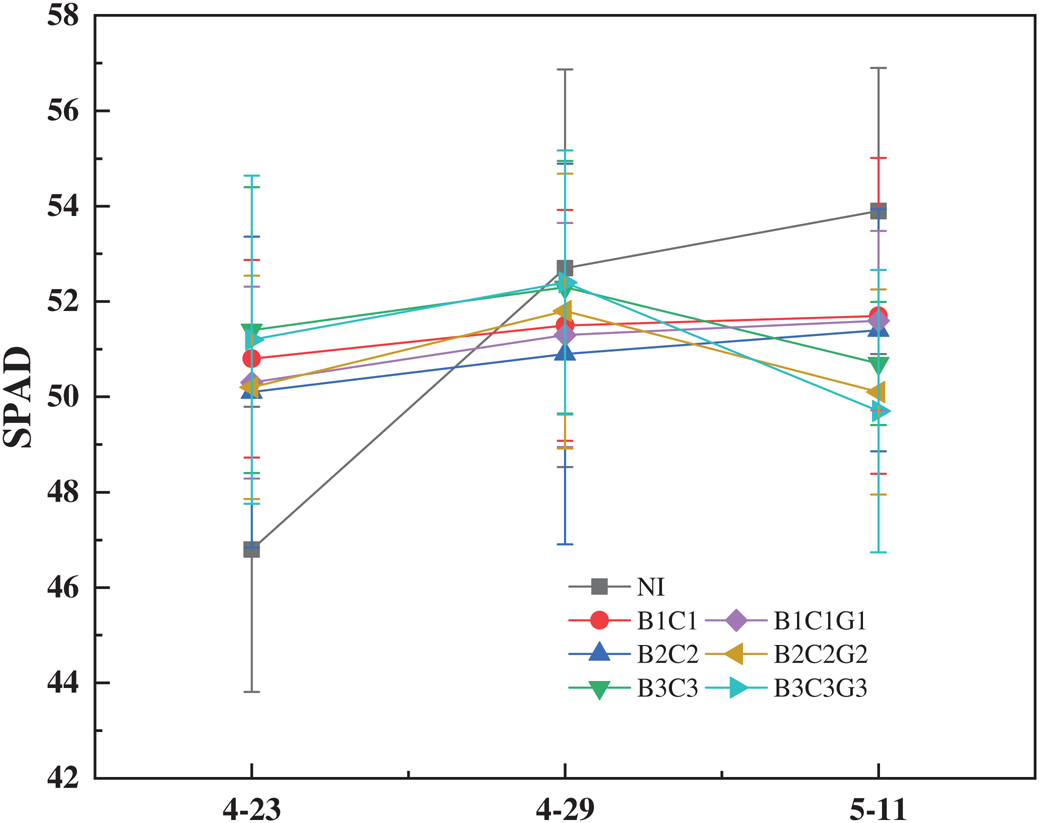
Figure 2: Effect of pre-anthesis drought hardening on SPAD in winter wheat
The Fig. 3 shows the changes in photosynthetic parameters of winter wheat after the flowering stage. The Pn, Gs, and Tr of NI, B1C1, B2C2, and B3C3 groups presented an initial increase and then decrease, with a “single peak” curve that showed a noticeable rehydration compensation effect and indicated changes in photosynthetic parameters in winter wheat after the flowering stage. Among these parameters, the Tr of B1C1 even had a super-compensation effect. The Pn of B1C1G1, B2C2G2, and B3C3G3 that ended drought hardening and the subsequent drought gradually declined as the drought continued and was significantly different from the corresponding B1C1, B2C2, and B3C3. This result showed that winter wheat that had completed drought hardening in continued drought conditions did not directly reflect stress resistance enhancement, and the net photosynthetic rate still-significantly decreased in response to drought. The Gs and Tr of B1C1G1 and B2C2G2 gradually increased trend, while B3C3G3 showed a decreased trend, and the decreasing amplitude increased as the drought level increased. However, for Gs and Tr, light and moderate drought did not reduce the stomatal conductance and transpiration rate in the continuous drought treatments, indicating that the threshold for the decline was the severe drought conditions.
Compared with NI, the change in Ci of B1C1 and B2C2 were similar; both raised first and then decreased slightly before they stabilized. However, the Ci of B3C3 significantly increased by 18.2% compared with the end of hardening, while B1C1G1, B2C2G2, and B3C3G3 increased significantly by 38.9%, 43.5%, and 36.3%, respectively. Combined with Gs, the Ci of B1C1, B2C2, B1C1G1, and B2C2G2 all changed with Gs. When the stomata conductance was high, CO2 can enter the leaves through the stomata to provide the CO2 required for leaf photosynthesis, and the intercellular CO2 concentration increased, and vice versa. The changes in Gs of B3C3 were the same as Pn, but in the late stage of filling, Gs and Pn decreased, while Ci increased. These results showed that non-stomatal limiting factors caused the decrease of B3C3’s in the net photosynthetic rate of B3C3 and B3C3G3.
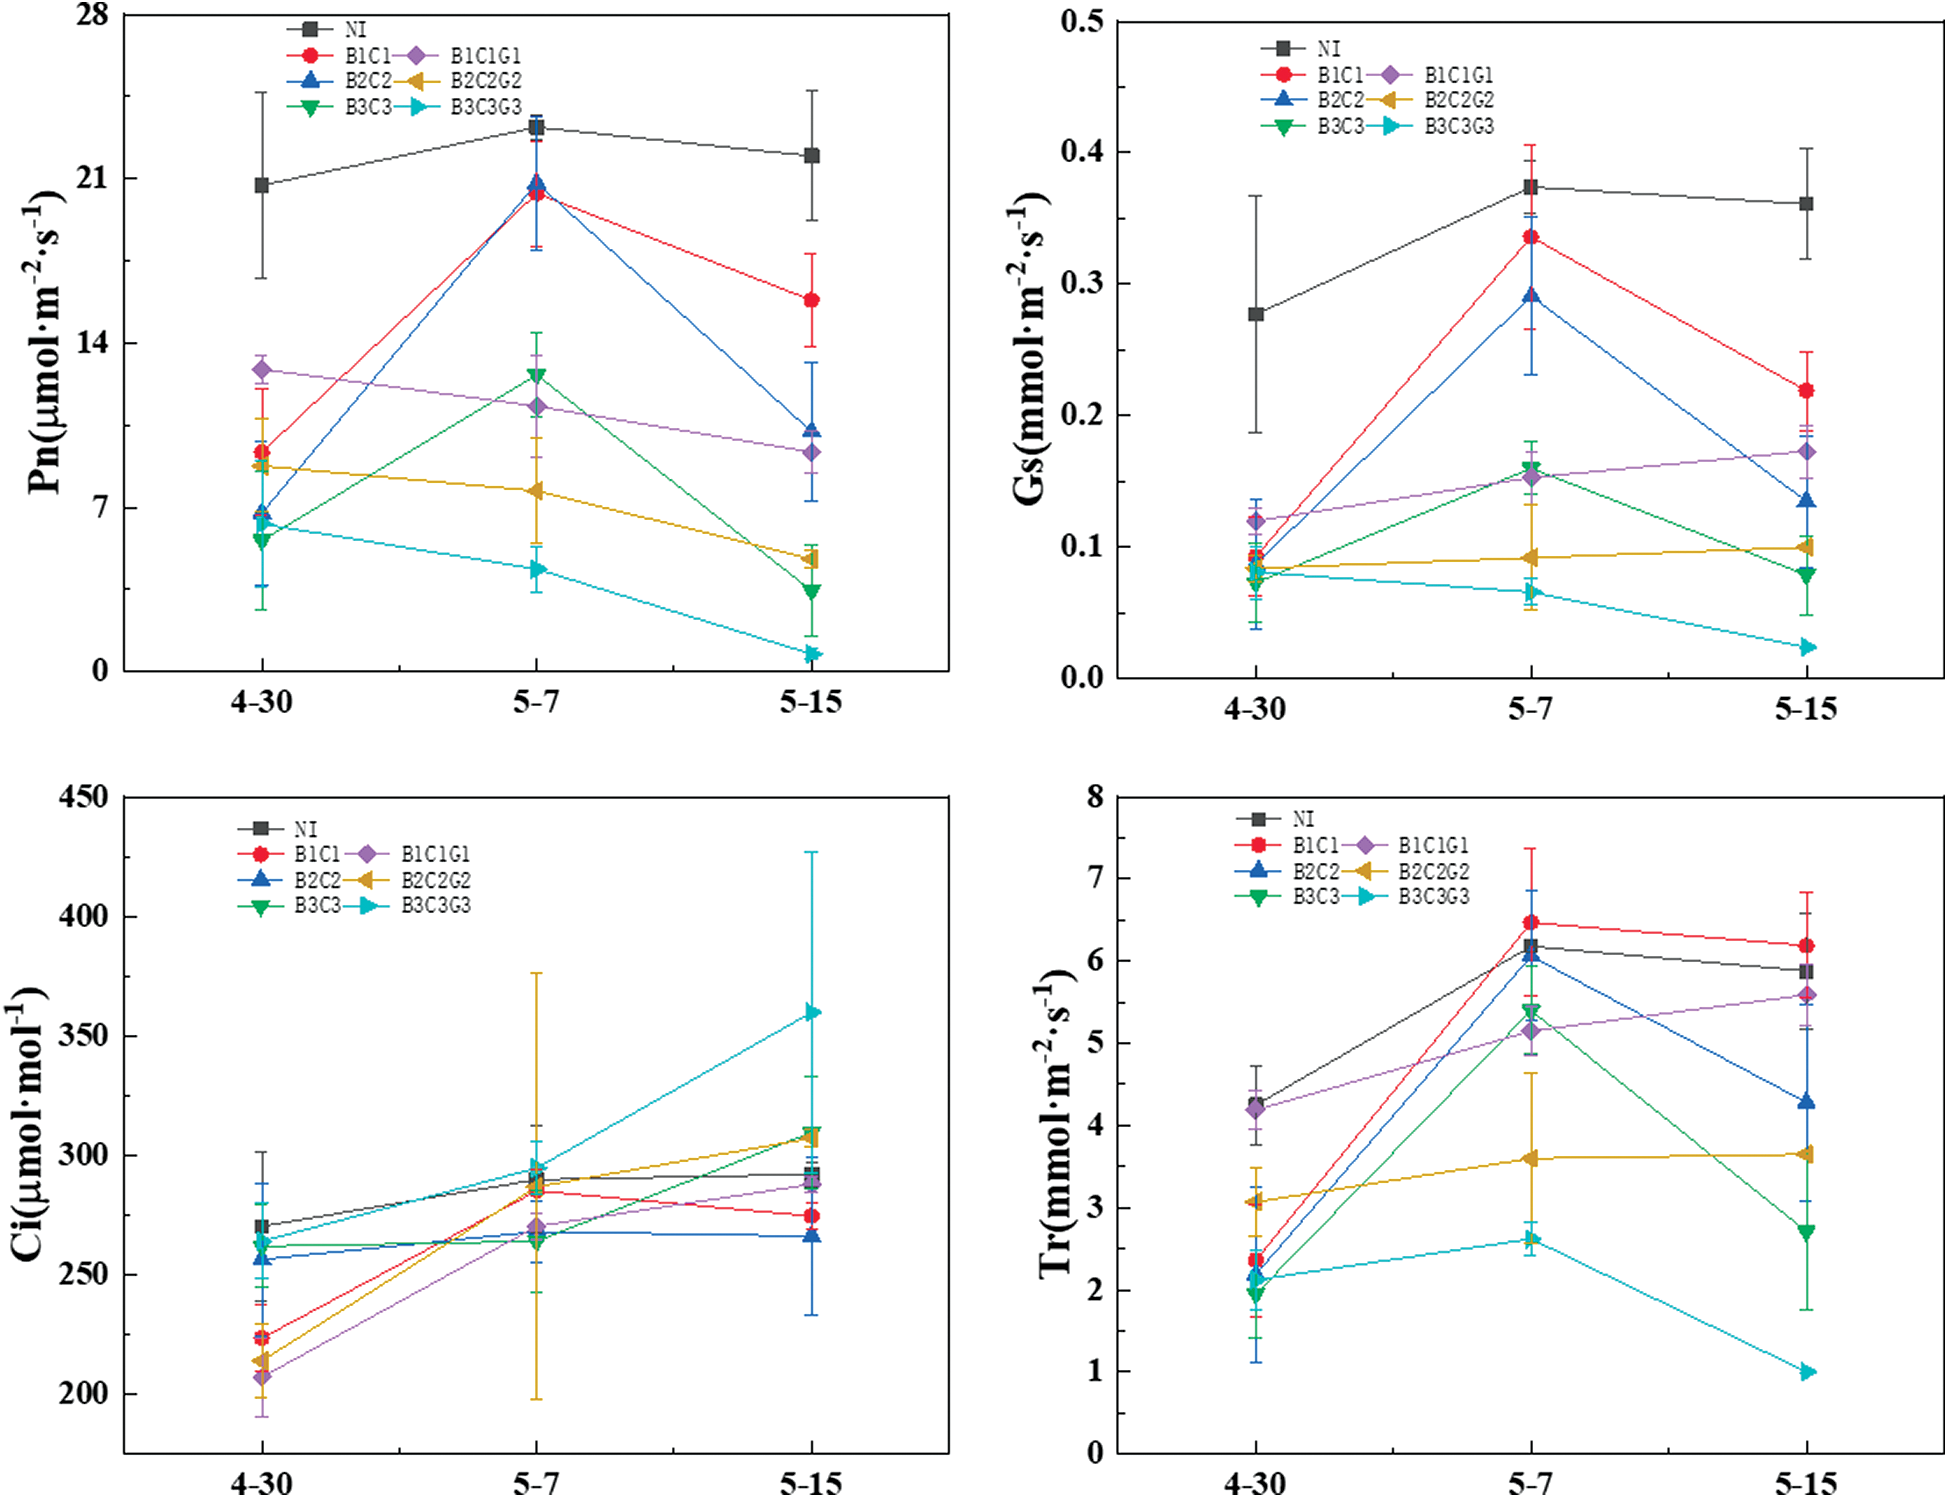
Figure 3: Effect of pre-anthesis drought hardening on photosynthesis parameters of winter wheat
As shown in Fig. 4, as long as there is drought stress during the growth stages, winter wheat that decreased plant yield to varying degrees. Moreever, the decline is proportional to the drought duration and drought level. Compared with NI, the yield of B1C1, B2C2, and B3C3 decreased by 6.2%, 14.8%, and 55.7%, respectively. Among them, the decline of B2C2 and B3C3 reached a significant level (p < 0.05). This shows that when the pre-anthesis drought hardening level reaches moderate drought or above, winter wheat will significantly reduce in yield. At the same drought hardening level, plants in the continuous drought treatment had a lower yield than those in the rehydration treatment. Compared to B1C1, the B1C1G1 yield was significantly reduced by 10.5%. There were no significant differences in the yields measured of B2C2, B2C2G2, B3C3, and B3C3G3 groups. Together, these results showed that winter wheat that underwent drought hardening before the flowering stage maintained a better yield than those that experienced continuous drought.
Our data showed that there was no significant difference in WUE between B1C1, B2C2, B1C1G1, B2C2G2, and NI. The WUE of B3C3 and B3C3G3 were significantly lower than NI, while the WUE of B1C1, B2C2, and B1C1G1 increased by 11.5%, 13.7%, and 0.76%, respectively. This showed that drought stress under appropriate conditions can increase the WUE in winter wheat and that drought hardening before the flowering stage was more effective at the same drought level than continuous drought. Furthermore, the WUE of B3C3 was lower than that of B3C3G3, which indicated that when the drought hardening level reached severe drought, rewatering after the heading stage ended could not effectively increase WUE in winter wheat plants. Therefore, the WUE of winter wheat is sensitive to drought stress mainly at jointing and heading stages.
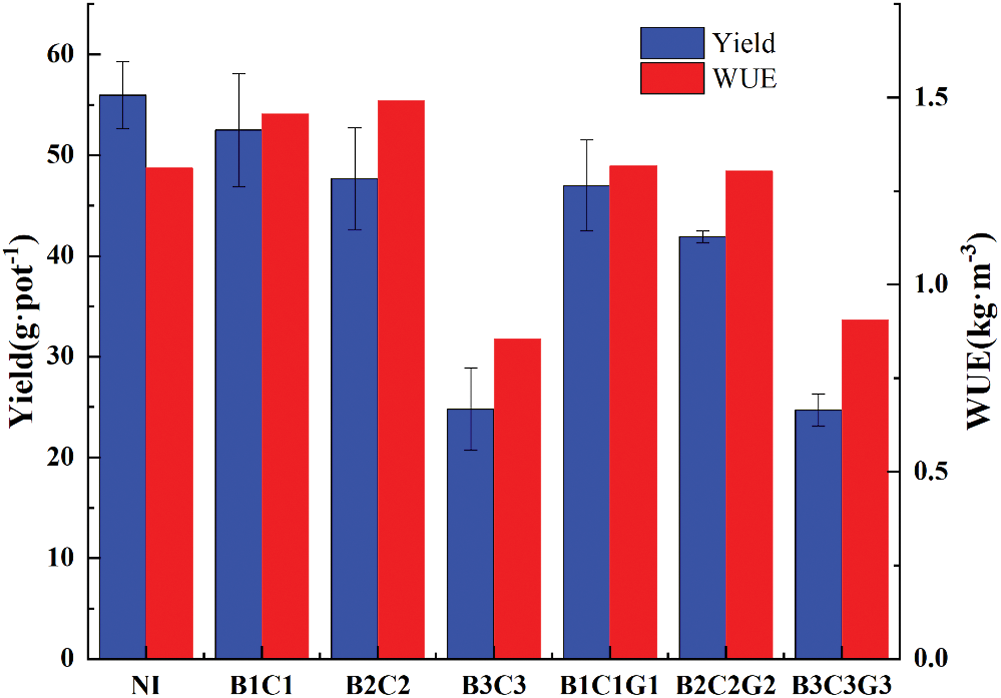
Figure 4: Winter wheat yield and water use efficiency (WUE) under different drought hardening treatments
In arid environments, soil water potential is usually low and plants often adjust their water potential according to different environmental conditions to achieve a water potential balance, avoid dehydration, and adapt to drought adversities. Water potential balance is mainly achieved through osmotic adjustment [29,30]. The results reported here show that both drought hardening and continuous drought treatment causes the flag leaf water potential to decrease, and the amplitude of leaf water potential loss increases with drought level. This is consistent with the previous research that reported plants must decrease the water potential in their cells to maintain water balance and adapt to drought stress [31]. The LWP value of B1C1, B2C2, and B3C3 at the filling stage decreased compared with that in plants that experienced drought hardening, but this difference was not significant. This is mainly because the LWP will have a compensation effect after rehydration [32], but its peak value appears before the measurement date; at the time of measurement, its value has already fallen from the peak value. When we compared LWP in NI on April 27 and May 10, we found that the LWP on May 10 dropped by 0.06 Mpa. Therefore, it can be considered that the decline in LWP of B1C1, B2C2, and B3C3 was not caused by drought. In the three treatments of continuous drought, the rate of decrease of LWP value slowed down as the drought level increased, but its value was significantly lower than the corresponding treatments after drought hardening. These finding are consistent with Hao’s research results [32].
Chlorophyll is the most important pigment for plant photosynthesis and therefore, plant photosynthetic efficiency is closely related to the level of chlorophyll content [33]. The SPAD value is a dimensionless ratio that reflects the relative plant chlorophyll content. SPAD value and chlorophyll content are linearly positively correlated and reach a significant level (R2 = 0.91) [34]. Therefore, we chose to measure the SPAD value instead of conducting traditional chlorophyll extraction of content, to achieve real-time, non-destructive and rapid measurement. The test results showed that B1C1, B2C2 and B1C1G1 all showed an upward trend. The main reason for this phenomenon may be that drought stress has a greater impact on the chlorophyll content in the critical stages of water demand [35], which suggests that winter wheat could already adapt to light drought after drought hardening. However, B3C3, B2C2G2, and B3C3G3 showed a downward trend in SPAD, indicating that winter wheat plants were relatively weak in the jointing and heading stages, and excessive drought levels caused some irreversible damage to their growth and development. Thus, there was no obvious compensation effect after rehydration, and SPAD was reduced. The B2C2G2 and B3C3G3 treatments were consistent with the research found by Liu [36] that the chlorophyll content of rice flag leaves first increased and then decreasing with prolonged drought and increased the drought level.
The results of this experiment showed that changes in Gs and Tr were consistent. The Pn of B1C1G1, B2C2G2, and B3C3G3 groups had a different behaviour when compared with Gs and Tr. The Pn of B1C1G1 and B2C2G2 showed a downward trend, while Gs and Tr showed an upward trend; the Pn, Gs, and Tr of B3C3G3 all showed a downward trend. This pattern was observed because any level of drought stress led to a decrease in Pn; however, the threshold for decreased in Gs and Tr under the continuous drought treatment was a severe drought condition. B1C1G1 and B2C2G2 regulated stomatal pore size to adapt to drought stress by producing abscisic acid, consistent with Zhang’s research results [37]. After the drought hardening, the winter wheat was rehydrated, and the compensation effect was obvious. The higher the drought level, the smaller the compensation effect. The compensation effect first increased and then decreased with time, with a peak that appeared about 7 days after rehydration. Studies have shown that one of the essential factors that lead to a decline in plant photosynthetic capacity is stomata and non-stomata restriction. The criterion for judging the effect of non-stomata factors is if the intercellular CO2 concentration of leaves increases upon treatment [38]. The change in the Ci of B1C1, B2C2, B1C1G1, and B2C2G2 was consistent with Gs, indicating that the main factor affecting Ci in these treatments was the stomatal limitation. The Ci of B3C3 and B3C3G3 increased while Gs decreased, which was mainly due to non-stomata limiting factors. Generally speaking, the main reason for the decline in photosynthetic rate under light and moderate drought conditions was a stomatal limitation, while its decline under severe drought conditions was a result of non-stomata limitation.
Overall, these results indicate that pre-anthesis drought hardening had a positive effect on photosynthesis in winter wheat.
Studies have shown that continuous drought during the reproduction stage of winter wheat will lead to a rapid decline in the photosynthetic rate of flag leaves and premature senescence, which shortens the duration of the filling stage [39] and reduces crop yield [40]. The yield of all treatments in this experiment significantly decreased to different degrees compared with NI, except B1C1 reached a significant level. Under year-on-year conditions, there was no significant difference between the drought hardening and continuous drought treatments, indicating that when the drought level reached moderate drought and above, drought hardening before the flowering stage could not adequately maintain the yield. Under the same level of drought conditions, the order of their impact on winter wheat yield was continuous drought > pre-anthesis drought hardening.
The WUE of B3C3 and B3C3G3 under severe drought condition sharply declined compared with NI, while other treatments did not show significant differences. However, the WUE of B1C1, B2C2, and B1C1G1 exceeded the WUE of NI. Therefore, winter wheat can accept appropriate drought stress before the flowering stage to improve the body’s resistance to adversity and improve the water use efficiency of winter wheat. However, severe drought stress should be avoided as much as possible. Use severe drought to harden winter wheat before the flowering stage, and whether to rehydrate after the flowering stage has little effect on the WUE of winter wheat. It can also be seen that the stages of drought stress affecting the WUE of winter wheat are mainly at the jointing and the heading stages.
Pre-anthesis drought hardening helps the LWP and SPAD of winter wheat to be kept at a stable level to help the yield not be significantly reduced. However, the drought hardening level must avoid severe drought (40–50%). The effect on the photosynthetic capacity of winter wheat during the filling stage is mainly related to the pre-anthesis drought hardening level, rather than rehydrated after drought hardening. During the filling stage, severe drought produces non-stomata limiting factors that affect photosynthesis, and stomata restrict photosynthesis under light and moderate droughts. All drought stress reduces winter wheat yield but does not necessarily affect WUE. Jointing and heading stages are the sensitive stages of winter wheat yield reduction due to drought stress. From the perspective of water-saving and high efficiency, pre-anthesis drought hardening is feasible, light drought (60–70% FC) is suitable for water-saving and production in winter wheat.
Acknowledgement: We fully appreciate the editors and all anonymous reviewers for their constructive comments on this manuscript.
Funding Statement: This research was jointly funded by the National Nature Science Foundation of China (51779093); and the Support Plan for Scientific and Technological Innovation Team of Colleges and Universities in Henan Province (17IRTSTHN026).
Conflicts of Interest: The authors declare that they have no conflicts of interest to report regarding the present study.
References
1. Xu, B., Miao, W., Dong, Y., Li, B., Xu, S. (2012). Resource distribution and processing quality of commercial wheat germ in China. Transactions of the Chinese Society of Agricultural Engineering, 28, 244–249.
2. Mupangwa, W., Twomlow, S., Walker, S. (2008). The influence of conservation tillage methods on soil water regimes in semi-arid southern Zimbabwe. Physics and Chemistry of the Earth, Parts A/B/C, 33(8–13), 762–767. DOI 10.1016/j.pce.2008.06.049. [Google Scholar] [CrossRef]
3. Turner, N. C. (2004). Sustainable production of crops and pastures under drought in a Mediterranean environment. Annals of Applied Biology, 144(2), 139–147. DOI 10.1111/j.1744-7348.2004.tb00327.x. [Google Scholar] [CrossRef]
4. Zou, X., Ren, G., Zhang, Q. (2010). Droughts variations in China based on a compound index of meteorological drought. Climatic and Environmental Research, 15, 371–378. [Google Scholar]
5. Le, Z., Liao, R., Liu, J., Lu, J., Bai, Y. et al. (2014). Effects of water stress on stem, plant and yield of winter wheat over North China Plain. Journal of Meteorology and Environment, 30, 120–124. [Google Scholar]
6. Cui, J., Ning, H., Song, N., Zhang, Y., Liu, X. et al. (2019). Physiological development and yield of winter wheat after rehydration following water stress at heading and flowing stage. Journal of Irrigation and Drainage, 38, 8–13+55. [Google Scholar]
7. Gressel, J., Levy, A. A. (2009). Stress, mutators, mutations and stress resistance. In Abiotic Stress Adaptation in Plants, pp. 471–483. Dordrecht: Springer. [Google Scholar]
8. Jian, L., Lu, C., Li, J., L.P., H. (2005). Increment of chilling tolerance and its physiological basis in chilling-sensitive corn sprouts and tomato seedlings after cold-hardening at optimum temperatures. Acta Agronomica Sinica, 31, 971–976. [Google Scholar]
9. Turner, N. C., Begg, J. E. (1981). Plant-water relations and adaptation to stress. Plant and Soil, 58(1–3), 97–131. DOI 10.1007/BF02180051. [Google Scholar] [CrossRef]
10. Mou, H., He, J., Xing, J., Yao, S., Tang, Y. et al. (2016). Water changes in wheat spike during grain filling stage investigated by nuclear magnetic resonance. Transactions of the Chinese Society of Agricultural Engineering, 32, 98–104. [Google Scholar]
11. Masoni, A., Ercoli, L., Mariotti, M., Arduini, I. (2007). Post-anthesis accumulation and remobilization of dry matter, nitrogen and phosphorus in durum wheat as affected by soil type. European Journal of Agronomy, 26(3), 179–186. DOI 10.1016/j.eja.2006.09.006. [Google Scholar] [CrossRef]
12. Pei, D., Sun, Z., Chen, S., Zhang, X., Chen, S. et al. (2006). Effects of water stress on physiological and agronomic features of winter wheat. Transactions of the Chinese Society of Agricultural Engineering, 22, 68–72. [Google Scholar]
13. Shanmugam, S., Kjaer, K. H., Ottosen, C. O., Rosenqvist, E., Kumari Sharma, D. et al. (2013). The alleviating effect of elevated CO2 on heat stress susceptibility of two wheat (Triticum aestivum L.) Cultivars. Journal of Agronomy and Crop Science, 199(5), 340–350. DOI 10.1111/jac.12023. [Google Scholar] [CrossRef]
14. Wang, Y., Zhou, Y., Li, F., Su, Z., Han, Y. et al. (2013). Relationship between leaf temperature and water status in sorghum under drought stress. Agricultural Research in the Arid Areas, 31, 146–151. [Google Scholar]
15. Romano, G., Zia, S., Spreer, W., Sanchez, C., Cairns, J. et al. (2011). Use of thermography for high throughput phenotyping of tropical maize adaptation in water stress. Computers and Electronics in Agriculture, 79(1), 67–74. DOI 10.1016/j.compag.2011.08.011. [Google Scholar] [CrossRef]
16. Kalaji, H. M., Schansker, G., Ladle, R. J., Goltsev, V., Bosa, K. et al. (2014). Frequently asked questions about in vivo chlorophyll fluorescence: Practical issues. Photosynthesis Research, 122(2), 121–158. DOI 10.1007/s11120-014-0024-6. [Google Scholar] [CrossRef]
17. Zhang, Y., Zhang, Y., Wang, Z. (2011). Photosynthetic diurnal variation characteristics of leaf and non-leaf organs in winter wheat under different irrigation regimes. Acta Ecologica Sinica, 31, 1312–1322. [Google Scholar]
18. Mathobo, R., Marais, D., Steyn, J. M. (2017). The effect of drought stress on yield, leaf gaseous exchange and chlorophyll fluorescence of dry beans (Phaseolus vulgaris L.). Agricultural Water Management, 180, 118–125. DOI 10.1016/j.agwat.2016.11.005. [Google Scholar] [CrossRef]
19. Liao, J., Wang, G. (2014). Effects of drought stress on leaf gas exchange and chlorophyll fluorescence of Glycyrrhiza uralensis. Russian Journal of Ecology, 45(6), 532–538. DOI 10.1134/S1067413614060083. [Google Scholar] [CrossRef]
20. Wu, C., Lee, M., Peng, Y., Chou, T., Lin, K. et al. (2016). Chlorophyll fluorescence upper-to-lower-leaf ratio for determination of irrigation time for Pentas lanceolata. Photosynthetica, 54(2), 193–200. DOI 10.1007/s11099-015-0175-5. [Google Scholar] [CrossRef]
21. Brestic, M., Zivcak, M. (2013). PSII fluorescence techniques for measurement of drought and high temperature stress signal in crop plants: Protocols and applications. In Molecular Stress Physiology of Plants, pp. 87–131. India: Springer. [Google Scholar]
22. Guo, Y., Tian, S., Liu, S., Wang, W., Sui, N. (2018). Energy dissipation and antioxidant enzyme system protect photosystem II of sweet sorghum under drought stress. Photosynthetica, 56(3), 861–872. DOI 10.1007/s11099-017-0741-0. [Google Scholar] [CrossRef]
23. Wu, J., Wang, Z., Li, Y., Feng, W., Tian, W. et al. (2015). Flag leaf chlorophyll fluorescence characteristics and its response to drought stress in different cultivars of winter wheat. Journal of Triticeae Crops, 35, 699–706. [Google Scholar]
24. Meng, L. L., Song, J. F., Wen, J., Zhang, J., Wei, J. H. (2016). Effects of drought stress on fluorescence characteristics of photosystem II in leaves of Plectranthus scutellarioides. Photosynthetica, 54(3), 414–421. DOI 10.1007/s11099-016-0191-0. [Google Scholar] [CrossRef]
25. Hou, W., Wang, J., Hu, D., Feng, X. (2018). Effects of drought in post-flowering on leaf water potential, photosynthetic physiology, seed phenotype and yield of hulless barley in tibet plateau. Scientia Agricultura Sinica, 51, 2675–2688. [Google Scholar]
26. Shah, N., Paulsen, G. (2003). Interaction of drought and high temperature on photosynthesis and grain-filling of wheat. Plant and Soil, 257(1), 219–226. DOI 10.1023/A:1026237816578. [Google Scholar] [CrossRef]
27. Guóth, A., Tari, I., Gallé, Á., Csiszár, J., Pécsváradi, A. et al. (2009). Comparison of the drought stress responses of tolerant and sensitive wheat cultivars during grain filling: Changes in flag leaf photosynthetic activity, ABA levels, and grain yield. Journal of Plant Growth Regulation, 28(2), 167–176. DOI 10.1007/s00344-009-9085-8. [Google Scholar] [CrossRef]
28. Cheng, X., Zhang, F., Cai, S. (2010). Stomatal response of spring wheat and related affecting factors under different irrigation treatments. Chinese Journal of Applied Ecology, 21, 36–40. [Google Scholar]
29. Szegletes, Z., Erdei, L., Tari, I., Cseuz, L. (2000). Accumulation of osmoprotectants in wheat cultivars of different drought tolerance. Cereal Research Communications, 28(4), 403–410. DOI 10.1007/BF03543622. [Google Scholar] [CrossRef]
30. Farooq, M., Hussain, M., Siddique, K. H. (2014). Drought stress in wheat during flowering and grain-filling periods. Critical Reviews in Plant Sciences, 33(4), 331–349. DOI 10.1080/07352689.2014.875291. [Google Scholar] [CrossRef]
31. Yancey, P. H. (2005). Organic osmolytes as compatible, metabolic and counteracting cytoprotectants in high osmolarity and other stresses. Journal of Experimental Biology, 208(15), 2819–2830. DOI 10.1242/jeb.01730. [Google Scholar] [CrossRef]
32. Hao, W. (2013). Influence of water stress and rewatering on maize WUE and compensation effects (Ph.D. Thesis). Chinese Academy of Agricultural Sciences, China. [Google Scholar]
33. Chang, J., Yang, D., Tan, W., Lu, Y. (2008). Effects of water stress on maize leaf photosynthesis. Journal of Northeast Agricultural University, 39, 1–5. [Google Scholar]
34. Shen, Y. (2017). SPAD and photosynthetic characteristics of Juglans regia L leaves under different water stress (Master Thesis). Henan Agricultural University, China. [Google Scholar]
35. Dong, S., Zhao, K., Liu, L., Sun, C., Guo, Q. et al. (2011). Effect of drought stress on chlorophyll content and root activity of spring soybean. Soybean Science, 30, 949–953. [Google Scholar]
36. Liu, Z. (2011). Study on the physiological and photosynthetic character of rice (Oryza sativa L.) under high temperature and drought stress (Master Thesis). Southwest University, China. [Google Scholar]
37. Zhang, J., Jia, W., Yang, J., Ismail, A. M. (2006). Role of ABA in integrating plant responses to drought and salt stresses. Field Crops Research, 97(1), 111–119. DOI 10.1016/j.fcr.2005.08.018. [Google Scholar] [CrossRef]
38. Lawlor, D. W., Tezara, W. (2009). Causes of decreased photosynthetic rate and metabolic capacity in water-deficient leaf cells: A critical evaluation of mechanisms and integration of processes. Annals of Botany, 103(4), 561–579. DOI 10.1093/aob/mcn244. [Google Scholar] [CrossRef]
39. Plaut, Z., Butow, B., Blumenthal, C., Wrigley, C. (2004). Transport of dry matter into developing wheat kernels and its contribution to grain yield under post-anthesis water deficit and elevated temperature. Field Crops Research, 86(2–3), 185–198. DOI 10.1016/j.fcr.2003.08.005. [Google Scholar] [CrossRef]
40. Nawaz, A., Farooq, M., Cheema, S. A., Yasmeen, A., Wahid, A. (2013). Stay green character at grain filling ensures resistance against terminal drought in wheat. International Journal of Agriculture & Biology, 15, 1272–1276. [Google Scholar]