
 Submit a Paper
 Propose a Special lssue
 Open Access
ARTICLE

EGR1 inhibits clear cell renal cell carcinoma proliferation and metastasis via the MAPK15 pathway
Department of Urology, Shenzhen Longhua District Central Hospital, Shenzhen, 518110, China
* Corresponding Author: WEI LI. Email:
Oncology Research 2025, 33(2), 347-356. https://doi.org/10.32604/or.2024.056039
Received 12 July 2024; Accepted 12 October 2024; Issue published 16 January 2025
 View Full Text
 Download PDF
Abstract
Background: Clear cell renal carcinoma (ccRCC), the leading histological subtype of RCC, lacks any targeted therapy options. Although some studies have shown that early growth response factor 1 (EGR1) has a significant role in cancer development and progression, its role and underlying mechanisms in ccRCC remain poorly understood. Methods: The Cancer Genome Atlas (TCGA) database was utilized to examine the expression of EGR1 in ccRCC. The expression of EGR1 in 55 ccRCC tissues was evaluated using immunohistochemistry. The link between EGR1 expression and clinicopathological variables was examined through an analysis. Gain-of-function assays were employed to investigate EGR1’s biological functions in ccRCC cells, involving proliferation, colony formation, invasion assays, and tumorigenesis in nude mice. In order to assess the protein expression of mitogen-activated protein kinase 15 (MAPK15), E-cadherin, matrix metalloproteinase-9/-2 (MMP-9 and MMP-2), Western blot technique was applied. Results: The results revealed a decrease in EGR1 expression in ccRCC tissues. This decrease was strongly linked to TNM stage, lymphatic metastasis, tumor size, histological grade, and unfavorable prognosis in ccRCC patients. It has been demonstrated that overexpressing EGR1 inhibits the growth of xenograft tumors in vivo and inhibits cell colony formation, motility, and invasion in vitro. Furthermore, EGR1 can prevent the development and movement of ccRCC cells by controlling the expression of MMP-2, MMP-9, E-cadherin, and MAPK15. Conclusions: The EGR1/MAPK15 axis may represent a promising target for drug development, with EGR1 serving as a possible target for ccRCC therapy.Keywords
Renal cell carcinoma (RCC), which arises from the renal epithelium, is the predominant form of kidney cancer, and its incidence is on the rise [1]. RCC can be classified into several histological subtypes based on where it originates in the renal tubules. Clear cell renal cell carcinoma (ccRCC) is the most malignant subtype and the leading cause of cancer-related mortality [2]. The treatment of metastatic ccRCC has advanced significantly, with targeted drugs like sorafenib suppressing vascular endothelial growth factor (VEGF) and its receptor (VEGFR). However, the average 5-year survival rate for metastatic cases is only 10% [3,4].
Additionally, because there are rarely any early symptoms, many ccRCCs are discovered at an advanced stage. The unavailability of practical tumor markers in clinical practice makes diagnosing tumors difficult [5]. Therefore, studying the molecular characteristics of ccRCC and mining important biomarkers as potential targets for early diagnosis, monitoring, and treatment significantly impact the prevention and management of renal clear cell carcinoma.
The early growth response (EGR) gene family consists of four transcription factors containing zinc finger domains: EGR1, EGR2, EGR3, and EGR4 [6]. The EGR1 is the most crucial member of the EGR family [7,8]. The EGR1 transcription factor can bind to specific target genes and control their transcription because it has a zinc finger domain. Prior research has shown that EGR1 primarily functions during immunological responses, fibrosis, and tissue damage [9,10]. Recent findings reveal that EGR1 plays different regulatory roles in various tumor tissues, accelerating tumor development and expansion by enhancing cell proliferation, angiogenesis, and invasion, while also demonstrating cancer-inhibiting properties and inducing apoptosis in tumor cells [7]. Several researches suggest that EGR1 is implicated in developing resistance to cancer treatments [11,12]. As a transcription factor, EGR1 influences gene expression by either promoting or inhibiting the transcription of its target genes. Several tumor suppressor genes, including transforming growth factor β1, phosphatase and tensin homolog (PTEN), and tumor suppressor gene p53, are directly regulated by EGR1 [13–15]. Thus, understanding the function and molecular regulation of EGR1 in tumors holds significant theoretical and clinical importance.
Despite previous research showing a significant reduction of EGR1 protein in ccRCC tissues, the exact role of EGR1 and the molecular mechanism by which it regulates ccRCC progression is still unknown [16]. The present investigation used the TCGA database, clinical samples, and cell function tests to explore the function of EGR1 in ccRCC and its initial molecular regulation mechanism.
Firstly, the TCGA (https://tcga-data.nci.nih.gov/) (accessed on 11 October 2024) database was retrieved to analyze the expression profiles of EGR family members, including EGR1, EGR2, EGR3, and EGR4, in ccRCC transcriptome data. The parameters were log2Fold change > 1 and p < 0.01. Using the TCGA database, the clinical significance of EGR1 in ccRCC was evaluated, such as its relationship with survival rates.
Data analysis and immunohistochemistry (IHC) staining
The ccRCC genes found to be differentially expressed were from the TCGA database. Shanghai Outdo Biotech Co., Ltd. (Shanghai, China) also supplied a tissue array with follow-up data comprising 55 pairs of ccRCC samples and paired neighboring normal renal tissues.
IHC staining was performed following the previously published protocol [17]. In brief, the sections were exposed to an anti-EGR1 antibody (1:100 dilution, Abcam, ab6054, Abcam, UK) for an extended period at a temperature of 4°C. Afterwards, the sections were seen using a 3, 3-diaminobenzidine (DAB) kit (T15132, Shanghai Shangbao Biotechnology Co., Ltd., Shanghai, China). Two pathologists, blinded to the origins of the samples and patient outcomes, assessed all IHC samples independently. Two middle-ranking doctors in the pathology department reviewed the histochemical section separately. The reading content includes the expression localization of EGR1.
The overall score was determined by multiplying the degree of staining (absence of staining = 0; weak staining = 1 point; moderate staining = 2 points; intense staining = 3 points) with the percentage of cells showing positive staining (3 points for >75%; 2 points for 50%~75%; 1 point for 25%~50%; 0 points for <25%). Expressions with scores over 4 were categorized as high, while expressions with 4 or less were classified as low.
Transfection and cell culture assay
As previously pointed out, the human ccRCC cell lines (A498, 796-P, 786-O, and ACHN) and normal proximal tubule epithelial cell line HK-2 were employed [17]. 796-P and 786-O were cultured on Dulbecco’s Modified Eagle Medium (12491015, DMEM, Gibco, Carlsbad, CA, USA). A498, HK-2 and ACHN were cultured in RPMI 1640 (C0893, Beyotime Biotech, Shanghai, China) containing 10% fetal bovine serum (FBS, 12103, Sigma-Aldrich, St. Louis, MO, USA), 100 U/mL penicillin, and 100 ug/mL streptomycin (C0222, Beyotime Biotech, China) in an incubator with 5% CO2. After testing, it was determined that none of the cell lines had Mycoplasma. According to the EGR1 sequence (Gene ID: 1958), pcDNA3.1-EGR1 (OV-EGR1) and control vector (Control-EV) were constructed by Genechem (Shanghai, China). Each well of the 6-well plates received 2 × 10⁵ cells for plating. Once the cell culture achieved 80% confluence, it was infected with lentiviruses overexpressing EGR1 at a multiplicity of infection (MOI = 10) following the instructions outlined by the manufacturer. Following 48 h, the effectiveness of transfection was assessed using Western blot (WB) and quantitative RT-PCR (qRT-PCR) assays.
RNA extraction and qRT-PCR assays
TRIzol reagent (15596026, Thermo Scientific, Waltham, MA, USA) was used to prepare cells for total RNA isolation following the instructions outlined by the manufacturer. The RNA quantity and purity were determined by measuring absorbance at 260 and 280 nm using the NanoDrop 2000 (Thermo Scientific, MA, USA). Following manufacturer directions, the SuperScript III First-Strand Synthesis Kit (18080-051, Thermo Scientific, MA, USA) synthesized cDNA. The mRNA levels were measured in real-time using the Bio-Rad iQ5 Real-Time PCR System(170-9780, Bio-Rad, Hercules, CA, USA) and GAPDH as the reference gene. The 2−ΔΔCt approach was applied to determine the amounts of target mRNA, with experiments conducted in triplicate [18]. Primer sequences were based on those reported in a previous study [15]. The primer sequences are given below:
EGR1 forward: ′-CTGCGACATCTGTGGAAGAAA-3′, EGR1 reverse: 5′-TGTCTGCTTTCTTGTCCTTCTG-3′, GAPDH forward: 5′-GGAGCGAGATCCCTCCAAAAT-3′; GAPDH reverse: 5′-GGCTGTTGTCATACTTCTCATGG-3′.
EGR1’s effect on ccRCC cell proliferation was measured with the MTT assay, as detailed in the previously reported protocol [17]. In summary, after being digested, 200 μL of transfected ccRCC cells were added to each well of 96-well plates, resulting in a density of 2.0 × 10³ cells per well. Then, 10 μL of 5 mg/mL of MTT solution (No. 23934, Sigma-Aldrich, MO, USA) was added to the cells after culture at different times (1 day, 2 day, 3 day and 4 day). To dissolve the crystals, 100 μL of DMSO was substituted for the medium. The plate was subsequently agitated for 10 min. After that, the absorbance was determined using a microtiter plate reader (BIO-TEK Instruments, Winooski, VT, USA) at a wavelength of 590 nm.
ccRCC cells that had been transfected were trypsinized and dispersed into 6-well plates at 600 cells per well density and a volume of 2 mL per well. The culture was cultured in a constant temperature medium of 37°C and 5% CO2, and every three days, the medium was changed. After 14 days, fix cells for 60 min using 1 mL of 4% paraformaldehyde (P0099, Beyotime Biotech, China) at a temperature of 4°C, wash with Phosphate-Buffered Saline (1 × PBS) (C0221A, Beyotime Biotech, China), and stain with 0.1% crystal violet for 2 min. Photographs of the 6-well plates were taken, and visible colonies with more than 50 cells were examined.
The ccRCC cells that had undergone transfection were enzymatically digested and 5 × 10⁴ cells were placed into 6-well plates. A 200 μL micropipette tip created a straight wound in the completely confluent monolayer of cells after a 12-h growth period (in RPMI 1640 containing 10% FBS). The area was then washed with PBS to eliminate any cellular waste. Cell migration was identified after a 24-h incubation period using a 40 × magnification microscope (CK40, Olympus Corporation, Tokyo, Japan). The inhibitory impact was seen upon normalization, with the quantity for the control group set as 100%.
Cell migration and invasion assays
To assess the migration and invasion capabilities of transfected ccRCC cells, the cells were digested and seeded into a transwell insert designed for a 24-well plate featuring an 8 μm pore size (Corning, NY, USA). For migration assays, 2.5 × 10⁴ transfected ccRCC cells were introduced into the transwell insert. The invasion tests were conducted using a similar procedure, except the upper chambers of the 24-well inserts were covered with Matrigel (356225, BD Biosciences, Bedford, MA, USA) at a 200 mg/mL concentration. The cells relocated to the lower chamber were treated with a 0.1% solution of crystal violet (C0121, Beyotime Biotech, China) to produce a stain after being incubated for 48 h at 37°C. A light microscope (CK40; Olympus Corporation, Tokyo, Japan) was used to examine the stained cells at a magnification of 200×. Images were taken, and cell counting was performed randomly across five fields, with the results averaged for analysis.
Proteins were extracted following a previously established protocol [17]. The protein concentration was determined using the BCA Protein Assay Kit (23225, Pierce, Rockford, IL, USA). The protein was evenly distributed onto 12% SDS-PAGE gels to be separated and transferred to polyvinylidene difluoride (PVDF) membranes (IPVH00010, Millipore Co., Billerica, MA, USA) by electroblotting, with equal amounts of protein loaded. For 1 h at room temperature (RT), 5% non-fat dry milk was used to block the membranes. Primary antibodies were then applied overnight at a temperature of 4°C, including anti-EGR1 (ab6054, 1:1000, Abcam, Cambridge, UK), anti-E-cadherin (EP700Y, 1:800, Abcam, Cambridge, UK), anti-MMP-9 (JA80-73, 1:1000, Thermo Fisher Scientific, USA), anti-MMP-2 (#4022, 1:1000, CST, USA), and anti-GAPDH (ab8245, 1:1000, Abcam, Cambridge, UK). On the following day, the membranes were exposed to secondary antibodies (AS014,Abclonal, Wuhan, China) linked to HRP at a dilution of 1:3000. The incubation took place at RT for 1 h. Enhanced chemiluminescence (ECL) (ECL-F-100, Yanxi Biotechnology Co., Ltd., Shanghai, China) reagents were used to detect protein bands, with beta-actin as the internal reference, and then analyzed using Image J software (version 1.8.0, National Institute of Health, Bethesda, MD, USA).
Guangdong Medical University approved all in vivo investigations, which complied with the procedures established for the Care and Use of Laboratory Animals (Approval No. GDY2102011). A total of ten 4-week-old male BALB/c nude mice were obtained from the Guangdong Medical Laboratory Animal Center in Guangzhou, China. The mice had a weight ranging from 18 to 20 grams and were housed under specific pathogen-free conditions following the ARRIVE guidelines.
The mice were randomly divided into 2 groups (n = 5) using a random number table method. The transfected ccRCC cells (786-O) were digested, and 105 cells suspended in 100 μL of PBS were injected under the skin of nude mice. Tumor volumes were calculated 12 days afterwards with the formula volume (mm3) = L × W2 × 0.5, where L represents the length, and W represents the width. After 30 days, nude mice were killed using 100% CO2 for 5 min. Then the tumor was surgically removed and weighed.
Statistical analysis of the two groups was conducted using GraphPad Prism 9.0 software (La Jolla, USA). Quantitative data are presented as mean ± standard deviation (SD), and comparisons between groups were made using the student’s t-test. Categorical data are expressed as counts (n), and comparisons between groups were analyzed using the chi-square test. The survival curves were plotted using the Kaplan-Meier method. To investigate differences across groups, the log-rank test was used. The multivariate analysis found the independent prognostic factors through the Cox proportional hazard model. The statistical significance was indicated by a p-value < 0.05.
Decreased EGR1 levels in ccRCC
Firstly, the TCGA database was employed to evaluate the expression profiles of EGR family members, including EGR1, EGR2, EGR3, and EGR4, in ccRCC transcriptome data. The finding revealed that compared with the paracancer (normal) tissues, only EGR1 was significantly reduced in ccRCC tissues (Figs. 1A, A1) (p < 0.05). The ccRCC tissues’ EGR1 levels were much lower, as shown by the IHC staining (Fig. 1B) (p < 0.01). These findings demonstrated that the EGR1 protein was substantially reduced in ccRCC tissues compared to adjacent normal renal tissues.
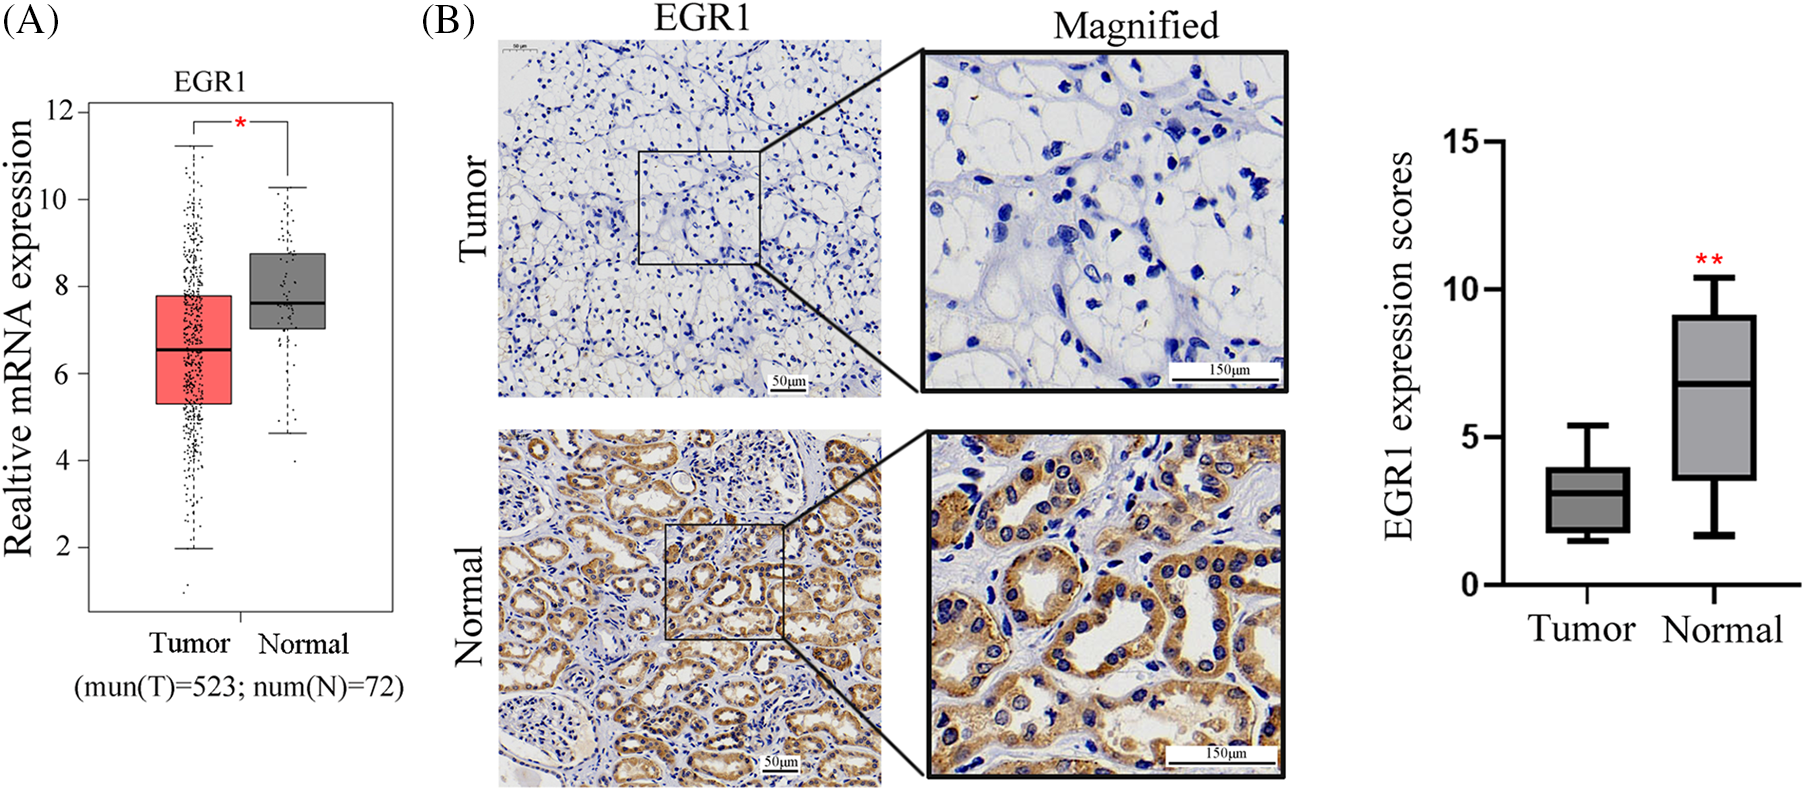
Figure 1: EGR1 expression in ccRCC tissues. The figure shows (A) the EGR1 mRNA expression in ccRCC tissues and para-cancerous tissues analyzed in TCGA data and (B) the IHC of EGR1 expression in ccRCC tissues, n = 55. T: tumor, N: Normal. *p < 0.05, **p < 0.01.
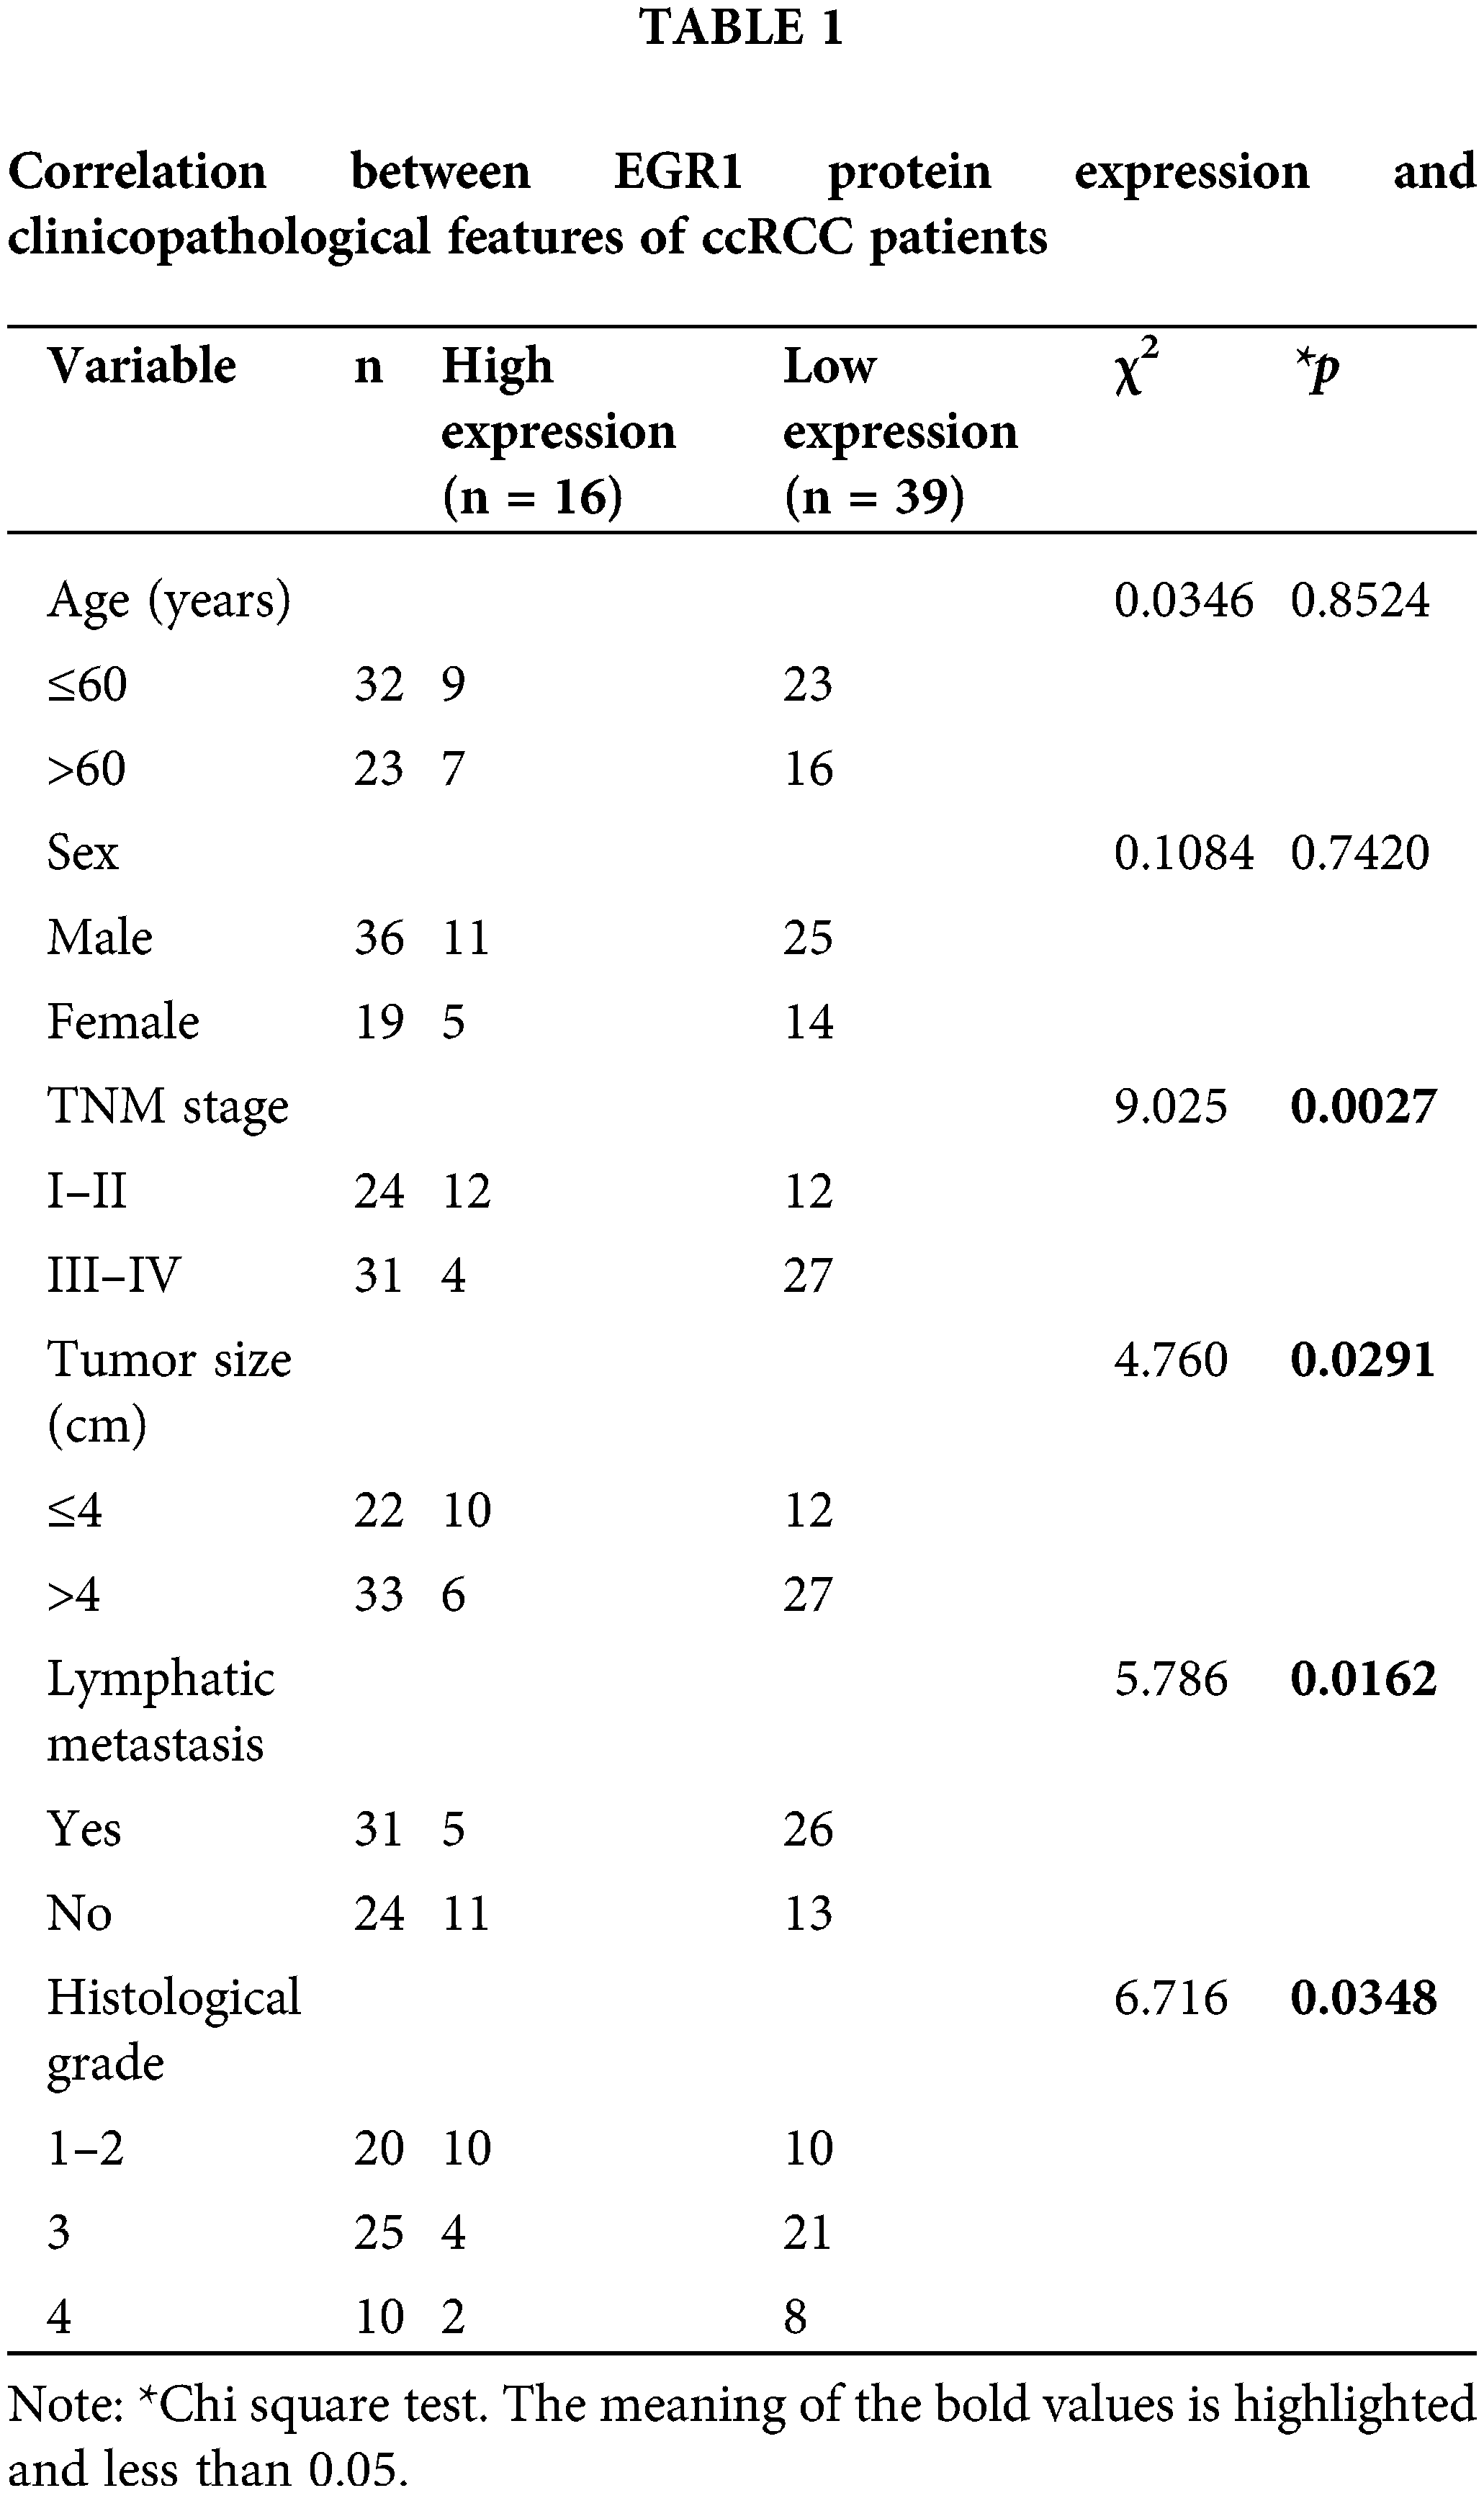
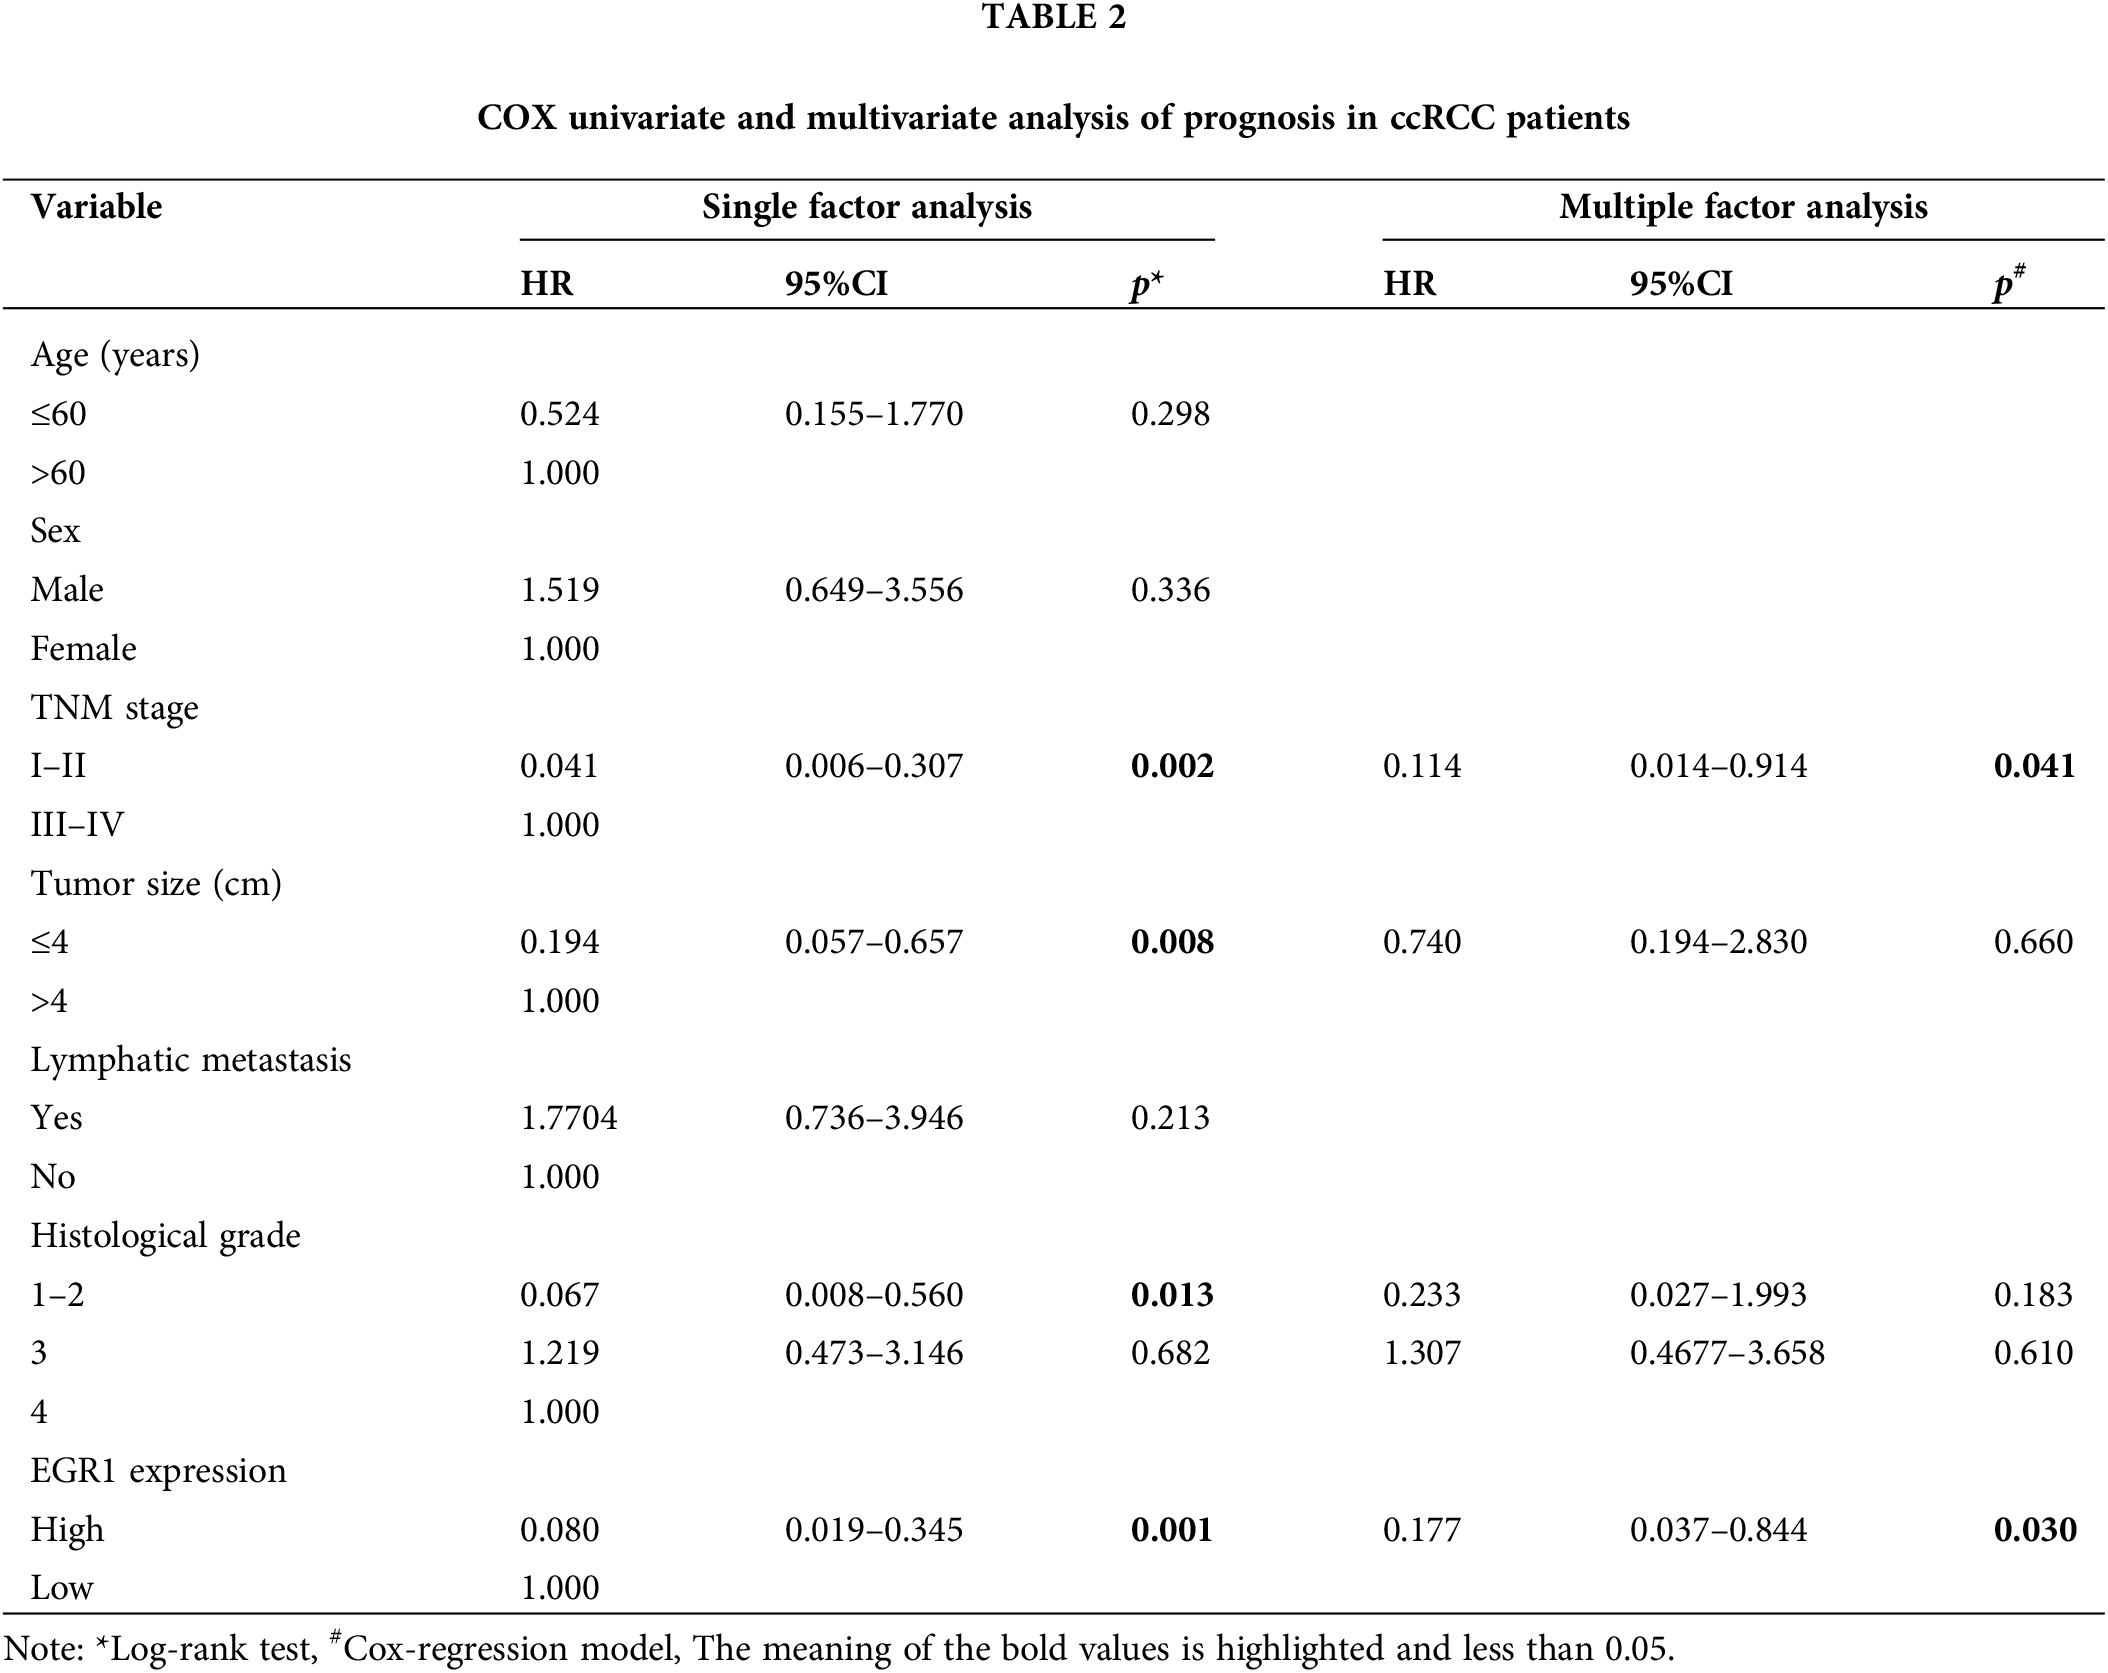
A total of 55 ccRCC patients were divided into two groups based on the immunohistochemistry EGR1 scores: the high EGR1 expression group (n = 16) (scores >4 are considered a high expression) and the low EGR1 expression group (n = 39) (scores <4 are considered a low expression). The current investigation assessed the association between the clinicopathological characteristics of patients with ccRCC and EGR1 expression. The analysis revealed that EGR1 expression was unrelated to age or sex (p > 0.05). Nevertheless, EGR1 expression is associated with histological grade, lymphatic metastasis, tumor size, and TNM stage in patients (p < 0.05) (Table 1). In the univariate survival analysis, it was found that TNM stage, tumor size, histological grade, and EGR1 expression are factors influencing the prognosis of ccRCC patients (p < 0.05) (Table 2). Further multivariate analysis revealed that TNM stage and EGR1 expression are independent risk factors affecting the prognosis of ccRCC (p < 0.05) (Table 2).
Additionally, the Kaplan-Meier survival curves based on the TCGA database showed that participants with elevated EGR1 expression reported a higher OS rate than patients with lower EGR1 expression (Fig. 2A). The survival curves for both patient groups were produced through the Kaplan-Meier technique. These findings suggested that in ccRCC, reduced EGR1 expression was substantially linked to a lower OS rate (p = 0.046) (Fig. 2B).
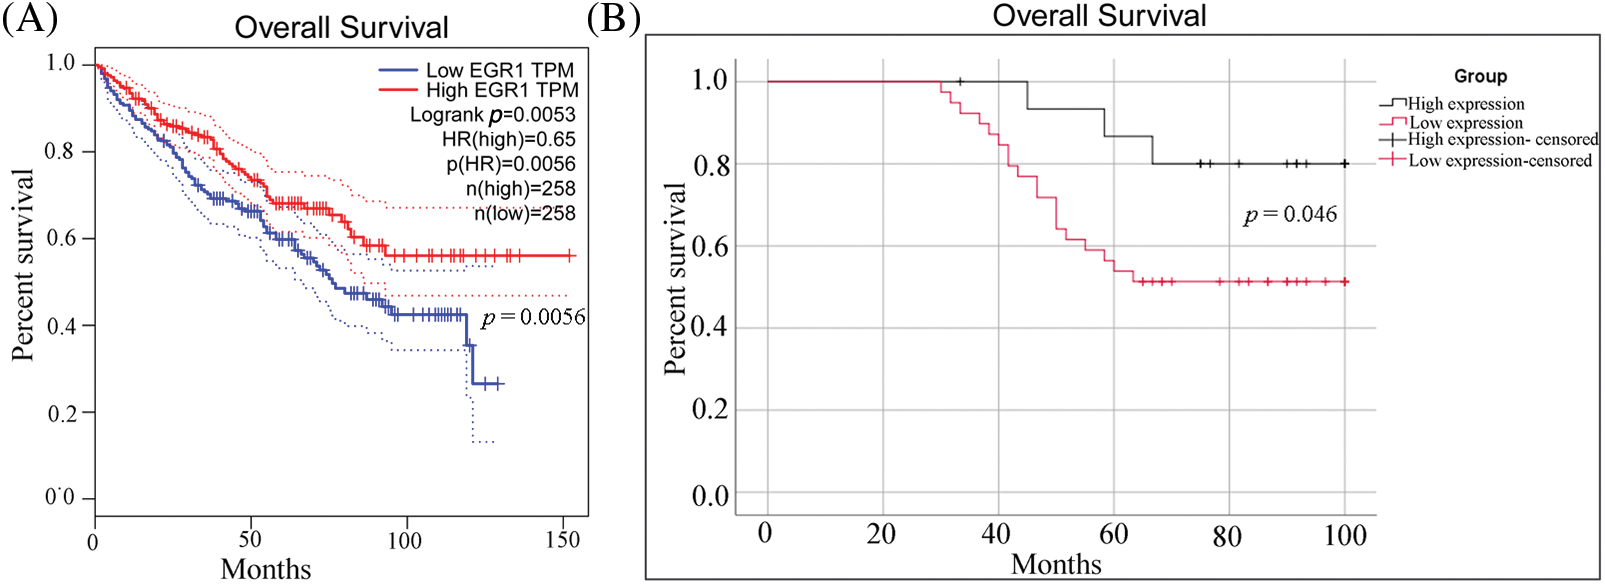
Figure 2: The OS curve for ccRCC patients with different levels of EGR1 expression. (A) The OS survival curves of EGR1 in the TCGA database. (B) The OS survival curves of EGR1 in ccRCC patients according to EGR1 expression based on IHC staining.
Overexpression of EGR1 inhibited the growth of ccRCC
The EGR1 expression in ccRCC cell lines (A498, 786-O, 796-P, ACHN) and renal tubular epithelial cells (HK-2) was assessed using fluorescence qPCR and WB analysis. These findings demonstrated that the EGR1 levels in the ccRCC cell lines (A498, 786-O, 796-P, and ACHN) were significantly lower (Fig. 3A,B). In order to further elucidate the function of EGR1 in ccRCC cells, OV-EGR1 and blank Control (control-EV) were synthesized and transfected into 796-P and 786-O cells. Analysis of gene and protein expression revealed that following transfection with the OV-EGR1, the level of EGR1 in 796-P and 786-O cells was higher than in the control-EV (Fig. 3C,D) (p < 0.01). The MTT assay results showed that the OV-EGR1 prevented the growth of ccRCC cells than the control-EV group (Fig. 3E) (p < 0.05). Furthermore, OV-EGR1 substantially reduced colony counts compared to the control-EV group (Fig. 3F).
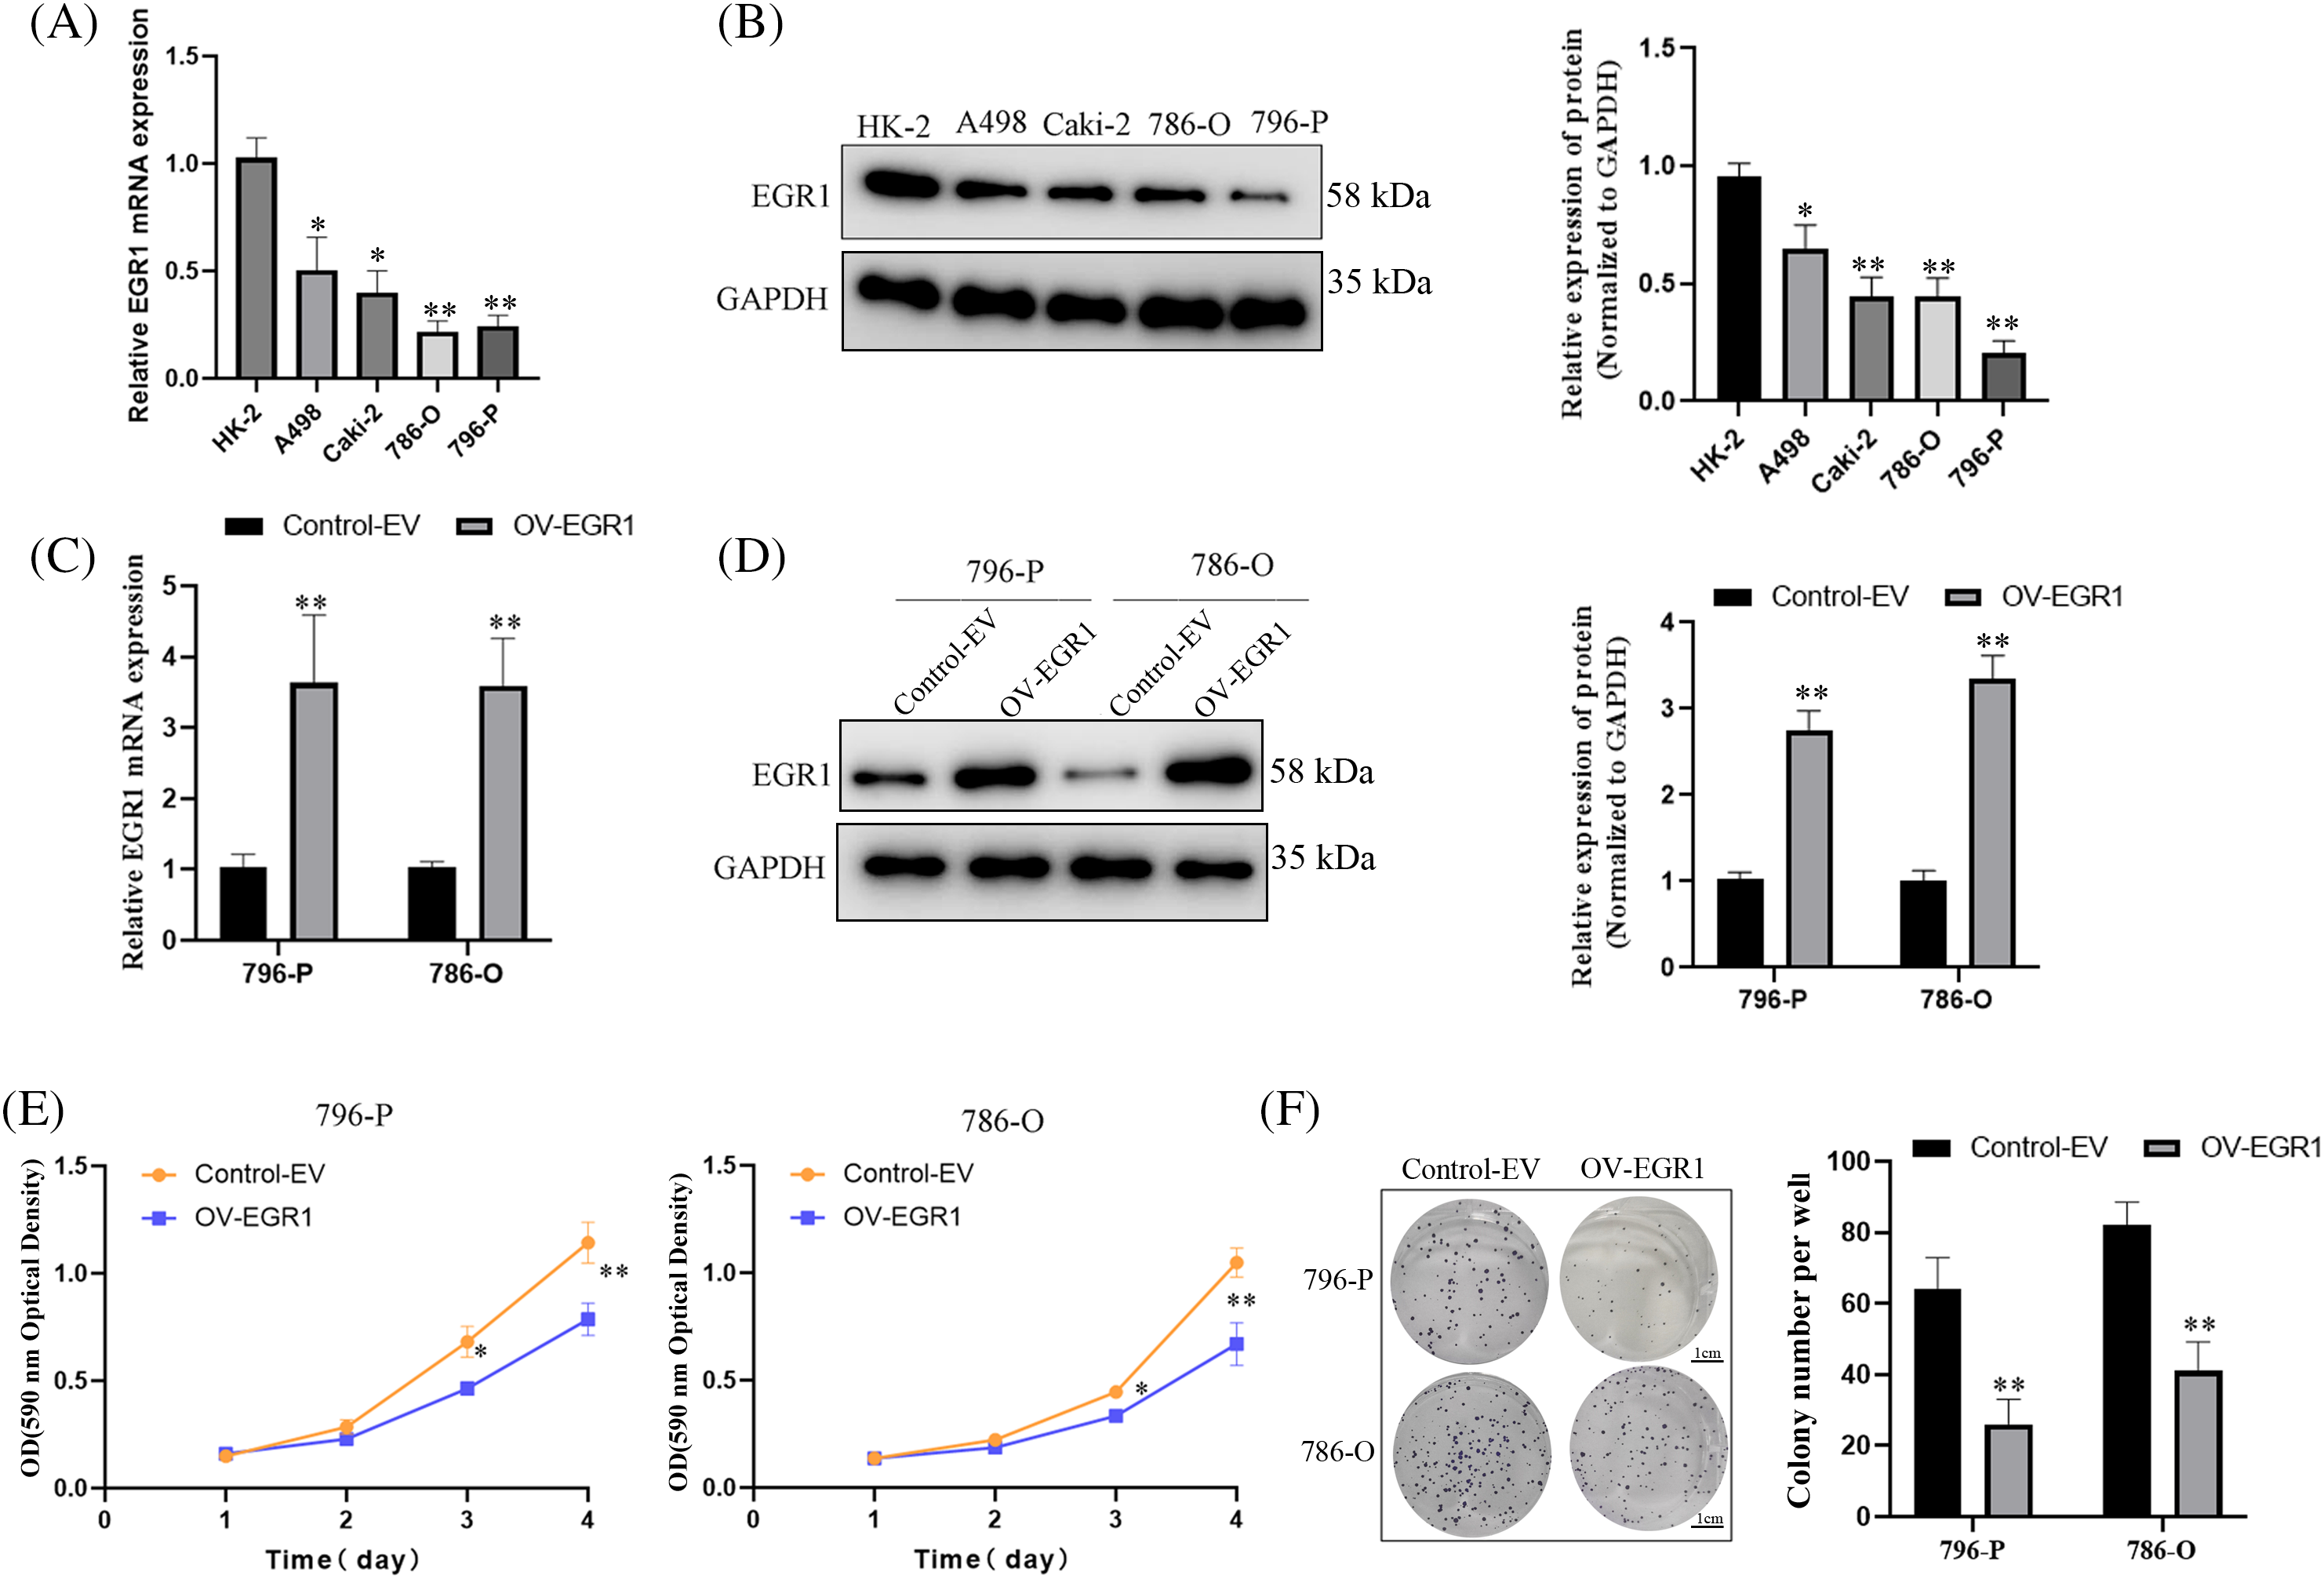
Figure 3: Effect of overexpressed EGR1 on ccRCC proliferation. Overexpression of EGR1 can inhibit ccRCC cell proliferation. (A, B) The EGR1 protein and mRNA expression in ccRCC and HK-2 cells. (C, D) The EGR1 protein and mRNA expression in transfected cells and blank Control (Control-EV). (E) The effect of overexpression EGR1 on ccRCC (786-O and 796-P) cells; and (F) The impact of overexpressed EGR1 on ccRCC (786-O and 796-P) cells colony formation. *p < 0.05, **p < 0.01.
EGR1 overexpression prevented ccRCC cells from migrating and invading
Initially, a wound-healing experiment was carried out for ascertaining the effect of EGR1 on ccRCC cell motility. The results of Fig. 4A,B demonstrate that cells that overexpressed EGR1 had much less motility than the control group (p < 0.05). The transwell assay showed that, in comparison to the Control-EV group, EGR1 overexpression significantly decreased the migration and invasion of ccRCC cells (p < 0.01) (Fig. 4C,D).
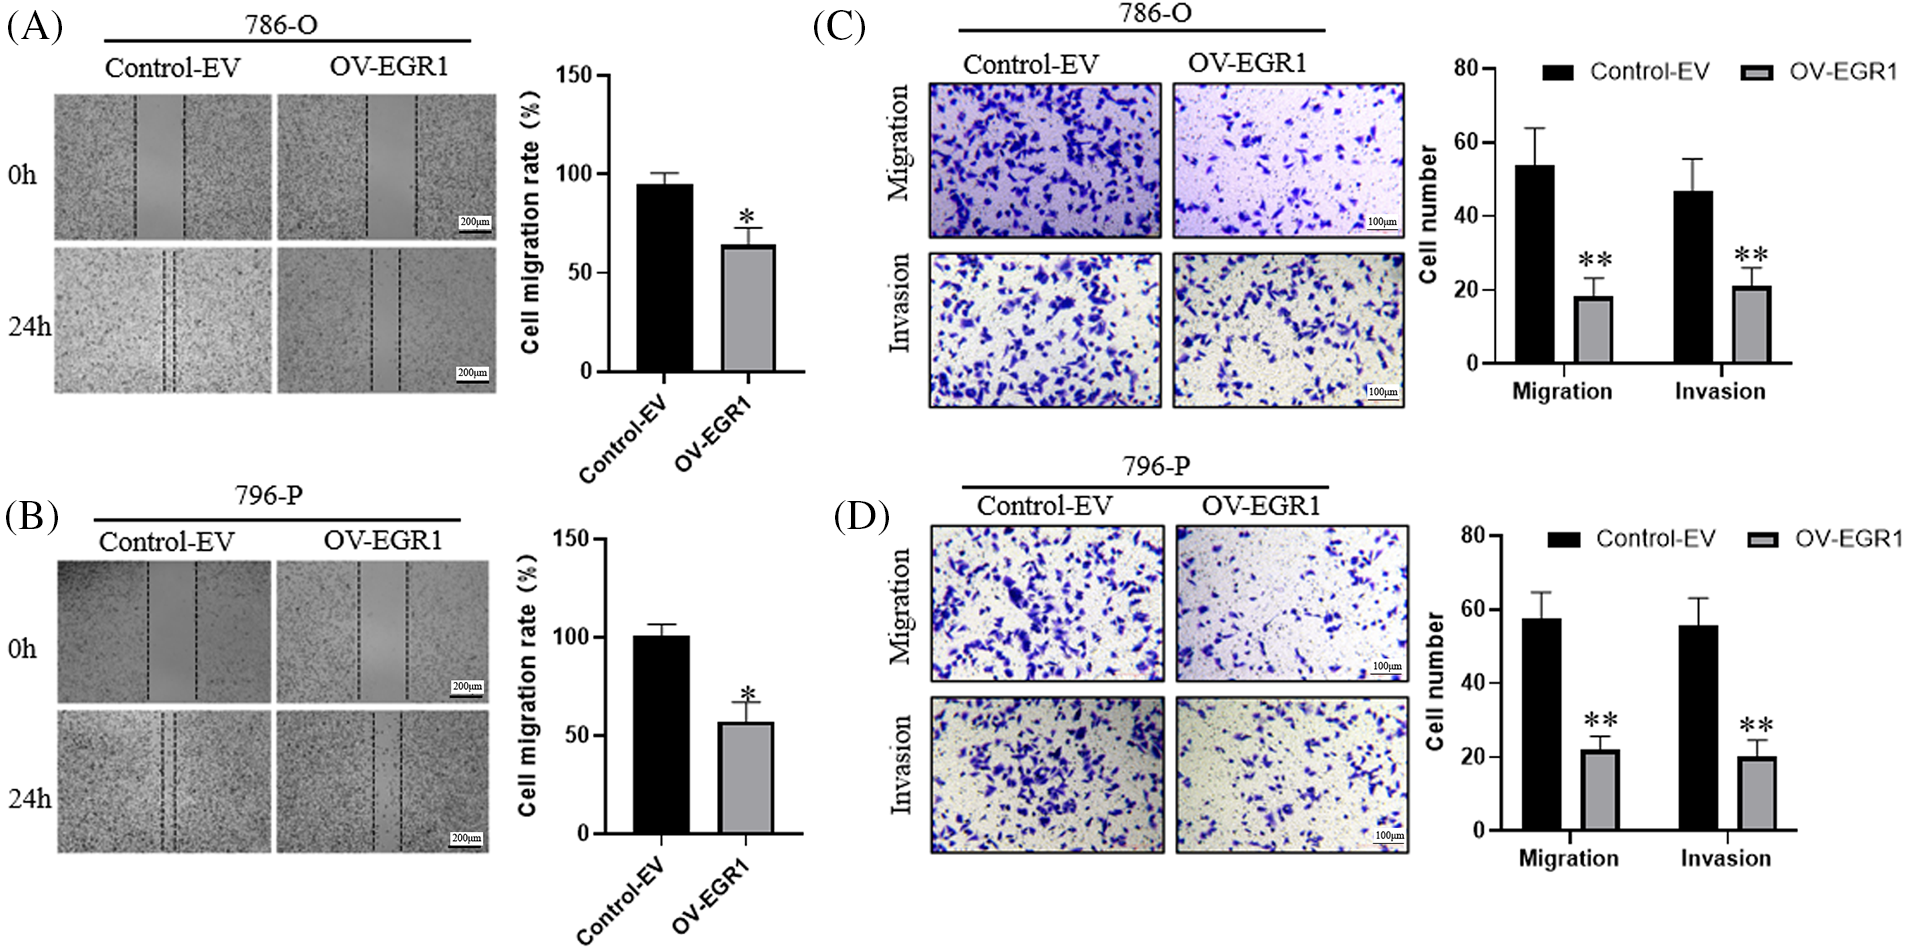
Figure 4: Inhibitory Effect of Overexpression of EGR1 invasion and migration of ccRCC cells. (A–B) Overexpression of EGR1 can inhibit ccRCC cells (786-O and 796-P) migration, (C, D) Overexpression of EGR1 could inhibit ccRCC (786-O and 796-P) cells migration and invasion. *p < 0.05, **p < 0.01.
EGR1 affects MAPK15 signaling in ccRCC cells
Kinase interactions (KEA) with EGR1 were predicted using the online Harmonizome website (https://maayanlab.cloud/archs4/gene/EGR1#correlation, accessed on 11 October 2024) to delve deeper into the molecular mechanism of EGR1 influencing ccRCC cell proliferation, invasion, and migration. The findings indicated a significant relationship between MAPK15 and EGR1 expression, as seen in Fig. 5A. The WB analysis showed that, compared to the Control-EV group, the enhanced expression of EGR1 significantly inhibited the expression of MAPK15 in ccRCC cells (Fig. 5B) (p < 0.01). Previous studies have shown that MAPK15 influences tumour cells’ migratory and invasive capabilities via modulating the MMPs pathway [19,20]. Comparing the overexpressed EGR1 group to the Control group, WB analysis showed a significant increase in E-cadherin and decrease in MMP-2 and MMP-9 expression (Fig. 5C) (p < 0.01). The results indicate that EGR1 affects the ccRCC cell migration and development through activation of MAPK15.
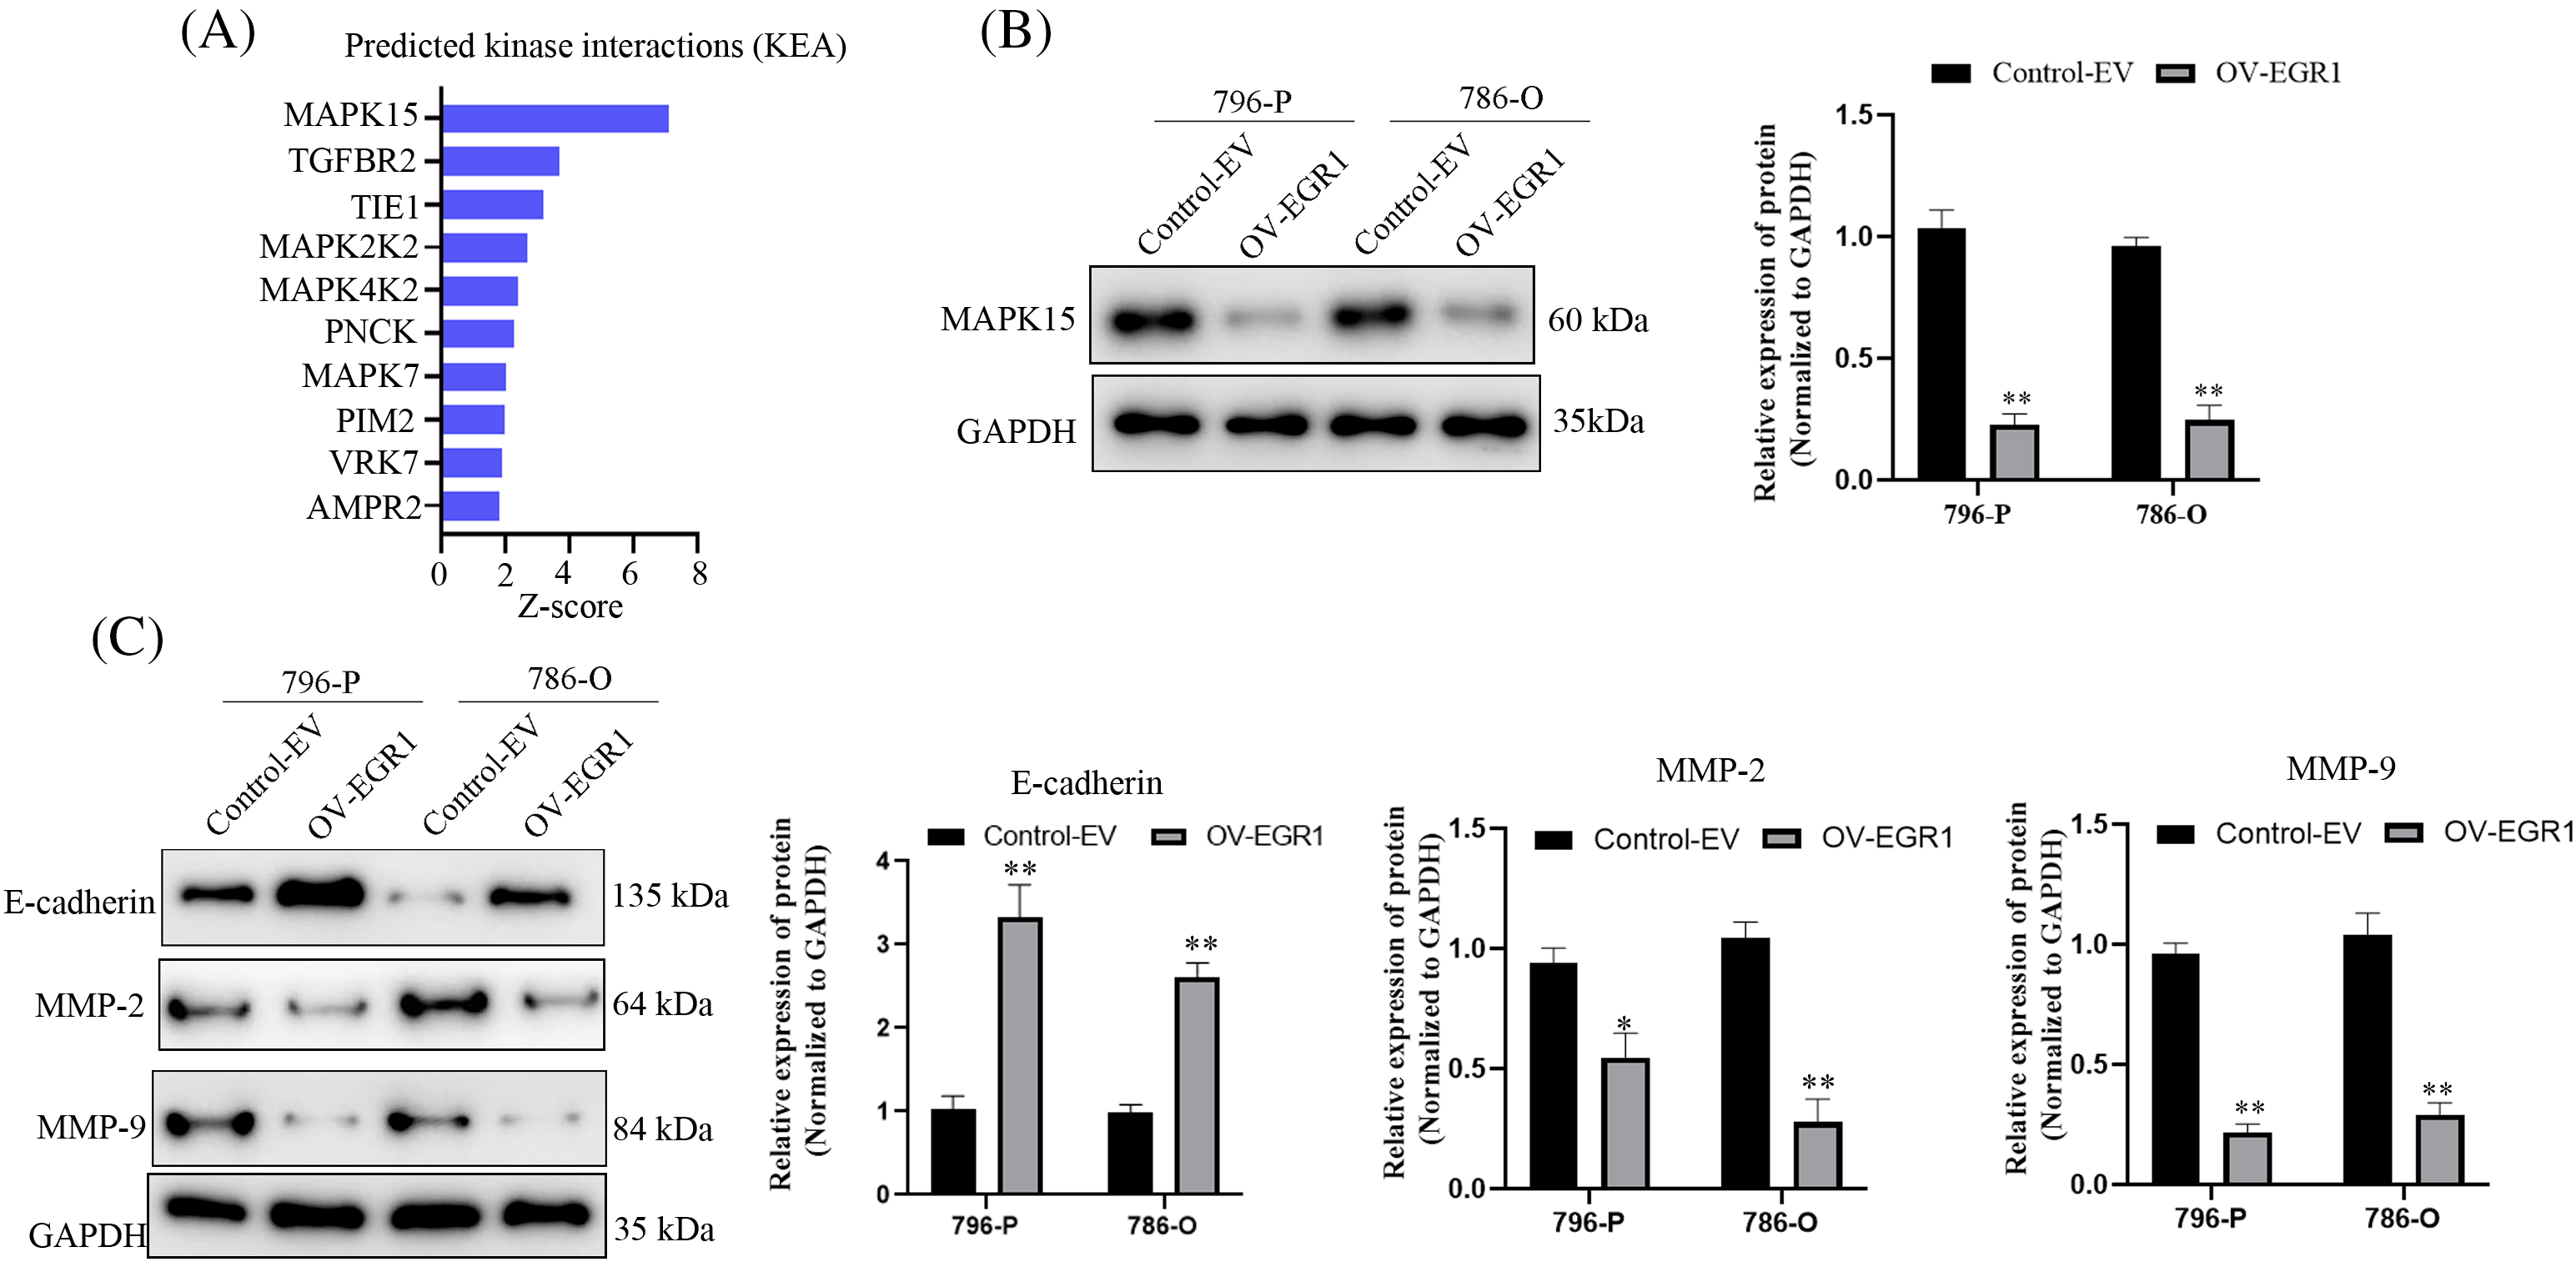
Figure 5: EGR1 affects MAPK15 signaling in ccRCC cells. Figure represents (A) Online Harmonizome (https://maayanlab.cloud/archs4/gene/EGR1#correlation) (accessed on 11 October 2024) predicts kinases that may be affected by EGR1. (B) WB analysis showing the impact of overexpression of EG1 on MAPK15 expression. (C) The effect of overexpression of EG1 on E-cadherin, MMP-9 and MMP-2 expression. *p < 0.05, **p < 0.01.
Overexpression of EGR1 inhibited the ccRCC cells’ growth in vivo
To further demonstrate that EGR1 affects ccRCC cell proliferation in vivo. The subcutaneous tumor xenograft experiment performed with nude mice showed that tumors derived from cells with elevated EGR1 expression had a significantly reduced volume compared to those formed from control cells (Fig. 6A,B). Moreover, substantially lower tumor weight was observed in the OV-EGR1 tumor group (Fig. 6C) (p < 0.01). Therefore, Overexpression of EGR1 can suppress ccRCC progression by inhibiting malignant proliferation.
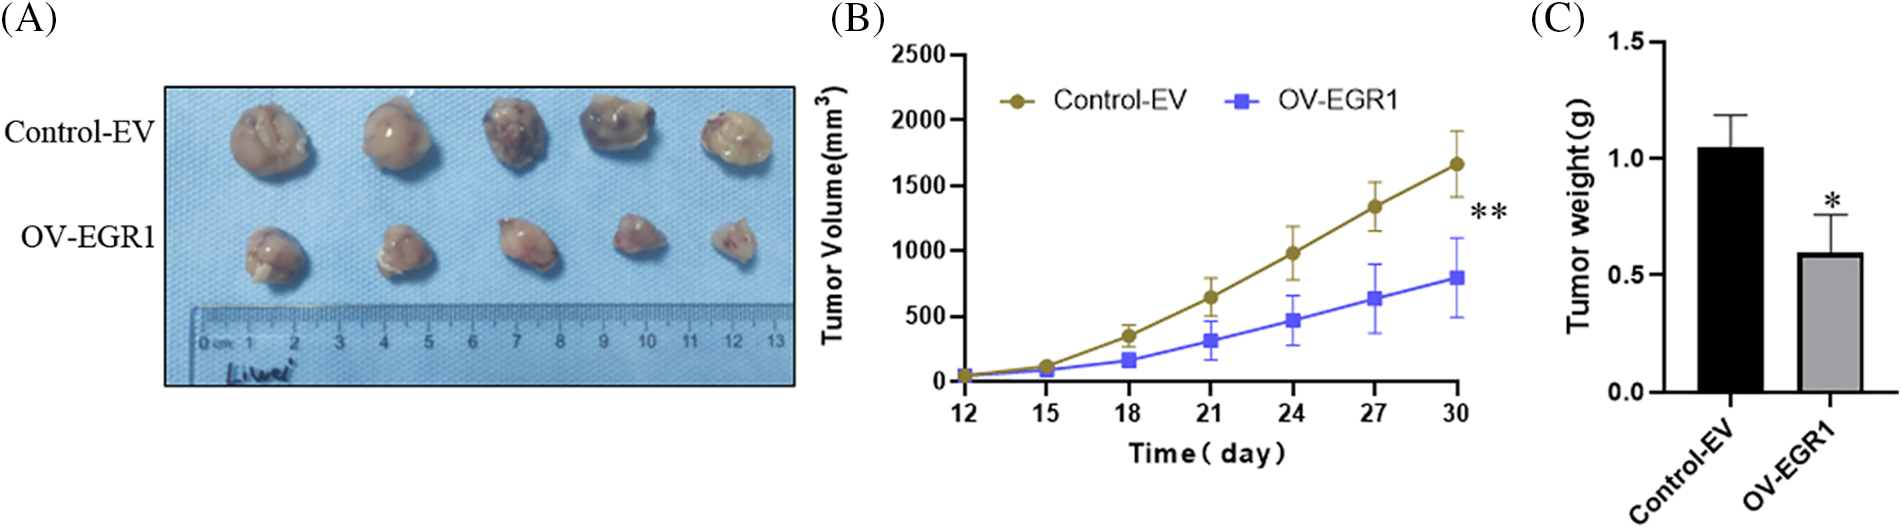
Figure 6: Effect of Overexpression of EGR1 on inhibition of ccRCC cell growth in vivo. (A) The representative tumor formation images of each group after 30 days, (B) Measuring tumor volume every three days until thirty days. (C) The tumor weight determined thirty days later. *p < 0.05, **p < 0.01.
A recent study has indicated that EGR1, a key EGR family member, is crucial to cancer development and spread. It may also be participating in tumour cell invasion, angiogenesis, metastasis, and proliferation [7]. Nonetheless, EGR1 plays various roles in malignancies, such as promoting or inhibiting tumors. For instance, EGR1 increased pancreatic cancer’s liver metastasis through the P300/SNAI2 pathway [21]. Elevated EGR1 expression enhanced proliferation, invasion, and stemness by upregulating SOX9 in uterine cervical cancer cells [22]. In certain cancers, including breast cancer and hepatocellular carcinoma, EGR1 has been found to inhibit cancer cell growth and migration [23,24]. It is unknown if EGR1 promotes or suppresses tumor growth in ccRCC. These results showed that the expression of EGR1 was reduced in both ccRCC tissues and cells. Functional experiments additionally revealed that colony formation, cell motility, and invasion were all inhibited by ectopic EGR1 expression. Surprisingly, EGR1 can promote E-cadherin expression and inhibit MMP-9and MAPK15 expression levels.
Depending on the kind of cancer, EGR1 has been shown to have both tumor-promoting and tumor-suppressive properties. For instance, EGR1 has been documented to suppress migration and proliferation in breast cancer and hepatocellular carcinoma cells [23,24]. Conversely, in other cancers, EGR1 can enhance stemness and predict poor outcomes in uterine cervical cancer by promoting SOX9 expression [22]. These contrasting effects may be attributed to tumor heterogeneity or variations in genetic backgrounds. Tumor cells and the surrounding environment are influenced by tumor oncogenes in different ways, making the diversity among cancer cell populations an essential challenge in oncology. This observation might be attributed to tissue and cell-specific factors. EGR1 expression in ccRCC was assessed using an IHC assay to investigate further. According to the findings, EGR1 was strongly suppressed in ccRCC tissues. It was strongly correlated with the degree of differentiation, poor prognosis, metastasis of lymph nodes, and TNM stage for ccRCC patients. These results imply that EGR1 might function as a stand-alone ccRCC prognostic marker. Functional assays also indicated that excessive EGR1 expression reduced cell colony formation, stemness, and invasion. These results imply that EGR1 is a tumor suppressor that regulates ccRCC proliferation, invasion, and stemness.
Previous research has also indicated that EGR1 is crucial in various signaling pathways. In the cancer cells of the bladder, EGR1 promoted cell migration, invasion, and gemcitabine resistance by regulating SOX5 [25]. EGR1 has been shown to accelerate prostate cancer metastasis via the PI3K/PTEN/Akt pathway [26]. According to the current data, there is a substantial relationship between MAPK15 and EGR1 expression, with an apparent decrease in MAPK15 levels following EGR1 overexpression. MAPK15, the latest identified member of the MAPK family, is recognized for its upregulation across various cancer types [27]. It has been discovered that MAPK15 overexpression, an oncogene, stimulates the growth of gastric cancer cells by maintaining c-Jun expression [28]. MAPK15 is associated with lymph node metastasis and stimulates lung adenocarcinoma cell movement through prostaglandin E2 receptor and NF-κB p50 signaling [29]. The MAPK15 also promotes cell proliferation and protects against DNA damage in male germ cell tumors [30]. The current findings, which align with prior reports, show that MAPK15 is inhibited by exogenous expression of EGR1, which reduces ccRCC cell proliferation, migration, and invasion. Evidence from previous studies suggests that MAPK15 facilitates osteosarcoma invasion cell migration via modulation of MMP-9 expression [19]. MAPK15 regulates initial ciliogenesis in medulloblastoma cells, controlling hedgehog signaling [31]. The present findings also show that the increased expression of EGR1 effectively suppressed MMP-9/2 expression and promoted E-cadherin expression.
There are still limitations of this study. First, the present study revealed that overexpressing EGR1 diminished the MAPK15 expression level. Nevertheless, the precise methods by which EGR1 inhibits MAPK15 expression remain unclear. It is commonly recognized that EGR1 functions primarily as a transcription factor by binding to appropriate binding sites found in the regulatory regions of several genes [12,32]. So, in the following study, we will further explore using different experimental methods (such as chromatin immunoprecipitation and luciferase reporter gene). Secondly, this study identified EGR1 as an anti-metastatic gene in ccRCC cancer cells, showing its ability to inhibit cell migration and invasion. Although downstream targets such as E-cadherin and MMP-9/2 were examined, the analysis was insufficient. This study did not include other critical factors involved in cell migration and invasion, including N-cadherin, vimentin, snail, and twist.
In conclusion, EGR1 is a potential prognostic biomarker for ccRCC. Elevated levels of EGR1 reduce cell proliferation, invasion, and stemness by downregulating MAPK15 expression. As a result, the results imply that focusing on the EGR1-MAPK15 pathway may offer a unique treatment strategy for ccRCC.
Acknowledgement: We want to thank all the investigators, including the physicians, nurses, and laboratory technicians in this study.
Funding Statement: The work was supported by grants from the Shenzhen Basic Research Project (JCYJ20210324125803008) and the Shenzhen Longhua District Science and Innovation Bureau Fund for Medical Institutions (2022143). The above funding listed did not have a role in the study’s design, the collection, analysis, and interpretation of data, and the writing of this manuscript.
Author Contributions: Study conception and design: Wei Li, Naixiong Peng, Dong Chen; data collection: Naixiong Peng, Yuefeng Cai, Wei Li; analysis and interpretation of results: Ling Deng, Zejian Zhang; draft manuscript preparation: Naixiong Peng, Wei Li. All authors reviewed the results and approved the final version of the manuscript.
Availability of Data and Materials: The datasets generated during and/or analyzed during the current study are available from the corresponding author on reasonable request.
Ethics Approval: All in vivo experiments were done according to the Guidelines for the Care and Use of Laboratory Animals and were approved by the Guangdong Medical University (GDY2102011).
Conflicts of Interest: The authors declare no conflicts of interest to report regarding the present study.
References
1. Rizzo M, Caliò A, Brunelli M, Pezzicoli G, Ganini C, Martignoni G, et al. Clinico-pathological implications of the 2022 WHO renal cell carcinoma classification. Cancer Treat Rev. 2023;116:102558. doi:10.1016/j.ctrv.2023.102558. [Google Scholar] [PubMed] [CrossRef]
2. Li Y, Lih TM, Dhanasekaran SM, Mannan R, Chen L, Cieslik M, et al. Histopathologic and proteogenomic heterogeneity reveals features of clear cell renal cell carcinoma aggressiveness. Cancer Cell. 2023;41(1):139–63. doi:10.1016/j.ccell.2022.12.001. [Google Scholar] [PubMed] [CrossRef]
3. Lyu C, Stadlbauer B, Wang L, Buchner A, Pohla H. Identification of a novel combination treatment strategy in clear cell renal cell carcinoma stem cells with shikonin and ipilimumab. Front Immunol. 2023;14:1186388. doi:10.3389/fimmu.2023.1186388. [Google Scholar] [PubMed] [CrossRef]
4. Gebrael G, Sahu KK, Agarwal N, Maughan BL. Update on combined immunotherapy for the treatment of advanced renal cell carcinoma. Hum Vacc Immunotherap. 2023;19(1):2193528. doi:10.1080/21645515.2023.2193528. [Google Scholar] [PubMed] [CrossRef]
5. Cotta BH, Choueiri TK, Cieslik M, Ghatalia P, Mehra R, Morgan TM, et al. Current landscape of genomic biomarkers in clear cell renal cell carcinoma. Eur Urol. 2023;84(2):166–75. doi:10.1016/j.eururo.2023.04.003. [Google Scholar] [PubMed] [CrossRef]
6. Liang JL, Wang JY, Zeng JS, Bai ZB, Zheng ZY. The landscape of early growth response family members 1–4 in hepatocellular carcinoma: their biological roles and diagnostic utility. Dis Markers. 2022;22:3144742. [Google Scholar]
7. Wang B, Guo H, Yu H, Chen Y, Xu H, Zhao G. The role of the transcription factor EGR1 in cancer. Front Oncol. 2021;11:642547. doi:10.3389/fonc.2021.642547. [Google Scholar] [PubMed] [CrossRef]
8. Rauert-Wunderlich H. EGR1 changes course in B-cell lymphoma. Blood. 2023;142(22):1850–1. doi:10.1182/blood.2023022493. [Google Scholar] [PubMed] [CrossRef]
9. Woodson CM, Kehn-Hall K. Examining the role of EGR1 during viral infections. Front Microbiol. 2022;13:1020220. doi:10.3389/fmicb.2022.1020220. [Google Scholar] [PubMed] [CrossRef]
10. Kulkarni R. Early growth response factor 1 in aging hematopoietic stem cells and leukemia. Front Cell Dev Biol. 2022;10:925761. doi:10.3389/fcell.2022.925761. [Google Scholar] [PubMed] [CrossRef]
11. Liu Y, Kimpara S, Hoang NM, Daenthanasanmak A, Li Y, Lu L, et al. EGR1-mediated metabolic reprogramming to oxidative phosphorylation contributes to ibrutinib resistance in B-cell lymphoma. Blood. 2023;142(22):1879–94. doi:10.1182/blood.2023020142. [Google Scholar] [PubMed] [CrossRef]
12. Yang Z, Chen F, Wei D, Chen F, Jiang H, Qin S. EGR1 mediates MDR1 transcriptional activity regulating gemcitabine resistance in pancreatic cancer. BMC Cancer. 2024;24(1):268. doi:10.1186/s12885-024-12005-2. [Google Scholar] [PubMed] [CrossRef]
13. Feng X, Feng W, Ji Y, Jin T, Li J, Guo J. Transforming growth factor-β1 negatively regulates SOCS7 via EGR1 during wound healing. Cell Commun Signal. 2022;20(1):86. doi:10.1186/s12964-022-00893-5. [Google Scholar] [PubMed] [CrossRef]
14. Ao H, Liu B, Li H, Lu L. Egr1 mediates retinal vascular dysfunction in diabetes mellitus via promoting p53 transcription. J Cell Mol Med. 2019;23(5):3345–56. doi:10.1111/jcmm.2019.23.issue-5. [Google Scholar] [CrossRef]
15. Li L, Ameri AH, Wang S, Jansson KH, Casey OM, Yang Q, et al. EGR1 regulates angiogenic and osteoclastogenic factors in prostate cancer and promotes metastasis. Oncogene. 2019;38(35):6241–55. doi:10.1038/s41388-019-0873-8. [Google Scholar] [PubMed] [CrossRef]
16. Zhang ZY, Zhang SL, Chen HL, Mao YQ, Kong CY, Li ZM, et al. Low EGR1 expression predicts poor prognosis in clear cell renal cell carcinoma. Pathol, Res Pract. 2021;228:153666. doi:10.1016/j.prp.2021.153666. [Google Scholar] [PubMed] [CrossRef]
17. Li W, Xu S, Peng N, Zhang Z, He H, Chen R, et al. Downregulation of METTL7B inhibits proliferation of human clear cell renal cancer cells in vivo and in vitro. Front Oncol. 2021;11:634542. doi:10.3389/fonc.2021.634542. [Google Scholar] [PubMed] [CrossRef]
18. Sindhuja S, Amuthalakshmi S, Nalini Nagarajan C. A review on PCR and POC-PCR-a boon in the diagnosis of COVID-19. Curr Pharm Anal. 2022;18:745–64. doi:10.2174/1573412918666220509032754. [Google Scholar] [CrossRef]
19. Su Z, Yang B, Zeng Z, Zhu S, Wang C, Lei S, et al. Metastasis-associated gene MAPK15 promotes the migration and invasion of osteosarcoma cells via the c-Jun/MMPs pathway. Oncol Lett. 2020;20(1):99–112. [Google Scholar] [PubMed]
20. Colecchia D, Rossi M, Sasdelli F, Sanzone S, Strambi A, Chiariello M. MAPK15 mediates BCR-ABL1-induced autophagy and regulates oncogene-dependent cell proliferation and tumor formation. Autophagy. 2015;11(10):1790–802. doi:10.1080/15548627.2015.1084454. [Google Scholar] [PubMed] [CrossRef]
21. Wang Y, Qin C, Zhao B, Li Z, Li T, Yang X, et al. EGR1 induces EMT in pancreatic cancer via a P300/SNAI2 pathway. J Transl Med. 2023;21(1):201. doi:10.1186/s12967-023-04043-4. [Google Scholar] [PubMed] [CrossRef]
22. Zhao J, Li H, Yuan M. EGR1 promotes stemness and predicts a poor outcome of uterine cervical cancer by inducing SOX9 expression. Genes Genomics. 2021;43(5):459–70. doi:10.1007/s13258-021-01064-5. [Google Scholar] [PubMed] [CrossRef]
23. Wong KM, Song J, Wong YH. CTCF and EGR1 suppress breast cancer cell migration through transcriptional control of Nm23-H1. Sci Rep. 2021;11(1):491. doi:10.1038/s41598-020-79869-9. [Google Scholar] [PubMed] [CrossRef]
24. Pan M, Luo M, Liu L, Chen Y, Cheng Z, Wang K, et al. EGR1 suppresses HCC growth and aerobic glycolysis by transcriptionally downregulating PFKL. J Experiment Clinic Cancer Res. 2024;43(1):35. doi:10.1186/s13046-024-02957-5. [Google Scholar] [PubMed] [CrossRef]
25. Wang Z, Wei B, Ma S. EGR1/LINC00839/SOX5 axis modulates migration, invasion and Gemcitabine resistance of bladder cancer cells. Cancer Biol Ther. 2023;24(1):2270106. doi:10.1080/15384047.2023.2270106. [Google Scholar] [PubMed] [CrossRef]
26. Shao G, Liu Y, Ma T, Zhang L, Yuan M, Zhao S. GCN5 inhibition prevents IL-6-induced prostate cancer metastases through PI3K/PTEN/Akt signaling by inactivating Egr-1. Biosci Rep. 2018;38(6):BSR20180816. doi:10.1042/BSR20180816. [Google Scholar] [PubMed] [CrossRef]
27. Lau ATY, Xu YM. Regulation of human mitogen-activated protein kinase 15(extracellular signal-regulated kinase 7/8) and its functions: a recent update. J Cell Physiol. 2018;234(1):75–88. [Google Scholar] [PubMed]
28. Jin DH, Lee J, Kim KM, Kim S, Kim DH, Park J. Overexpression of MAPK15 in gastric cancer is associated with copy number gain and contributes to the stability of c-Jun. Oncotarget. 2015;6(24):20190–203. doi:10.18632/oncotarget.v6i24. [Google Scholar] [CrossRef]
29. Yu FY, Xu Q, Zhao XY, Mo HY, Zhong QH, Luo L, et al. The atypical MAP kinase MAPK15 is required for lung adenocarcinoma metastasis via its interaction with NF-κB p50 subunit and transcriptional regulation of prostaglandin E2 receptor EP3 subtype. Cancers. 2023;15(5):1398. doi:10.3390/cancers15051398. [Google Scholar] [PubMed] [CrossRef]
30. Rossi M, Colecchia D, Ilardi G, Acunzo M, Nigita G, Sasdelli F, et al. MAPK15 upregulation promotes cell proliferation and prevents DNA damage in male germ cell tumors. Oncotarget. 2016;7(15):20981–98. doi:10.18632/oncotarget.v7i15. [Google Scholar] [CrossRef]
31. Pietrobono S, Franci L, Imperatore F, Zanini C, Stecca B, Chiariello M. MAPK15 controls hedgehog signaling in medulloblastoma cells by regulating primary ciliogenesis. Cancers. 2021;13(19):4903. doi:10.3390/cancers13194903. [Google Scholar] [PubMed] [CrossRef]
32. Li TT, Liu MR, Pei DS. Friend or foe, the role of EGR-1 in cancer. Med Oncol. 2019;37(1):7. [Google Scholar] [PubMed]
Appendix A
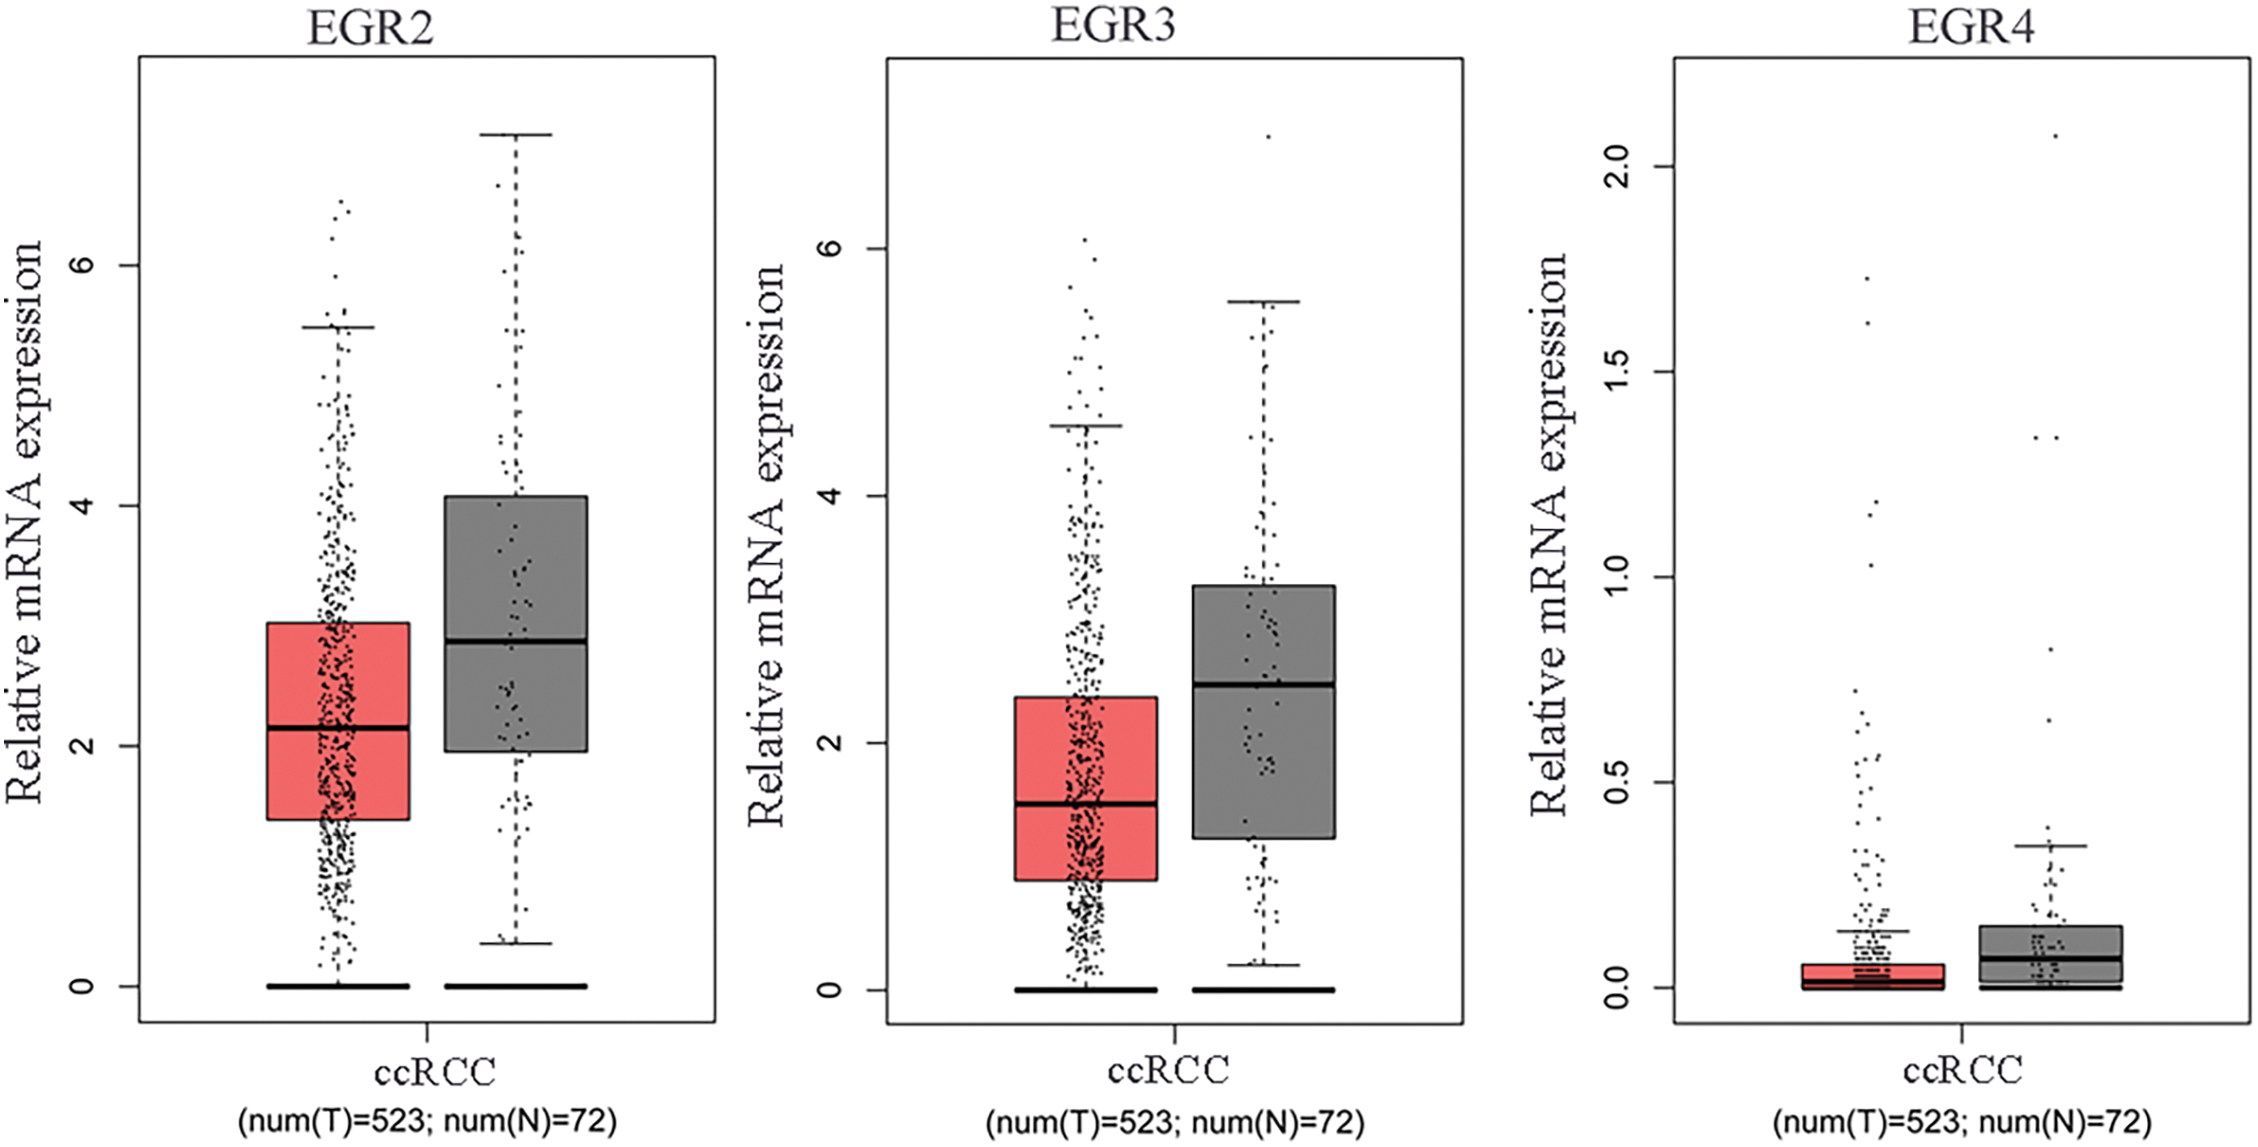
Figure A1: The mRNA expression levels of EGR2, EGR3 and EGR4 in ccRCC tissues and adjacent tissues (normal) were analyzed utilizing published ccRCC transcriptome data accessed from the TCGA database, T: tumor, N: normal.
Cite This Article
 Copyright © 2025 The Author(s). Published by Tech Science Press.
This work is licensed under a Creative Commons Attribution 4.0 International License , which permits unrestricted use, distribution, and reproduction in any medium, provided the original work is properly cited.
 Downloads
 Citation Tools