 Open Access
ARTICLE
A comprehensive and systematic analysis of Dihydrolipoamide S-acetyltransferase (DLAT) as a novel prognostic biomarker in pan-cancer and glioma
Department of Hematology, West China Hospital, Sichuan University, Chengdu, 610041, China
* Corresponding Authors: JINRONG YANG. Email: ; TING NIU. Email:
# These authors have contributed equally to this work and share the first authorship
Oncology Research 2024, 32(12), 1903-1919. https://doi.org/10.32604/or.2024.048138
Received 28 November 2023; Accepted 21 February 2024; Issue published 13 November 2024
Abstract
Background: Dihydrolipoamide S-acetyltransferase (DLAT) is a subunit of the pyruvate dehydrogenase complex (PDC), a rate-limiting enzyme complex, that can participate in either glycolysis or the tricarboxylic acid cycle (TCA). However, the pathogenesis is not fully understood. We aimed to perform a more systematic and comprehensive analysis of DLAT in the occurrence and progression of tumors, and to investigate its function in patients’ prognosis and immunotherapy. Methods: The differential expression, diagnosis, prognosis, genetic and epigenetic alterations, tumor microenvironment, stemness, immune infiltration cells, function enrichment, single-cell analysis, and drug response across cancers were conducted based on multiple computational tools. Additionally, we validated its carcinogenic effect and possible mechanism in glioma cells. Results: We exhibited that DLAT expression was increased in most tumors, especially in glioma, and affected the survival of tumor patients. DLAT was related to RNA modification genes, DNA methylation, immune infiltration, and immune infiltration cells, including CD4+ T cells, CD8+ T cells, Tregs, and cancer-associated fibroblasts. Single-cell analysis displayed that DLAT might regulate cancer by mediating angiogenesis, inflammation, and stemness. Enrichment analysis revealed that DLAT might take part in the cell cycle pathway. Increased expression of DLAT leads tumor cells to be more resistant to many kinds of compounds, including PI3Kβ inhibitors, PKC inhibitors, HSP90 inhibitors, and MEK inhibitors. In addition, glioma cells with DLAT silence inhibited proliferation, migration, and invasion ability, and promoted cell apoptosis. Conclusion: We conducted a comprehensive analysis of DLAT in the occurrence and progression of tumors, and its possible functions and mechanisms. DLAT is a potential diagnostic, prognostic, and immunotherapeutic biomarker for cancer patients.Graphic Abstract
Keywords
Supplementary Material
Supplementary Material FileNowadays, the malignant tumor has become the primary cause of human death, and seriously affect the quality of life of patients. In addition to surgery, chemotherapy, radiotherapy, and targeted therapy, immunotherapy is also one of the crucial treatments for cancer patients [1]. However, the objective response rates are unsatisfactory in many cancer patients, and some patients often resist or relapse [2,3]. Therefore, it is necessary to explore novel targets and investigate their correlations with patients’ prognosis and tumor immunity.
Dihydrolipoamide S-acetyltransferase (DLAT) is subunit E2 of the pyruvate dehydrogenase complex (PDC) [4], which is a mitochondrial multienzyme complex that can participate in either glycolysis or the tricarboxylic acid cycle (TCA) cycle [5,6]. The reprogramming of cell metabolism is usually observed in cancer cells [7,8]. Cancer cells absorb and utilize much more glucose than normal cells, and take advantage of glycolysis metabolism than oxidative phosphorylation regardless of oxygen availability, this phenomenon was known as the Warburg effect or aerobic glycolysis [9]. A previous study reported that DLAT expression was increased in gastric cancer cells [6]. Besides, Chen et al. discovered that DLAT was overexpressed in non-small cell lung cancer (NSCLC), and inhibited acetyl-CoA production but promoted L-lactate and pyruvate production [10]. These results strongly demonstrated that DLAT contributed to tumorigenesis by promoting glycolysis metabolism. Additionally, DLAT is significantly elevated in osteosarcoma cell lines compared with normal osteoblast cell lines [11]. While, several bioinformatics studies proved that DLAT was expressed at low levels in clear cell renal cell carcinoma [12]. Furthermore, DLAT participated in the development and prognosis of breast invasive carcinoma (BRCA) [13] and colon adenocarcinoma (COAD) [14]. Nevertheless, specific studies on DLAT in tumors are few and lack systematic pan-cancer investigation. Consequently, exploring the role of DLAT expression and alterations in cancers was extremely urgent.
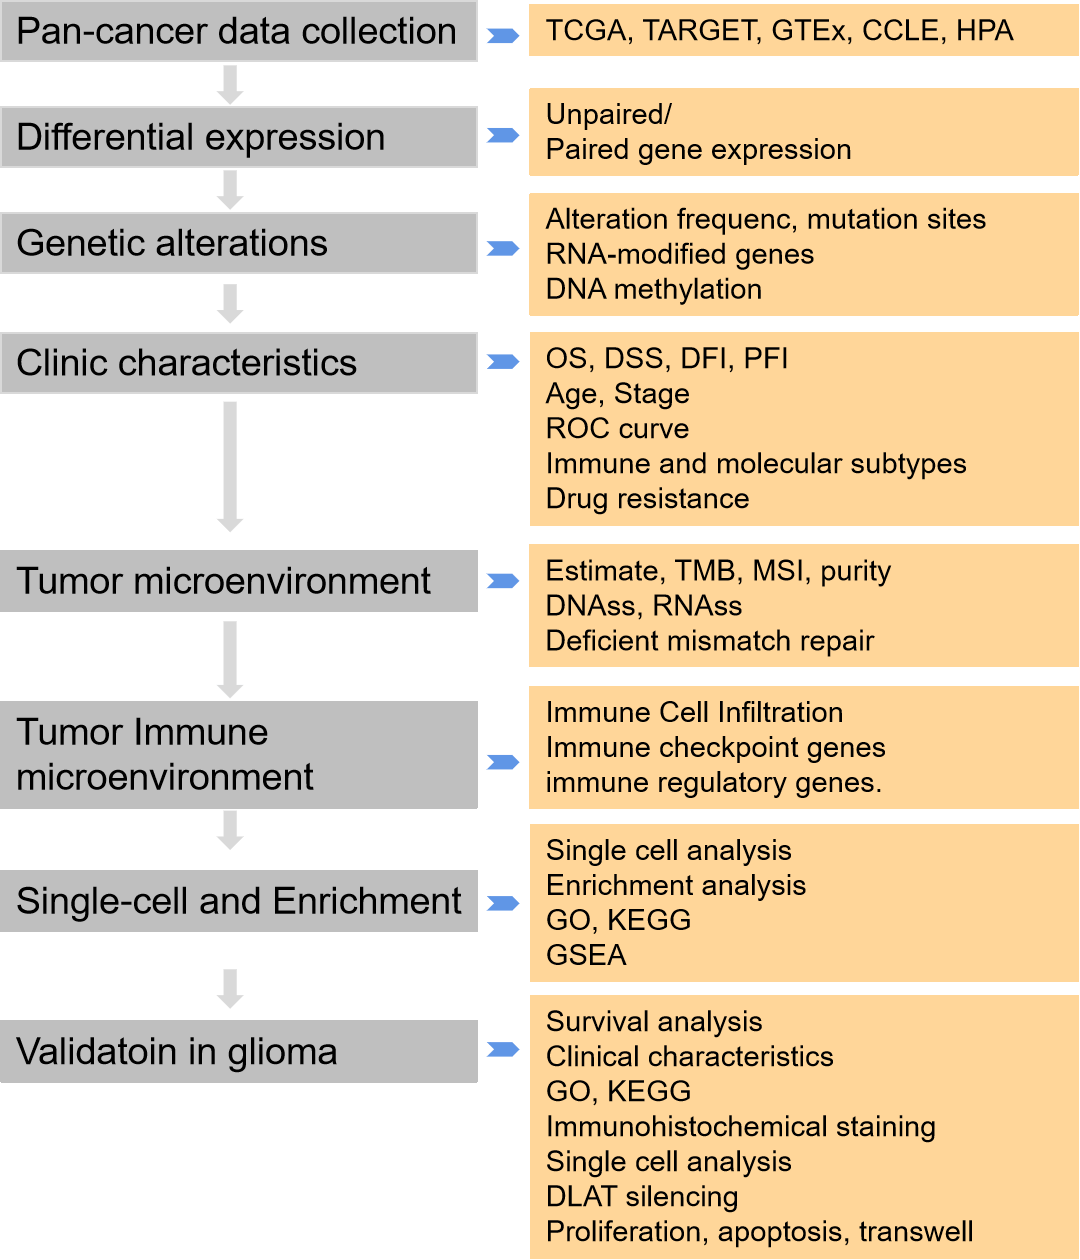
Therefore, a systematic and comprehensive analysis to evaluate the expression, gene and epigenetic alteration, methylation, and clinical, and prognostic profiles of DLAT across cancers. Moreover, we analyzed its relationship with immune cells, immune genes, tumor microenvironment, and tumor stemness score. In addition, enrichment analysis, single-cell analysis, and drug responses related to DLAT were analyzed. Moreover, we validated the function of DLAT in glioma cells. In conclusion, our results identified the role of DLAT across cancers and suggested that DLAT was a prognostic and immunotherapeutic biomarker in cancer patients.
We downloaded RNA and clinical data from The Cancer Genome Atlas (TCGA), TARGET, and Genotype-Tissue Expression (GTEx) from the UCSC database. In addition, we acquired prognostic data for TCGA from a previous study [15]. Meanwhile, we also obtained the TARGET follow-up data as a supplement from the UCSC. We also downloaded the RNA-seq data of the 325 glioma samples from the Chinese Glioma Genome Atlas (CGGA) database (http://www.cgga.org.cn/). The tumor cell line RNA expression data was downloaded from The Cancer Cell Line Encyclopedia (CCLE). The protein expression of DLAT was evaluated by the Human Protein Atlas (HPA). Suppl. Table S1 lists abbreviations of tumors.
Clinical characteristics analysis
We developed the Cox proportional hazards regression model to analyze overall survival (OS), disease-specific survival (DSS), disease-free interval (DFI), and progression-free interval (PFI) of DLAT across cancers. Kaplan‒Meier analysis was performed to analyze the patient’s prognosis. The CGGA dataset was also used to analyze the survival of DLAT in glioma patients.
The diagnostic significance of DLAT across cancers was assessed by the Receiver Operator Characteristic (ROC) curve via “pROC” (v1.17.0.1). The diagnosis accuracy was evaluated by the Area under Curve (AUC). The AUC is closer to 1, the diagnosis accuracy is better. The clinical value of DLAT was calculated by unpaired Wilcoxon rank sum, signed rank, and Kruskal‒Wallis tests.
The associations between DLAT expression and molecular or immune subtypes across cancers were analyzed by the TISIDB database. There are six immune subtypes, C1 meaning wound healing subtype, C2 representing the IFN-γ dominant subtype, C3 meaning inflammatory subtype, C4 representing lymphocyte depletion, C5 meaning immunologically quiet, and C6 representing the TGF-β dominant subtype.
The IC50 values of various compounds in cancer cell lines were obtained from the GDSC dataset (https://www.cancerrxgene.org), to assess the relationship between DLAT and the drug response of tumor cells by the Spearman correlation coefficient.
Genetic and epigenetic alterations
The genomic alteration analyses were used by the cBioPortal database (https://www.cbioportal.org/). The mRNA methylation was an important posttranscriptional gene regulation in eukaryotes. The RNA methylation modifications included methylation of N6 adenosine (m6A), N1 methyladenosine (m1A), and 5-methylcytosine (m5C), participating in cell differentiation, development, and progression, and so on [16]. The relationships between forty-four marker genes of RNA modification, including m1A, m5C, and m6A, and DLAT expression were evaluated.
Mismatch repair (MMR) genes downregulated or functionally defective can cause irreparable DNA replication mistakes and somatic mutations, therefore increasing the incidence rate of cancer [17]. A correlation analysis was conducted.
The correlation between DLAT expression and methylation was evaluated via the cBioPortal database. Furthermore, the relationship between DLAT methylation and patients’ prognosis was also assessed. Additionally, the expression of DLAT promotor methylation between cancers and normal tissues was investigated.
Tumor microenvironment analysis
We downloaded all level 4 Simple Nucleotide Variation data of TCGA samples from GDC (https://portal.gdc.cancer.gov/). Tumor mutation burden (TMB) can reflect the proportion of somatic mutations in tumors and is a quantitative biological marker of the immune response [18]. We calculated the TMB by the R MAftools package. Microsatellite instability (MSI) is the arbitrary length change of microsatellites in cancer tissue due to the insertion or deletion of repeat units compared with normal tissue, and it is a very important molecular biomarker in almost all solid tumors [19]. The tumor purity was acquired from the previous study [20]. The tumor stemness score was obtained by calculating the methylation-based DNA stemness score (DNAss) and expression-based RNA stemness score (RNAss) index of methylation characteristics in diverse tumors [21].
Tumor immune microenvironment analysis
We obtained 10,180 tumor samples from 44 cancer types for immune infiltration analysis. Estimation of Stromal and Immune Cells in Malignant Tumor Tissues Using Expression Data (ESTIMATE) was used to reflect the level of stromal or immune cell infiltrations. The analysis used the R software packages “estimate” and “psych”.
The correlation between DLAT expression and immune infiltrating cells in tumors was performed by the TIMER2 tool (http://timer.cistrome.org/). CD4+ T cells, CD8+ T cells, Tregs, and cancer-associated fibroblasts were chosen for detailed analysis by the TIMER, CIBERSORT, CIBERSORT-ABS, QUANTISEQ, XCELL, MCPCOUNTER, and EPIC algorithms. We used the ssGSEA algorithm to evaluate 31 infiltrating cells in glioma as previously described [22].
Besides, the association between DLAT expression and immune-related genes in five immune pathways was evaluated.
Single-cell and enrichment analysis
We analyzed the function of DLAT at the single-cell level by CancerSEA [23]. The correlation was >0.3 and the p-value was <0.05. We compared the single-cell expression and distribution of DLAT among patients with high-grade gliomas (HGGs) utilizing the TISCH database.
The top 50 DLAT-binding proteins were downloaded from the STRING database. GEPIA2 was used to acquire the top 100 DLAT-related target genes. An intersection analysis was evaluated by the Venn plot. Gene Ontology (GO) and KEGG pathway enrichment analyses were used to examine the biological and molecular functions of the two sets of data. GSEA analysis was used to investigate the potential function of DLAT in cancers.
The GBM cell line A172 came from the American Type Culture Collection (ATCC) and was cultured in DMEM (Gibco, Grand Island, NY, USA) with 10% fetal calf serum (Gibco) and 1.0 mmol/L penicillin–streptomycin combination (Hyclone). By utilizing the INTERFERin® reagent from Poly-Plus Corporation, we transfected siRNAs and negative control into A172 cells. After a 48-h incubation period, the cells were collected and prepared for subsequent experiments. The sequences for DLAT siRNA were: 5′-AAGTTCTTCTTGTCTTTCCAGATAT-3′ and 5′-TATAGTGGAAAGAGAAGGAGTAAG-3′ (Tsingke Biotech). All cells were appraised by STR and performed mycoplasma testing.
Extraction of total RNA and qRT-PCR
The total RNA was extracted using the Trizol reagent (Ambion, Austin, Texas, USA). The extracted RNA was converted into cDNA following the instructions (Genecopoeia, Rockville, MD, USA). The qRT-PCR reactions were performed using the BlazeTaqTM SYBR® Green qPCR Mix 2.0 kit (Genecopoeia) and the corresponding reaction system. The forward primer sequence was GTGTTGCGGTCAGTACTCCT, and the reverse primer sequence was CGTAAAAGTGCCACCCTGGA (Tsingke Biotech, Beijing, China).
To isolate the proteins, the GBM cell lines were lysed by RIPA buffer (Beyotime, Shanghai, China) with a cocktail (Thermo Scientific, Waltham, MA, USA) added. The protein was collected by centrifuge and the quantity was accurately measured using a BCA assay (Abcam). The antibodies included anti-DLAT (Cell Signaling Technology, 1:1000 dilution) and anti-ACTIN (Abcam, 1:1000 dilution). Cellular proteins were extracted using a lysis buffer, incubated on ice for 30 min with intermittent vortexing, and clarified by centrifugation at 14,000 × g for 15 min at 4°C. Protein concentrations were determined using the bicinchoninic acid (BCA) assay kit. Equal amounts of protein (20 μg per sample) were denatured by boiling with loading buffer at 95°C for 5 min, separated by SDS-PAGE on a 12% polyacrylamide gel at 120 V for approximately 1 h, and transferred onto PVDF membranes using a semi-dry transfer system at 15 V for 45 minutes. Membranes were blocked with 5% non-fat dry milk in TBS-T for 1 h at room temperature, then incubated overnight at 4°C with primary antibodies specific to the target proteins, diluted in blocking buffer. After washing with TBS-T, membranes were incubated with HRP-conjugated secondary antibodies for 1 h at room temperature. Immunoreactive bands were visualized using an enhanced chemiluminescence detection reagent on a chemiluminescent imaging system.
2.0 × 10⁴ cells were transfected and cultured in a 96-well plate. Following 48 h of growth and cultivation, a WST-8 solution (the Enhanced Cell Counting Kit-8, diluted 1:10) was introduced and incubated for 2 h. The Optical Density (OD) value was then accurately determined using a sophisticated microplate reader.
Cells underwent a 48-h transfection with siRNA, then cells were collected by centrifuge, washed with PBS, and treated with Annexin V/FITC and Propidium Iodide (BD Biosciences, San Jose, CA, USA), and then detected by flow cytometry (BD Biosciences) and analyzed by FlowJo.
3 × 10⁵ and 5 × 10⁵ cells in serum-free medium were added on Transwell membranes (5 μm pore size, Costar). The medium with 10% FBS was added to the lower chambers. The membranes were bedded with Matrigel (BD Biosciences) in advance for the invasion analysis. After 24 h, cells on the upper membranes were fixed by 4% paraformaldehyde (Thermo Scientific) and stained with crystal violet (Beyotime). The cells on the membrane were observed by microscope (Nikon). A flow cytometer (BD Biosciences) was used to quantify the number of cells in the lower chambers.
All analyses were performed by R software (version 4.2.1). The Wilcoxon’s test and analysis of variance (ANOVA) were used for the two groups and multiple groups, respectively. The correlation analysis was calculated by Spearman’s correlation test. *p < 0.05; **p < 0.01; ***p < 0.001; ****p < 0.0001; and ns, not significant.
Alterations of DLAT in pan-cancer
DLAT physiologically exhibited the highest expression level in heart muscle and skeletal muscle but exhibited low expression levels in most other normal tissues (Suppl. Fig. S1A). Suppl. Fig. S1B showed that the DLAT expression was highest in the lymphoid U-698 cell line and generally higher in some lymphoid, myeloid, and female reproductive system cell lines. Moreover, DLAT expression was lowest in liver cancer and was greatest in colorectal cancer (Suppl. Fig. S1C).
We evaluated DLAT gene expression in 34 cancer species in TCGA, TARGET, and GTEx pan-cancer. The DLAT gene was highly expressed in 22 types of cancers, including glioblastoma multiforme (GBM), lower grade glioma (LGG), and kidney chromophobe (KICH). In comparison, DLAT was lowly expressed in 5 types of cancers: adrenocortical carcinoma (ACC), bladder urothelial carcinoma (BLCA), head and Neck squamous cell carcinoma (HNSC), kidney renal clear cell carcinoma (KIRC), and acute myeloid leukemia (LAML) (Fig. 1A). For paired tumors and adjacent normal tissues in TGCA, DLAT was lowly expressed in COAD, HNSC, KIRC, Kidney renal papillary cell carcinoma (KIRP), and thyroid carcinoma (THCA) and highly expressed in six types of cancer (Fig. 1B).
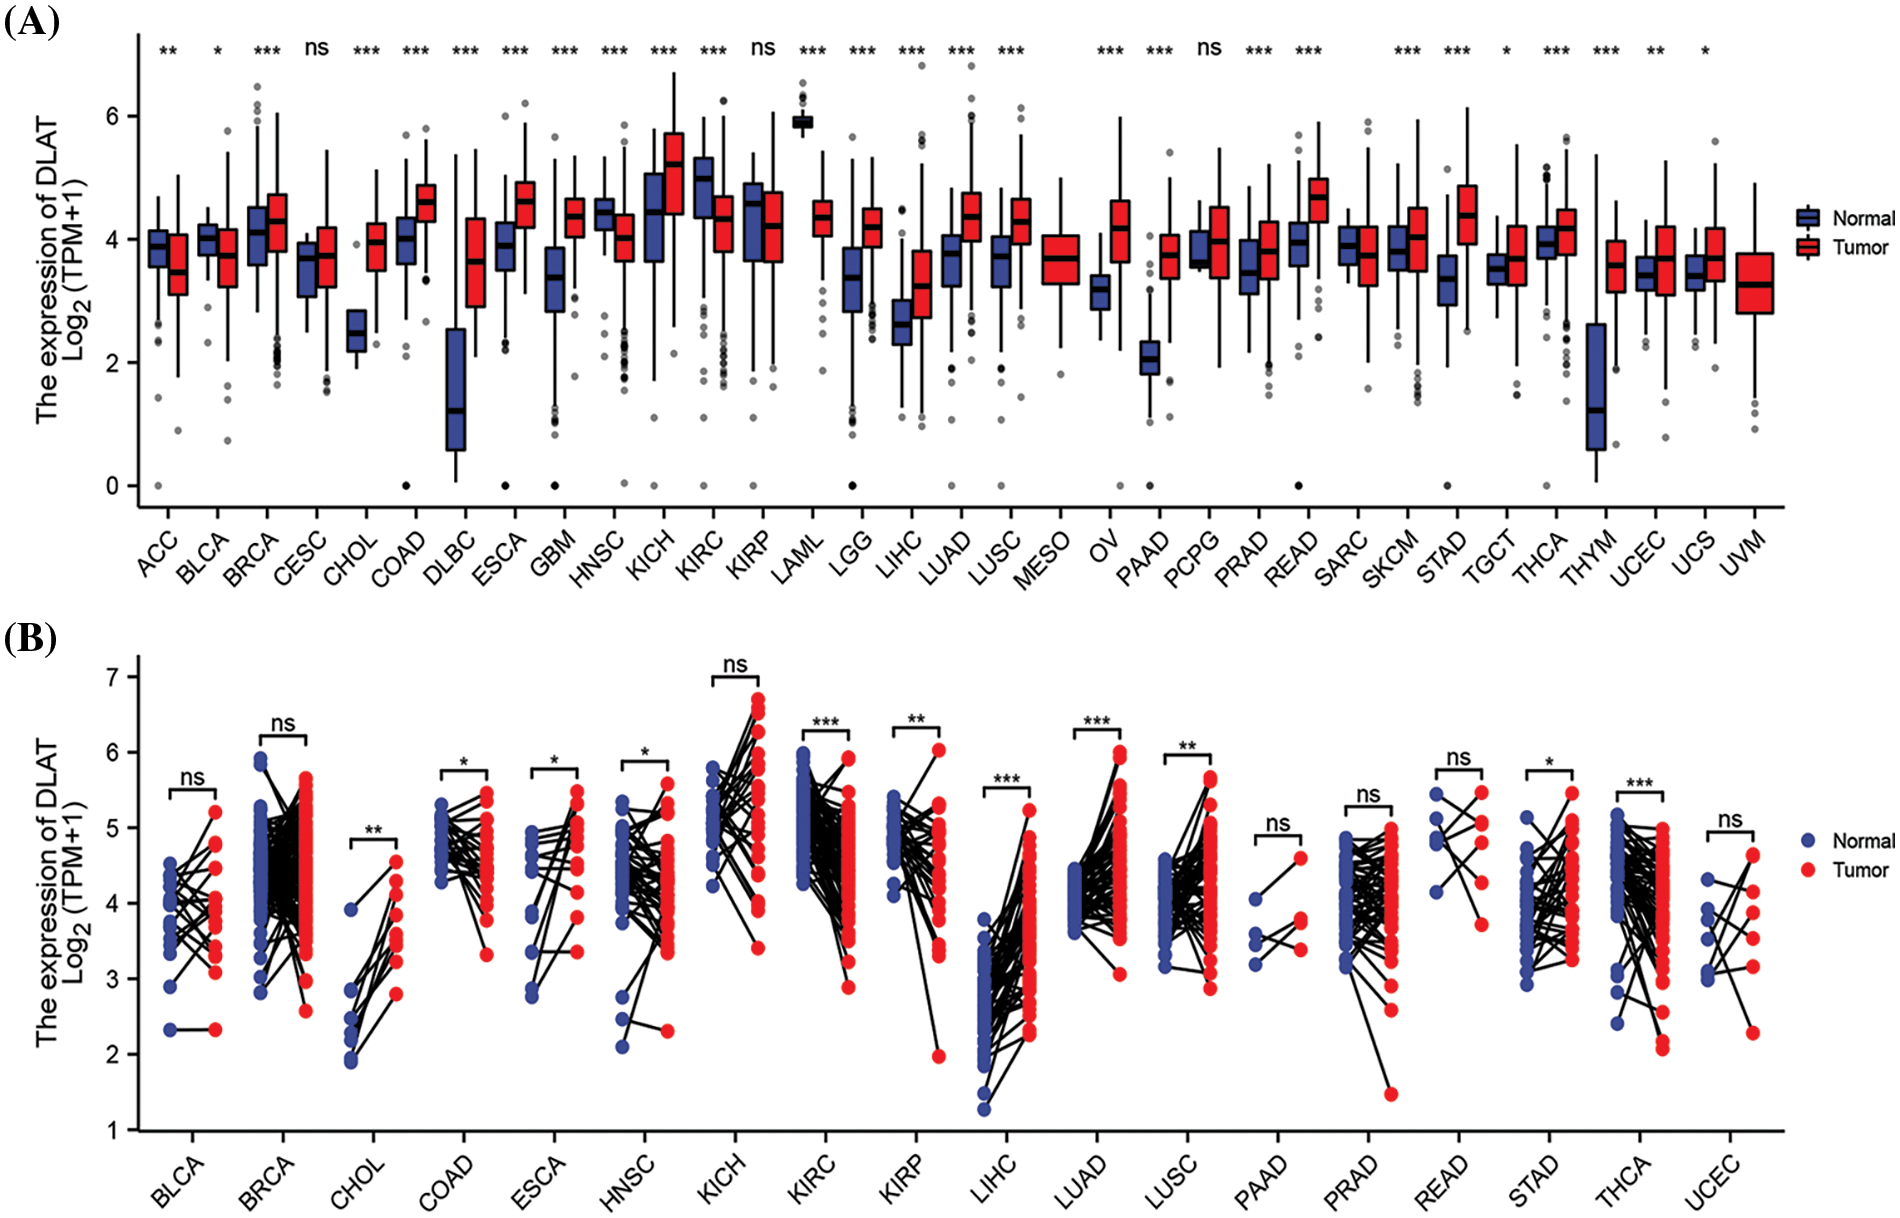
Figure 1: Differential analysis of DLAT expression across cancers. (A) DLAT expression between tumor and normal samples from the GTEx and TCGA databases. (B) DLAT expression in matched tumor and normal samples from XENA and TCGA. ns: not significant; *p < 0.05; **p < 0.01; ***p < 0.001.
Genetic and epigenetic alterations might influence the expression and have been closely associated with tumorigenesis. A high frequency of gene alterations was found in most patients except with ACC, cholangiocarcinoma (CHOL), Diffuse Large B-cell Lymphoma (DLBC), liver hepatocellular carcinoma (LIHC), mesothelioma (MESO), thymoma (THYM) and THCA. In addition, DLAT mutation frequencies were found to be the highest in uterine corpus endometrial carcinoma (UCEC), BLCA, colon adenocarcinoma/rectum adenocarcinoma esophageal carcinoma (COADREAD), skin cutaneous melanoma (SKCM), and stomach adenocarcinoma (STAD) (Suppl. Fig. S2A). The main type of genetic alteration was the missense mutation of DLAT (Suppl. Fig. S2B). The 3D structure of the DLAT protein is shown in Suppl. Fig. S2C.
RNA modification is a common intracellular chemical modification, and it participates in various pathological processes, such as immune system diseases and cancer. DLAT expression was significantly positively correlated with RNA modification genes in almost all tumors (Fig. 2A). DNA methylation is also one of the common epigenetic regulators. We demonstrated significant negative relationships between DLAT expression and methylation in most tumors (Fig. 2B). Moreover, we evaluated the differential expression of DLAT promoter methylation levels between cancers and normal tissue. The results exhibited a high methylation level of DLAT in BLCA, esophageal carcinoma (ESCA), HNSC, and LIHC tissues compared to normal tissues (Fig. 2C). Furthermore, Increased DLAT methylation was related to shorter OS in patients with KIRC and sarcoma (SARC), while was correlated with longer OS in patients with LIHC (Fig. 2D). These results identified that DLAT might influence tumor development by regulating the repair of RNA and DNA methylation across cancers.
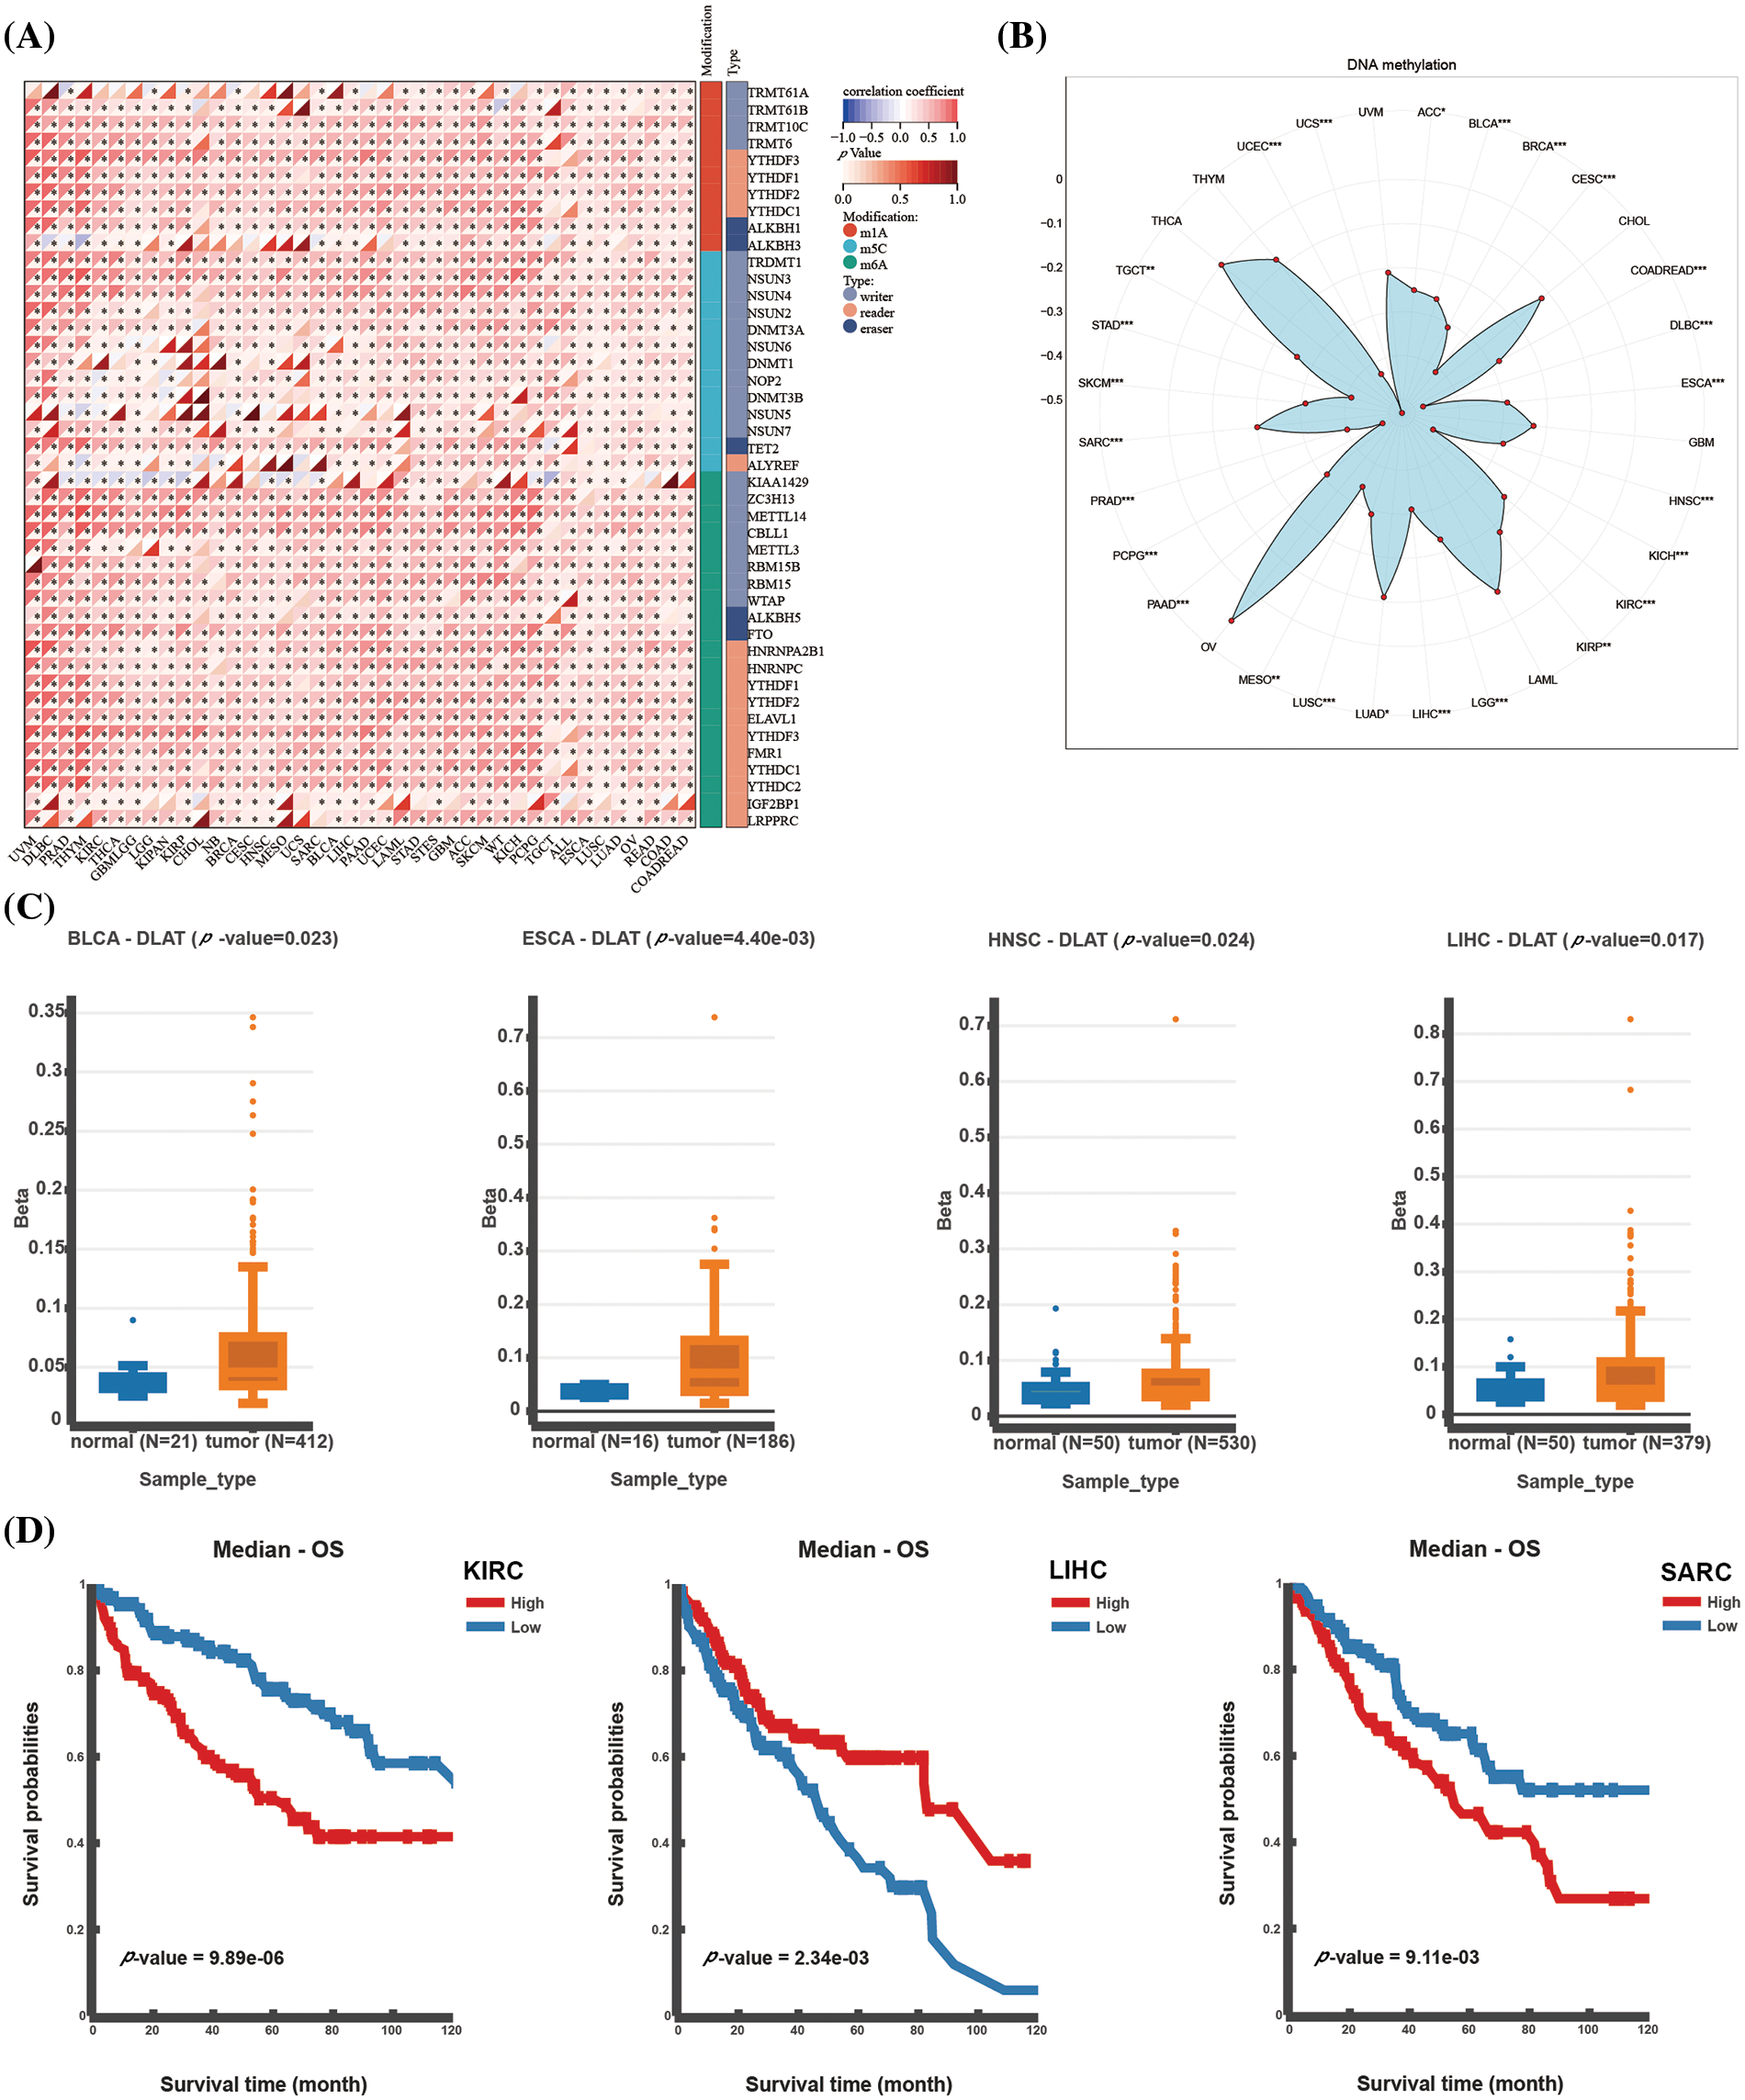
Figure 2: Epigenetic alterations of DLAT. (A) Correlation between DLAT and RNA-modified genes. (B) Radar plot showing the correlation between DLAT and promotor methylation. (C) Differential expression of DLAT promoter methylation levels across cancers. (D) Kaplan‒Meier curves exhibiting the correlations of DLAT promoter methylation levels and OS. *p < 0.05; **p < 0.01; ***p < 0.001.
Clinical characteristics of DLAT in pan-cancer
To further assess the prognostic value of DLAT expression across cancers, we performed a Cox proportional hazards model analysis, including OS, DSS, DFI, and PFI. Univariate Cox regression analysis of OS identified that DLAT was a risk factor for patients with LIHC, glioma (GBMLGG), TARGET-LAML, LGG, BRCA, LAML, BLCA, recurrence acute lymphoblastic leukemia (TARGET-ALL-R) and pancreatic adenocarcinoma (PAAD) and benefit for patients with KIRC, Pan-kidney cohort (KICH+KIRC+KIRP) (KIPAN), COADREAD, COAD, neuroblastoma (TARGET-NB) and rectum adenocarcinoma (READ) (Fig. 3A). The DSS analysis demonstrated that DLAT was related to poor survival in patients with GBMLGG, LGG, LIHC, PAAD, BLCA, and uveal melanoma (UVM) and was correlated with favorable survival in patients with KIRC, KIPAN, and KIRP (Fig. 3B). The DFI analysis showed that DLAT was an adverse prognostic factor for patients with PAAD (Fig. 3C). The PFI analysis demonstrated that DLAT was a unfavorable factor for patients with UVM, GBMLGG, ACC, LIHC, BLCA, SKCM-P, and cervical squamous cell carcinoma and endocervical adenocarcinoma (CESC) and benefit for patients with KIRC and KIPAN (Fig. 3D).
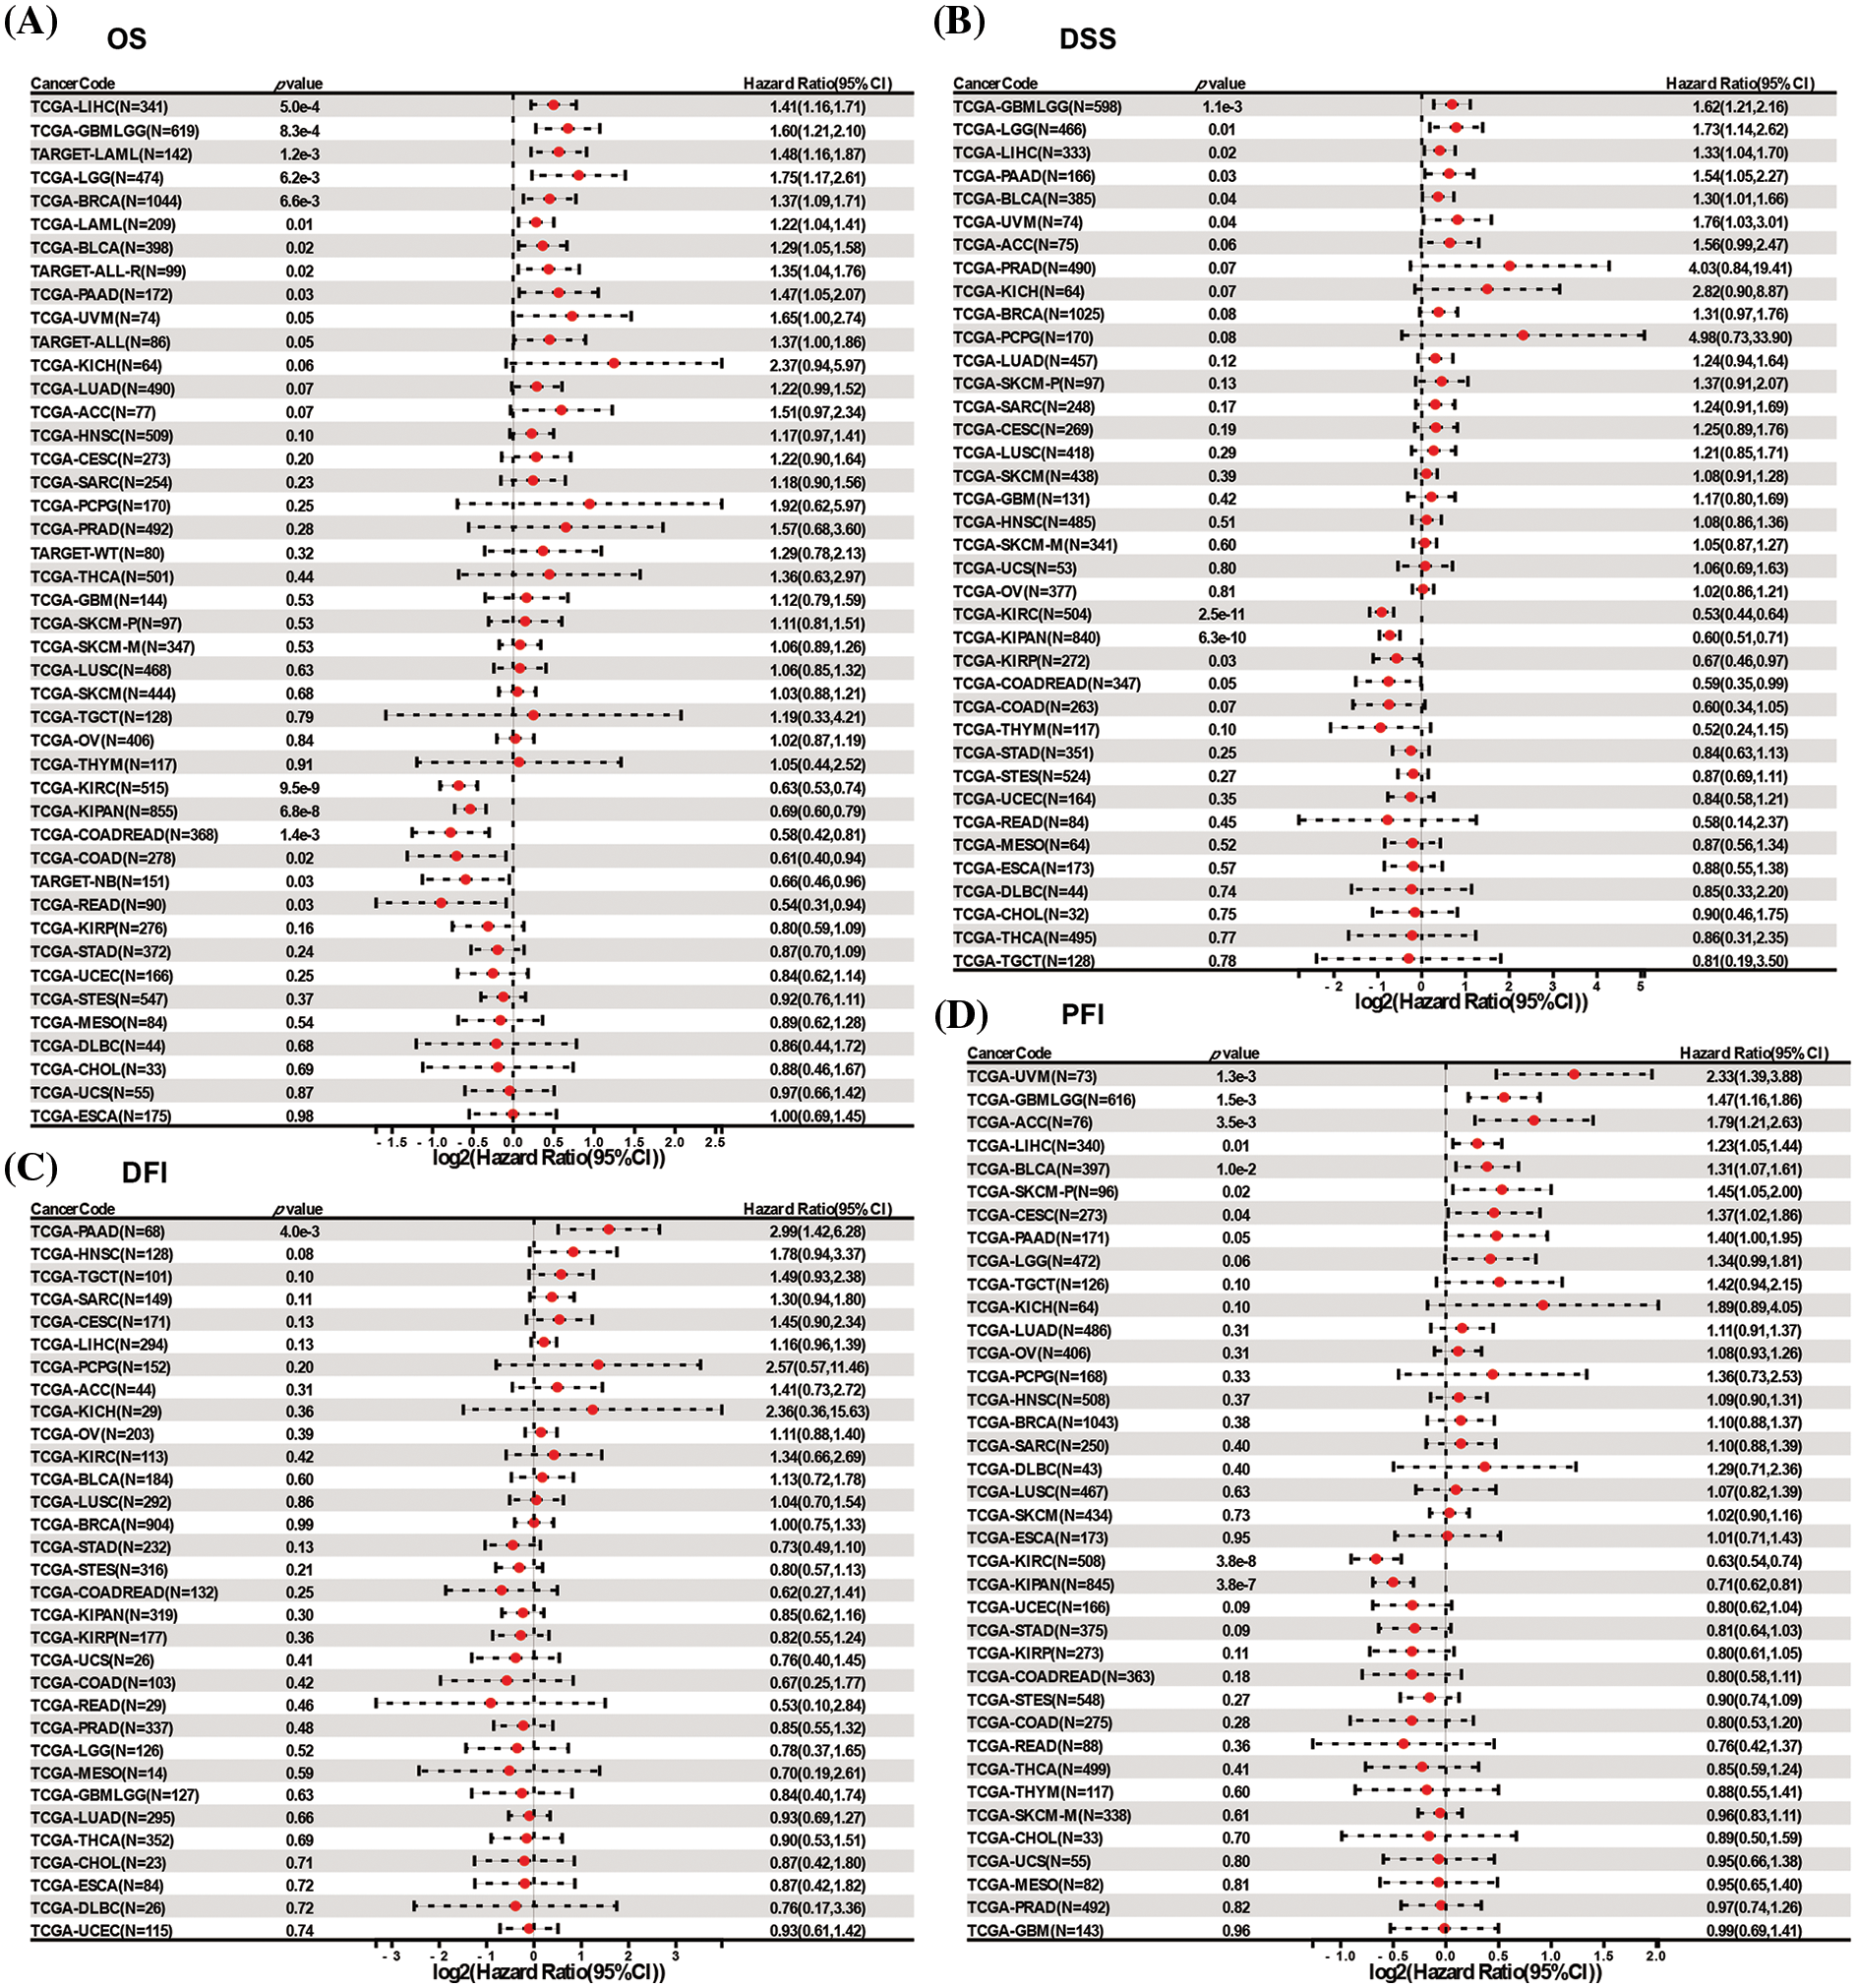
Figure 3: Forest plots of DLAT by univariate Cox regression analysis across cancers. (A) OS. (B) DSS. (C) DFI. (D) PFI.
Furthermore, Kaplan‒Meier survival analyses were explored across cancers. The OS analysis showed that elevated DLAT expression levels were an unfavorable factor in ACC, BRCA, GBMLGG, LGG, LIHC, PAAD, SKCM, and TARGET-LAML, whereas were favorable in KIPAN, KIRC, KIRP, COAD, COADREAD, and READ (Suppl. Fig. S3). In addition, DSS analysis showed that increased DLAT was related to poor survival in patients suffering from ACC, BRCA, GBMLGG, LGG, LIHC, PAAD, prostate adenocarcinoma (PRAD), and SKCM, while favorable survival in COAD, COADREAD, and KIRC (Suppl. Fig. S4). Meanwhile, PFI analysis showed that increased DLAT was connected with shorter survival in ACC, GBMLGG, LGG, LIHC, and PAAD; while was a protective factor for COAD, COADREAD, and KIRC patients (Suppl. Figs. S5A and S5B). Moreover, DFI analysis showed that PAAD patients had a relatively shorter survival time with high expression levels of DLAT (Suppl. Fig. S5C).
We explored the relationship between DLAT expression and patient age. We found that older patients had increased DLAT expression o in GBMLGG and STAD, while had lower expression in lung adenocarcinoma (LUAD), ovarian serous cystadenocarcinoma (OV), READ, and testicular germ cell tumors (TGCT) than younger patients (Fig. 4A). Moreover, we exhibited that patients who had high DLAT expression had more advanced stages in GBMLGG, LGG, LIHC, and LUAD, while with more favorable stages of KIRC and THCA (Fig. 4B). The diagnostic value of DLAT was assessed by ROC curves. The AUC of ROC analysis has relative diagnostic accuracy in GBMLGG (AUC = 0.845), GBM (AUC = 0.877), and LGG (AUC = 0.837) (Fig. 4C). The AUC of ROC analysis had high/relative accuracy (AUC > 0.7) in 18 types of cancers. The detailed results of all cancers are exhibited in Suppl. Table S2. These results suggested that DLAT was a good diagnostic factor in most cancers.
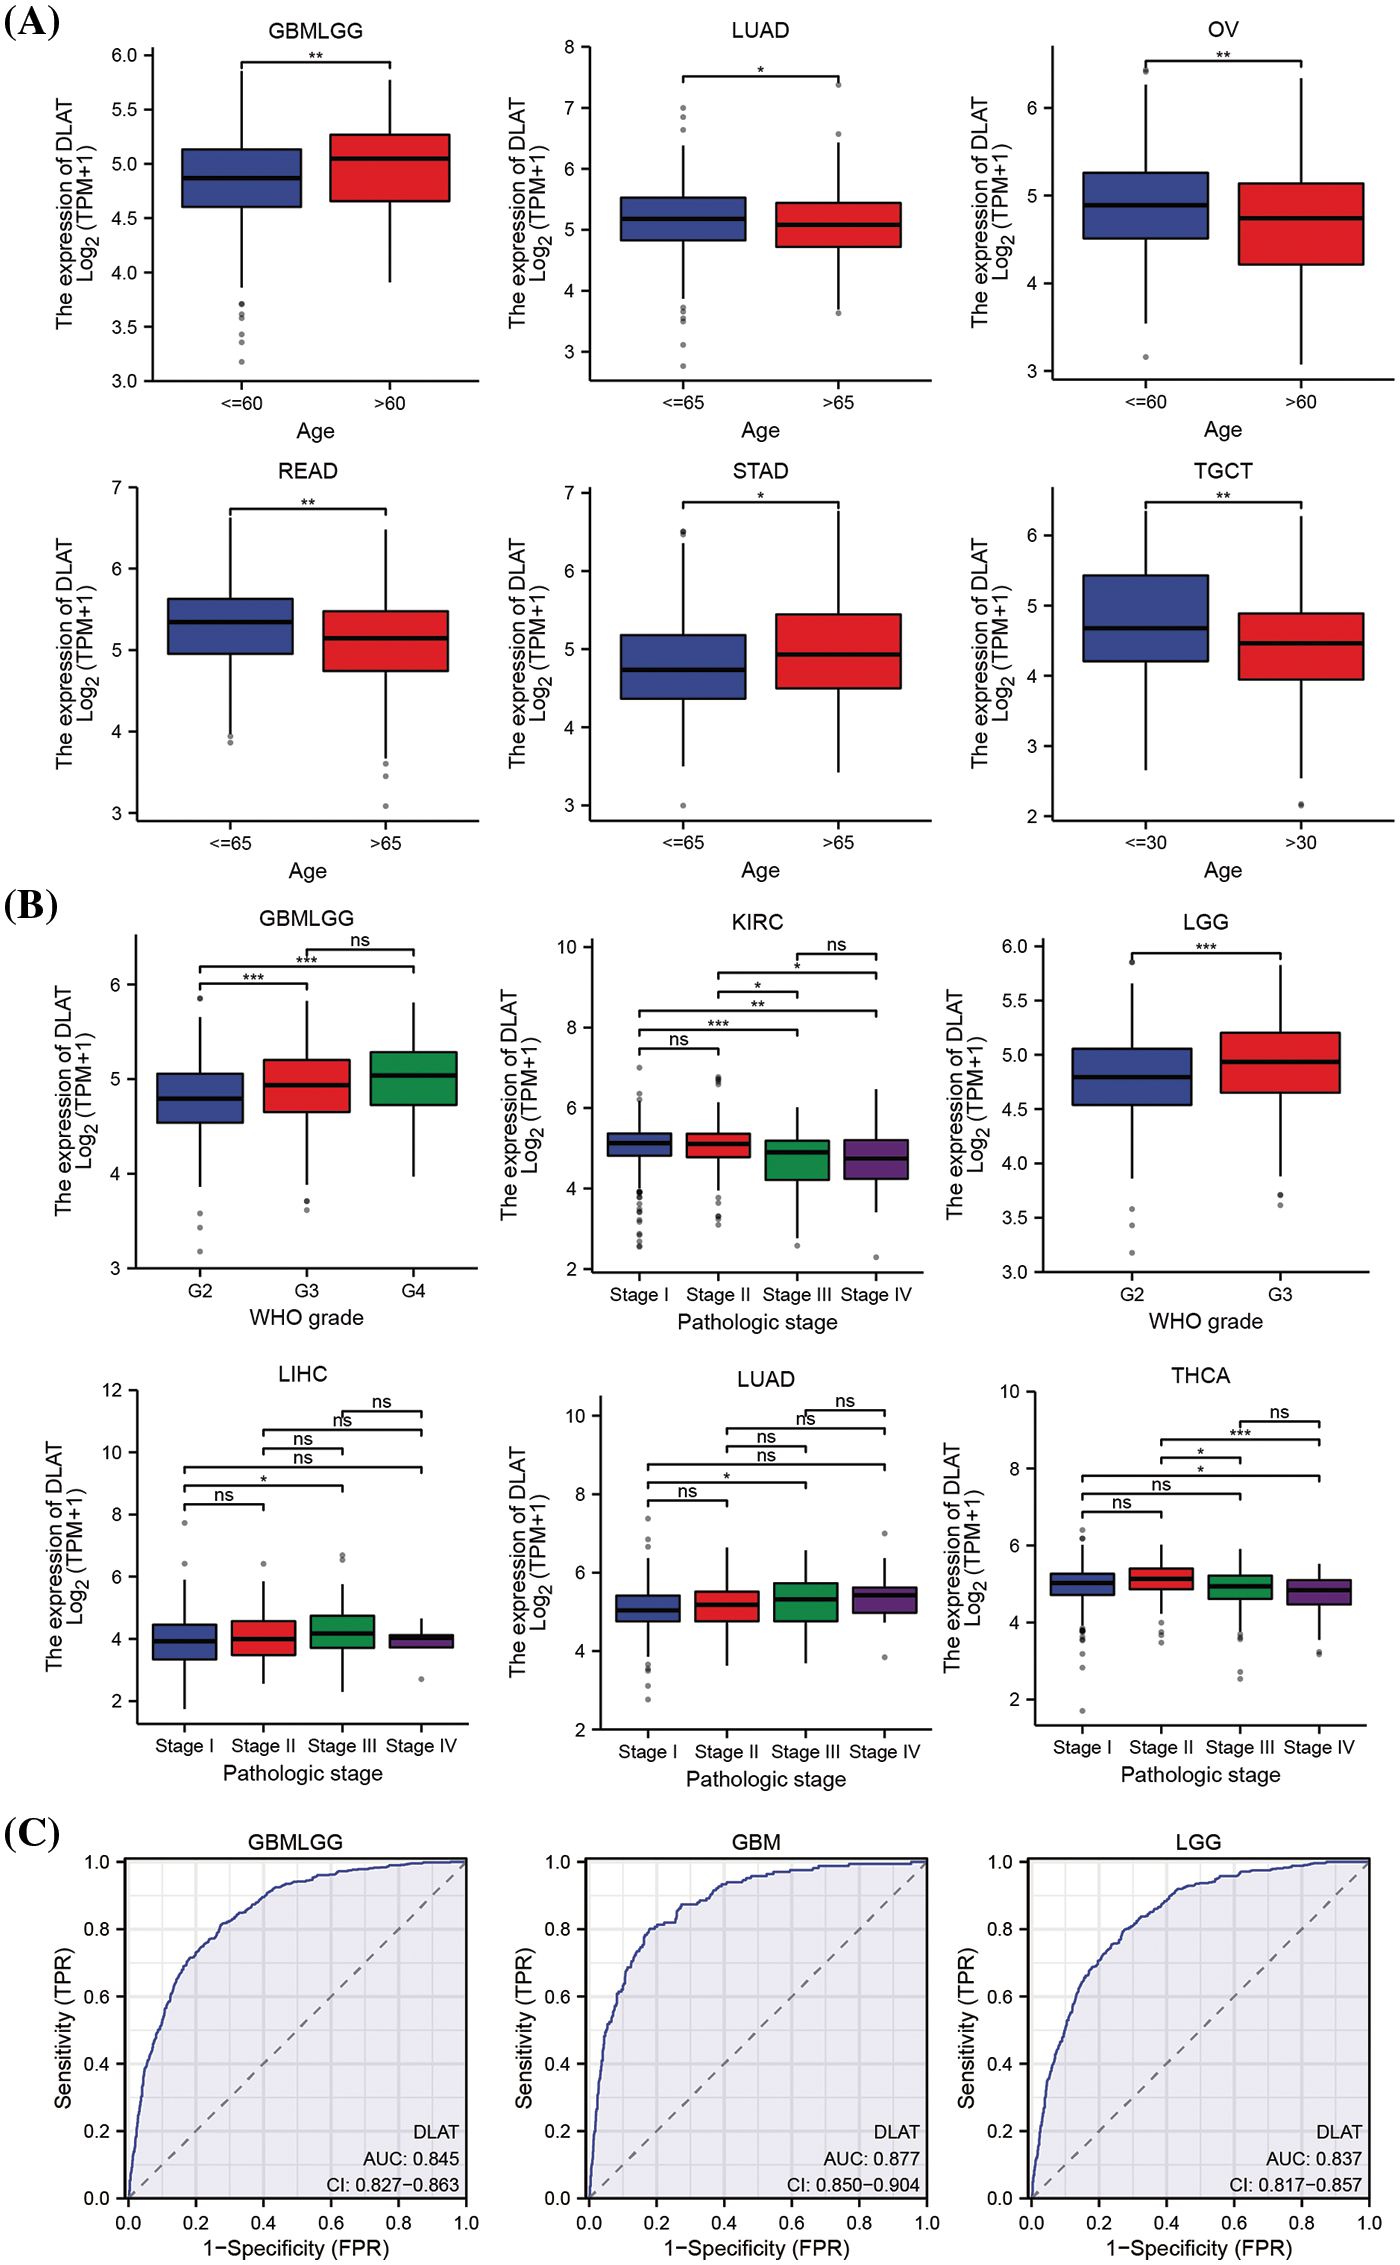
Figure 4: The relationship of DLAT to clinical and diagnostic value. (A) Different expressions of DLAT in different patients’ age from TCGA. (B) Different expression of DLAT on tumor stage from TCGA. (C) ROC curve of DLAT expression in the TCGA and GTEx database in GBMLGG, GBM and LGG. ns: not significant; *p < 0.05; **p < 0.01; ***p < 0.001.
Besides, we demonstrated that DLAT was differently expressed in 15 cancer types for immune subtypes, including ACC, BRCA, CESC, COAD, KIRC, KIRP, LUAD, lung squamous cell carcinoma (LUSC), OV, cervical squamous cell carcinoma and endocervical adenocarcinoma (PCPG), PRAD, READ, SKCM, STAD, and UCEC (Fig. 5A), and was differently expressed in 9 cancer types for molecular subtypes, including ACC, BRCA, ESCA, LGG, OV, PCPG, PRAD, STAD, and UCEC (Fig. 5B).
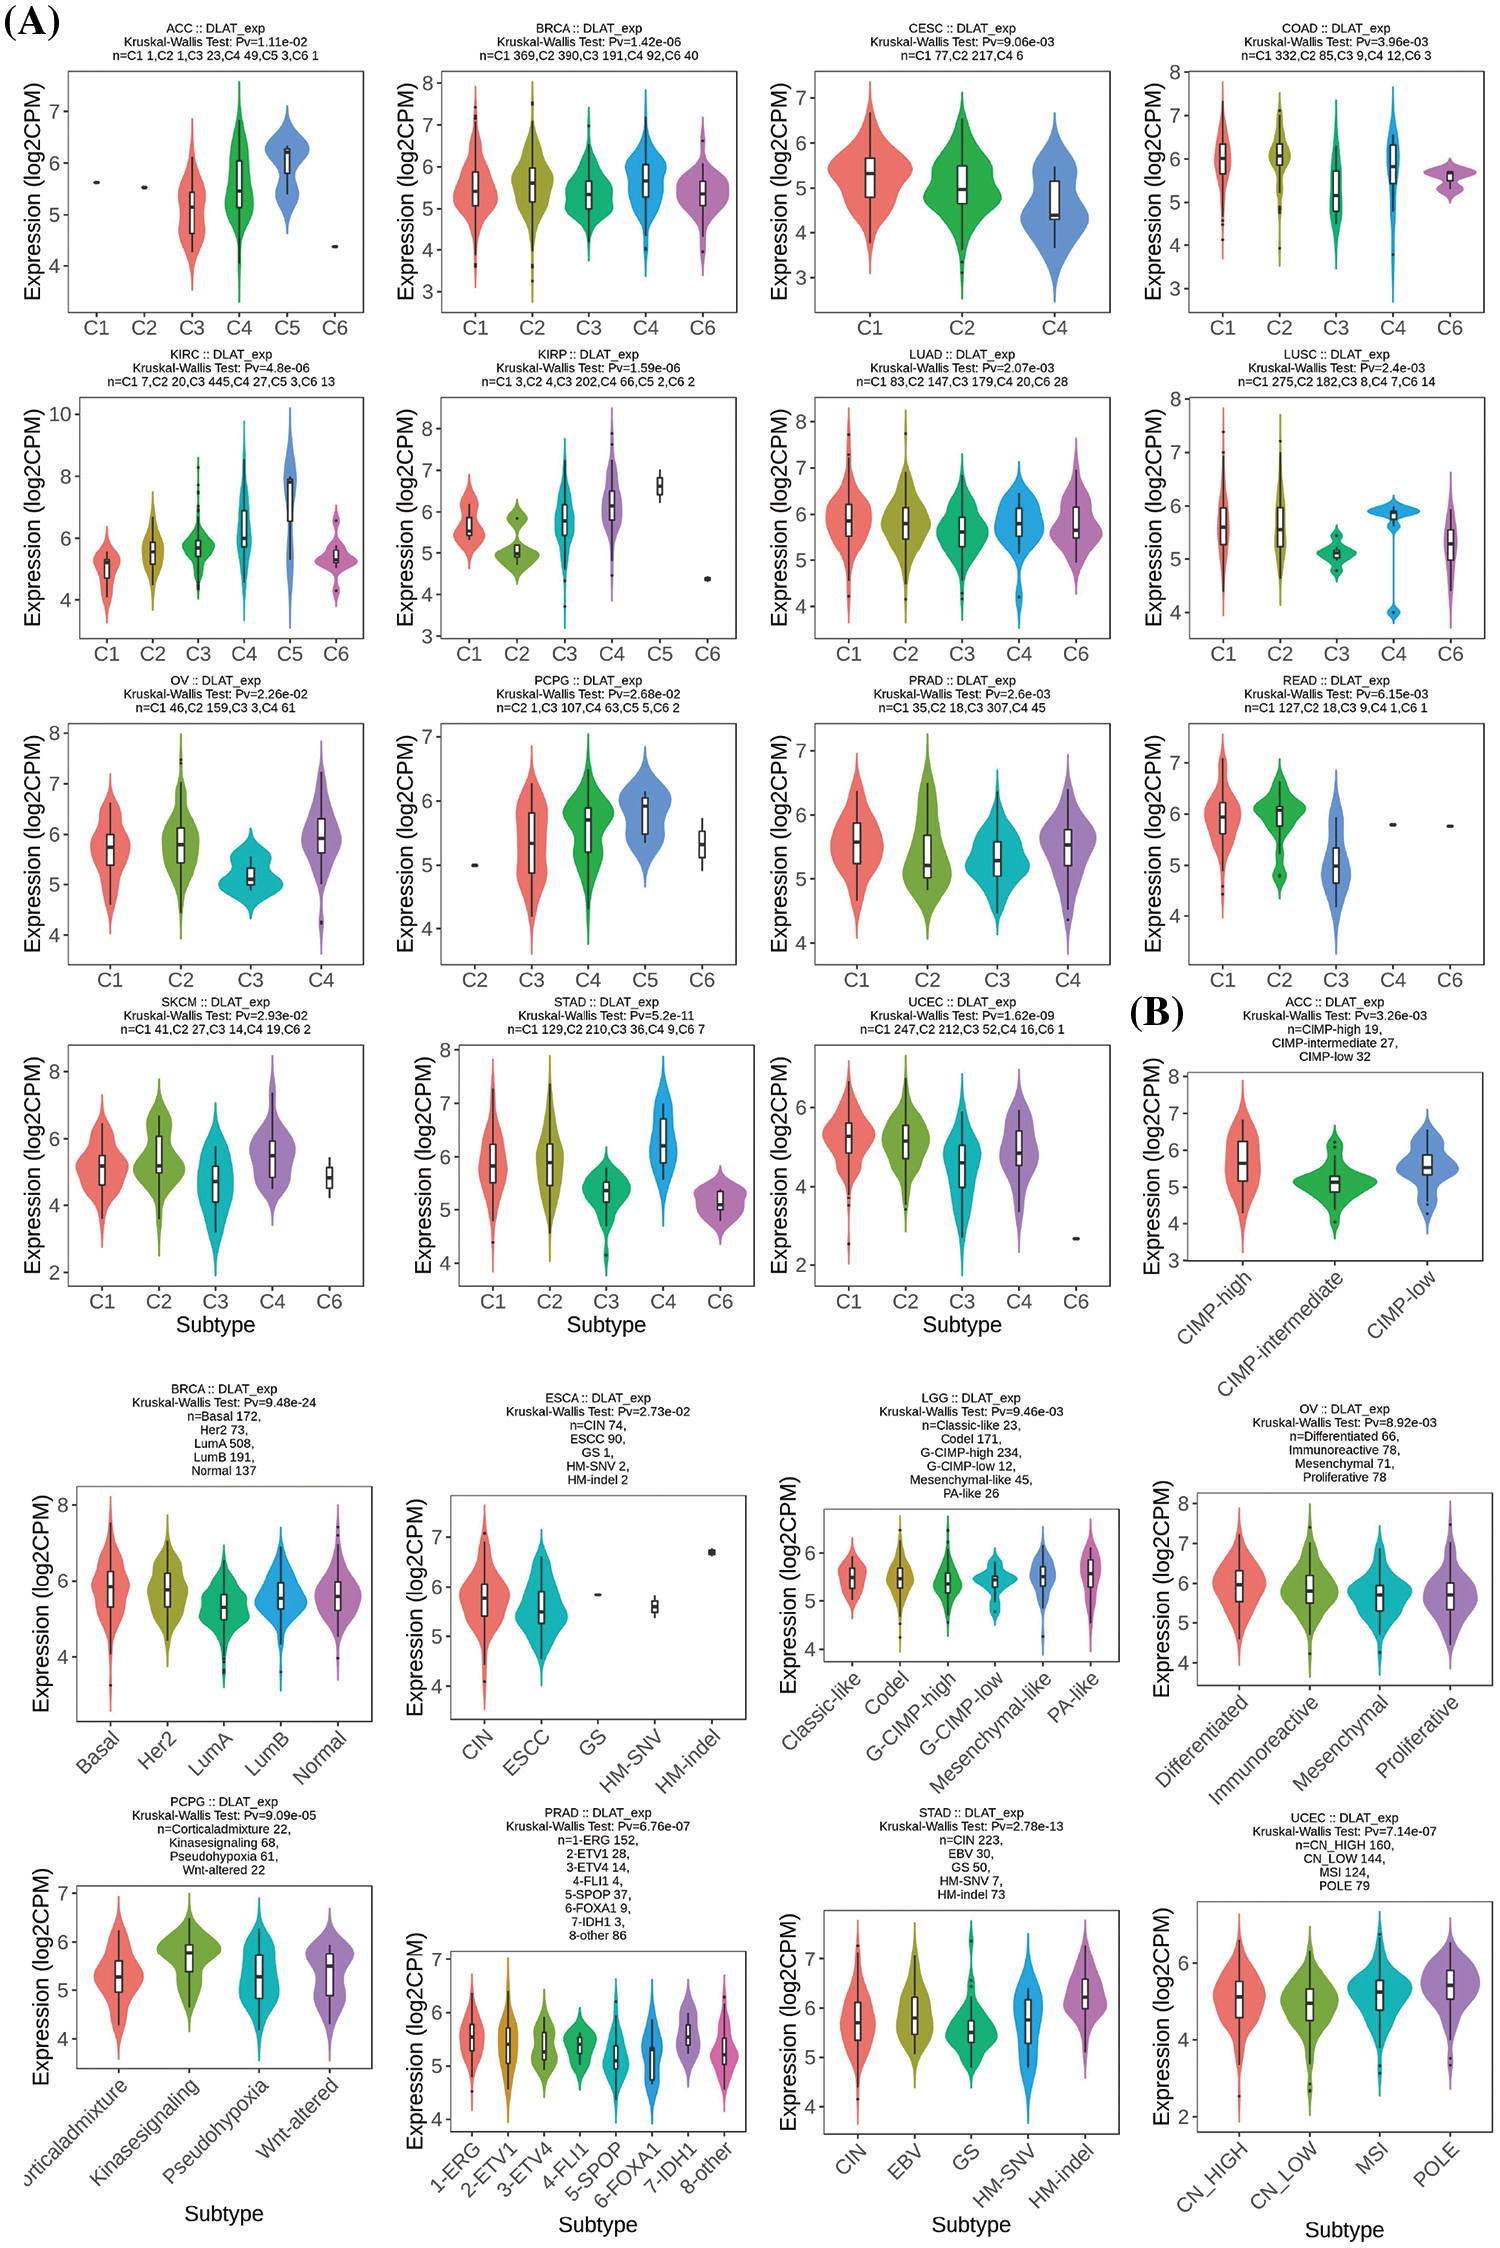
Figure 5: Relationships between DLAT expression and (A) immune subtypes and (B) molecular subtypes.
Nowadays, cancer patients often obtain drug resistance, leading to tumor relapse and influencing patients’ prognosis and survival. Therefore, the association between DLAT and the drug response of tumor cells was explored to evaluate the therapeutic biomarker value of DLAT We exhibited that DLAT was positively associated with IC50 values of seven compounds, including PI3Kβ inhibitor (AZD6482), PKC inhibitor (midostaurin), HSP90 inhibitor (tanespimycin), and MEK inhibitors (PD0325901, refametinib, trametinib, selumetinib), which suggested that patients with increased DLAT were more resistant to these drugs. However, patients with increased DLAT were more sensitive to 63 compounds, including rTRAIL, HDAC inhibitor (belinostat), and others (Suppl. Table S3). Therefore, the DLAT expression may be a biomarker for drug treatment in tumors.
Tumor microenvironment analysis
The tumor microenvironment (TME) was essential in tumor occurrence and progression. The ESTIMATE algorithm was performed and our results revealed that increased DLAT expression had negative scores in GBM, UCEC, CESC, LUAD, ESCA, stomach and esophageal carcinoma (STES), SARC, KIPAN, STAD, LUSC, SKCM-P, THCA, PCPG, and ACC (Fig. 6A).
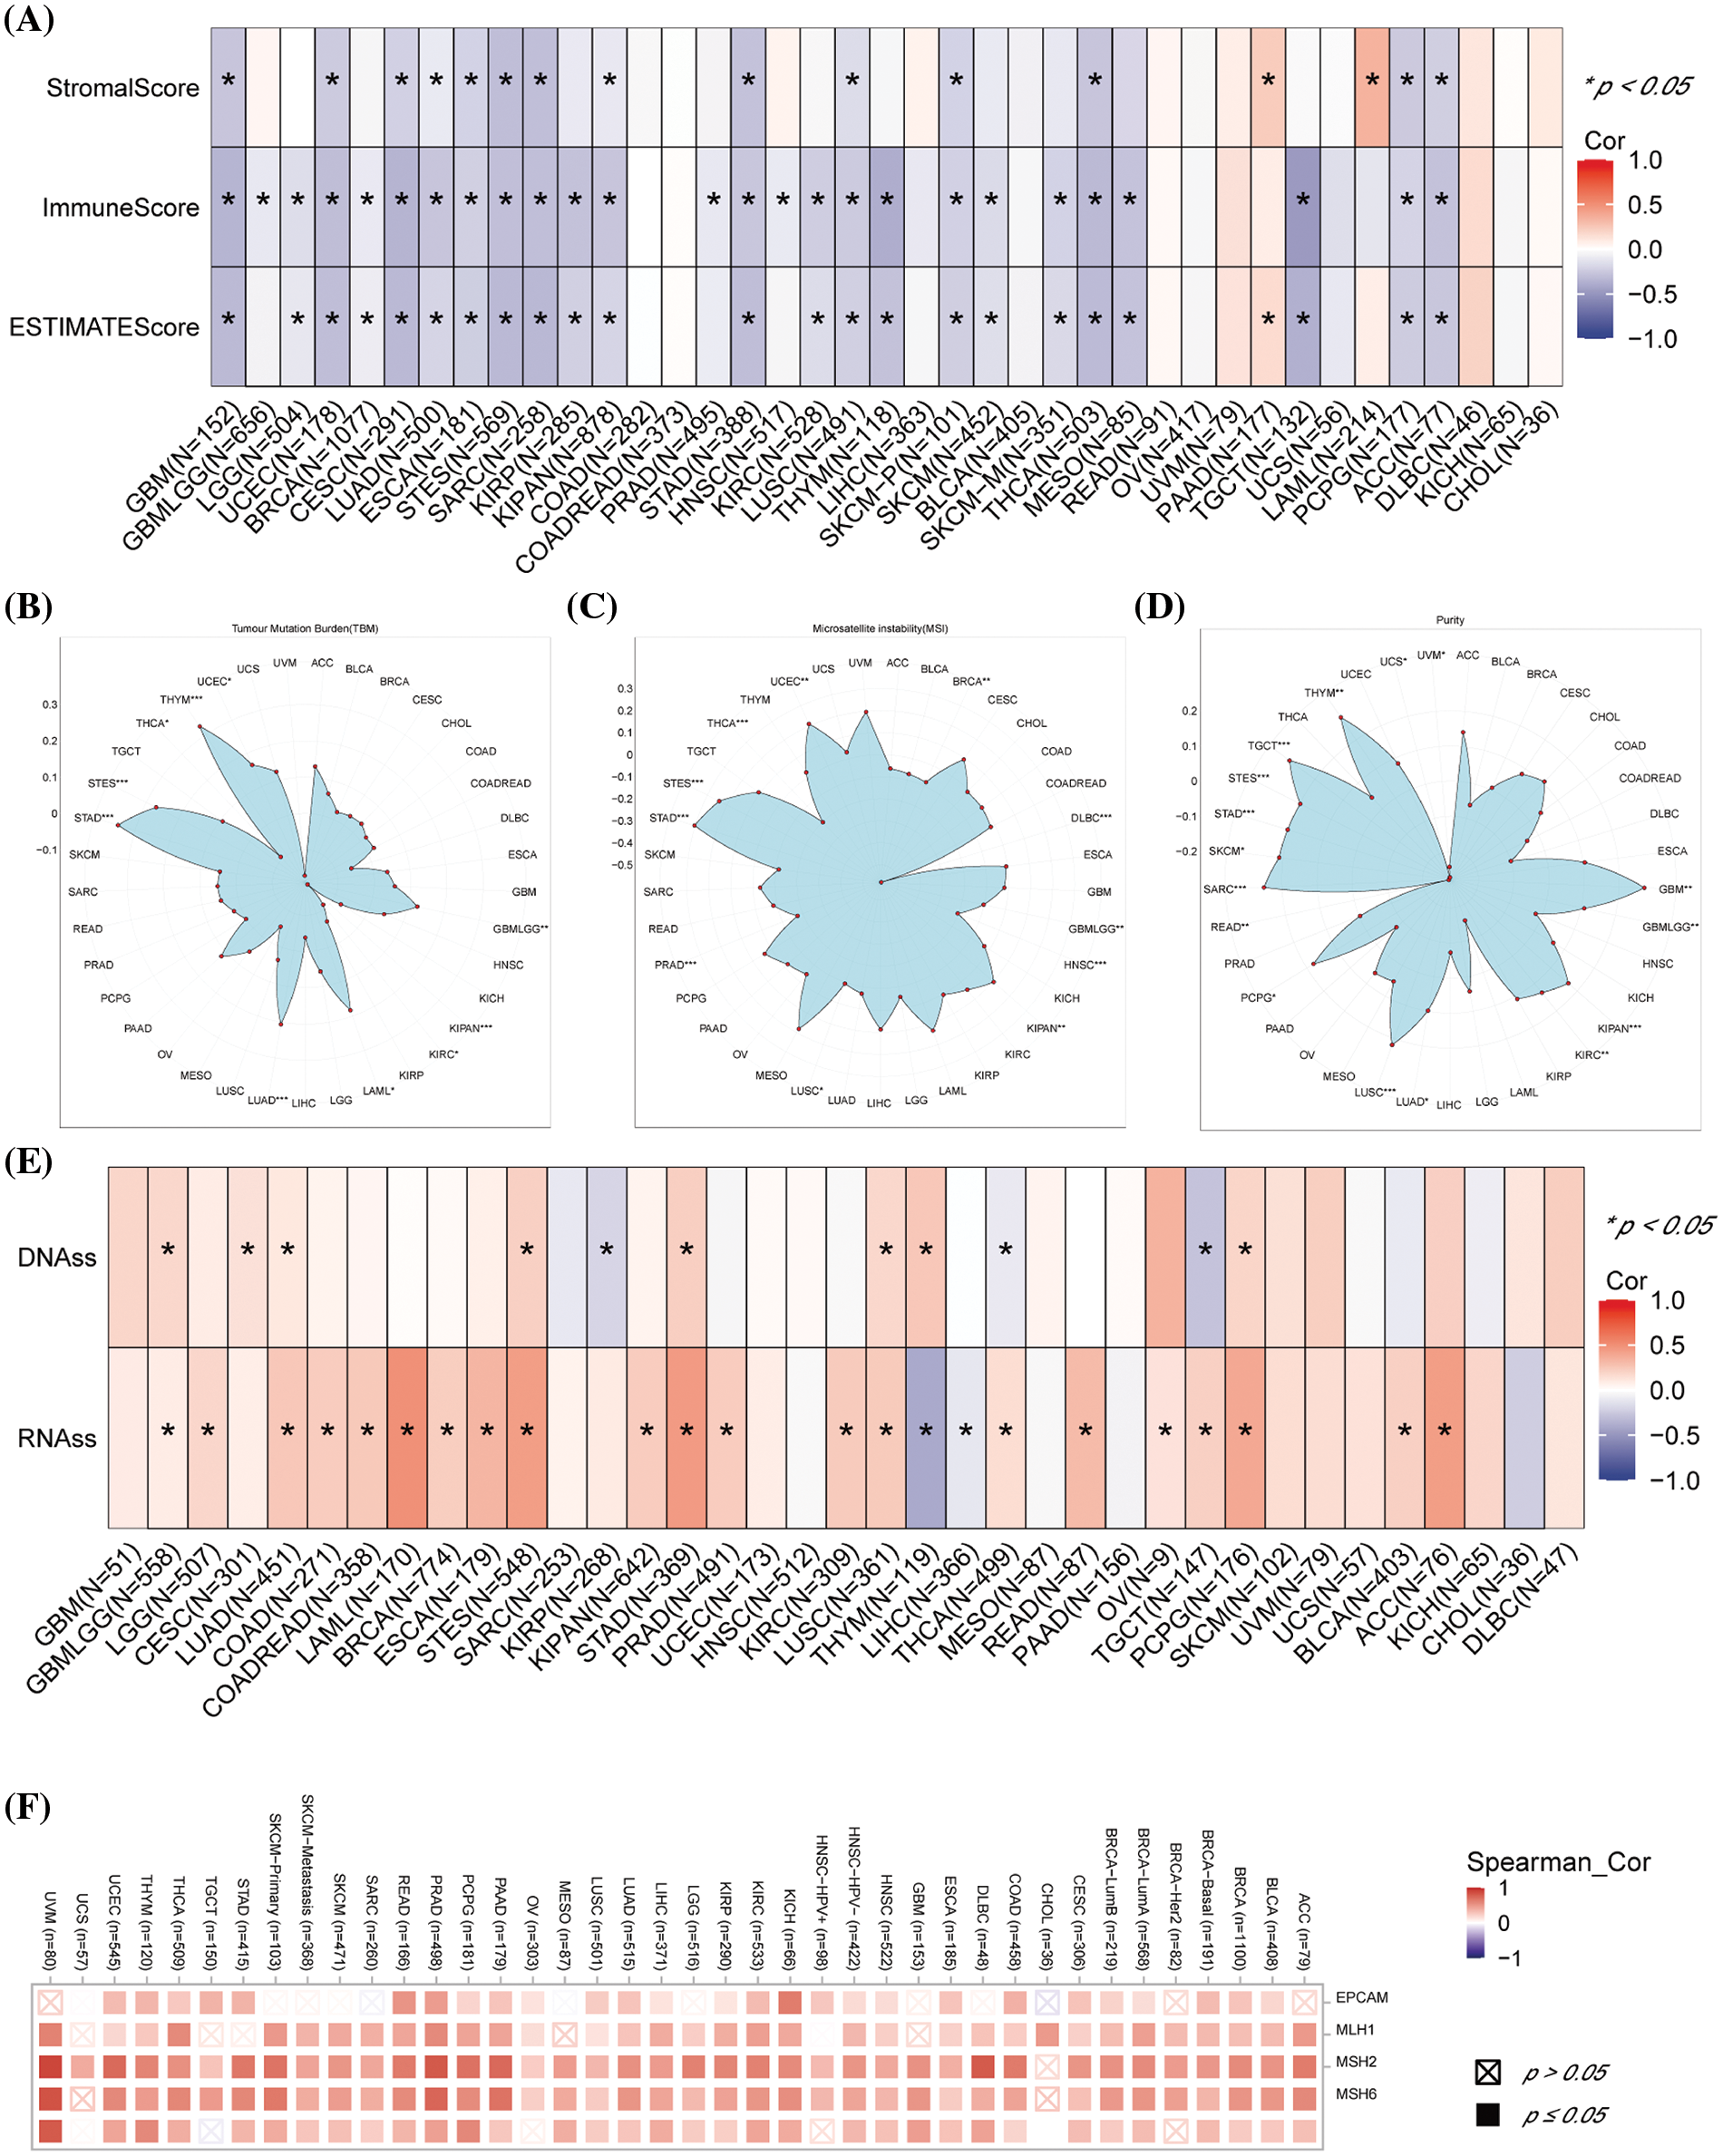
Figure 6: Association between DLAT expression and immune infiltration across cancers. (A) Relationship between DLAT expression and the StromalScore, ImmuneScore, and ESTIMATEScore. (B) Association of DLAT expression with the TBM. (C) Association of DLAT expression with MSI. (D) Association of DLAT expression with purity. (E) Association of DLAT expression with DNAss and RNAss. (F) Association of DLAT expression with MMR. *p < 0.05; **p < 0.01; ***p < 0.001.
TMB, MSI, and tumor purity are emerging biomarkers associated with the immunotherapy response. We revealed that DLAT expression was positively related to TMB in GBMLGG, LUAD, LAML, STES, STAD, UCES, and THYM (Fig. 6B). In addition, DLAT expression was negatively correlated with MSI in GBMLGG, BRCA, PRAD, HNSC, LUSC, THCA, and DLBC (Fig. 6C). Besides, DLAT was positively related to purity in GBMLGG, TGCT, THYM, GBM, SARC, LUSC, SKCM, STAD, STES, PCPG, KIPAN, KIRC, and LUAD (Fig. 6D).
RNAss and DNAss can reflect the features of tumor stem cells. The high stemness scores represent the activity of tumor stem cells, are correlated with drug resistance and the continuous proliferation of tumor cells, and are correlated with poorer survival. Additionally, we found DLAT was positively correlated with RNAss and DNAss in most cancers, including GBMLGG (Fig. 6E). These results identified DLAT as a prognostic factor for patients.
In addition, deficient mismatch repair (MMR) also participated in tumorigenesis and development. We demonstrated that DLAT expression was positively correlated with almost all five MMR genes (MSH2, MSH6, PMS2, MLH1, and EPCAM) in most tumors (Fig. 6F). Therefore, DLAT might affect tumor development by regulating the repair of DNA mismatch in cancers.
Tumor immune microenvironment analysis
We explored the association between DLAT expression and immune-related cell infiltration by using different algorithms. DLAT expression was statistically negatively associated with CD4+ T cells infiltration in TGCT (Fig. 7A). Moreover, our data demonstrate that DLAT expression was statistically negatively related to CD8+ T cells infiltration in ACC, GBM, HNSC, HNSC-HPV+, OV, TGCT, and UCEC (Fig. 7B). In addition, DLAT expression was statistically positively correlated in HNSC-HPV+, LIHC, PRAD, and SKCM-P (Fig. 7C). Additionally, DLAT expression was positively related in BRCA-lumB, CESC, HNSC, HNSC-HPV+, LIHC, and PAAD (Fig. 7D). Furthermore, we suggested that DLAT was significantly negatively associated with the infiltration level of most immune cells across cancers, including CD8+ T cells and plasmacytoid dendritic cells, while positively related to T helper 2 cells and central memory T cells (Suppl. Fig. S6).
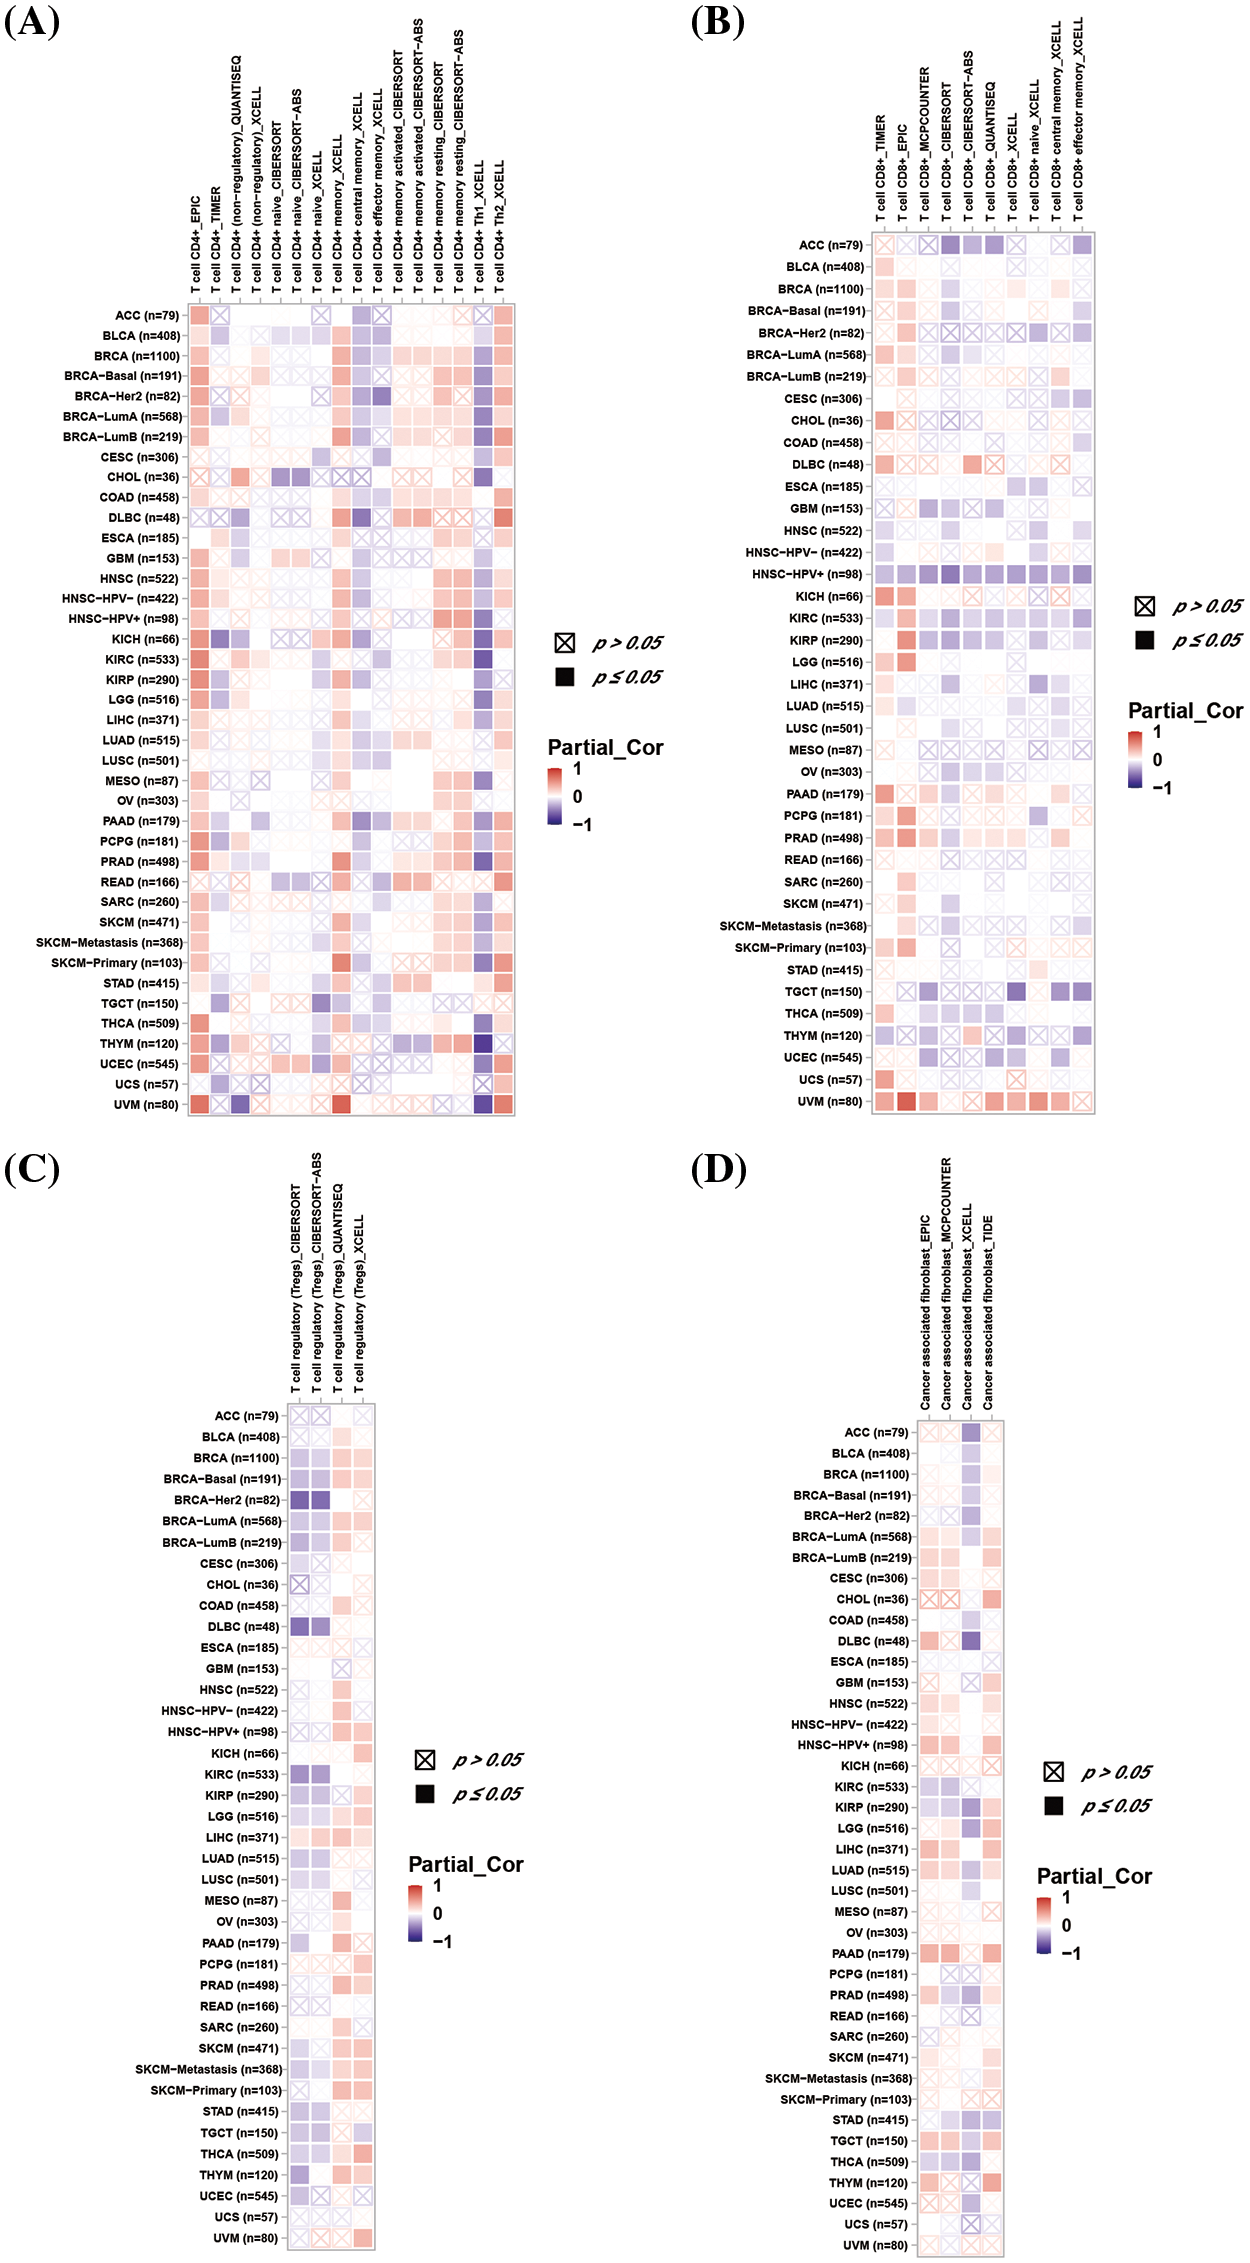
Figure 7: Association between DLAT expression and immune cell infiltration across cancers. (A) Relationship between DLAT and the immune infiltration of CD4+ T cells. (B) Association between DLAT and the immune infiltration of CD8+ T cells. (C) Correlation between DLAT and the immune infiltration of Tregs. (D) Relationship between DLAT and the immune infiltration of cancer-associated fibroblasts.
Tumors can escape immune responses by immune checkpoint proteins and immune regulatory genes could participate in immune response. We exhibited that DLAT expression was positively associated with immune checkpoint genes in the majority of tumor types including GBMLGG and LGG (Fig. 8A). Additionally, DLAT expression was positively correlated with immune regulatory genes in many tumor types including GBMLGG and LGG (Fig. 8B). In general, these results suggested that DLAT might regulate immune cell infiltration and the immune pathways in most tumor types.
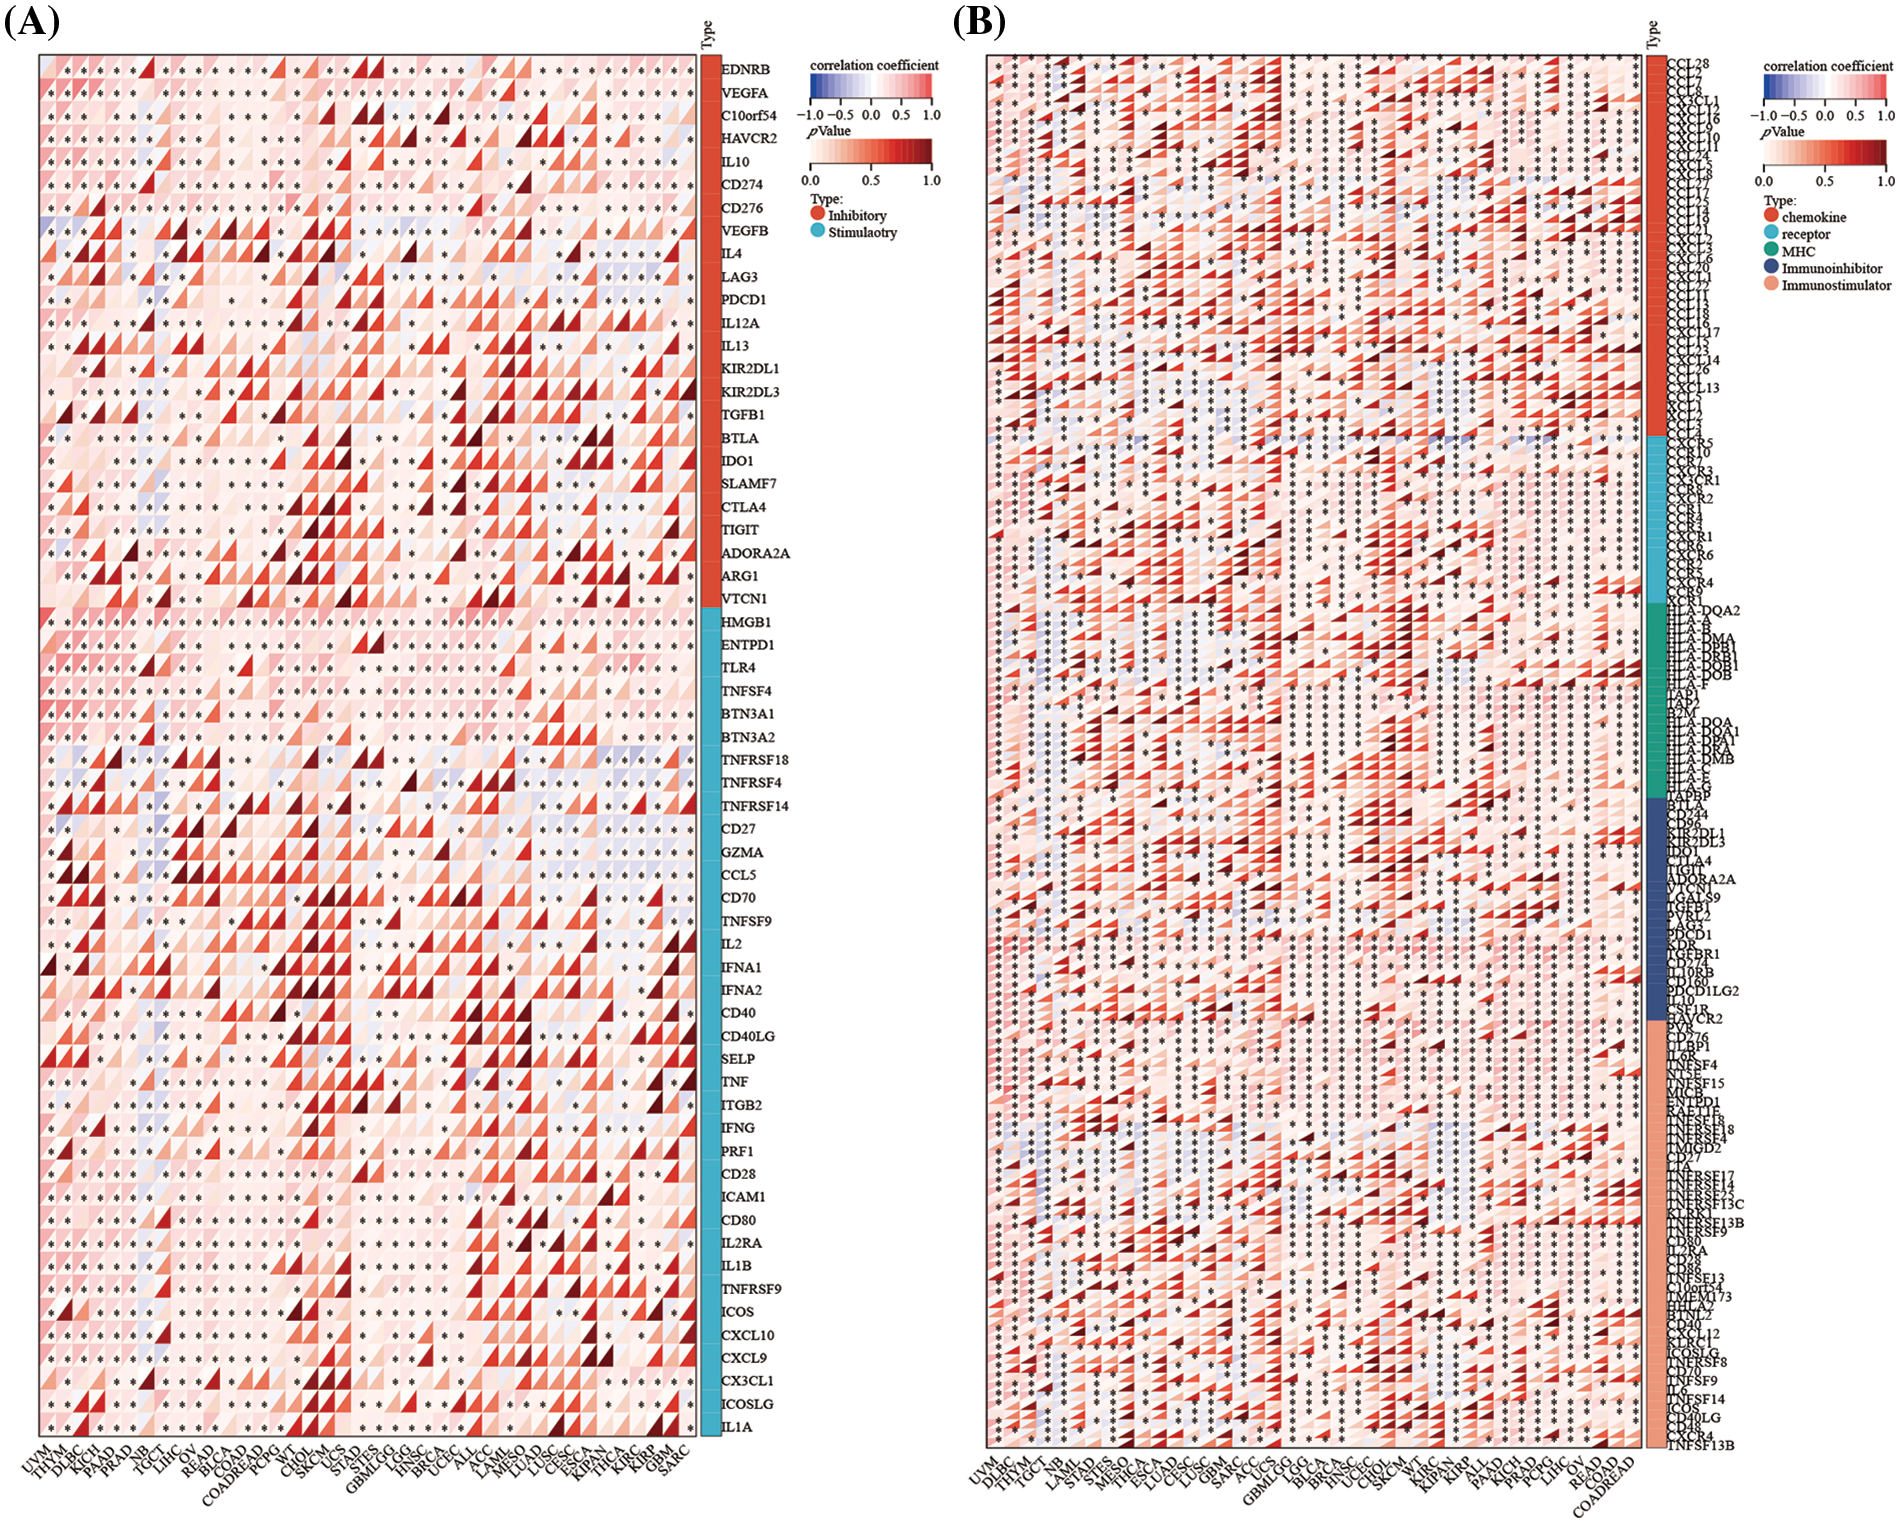
Figure 8: Association between DLAT expression and immune-related genes across cancers. (A) Correlation between DLAT and immune checkpoint genes. (B) Association between DLAT and immune regulatory genes. *p < 0.05.
A total of 50 DLAT-binding proteins were acquired by using the STRING tool (Fig. 9A). The top 100 DLAT-related genes were obtained from the GEPIA2 tool. We identified that the DLAT was positively correlated with Succinate Dehydrogenase Complex Subunit D (SDHD), Zw10 Kinetochore Protein (ZW10), Cullin 5 (CUL5), Ubiquitination Factor E4A (UBE4A) and NADH: Ubiquinone Oxidoreductase Core Subunit S1 (NDUFS1) (Fig. 9B). The heatmap data also exhibited a positive relationship between DLAT and the above five genes across cancer (Fig. 9C). Dihydrolipoamide dehydrogenase (DLD) and citrate synthase (CS) were two common genes in these two groups (Fig. 9D). KEGG pathway enrichment analysis of these two datasets revealed that these genes were mainly related to carbon metabolism, the citrate cycle (TCA cycle), and others (Fig. 9E). GO enrichment analysis identified that these genes mainly played molecular functions in oxidoreductase activity, electron transfer activity, and others (Fig. 9F). Moreover, we performed GSEA analysis and found that DLAT related genes were mainly enriched in pathways like cell cycle in BLCA and GBMLGG (Suppl. Fig. S7).
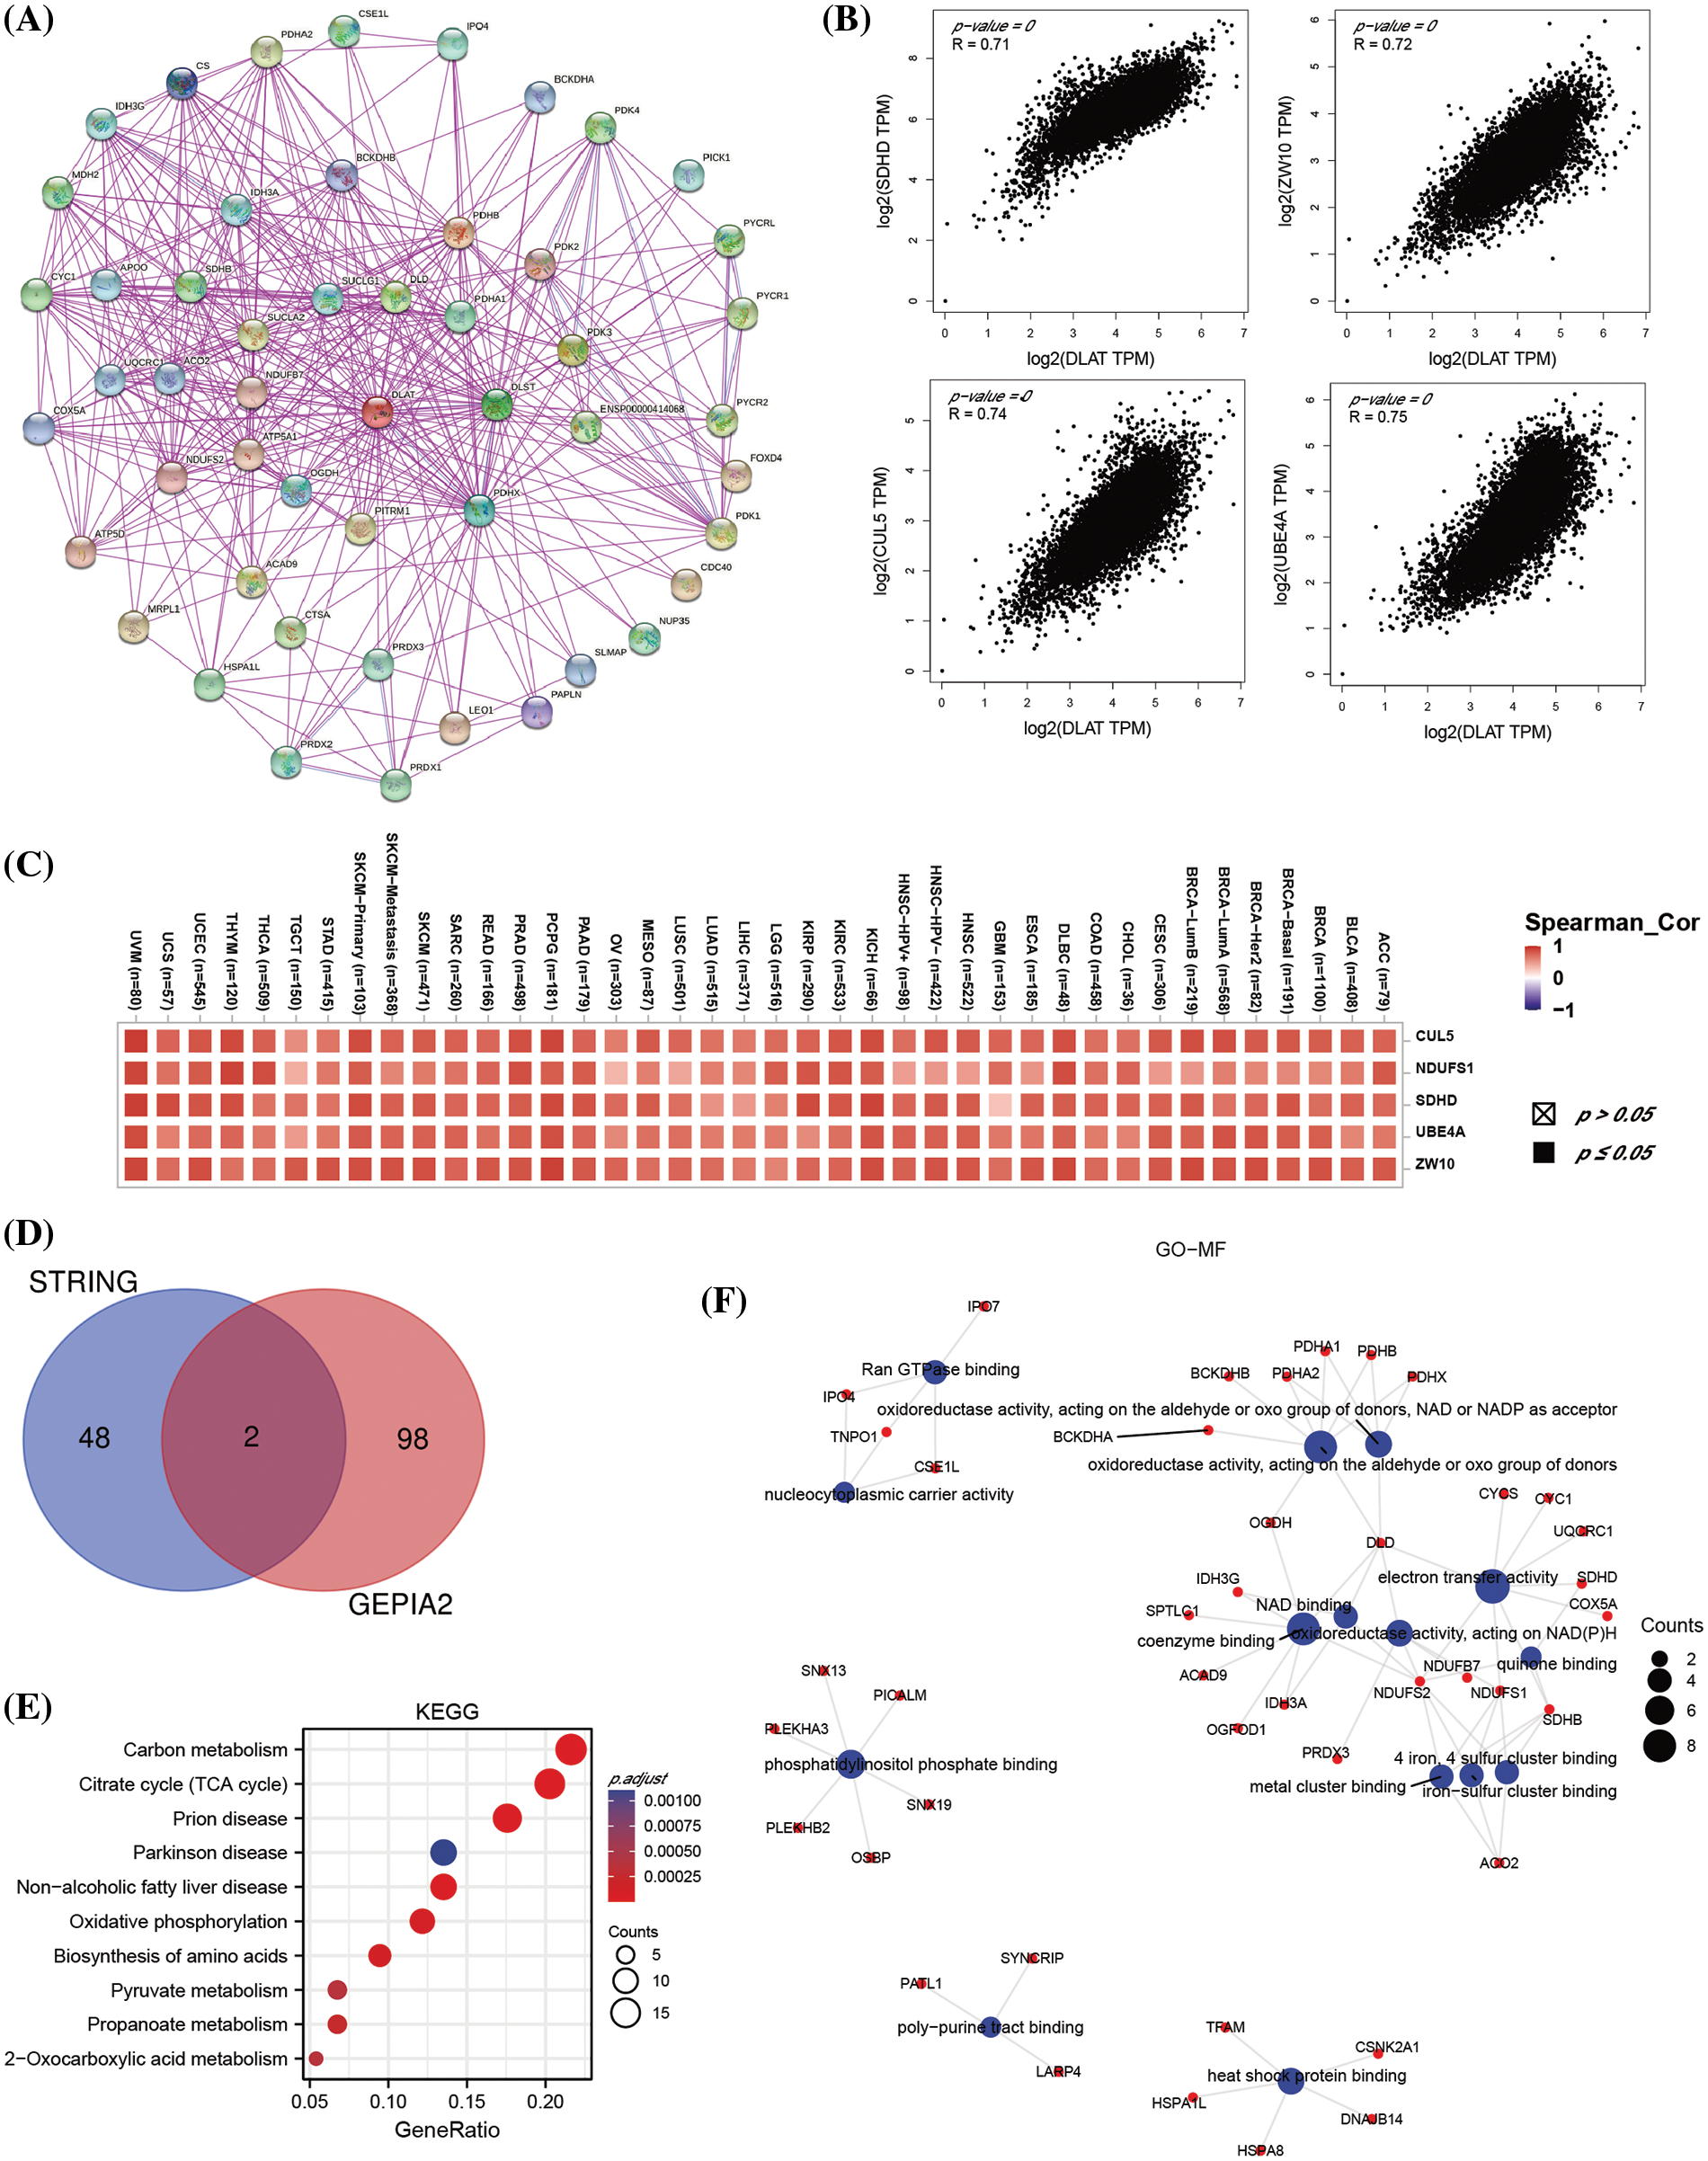
Figure 9: The enrichment analysis of DLAT-related genes across cancers. (A) The DLAT-binding proteins from the STRING. (B) The top 4 DLAT-related genes by GEPIA2. (C) Heatmap for the five DLAT-related genes across cancers. (D) Venn plot for the intersection of the DLAT-binding and related genes. (E) KEGG pathway analysis from the two datasets. (F) The circle map for the molecular function in GO analysis.
DLAT acts as a biomarker for glioma cancer
The above studies demonstrated that DLAT was significantly highly expressed in GBM and LGG, and it was strongly associated with OS, DSS, and PFI in GBMLGG patients. Besides DLAT expression was also significantly associated with tumor microenvironment. Therefore, we next explored the clinical value and the potent biological functions of DLAT in glioma patients. We identified that the protein levels of DLAT were increased in glioma tissue than in normal tissue, especially in high-grade glioma patients (Suppl. Fig. S8). We assessed the prognostic value of DLAT in CGGA clinical samples, and we showed that increased DLAT expression was related to poor survival in primary glioma patients, and in grade III patients in different datasets (Fig. 10A). Furthermore, we found that higher DLAT levels were correlated with glioblastoma, IDH status (wild type), and primary therapy outcome (PD) (Fig. 10B). While DLAT expression was not correlated with 1p/19q codeletion status (Fig. 10B).
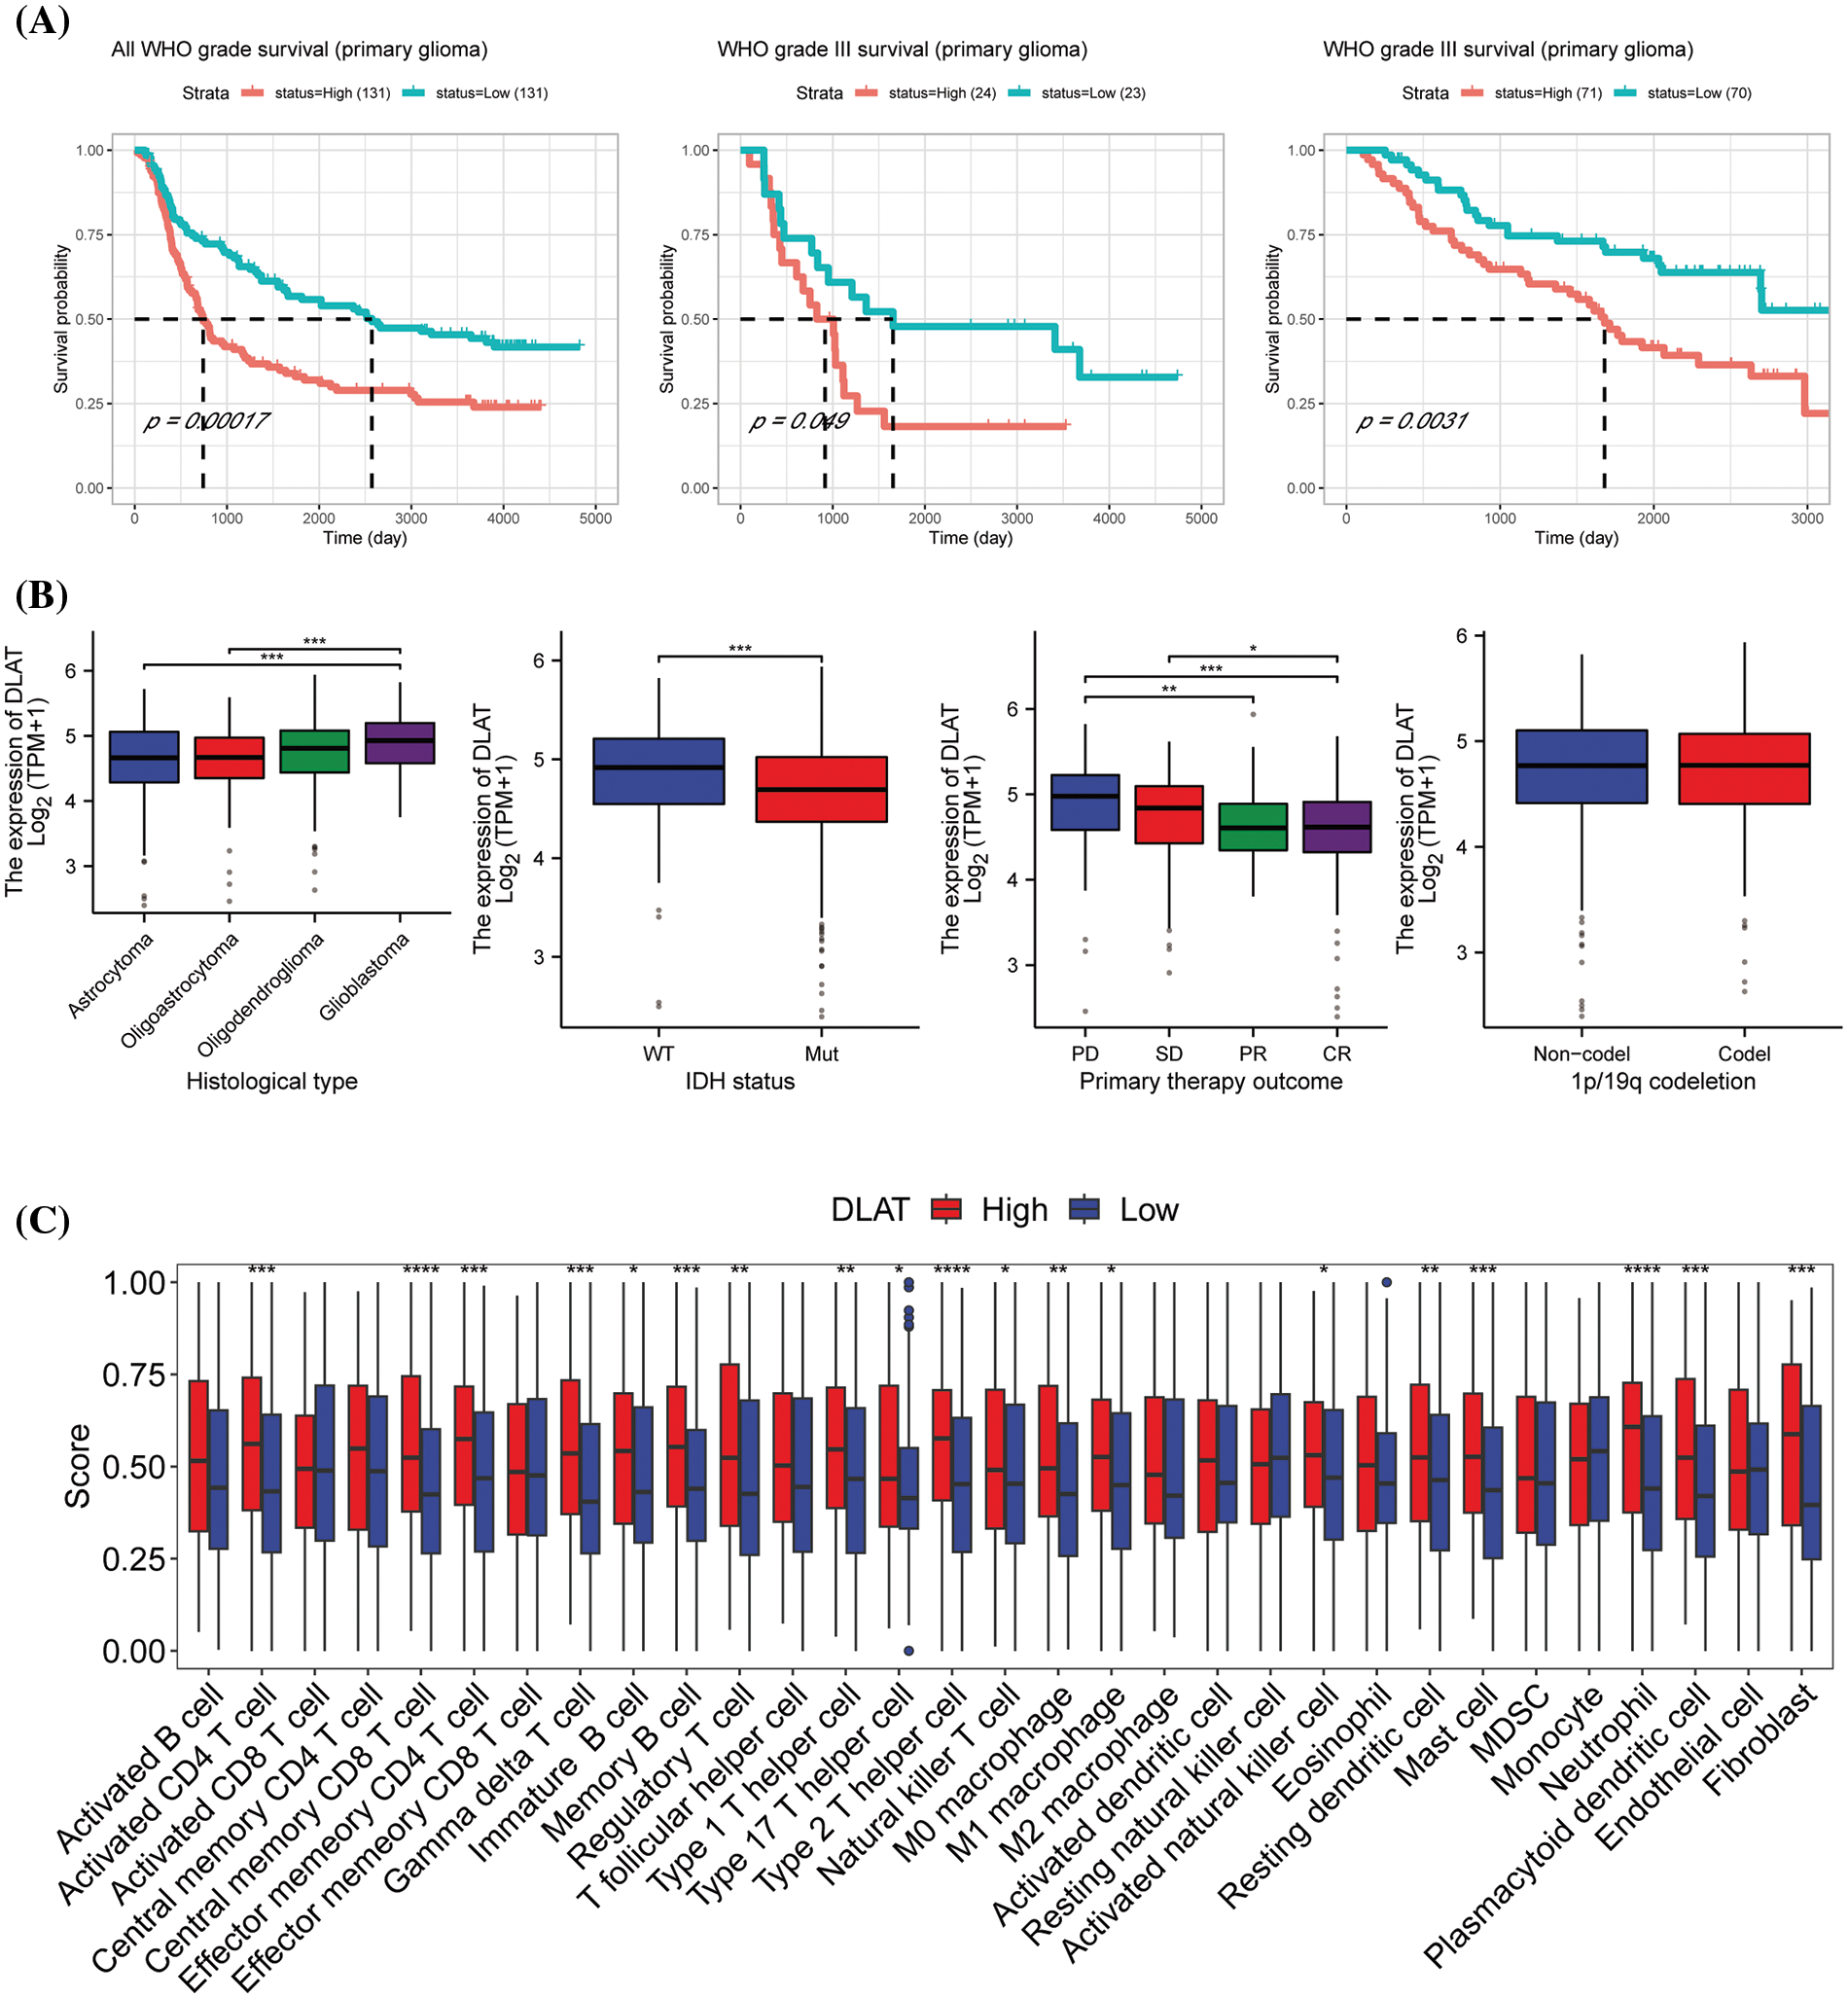
Figure 10: The clinical value and the potent biological functions of DLAT in glioma. (A) The survival analysis of DLAT in glioma patients. (B) Relationship between DLAT expression and clinical characteristics in GBMLGG, including histological type, IDH status, primary therapy outcome, and p/19q codeletion. (C) Difference of the infiltration of immune cells between high and low DLAT expression groups in CGGA database. *p < 0.05; **p < 0.01; ***p < 0.001; ****p < 0.0001.
Then we performed GSEA to explore the functions of DLAT in GBMLGG. The top 10 GSEA terms in the indicated tumor types are shown in Fig. 10C. We demonstrated that DLAT had a strong association with sister chromatid segregation, and ATP-dependent activity acting on DNA, mainly located in the synaptic membrane. The enrichment HALLMARK pathways showed that DLAT might play a role in the G2/M checkpoint, E2F targets, Uv response, epithelial-mesenchymal transition (EMT), and mitotic spindles (Suppl. Fig. S9). These suggested DLAT may participate in the cell cycle to affect the occurrence and progression of tumors. Furthermore, we performed an experimental study to verify the function of DLAT in glioma cells.
Furthermore, we performed ssGSEA analysis to evaluate immune cell infiltrtions in glioma. We discovered that DLAT high expression group was immune-active and stroma-rich subtype, which had high infiltrating levels of M0 and M1 macrophages, fibroblast, actived CD4 T cell, central memory CD8 T cell, effector memory CD4 Tcell, gamma delta T cell, immature B cell, memory B cell, regulatory T cell, type 1, 17, and 2 helper T cells, actived natural killer cell, mast cell, matural killer T cell, neutrophil, and plasmacytoid dendritic cell (Fig. 10C and Suppl. Fig. S10). While low DLAT expression group was immune-desert subtype, was characterized by low infiltration of most immune and stromal cells.
DLAT was mainly expressed in malignant cells at single cells in glioma tissues by TISCH (Figs. 11A and 11B). Besides, we found that DLAT was mainly located in the endoplasmic reticulum (ER) (Fig. 11C). To validate the function of DLAT in glioma, we developed silenced DLAT A172 glioma cell lines (Fig. 11D). Furthermore, DLAT silencing inhibited cell proliferation (Fig. 11E), promoted cell apoptosis (Fig. 11F), and inhibited the migration and invasion (Fig. 11G). These results demonstrated that DLAT was essential in the occurrence and development of glioma.
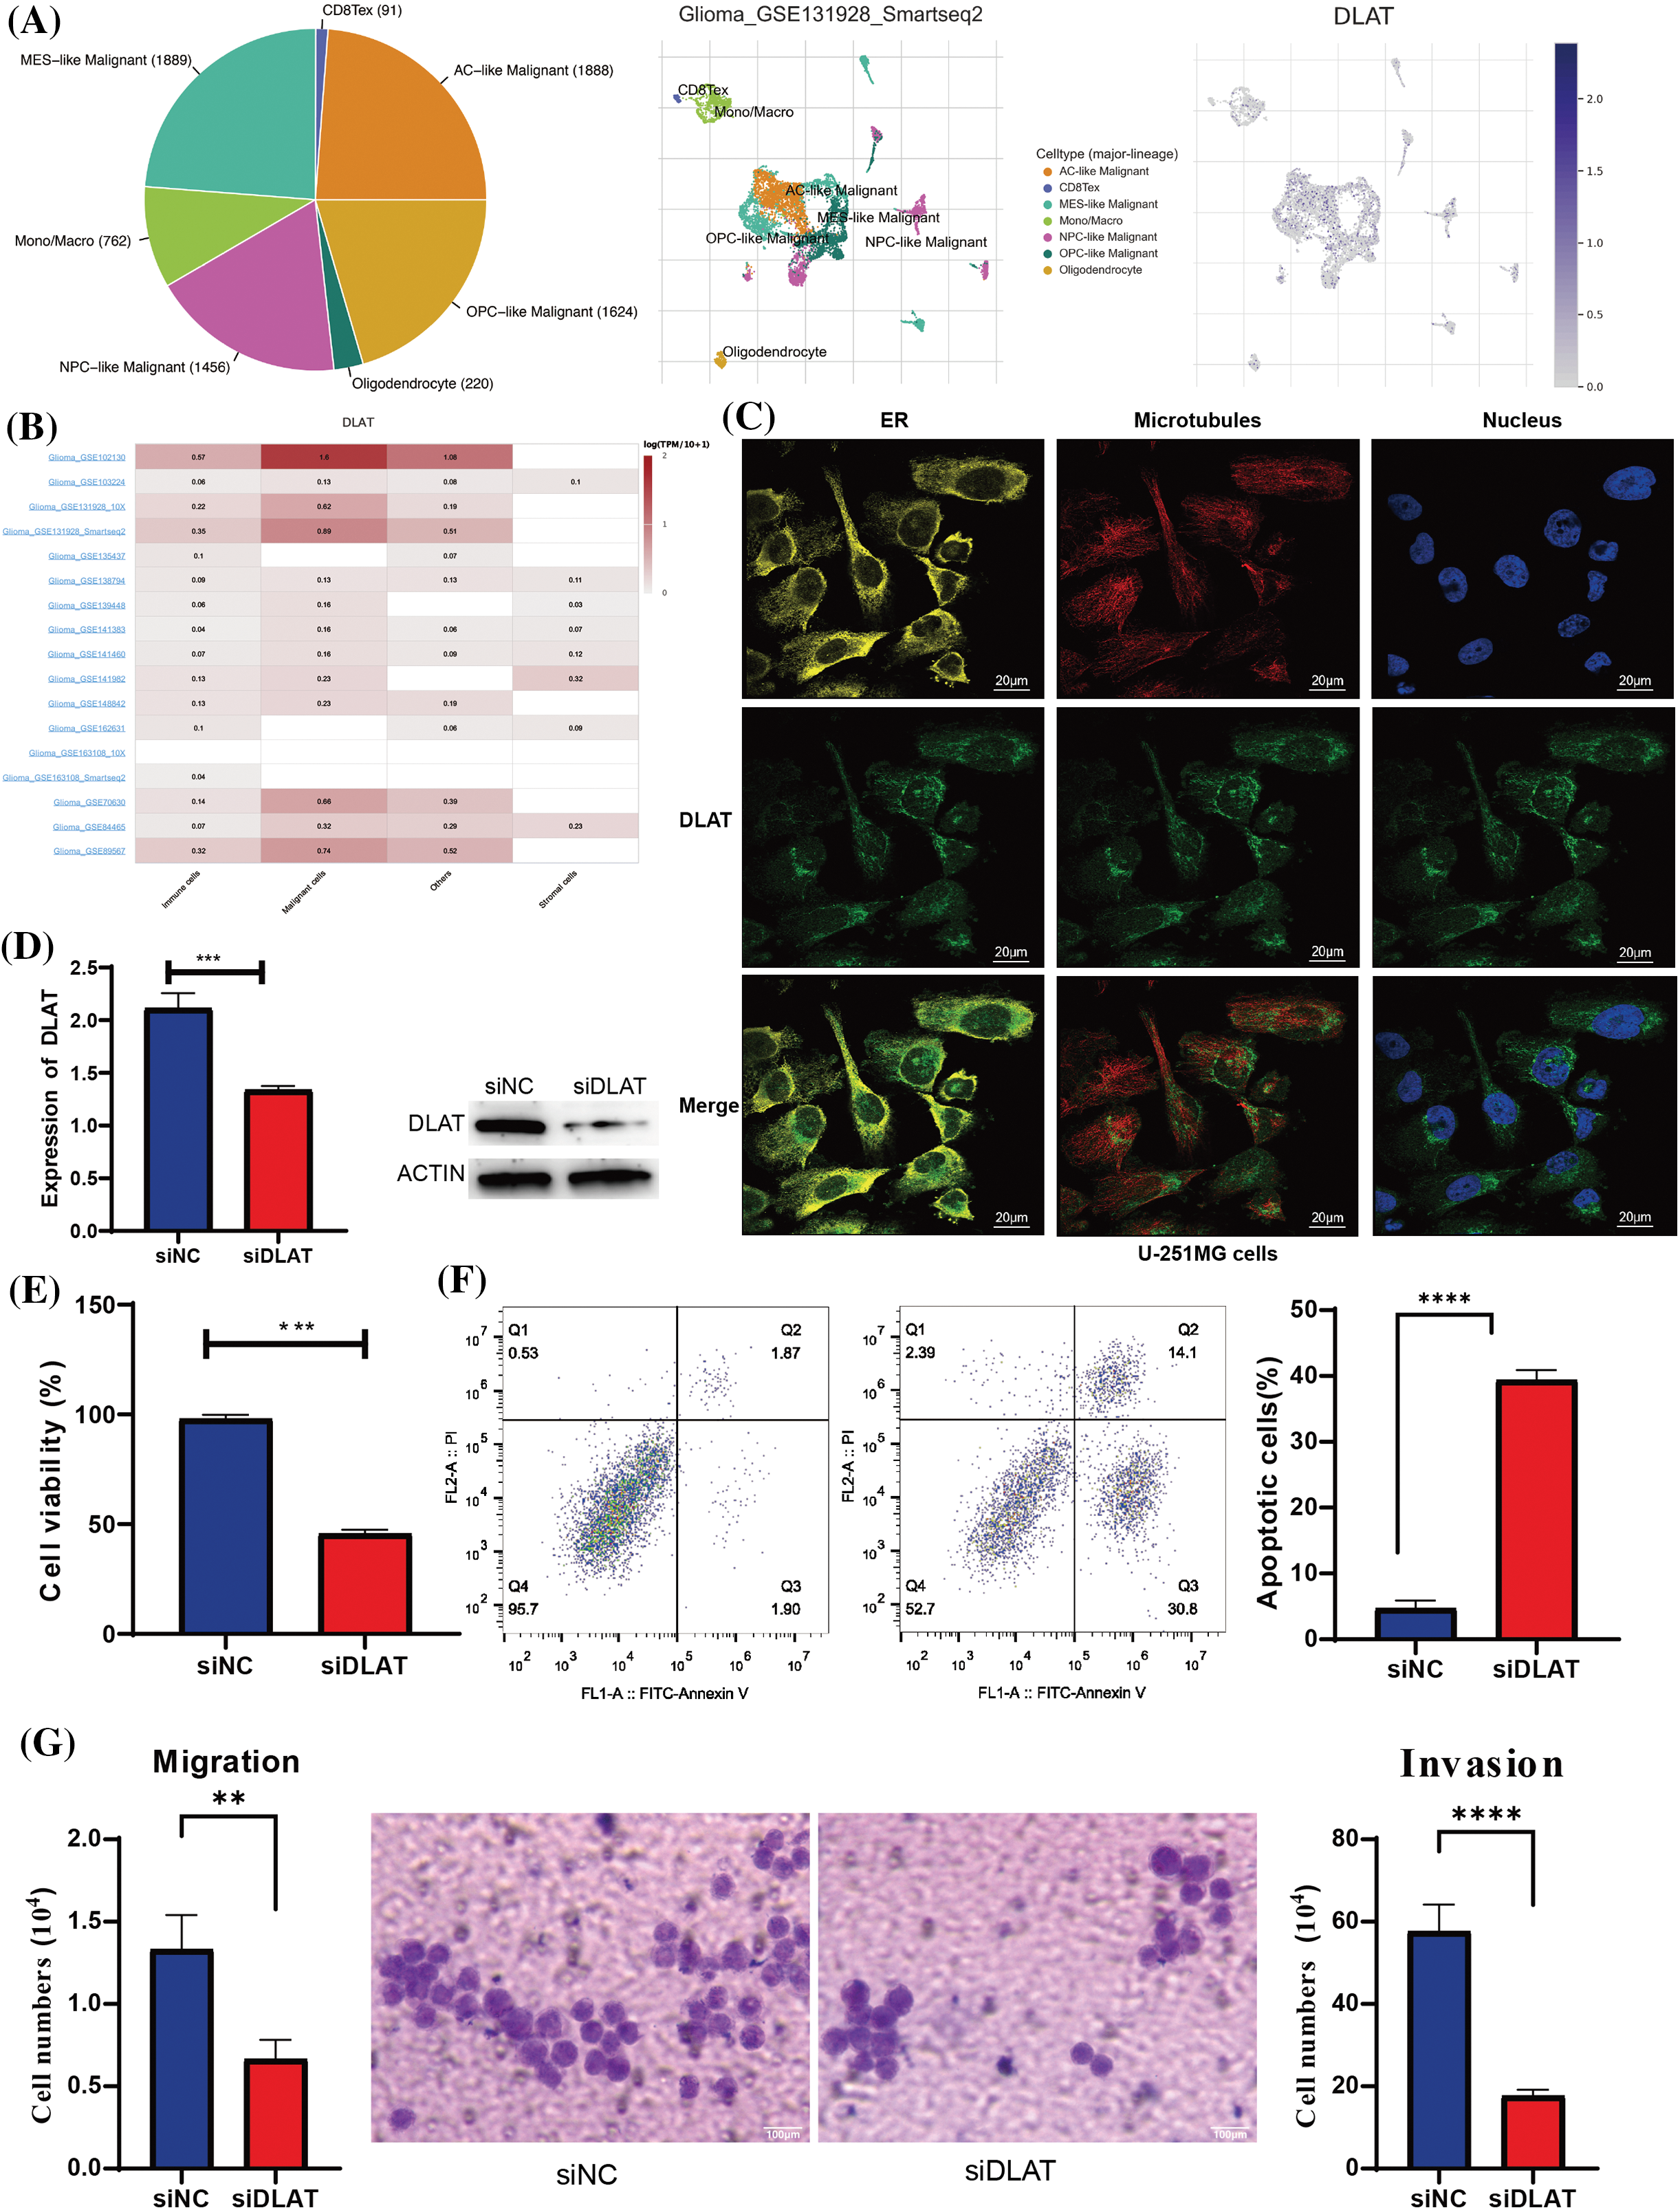
Figure 11: Validation of the expression of the DLAT. (A) The expression profiles of DLAT in the single cells from glioma tissues. (B) DLAT RNA-seq analysis of the Genotype-Tissue Expression (GTEx) and TCGA sample set. (C) The qRT-PCR and WB detected the efficacy of silencing DLAT in A172 cells. (D) The silencing of DLAT inhibited the cell viability of A172 cells. (E) The silencing of DLAT promoted the apoptosis of the A172 cells. (F, G) Migration and invasion ratio of the GBM cell line by Transwell membranes (5-mm pore size). Independent experiments were performed 3 times. n = 3 per group. **p < 0.01; ***p < 0.001; ****p < 0.0001.
DLAT is subunit E2 of the pyruvate dehydrogenase complex (PDC) [4], and was essential for malignancies by regulating cuproptosis [24]. DLAT was reported to be associated with some cancers and participated in the occurrence and prognosis of tumors. However, the detailed role of DLAT across cancers and the potential mechanism for tumorigenesis are still unclear. Therefore, we performed a comprehensive analysis of DLAT across cancers and validated its function in glioma.
We demonstrated that the DLAT gene was increased in most cancers, and was a risk prognostic factor. In addition, DLAT expression was associated with age, tumor stage, and diagnostic value. These results were consistent with previous studies [6,10,12–14]. DLAT could also affect the efficacy of many compounds. A previous study showed that alternate killed prostate cancer by targeting the DLAT protein [25]. This indicated that DLAT acted as a biomarker for the prognosis, diagnosis, and therapy of cancer patients.
Genetic and epigenetic alterations have been closely associated with tumorigenesis. RNA methylation modifications play a role in many processes, like cell differentiation and development [16,26–28]. DNA methylation plays an important role in the occurrence and progression of cancers [29,30]. Our results identified that DLAT was positively related to RNA methylation modification genes and DNA methylation. These revealed that genetic and epigenetic alterations could affect DLAT expression and participate in the development of tumors.
TMB, MSI, and tumor purity are emerging biomarkers associated with the immunotherapy response [18,31,32]. Moreover, previous studies also clarified that high somatic TMB was associated with favorable survival prognosis in cancer patients with immunotherapy [33,34]. Additionally, patients with gastroesophageal cancer and colorectal cancer with high-frequency MSI were related to favorable efficacy and good survival after immunotherapy [34,35]. RNAss and DNAss can reflect the features of tumor stem cells [20]. The high stemness scores represent the activity of tumor stem cells, and is associated with drug resistance and the continuous proliferation of tumor cells, and are correlated with poorer survival [21]. MMR helps cells to maintain genomic stability. MMR deficiency is associated with the therapeutic efficacy of immunotherapy [36]. We showed that DLAT expression was significantly associated with TMB, MSI, purity, stemness scores, and MMR in multiple cancer types, thereby affecting the efficacy of immunotherapy. Therefore, DLAT could be a possible immunotherapeutic target for cancers.
Currently, the tumor immune microenvironment (TIME), comprising various infiltrating immune and stromal cells influences malignancies, including the proliferation and invasion of tumors [37,38], and affects treatment response and clinical outcomes [39]. The ESTIMATE algorithm is a prognostic factor in cancers [40]. The high ESTIMATE score is associated with a low purity, advanced cancer stage, and poor prognosis [40,41]. The present research displayed notable negative correlations between DLAT expression and all three scores, for example in GBM, which may explain, in some ways, the essential role of DLAT in GBM, as mentioned above. The tumor stroma contains immune infiltration cells, which critically take part in tumor occurrence and progression [38,42]. Our study exhibited that DLAT expression was associated with CD4+ T cells, CD8+ T cells, Tregs, and cancer-associated fibroblasts in many cancers. For example, CD8+ T cells were negatively correlated with GBM. Furthermore, DLAT expression was positively related to different immune-related genes and immune infiltrating cells in cancers such as GBM, UVM, and DLBC. Therefore, we inferred that DLAT might form positive feedback with certain immune checkpoint genes, inhibiting the function of cytotoxic immune cells, enabling tumor cells to escape immune surveillance, and enhancing their malignancy.
Single-cell analysis displayed that DLAT might participate in cancers by regulating DNA repair and stemness. KEGG and GO enrichment analyses suggested that DLAT was related to the TCA cycle, and others. GSEA suggested that DLAT participated in the processes of the cell cycle, transcription factors, inflammatory response, and so on. In conclusion, these results identified that DLAT played an oncogenic role across cancers.
In addition, we analyzed that DLAT was highly expressed in glioma patients, and acted as a risk prognostic factor. Besides, the high DLAT expression had immune-active and stroma-rich subtypes, which had both tumor-suppressing and tumor-promoting immune cells and stromal cells, might benefit from immunotherapy [22]. This result was consistent with the result of relationship between DLAT and MSI status. However, these results only reflected the relationship but not the causation, more experiments are needed. DLAT silencing experiment demonstrated that DLAT was essential in the occurrence and development of glioma.
The above comprehensive analysis identified that DLAT might be a potential prognostic and immune infiltration marker and therapeutic target for tumors, while further experiments are needed to validate its correlation with immune infiltration, and verify the relationship with the current immunotherapy. Undeniably, our study had several limitations. First, part of our study was based on public databases, and more clinical studies were needed to understand the potential mechanism further to validate the relationships. Second, more experimental studies are needed to further understand the potential mechanism.
In summary, our study systematically performed a multi-omics combined analysis of DLAT across cancers, and we demonstrated the abnormal expression profiles of DLAT and its relationship with clinical, prognosis, epigenetic alterations, and immune response. Additionally, we also analyzed the potential function and mechanism of DLAT in a variety of human cancers, and validated its oncogenic role in glioma cells.
Acknowledgement: Thanks for all the public databases mentioned in the article.
Funding Statement: This work was supported by Achievement Transformation Project (No. CGZH21001), 1.3.5 Project for Disciplines of Excellence, West China Hospital, Sichuan University (No. ZYJC21007), Translational Research Grant of NCRCH (No. 2021WWB03), Chengdu Science and Technology Program (No. 2022-YF05-01444-SN), Key Research and Development Program of Sichuan Province (No. 2023YFS0031), National Key Research and Development Program of China (Nos. 2022YFC2502600, 2022YFC2502603), and National Natural Science Foundation of China (No. 82370192).
Author Contributions: Study conception and design: Hui Zhou, Zhengyu Yu, Jinrong Yang, and Ting Niu; data collection: Hui Zhou, Jing Xu, and Zhengyu Yu; performed the experiments: Zhengyu Yu and Zhongwang Wang; analysis and interpretation of results: Hui Zhou, Jing Xu, Yaoli Tao, Jinjin Wang, and Peipei Yang; draft manuscript preparation: Hui Zhou and Zhengyu Yu; manuscript revised: Hui Zhou, Jing Xu and Ting Niu. All authors reviewed the results and approved the final version of the manuscript.
Availability of Data and Materials: The datasets presented in this study can be found in online repositories.
Ethics Approval: Not applicable.
Conflicts of Interest: The authors declare that they have no conflicts of interest to report regarding the present study.
Supplementary Materials: The supplementary material is available online at https://doi.org/10.32604/or.2024.048138.
References
1. Singh, A. K., McGuirk, J. P. (2020). CAR T cells: Continuation in a revolution of immunotherapy. The Lancet Oncology, 21(3), e168–e178. https://doi.org/10.1016/s1470-2045(19)30823-x. [Google Scholar] [PubMed] [CrossRef]
2. He, X., Xu, C. (2020). Immune checkpoint signaling and cancer immunotherapy. Cell Research, 30(8), 660–669. https://doi.org/10.1038/s41422-020-0343-4. [Google Scholar] [PubMed] [CrossRef]
3. Ribas, A., Wolchok, J. D. (2018). Cancer immunotherapy using checkpoint blockade. Science, 359(6382), 1350–1355. https://doi.org/10.1126/science.aar4060. [Google Scholar] [PubMed] [CrossRef]
4. Stacpoole, P. W. (2017). Therapeutic targeting of the pyruvate dehydrogenase complex/pyruvate dehydrogenase kinase (PDC/PDK) axis in cancer. Journal of the National Cancer Institute, 109(11). https://doi.org/10.1093/jnci/djx071. [Google Scholar] [PubMed] [CrossRef]
5. Houten, S. M., Wanders, R. J. A. (2010). A general introduction to the biochemistry of mitochondrial fatty acid β-oxidation. Journal of Inherited Metabolic Disease, 33(5), 469–477. https://doi.org/10.1007/s10545-010-9061-2. [Google Scholar] [PubMed] [CrossRef]
6. Goh, W. Q., Ow, G. S., Kuznetsov, V. A., Chong, S., Lim, Y. P. (2015). DLAT subunit of the pyruvate dehydrogenase complex is upregulated in gastric cancer-implications in cancer therapy. American Journal of Translational Research, 7(6), 1140–1151. [Google Scholar] [PubMed]
7. Hanahan, D., Weinberg, R. A. (2011). Hallmarks of cancer: The next generation. Cell, 144(5), 646–674. https://doi.org/10.1016/j.cell.2011.02.013. [Google Scholar] [PubMed] [CrossRef]
8. Pavlova, N. N., Thompson, C. B. (2016). The emerging hallmarks of cancer metabolism. Cell Metabolism, 23(1), 27–47. https://doi.org/10.1016/j.cmet.2015.12.006. [Google Scholar] [PubMed] [CrossRef]
9. Ward, P. S., Thompson, C. B. (2012). Metabolic reprogramming: A cancer hallmark even Warburg did not anticipate. Cancer Cell, 21(3), 297–308. https://doi.org/10.1016/j.ccr.2012.02.014. [Google Scholar] [PubMed] [CrossRef]
10. Chen, Q., Wang, Y., Yang, L., Sun, L., Wen, Y. et al. (2022). PM2.5 promotes NSCLC carcinogenesis through translationally and transcriptionally activating DLAT-mediated glycolysis reprograming. Journal of Experimental & Clinical Cancer Research, 41(1), 229. https://doi.org/10.1186/s13046-022-02437-8. [Google Scholar] [PubMed] [CrossRef]
11. Yang, M., Zheng, H., Xu, K., Yuan, Q., Aihaiti, Y. et al. (2022). A novel signature to guide osteosarcoma prognosis and immune microenvironment: Cuproptosis-related lncRNA. Frontiers in immunology, 13, 919231. https://doi.org/10.3389/fimmu.2022.919231. [Google Scholar] [PubMed] [CrossRef]
12. Bian, Z., Fan, R., Xie, L. (2022). A novel cuproptosis-related prognostic gene signature and validation of differential expression in clear cell renal cell carcinoma. Genes, 13(5), 851. https://doi.org/10.3390/genes13050851. [Google Scholar] [PubMed] [CrossRef]
13. Li, L., Li, L., Sun, Q. (2022). High expression of cuproptosis-related SLC31A1 gene in relation to unfavorable outcome and deregulated immune cell infiltration in breast cancer: An analysis based on public databases. BMC Bioinformatics, 23(1), 350. https://doi.org/10.1186/s12859-022-04894-6. [Google Scholar] [PubMed] [CrossRef]
14. Chen, S., Cao, G., Wu, W., Lu, Y., He, X. et al. (2020). Mining novel cell glycolysis related gene markers that can predict the survival of colon adenocarcinoma patients. Bioscience Reports, 40(8). https://doi.org/10.1042/bsr20201427. [Google Scholar] [PubMed] [CrossRef]
15. Liu, J., Lichtenberg, T., Hoadley, K. A., Poisson, L. M., Lazar, A. J. et al. (2018). An integrated TCGA pan-cancer clinical data resource to drive high-quality survival outcome analytics. Cell, 173(2), 400–416.E11. https://doi.org/10.1016/j.cell.2018.02.052. [Google Scholar] [PubMed] [CrossRef]
16. Zhao, B. S., Roundtree, I. A., He, C. (2017). Post-transcriptional gene regulation by mRNA modifications. Nature Reviews Molecular Cell Biology, 18(1), 31–42. https://doi.org/10.1038/nrm.2016.132. [Google Scholar] [PubMed] [CrossRef]
17. Li, R., Han, D., Shi, J., Han, Y., Tan, P. et al. (2020). Choosing tumor mutational burden wisely for immunotherapy: A hard road to explore. Biochimica et Biophysica Acta Reviews on Cancer, 1874(2), 188420. https://doi.org/10.1016/j.bbcan.2020.188420. [Google Scholar] [PubMed] [CrossRef]
18. Choucair, K., Morand, S., Stanbery, L., Edelman, G., Dworkin, L. et al. (2020). TMB: A promising immune-response biomarker, and potential spearhead in advancing targeted therapy trials. Cancer Gene Therapy, 27(12), 841–853. https://doi.org/10.1038/s41417-020-0174-y. [Google Scholar] [PubMed] [CrossRef]
19. Bonneville, R., Krook, M. A., Kautto, E. A., Miya, J., Wing, M. R. et al. (2017). Landscape of microsatellite instability across 39 cancer types. JCO Precision Oncology, 1, 1–15. https://doi.org/10.1200/po.17.00073. [Google Scholar] [PubMed] [CrossRef]
20. Thorsson, V., Gibbs, D. L., Brown, S. D., Wolf, D., Bortone, D. S. et al. (2018). The immune landscape of cancer. Immunity, 48(4), 812–830.E14. https://doi.org/10.1016/j.immuni.2018.03.023. [Google Scholar] [PubMed] [CrossRef]
21. Malta, T. M., Sokolov, A., Gentles, A. J., Burzykowski, T., Poisson, L. et al. (2018). Machine learning identifies stemness features associated with oncogenic dedifferentiation. Cell, 173(2), 338–354.E15. https://doi.org/10.1016/j.cell.2018.03.034. [Google Scholar] [PubMed] [CrossRef]
22. Mao, Y., Xu, Y., Chang, J., Chang, W., Lv, Y. et al. (2022). The immune phenotypes and different immune escape mechanisms in colorectal cancer. Frontiers in Immunology, 13, 968089. https://doi.org/10.3389/fimmu.2022.968089. [Google Scholar] [PubMed] [CrossRef]
23. Yuan, H., Yan, M., Zhang, G., Liu, W., Deng, C. et al. (2019). CancerSEA: A cancer single-cell state atlas. Nucleic Acids Research, 47(D1), D900–D908. https://doi.org/10.1093/nar/gky939. [Google Scholar] [PubMed] [CrossRef]
24. Tsvetkov, P., Coy, S., Petrova, B., Dreishpoon, M., Verma, A. et al. (2022). Copper induces cell death by targeting lipoylated TCA cycle proteins. Science, 375(6586), 1254–1261. https://doi.org/10.1126/science.abf0529. [Google Scholar] [PubMed] [CrossRef]
25. Li, C., He, C., Xu, Y., Xu, H., Tang, Y. et al. (2019). Alternol eliminates excessive ATP production by disturbing Krebs cycle in prostate cancer. The Prostate, 79(6), 628–639. https://doi.org/10.1002/pros.23767. [Google Scholar] [PubMed] [CrossRef]
26. Fernandez Rodriguez, G., Cesaro, B., Fatica, A. (2022). Multiple roles of m6A RNA modification in translational regulation in cancer. International Journal of Molecular Sciences, 23(16), 8971. https://doi.org/10.3390/ijms23168971. [Google Scholar] [PubMed] [CrossRef]
27. Qu, X., Zhang, Y., Sang, X., Ren, D., Zhao, H. et al. (2022). Methyladenosine modification in RNAs: From regulatory roles to therapeutic implications in cancer. Cancers, 14(13), 3195. https://doi.org/10.3390/cancers14133195. [Google Scholar] [PubMed] [CrossRef]
28. Li, M., Tao, Z., Zhao, Y., Li, L., Zheng, J. et al. (2022). 5-methylcytosine RNA methyltransferases and their potential roles in cancer. Journal of Translational Medicine, 20(1), 214. https://doi.org/10.1186/s12967-022-03427-2. [Google Scholar] [PubMed] [CrossRef]
29. Klutstein, M., Nejman, D., Greenfield, R., Cedar, H. (2016). DNA methylation in cancer and aging. Cancer Research, 76(12), 3446–3450. https://doi.org/10.1158/0008-5472.can-15-3278. [Google Scholar] [PubMed] [CrossRef]
30. Jones, P. A., Baylin, S. B. (2007). The epigenomics of cancer. Cell, 128(4), 683–692. https://doi.org/10.1016/j.cell.2007.01.029. [Google Scholar] [PubMed] [CrossRef]
31. Fumet, J. D., Truntzer, C., Yarchoan, M., Ghiringhelli, F. (2020). Tumour mutational burden as a biomarker for immunotherapy: Current data and emerging concepts. European Journal of Cancer, 131, 40–50. https://doi.org/10.1016/j.ejca.2020.02.038. [Google Scholar] [PubMed] [CrossRef]
32. Dudley, J. C., Lin, M. T., Le, D. T., Eshleman, J. R. (2016). Microsatellite instability as a biomarker for PD-1 blockade. Clinical Cancer Research, 22(4), 813–820. https://doi.org/10.1158/1078-0432.ccr-15-1678. [Google Scholar] [PubMed] [CrossRef]
33. Liu, L., Bai, X., Wang, J., Tang, X. R., Wu, D. H. et al. (2019). Combination of TMB and CNA stratifies prognostic and predictive responses to immunotherapy across metastatic cancer. Clinical Cancer Research, 25(24), 7413–7423. https://doi.org/10.1158/1078-0432.ccr-19-0558. [Google Scholar] [PubMed] [CrossRef]
34. Samstein, R. M., Lee, C. H., Shoushtari, A. N., Hellmann, M. D., Shen, R. et al. (2019). Tumor mutational load predicts survival after immunotherapy across multiple cancer types. Nature Genetics, 51(2), 202–206. https://doi.org/10.1038/s41588-018-0312-8. [Google Scholar] [PubMed] [CrossRef]
35. van Velzen, M. J. M., Derks, S., van Grieken, N. C. T., Haj Mohammad, N., van Laarhoven, H. W. M. (2020). MSI as a predictive factor for treatment outcome of gastroesophageal adenocarcinoma. Cancer Treatment Reviews, 86, 102024. https://doi.org/10.1016/j.ctrv.2020.102024. [Google Scholar] [PubMed] [CrossRef]
36. He, Y., Zhang, L., Zhou, R., Wang, Y., Chen, H. (2022). The role of DNA mismatch repair in immunotherapy of human cancer. International Journal of Biological Sciences, 18(7), 2821–2832. https://doi.org/10.7150/ijbs.71714. [Google Scholar] [PubMed] [CrossRef]
37. Binnewies, M., Roberts, E. W., Kersten, K., Chan, V., Fearon, D. F. et al. (2018). Understanding the tumor immune microenvironment (TIME) for effective therapy. Nature Medicine, 24(5), 541–550. https://doi.org/10.1038/s41591-018-0014-x. [Google Scholar] [PubMed] [CrossRef]
38. Hinshaw, D. C., Shevde, L. A. (2019). The tumor microenvironment innately modulates cancer progression. Cancer Research, 79(18), 4557–4566. https://doi.org/10.1158/0008-5472.can-18-3962. [Google Scholar] [PubMed] [CrossRef]
39. Wu, T., Dai, Y. (2017). Tumor microenvironment and therapeutic response. Cancer Letters, 387, 61–68. https://doi.org/10.1016/j.canlet.2016.01.043. [Google Scholar] [PubMed] [CrossRef]
40. Yoshihara, K., Shahmoradgoli, M., Martínez, E., Vegesna, R., Kim, H. et al. (2013). Inferring tumour purity and stromal and immune cell admixture from expression data. Nature Communications, 4, 2612. https://doi.org/10.1038/ncomms3612. [Google Scholar] [PubMed] [CrossRef]
41. Aran, D., Sirota, M., Butte, A. J. (2015). Systematic pan-cancer analysis of tumour purity. Nature Communications, 6, 8971. https://doi.org/10.1038/ncomms9971. [Google Scholar] [PubMed] [CrossRef]
42. Lei, X., Lei, Y., Li, J. K., Du, W. X., Li, R. G. et al. (2020). Immune cells within the tumor microenvironment: Biological functions and roles in cancer immunotherapy. Cancer Letters, 470, 126–133. https://doi.org/10.1016/j.canlet.2019.11.009. [Google Scholar] [PubMed] [CrossRef]
Cite This Article
 Copyright © 2024 The Author(s). Published by Tech Science Press.
This work is licensed under a Creative Commons Attribution 4.0 International License , which permits unrestricted use, distribution, and reproduction in any medium, provided the original work is properly cited.


 Submit a Paper
 Propose a Special lssue
 View Full Text
 Download PDF
 Downloads
 Citation Tools